peru country assistance evaluation - world...
TRANSCRIPT
Report No. 24898-PE
Peru Country Assistance Evaluation September 25, 2002 Operations Evaluation Department Document of the World Bank

Acronyms
APL Adaptable Program Loan CAS Country Assistance Strategy COFOPRI Commission for Formalization of Informal Property COPRI Commission for Promotion of Private Investment CTE Electricity Tariff Commission DDSR Debt and Debt Service Reduction EFF Extended Fund Facility ESSALUD Health Social Security Institute ESW Economic and Sector Work FCRP Pension Reserves Fund FDI Foreign Direct Investment FONCODES Social Fund for Compensation and Development GDP Gross Domestic Product GOP Government of Peru IADB Inter-American Development Bank IFC International Finance Corporation IMF International Monetary Fund INDECOPI National Institute for the Defense of Free Competition and Intellectual Property Rights ISI Import-substitution Industrialization MIGA Multilateral Investment Guarantee Agency NGO Non-governmental Organization OED Operations Evaluation Department OEG Operations Evaluation Group OEU Operations Evaluation Unit OVE Office of Evaluation and Oversight (IADB) PER Public Expenditure Review PRONAMACHS National Project for the Management of Watershed Basins and Soil Conservation SAL Structural Adjustment Loan SBS Banking Supervisory Agency SUNAD Superintendency of Customs SUNASS Water and Sewerage Sector Regulatory Agency SUNAT Tax Administration Agency UN United Nations
Director-General, Operations Evaluation: Mr. Robert Picciotto Director, Operations Evaluation Department: Mr. Gregory K. Ingram Acting Manager, Country Evaluation & Regional Relations: Mr. René Vandendries Task Manager: Mr. René Vandendries Peer Reviewer: Ms. Laurie Effron External Peer Reviewer: Mr. Peter Klarén

Contents
1. Background ............................................................................................................... 1 2. The Bank’s Products and Services .......................................................................... 4 Introduction ......................................................................................................... 4 Bank Strategy ...................................................................................................... 4 Lending ................................................................................................................ 7 Analytical and Advisory Services ..................................................................... 13 Aid Coordination and Resource Mobilization ................................................... 15 3. The Development Impact of Bank Assistance ...................................................... 16 Growth, Poverty and Institutional Change ........................................................ 16 Agriculture ......................................................................................................... 19 Health and Education ........................................................................................ 20 Private Sector Development .............................................................................. 20 Mining and the Environment ............................................................................. 21 Indigenous People and Gender Issues ............................................................... 22 Sustainability ..................................................................................................... 23 4. Contributors’ Performance ................................................................................... 24 Country Performance ........................................................................................ 24 Bank Performance ............................................................................................. 25 Other Donors ..................................................................................................... 27 Exogenous Factors ............................................................................................ 27 5. Lessons and Recommendations ............................................................................. 28 Tables in Text Table 2.1: World Bank Commitments, FY92-00 (US$ million) ................................... 8 Table 3.1: Basic Indicators ........................................................................................... 16 Figure 2.1: Peru. Debt Outstanding: All Multilaterals, IBRD, and IMF ..................... 15 Annexes Annex 1: Peru At A Glance ........................................................................................... 29 Annex 2: Table 2a: Peru Key Economic and Social Indicators, 1991-2000 .............. 31 Table 2b: Comparative Tax Effort in Latin American Countries (% of GDP) ................................................................................. 32 Table 2c: Public Expenditure on Health and Education for Peru and Comparator Countries ................................................................. 33 Table 2d: Peru Social Indicators and Millennium Development Goals ..... 34 Table 2e: Peru – GDP by Sectors 1991–2000 ............................................ 35 Table 2f: Peru – Terms of Trade and Mineral Prices 1990–2000 ............. 35 Table 2g: Comparative Trends in Social Indicators ................................... 36 Table 2h: Peru – Trends in Social Indicators ............................................. 37 Annex 3: Table 3a: External Assistance to Peru ........................................................ 38

Table 3b: World Bank Lending Program Proposed in FY97 CAS versus Actuals ........................................................................................ 39 Table 3c: Peru Bilateral ODA Commitments by Purpose .......................... 40 Table 3d: World Bank and Inter-American Development Bank Commitments for Peru by Sector ................................................ 41 Annex 4: ESW and CAS List for Peru, 1980-1999 ....................................................... 42 Annex 5: Table 5a: Comparative OED Ratings ......................................................... 43 Table 5b: Comparative Supervision Ratings .............................................. 43 Table 5c: Annual Review of Portfolio Performance, FY 1990–2002 ........ 44 Annex 6: Costs of Bank Programs for Peru and Comparator Countries, FY91-00 ....... 45 Annex 7: Peru: Bank’s Senior Management, CY 1991-2001 ...................................... 46 Appendices Appendix A: Overview of IFC Operations .................................................................... 47 IFC Table 1: Peru - Statement of IFC Held and Disbursed Portfolio as of July 31, 2001 (in US$ millions) ........................................... 48 IFC Table 2: IFC’s Technical Assistance Trust Funds Projects in Peru 49 Appendix B: MIGA Activities in Peru .......................................................................... 50 MIGA Guarantees Issued in Peru ............................................................ 52 Appendix C: Reform Backtracking and Weakening Governance 1996-99 .................. 53 Appendix D: IADB, Office of Evaluation and Oversight, OVE Country Program Evaluation (CPE) Peru: 1990-2000 Executive Summary ...................................................................... 55 Attachments Attachment A: Comments Received from the Government (and OED’s Response) .... 57 Government’s Comments on the Draft CAE ........................................ 58 Government’s Comments on the Draft CAE (translation of Spanish letter) ................................................................................ 62 Attachment B: Additional Government Comments ....................................................... 65 Attachment C: Comments by the Latin America and Caribbean Region (and OED’s Response) .......................................................................... 67 Attachment D: Management Action Record .................................................................. 70 Attachment E: Report from CODE ............................................................................... 71 This paper was prepared by René Vandendries (Task Manager) and Rosa Alonso I Terme (Consultant). The authors visited Peru in May/June 2001 accompanied by Julie Feinsilver (IADB). IADB has prepared a parallel evaluation of its assistance program in Peru. The Executive Summary of that report is attached as Appendix D. A contribution by Richard Berney (consultant) on extractive industries is acknowledged. Contributions by OEG (IFC) and OEU (MIGA) are included as Appendices A and B. Anar Omarova and Gonzalo Salinas provided research assistance. Agnes Santos provided administrative support.


The World Bank
Washington, D.C. 20433 U.S.A.
Office of the Director-General Operations Evaluation
September 25, 2002
MEMORANDUM TO THE EXECUTIVE DIRECTORS AND THE PRESIDENT
SUBJECT: Peru Country Assistance Evaluation
A steady increase in state intervention in the economy, started in the early sixties with the aim of fostering growth and reducing inequality, culminated in hyperinflation, a collapse of social and economic infrastructure, and escalating terrorism. In 1990, the new Fujimori Government pledged to defeat terrorism and to restore the economy to its market-orientation through stabilization, liberalization, and privatization. The economy's response was highly positive: rapid growth through 1997 and a drop in the poverty rate from 55 percent at the height of hyperinflation to 51 percent by 1997. The new economic model retained considerable central control. The tax effort was improved but remained insufficient to meet the country's needs. By the late 90s, reform efforts had flagged and there was much backtracking, especially in fiscal and trade policies, and in the privatization agenda. Governance deteriorated, culminating in the dismissal, in January 1999, of key members of the economic team and their replacement by politically-pliable appointees. A weak judiciary allowed the executive to override financial management decisions. These factors, aggravated by exogenous events, led to economic deterioration and an increase in the poverty rate to 54 percent by 2000, even though extreme poverty, at 15 percent, appears to have remained stable since 1997. By the end of 2000, the President resigned amidst allegations of large scale corruption. Today's Peru is not beset by unmanageable macroeconomic imbalances, as it was in 1990. It has much improved social indicators. But the challenge of achieving sustainable growth with poverty reduction remains. The Bank's assistance during the 90s went through distinct phases. In the early 90s, the Bank played a constructive and important role, based on an accurate and timely diagnosis of the economic situation. While the Bank’s role is small vis-à-vis that of the Government, the Bank did help stabilize the economy, reintegrate Peru in the world financial community, and support a very effective structural reform process. The assistance program was dominated by structural adjustment loans. Subsequently, the main goals of Bank strategy laid out in 1993 and 1994 were poverty alleviation, infrastructure development, macroeconomic sustainability and institution building, and the emphasis turned to investment lending. Institutional weaknesses and low fiscal revenues were identified as major issues and, especially on the institutional front, some progress was made. Bank strategy as contained in the 1997 CAS was again based on a good diagnosis of the situation and, in essence, a continuation of the earlier strategy. Important achievements since 1997 include a concerted and successful effort to improve portfolio performance, through a pro-active policy of closings and cancellations, focusing all loans on poverty alleviation. The Bank also played a catalytic role in broadening consultation on poverty reduction through a Poverty Dialogue, bringing in the Government, other donors, civil society and the private sector, thereby improving the Bank’s relationship with NGOs and the private sector. In addition, a QAG assessment of the quality of the AAA program for Peru since the 1997 CAS found it to have been satisfactory overall, especially because of its focus on poverty issues, but the assessment also noted the AAA’s inadequate responsiveness to the weakening economy.

ii
The Bank’s broad strategy, however, faced a difficult conundrum because government commitment to reform was weakening. Risks had been identified in the CAS, but no downside scenario was proposed. This was a major departure from the past, when policy reversals were a trigger for reductions in lending. The Bank was now faced with a Government that was reluctant to receive the very investment and public sector reform loans which would have furthered the strategy outlined in the CAS. Nevertheless, the Bank continued to provide support. As it turned out, an important judicia l sector reform project eventually had to be cancelled. Actual lending deviated significantly from the proposed strategy, in part, because of the deteriorating economic and political situation. Two loans accounted for 80 percent of all lending, the El Niño Emergency loan and a Second Financial Sector Adjustment loan in June 99. The latter was primarily budget support, having identified the few policy areas which a Government with little commitment to reform was willing to implement, while allowing rapid channeling of funds. The outcome of the second Financial Sector Adjustment loan was rated as moderately satisfactory by OED. However, in a broader context, beyond the narrow confines of individual loans, the Bank’s assistance during 1997-00 lacked relevance, as it did not promote its own strategy of advancing institutional reform, and did not respond appropriately to the weakening economic policy environment. The Bank's impact on Peru's economic development during the first half of the 90s has been substantial, and the outcome of Bank assistance must be judged as satisfactory. One important element of this success was the institutional support to isolated groups of technocrats to expedite the reforms. This process was unlikely to be sustainable, however, unless it was followed by larger public sector reform. The 1995–97 period, when the economy grew rapidly, turned out to have been a missed opportunity for the Bank to promote both public sector and fiscal reform. Subsequently, during 1997–00, a shortage of counterpart funds due to tax exemptions and reductions, costing the equivalent of 2 percent of GDP, slowed down or stopped investment projects. The Bank's assistance program during those years was neither efficacious nor efficient in achieving its development goals. It devoted a large amount of resources to a Government whose policies directly undermined its own ability to lay the ground for sustained growth and poverty reduction. The economy stagnated, the fiscal deficit increased as did the rate of poverty, and private investment declined. The Bank provided budget support without attempting to address the issues of the continuing erosion of an already weak tax base and of other policy reversals, while planned attempts at institutional reform were abandoned: the outcome of the Bank’s assistance during this period must be judged unsatisfactory. Currently, the lack of reform, the low revenue efforts and Government plans to reduce spending by the equivalent of 2.5 percent of GDP between 2000 and 2004, make the achievement of the Bank's development objectives in Peru highly unlikely. The Peruvian Government deserves most of the credit for the successful reform program of the early 90s and most of the blame for the stagnation in reform in the mid-90s and the policy reversals of the late 90s. The Bank's performance was commendable during the first half of the 90s. Starting in 1997, the Government was no longer committed to the Bank's assistance program. The Bank was misguided in yielding to pressure to redirect loans from investment projects to fast-disbursing structural adjustment lending, in the midst of allegations and then evidence of corruption, and in contradiction to its own strategy at a time when progress in macroeconomic and structural fronts was being reversed. The draft CAE was sent to the Government for comments. Their comments are attached as Attachments A and B. The evaluation was discussed by the CODE Subcommittee and a report of that discussion is included as Attachment E.

1
1. Background
1.1 Peru is a lower middle income country with a per capita income of $2,100 in 2000 (Atlas method) and a population of about 25 million. Roughly half the population lives below the poverty line. The country is rich in mineral resources: mining makes up more than 5 percent of GDP and half of export earnings, and is an important source of fiscal revenue, but directly employs less than 1 percent of the labor force.1 In contrast, agriculture, some of it modern, much of it subsistence, generates 7–9 percent of GDP and employs 25 percent of the labor force. The largest sector is the services sector (other than trade) where underemployment is common.
1.2 From independence in 1821 to the mid-1960s, Peruvian economic policy was, with few exceptions, characterized by limited government intervention and a relatively unrestricted trade and exchange rate regime. Exporters held great economic and political power. This regime generated good growth rates, but also high income volatility and a stubbornly high level of income inequality and poverty.
1.3 In response to economic volatility, inequality and poverty, a new development strategy was ushered in during the 1960s. Import-substitution industrialization (ISI) policies in Peru started under the Belaunde administration (1963-68), but did not get seriously under way until the Velasco government of the late 1960s. The public sector was to become the major engine of development. State intervention in the economy included high levels of trade protection, price, exchange rate, wage and interest rate controls, subsidies to import-competing industries, and massive nationalizations.
1.4 Export performance under ISI was dismal. Export growth, which had averaged 7.6 percent in the 1945–72 period—three times the regional average—, had dipped to 1.7 percent a year between 1972 and 1981—one-fifth the regional average. GDP growth decelerated while resource misallocation and macroeconomic imbalances increased and foreign debt piled up. ISI policies also failed to re-distribute income toward the poor. Despite average GDP growth of 4.1 percent between 1970 and 1981, poverty remained constant at around 50 percent of the population.
1.5 Frustration with the poor results of ISI led to even more state interference in the economy and mounting macroeconomic mismanagement. Eventually, economic growth decelerated further. In 1985, the incoming government decided that the public sector’s foreign debt burden had become unmanageable and stopped servicing it. Private foreign capital inflows came to a sudden halt and Peru was placed in non-accrual status by the IMF in 1986 and by the Bank in early 1989. By 1987-89, the overall deficit of the non-financial public sector was 8.3 percent of GDP and domestic financing of the deficit averaged over 5 percent of GDP. Hyperinflation ensued, as people substituted away from the domestic currency, reaching 7,481 percent in 1990. Real GDP declined by 30 percent
1 An example of the capital-intensive nature of large scale mining is the recently opened Antamina mine, with an estimated investment of $2.1 billion and projected yearly export earnings of $950 million, but expected direct employment of less than 2,000 (skilled and unskilled) workers.

2
between 1987 and 1990. By 1990, GDP per capita had fallen below its level in 1960, the education, health and transport infrastructure had all but collapsed, macroeconomic imbalances were huge and political violence and terrorism escalated.
1.6 In 1990, the newly-elected government of Alberto Fujimori brought radical change and gradually restored the economy to its traditional market-orientation and away from state control. Agreement was reached with the IMF and other donors, including the Bank, on a stabilization and structural reform program. Public finances were brought under control. Prices, wages, interest and the exchange rates, and capital flows were liberalized, state intervention in the allocation of credit was eliminated and banking laws, regulation and supervision were much improved. The foreign trade sector and labor market regulations were thoroughly liberalized, and a rapid and far-reaching privatization program was implemented. A comprehensive tax reform was implemented by the autonomous revenue agency, SUNAT, leading to a significant recovery in the tax-to-GDP ratio, while expenditure on subsidies to state-owned enterprises and import-competing firms was slashed. These fiscal reforms allowed for a doubling in social expenditure as a percent of GDP over the 1990s. Above all, the defeat of terrorism was a crucial factor in restoring the environment for growth, especially for such activities as mining, agriculture and transport, while allowing the return of teachers and health workers to areas previously besieged by violence.
1.7 The economy responded well to the new policy environment. Inflation was rapidly brought under control. Between 1992 and 1997, annual GDP growth averaged 5.8 percent. The overall fiscal balance went from a deficit equivalent to 3 percent of GDP in 1992 to a surplus of 0.5 percent of GDP in 1997. Exports rebounded and became more diversified, as export growth was particularly strong in non-traditional sectors. The poverty rate fell from 55 percent at the height of hyperinflation to about 50 percent by 1997 while extreme poverty declined from around one-quarter of the population to 15 percent aided by strong employment growth in sectors where the poor were employed—construction, trade and services—as well as increased government expenditure in social services.2
1.8 However, the new economic model did suffer from important shortcomings. Although tax revenues increased, they remained relatively low (annex table 2.b), keeping levels of social expenditure well below the regional average as well as insufficient for the country’s needs. By the end of the 1990s, real per capita social expenditure was still below the level it had reached in the 1970s. Insufficiency of funds, together with the strict cash management system, also meant that counterpart funds for foreign-financed projects were scarce. Moreover, design and implementation of economic policies remained concentrated in a few agencies that bypassed line ministries. Needed public sector reform was held back. The authoritarian nature of the new Government became apparent as early as in 1992, when the President suspended the Constitution and dismissed Congress. The latter was reinstated and a new Constitution adopted in 1993. Thereafter, the Government ruled predominantly by decree.
2 Jesko Hentschel, Peru Poverty 1994-97. Washington: World Bank.

3
1.9 Starting in 1997, reform efforts slowed down significantly. Privatization targets were not reached and the fiscal situation started to deteriorate, as tax exemptions proliferated, tax rates were reduced, and government consumption increased. Trade protection increased, as an additional 5 percent tariff surcharge was introduced for a large number of agricultural products. The turning point, however, came in early 1999, when President Fujimori decided that he would, after all, run for re-election in the upcoming 2000 presidential elections. Victor Joy Way—now being prosecuted for corruption—was named prime minister-cum-finance minister. The team that had been in charge of the economic reforms at the Ministry of Finance in the early 1990s resigned and technocratic heads of key government institutions—like the tax agency SUNAT and the social fund FONCODES—were replaced with politically-pliable appointees. The agricultural surtax was raised to 10 percent and its coverage was expanded. Tax amnesties and exemptions continued to proliferate, large increases in public sector wages and pension were granted and privatizations came to a halt. The fiscal situation deteriorated markedly and, in 2000, for the first time in a decade, the fiscal performance criteria agreed with the IMF were not met. Banking difficulties set off by the Asia-Russia-Brazil crises combined with fragilities in Peru’s banking sector, were handled in some instances in a highly politicized manner, using government deposits to support financially weak but politically powerful banks and interfering with the independence of the Banking Supervisory Agency (SBS).3 Economic growth declined partly for exogenous reasons and partly because of policy deterioration.
1.10 Leading up to the 2000 elections, political instability and popular discontent intensified and eventually exploded when Fujimori was reelected amidst allegations of electoral fraud and large-scale corruption. Instability continued for a year until June 2001 when Alejandro Toledo was elected as Peru’s new president. By 2000, the poverty rate was estimated to have risen again to 54 percent.
1.11 Much was achieved between 1990 and 1997 and some of the achievements have proven durable. Resource allocation is now largely in line with comparative advantage. GDP growth is no longer beset by increasing indebtedness or large macroeconomic imbalances, and social indicators continue to improve. Health indicators have improved substantially. Extreme poverty, which stood at 15 percent in 1997, appears to have remained stable despite the decline in economic growth. In terms of progress towards the Millennium Development Goals (table 2d) the record is mixed. Extreme poverty has been reduced to 60 percent of its 1990 level, but this is partly because the 1990 base year was a year of extreme economic crisis. Net primary enrollment has already surpassed its target and the trend in the under 5 mortality rate suggest that this goal may also be
3 The Region points out that since about 1990, Peru has allowed public sector enterprises to put deposits in private banks since the government felt they should be free to choose and not be limited by Banco de la Nacion. In 1999 a "reglamento" was issued to increase the transparency of the process and require a bidding/auctioning system for banks to obtain public sector deposits. Later in March 2001, the regulation was further strengthened to make the prudential limits stricter given the weakening condition of banks. The Superintendency of Banks helped monitor these prudential indicators to advise the Ministry of Economy and Finance on which banks would qualify for what limits of public deposits. While some implementation issues on this decree may have occurred, the public deposits system (in the private banks) has existed since about 1990 and a 1999 regulation served to increase the transparency of it through a bidding and selection/qualification process.

4
reached. On the other hand, current trends suggest that gender equality targets will not be reached. Also, the level of youth unemployment is very high and little progress was made in the past in reducing it even during good growth years.
1.12 The momentum of reform flagged over the past few years. Poverty reduction programs, as well as social expenditure more generally, are limited because of Peru’s lack of public resources, a reflection of the country’s low and declining tax effort. The undermining of the rule of law, particularly the independence of the judiciary, increased the population’s vulnerability and weakened investment incentives. The erosion of independence of state institutions (such as SUNAT, SBS, FONCODES, COFOPRI, and regulatory agencies) for political advantage undermined their ability to carry out their tasks. The highly-centralized policy-making process in the president’s office led to arbitrary and unpredictable decision-making and weakened ownership of government policies (see appendix C).
1.13 The greatest economic challenge now facing Peru in pursuit of growth and poverty reduction is to preserve the market-based economy and the macroeconomic stability restored at the beginning of the 1990s while increasing the tax effort and promoting social and institutional development.
2. The Bank’s Products and Services
Introduction
2.1 The World Bank has been one of several important sources of external capital for Peru over the past decade. During 1991–00 net disbursements from the Bank totaled more than $1.5 billion, accounting for about 9 percent of all net external financial flows to Peru. In comparison, the IADB accounted for about 11 percent of net flows, while the contribution of the major bilaterals (about one-third of it official and two-thirds of it private capital) was 31 percent for the U.S., 17 percent for Spain, 10 percent for Italy and 12 percent for Japan4 (annex table 3a).
Bank Strategy
2.2 Once Peru resumed debt service payments to the Bank in late 1990, the Bank’s strategy was to support the new government’s macro-economic stabilization and structural reform program and to participate in the international effort to reintegrate Peru in the world financial community. The Bank sought to achieve these goals through intensive policy dialogue, structural adjustment lending, and the formulation of a financing plan to assist Peru in clearing its arrears to multilateral institutions. The strategy was approved by the Board in July 1991. Since the Bank could not lend to Peru until all its arrears to the institution had been cleared, the Bank designed a new approach for strong-performing countries with protracted arrears. This approach consisted in
4 IMF tranche drawings are not included in these figures.

5
establishing a “performance period” during which loans could be presented to the Board, but disbursements could not be released until all arrears had been cleared, marking the end of the performance period.
2.3 The Bank’s strategy for Peru in the early 1990s was appropriate. It was based on an accurate diagnosis of the Peruvian situation, focused on the most relevant and urgent stabilization and development goals, and identified the appropriate lending instruments and policies to achieve these goals. The strategy during the performance period was innovative. It maximized Bank support to and influence on a Peruvian government committed to reform while preserving the institution’s credit ratings and exhibiting well-advised caution in resuming lending to a country whose economic policy and credit performance during the previous five years had been highly unsatisfactory.
2.4 A revised Bank strategy was presented to the Board (together with a Privatization Adjustment loan) in April 1993. Its main goals were poverty alleviation, infrastructure development, macroeconomic sustainability, and institution-building, the latter meant to underpin all other strategic objectives. These objectives were to be pursued through a new emphasis of Bank activity in Peru on investment lending. This shift in strategy was confirmed by the 1994 CAS.
2.5 The 1994 CAS noted that despite the significant progress achieved in stabilizing and restructuring the Peruvian economy, the country’s welfare indicators remained poor, income distribution highly unequal, and social problems overwhelming, particularly for the indigenous community. Two crucial obstacles to further growth and poverty alleviation in Peru were identified at that time—institutional weaknesses and low fiscal revenues. On the institutional front, the CAS identified various shortcomings of the Peruvian public sector, including a highly centralized decision-making structure, weak line ministries, fragmentation and poor coordination among various ministries and agencies, and a weak judicial system. The 1994 CAS—using the input from a recent public expenditure review—also identified insufficient revenue to cover infrastructure and social sector needs as a crucial bottleneck and stressed the need to increase the tax-to-GDP ratio as well as improve expenditure allocation and efficiency. Finally, the CAS pointed out the dangers of Peru’s continued reliance on short-term capital inflows.
2.6 The main policies identified in the CAS included the need to: broaden tax bases, eliminate tax exemptions, improve tax administration to increase tax collections; increase funding for infrastructure and the social sectors; improve efficiency of such funding; and conclude a debt and debt service reduction (DDSR) agreement with commercial bank creditors. The Bank was to support these policies mainly through investment lending, one more adjustment loan—in the electricity privatization area—, and a possible DDSR loan. Institutional development objectives would be sought in all investment loans and continued macroeconomic stability would be a condition of the Electricity Privatization Adjustment loan. The CAS also established appropriate triggers for a lower level of lending if there was a deterioration in macroeconomic policy, particularly a loss of fiscal discipline, and/or important reversals in structural reforms.
2.7 The 1994 CAS did an excellent job at identifying Peru’s most pressing development needs and the policies needed to achieve them. A possible shortcoming of

6
the CAS was that it did not put forth a holistic strategy for public sector reform. Arguably, the years between 1995 and 1997 provided a good window of opportunity for attempting much-needed institutional reform. Economic stabilization had been achieved, first-generation structural reforms were largely in place, and the Fujimori government was returning to power for a second five-year term. A second shortcoming of the strategy was the failure to identify an appropriate Bank instrument to achieve tax reform. This proved to be a major error, as Peru’s tax-to-GDP ratio stagnated and later declined, jeopardizing the sustainability of achievements thus far.
2.8 The 1997 CAS set the reduction of poverty and extreme poverty as the main objective of Bank strategy in Peru, recognizing that it is a long-term task that depends on sustained increases in investment in human and physical capital. The CAS noted that the structural reforms of the previous years had been significant and that growth had been high and poverty had been reduced. The CAS acknowledged, however, that progress on institutional reform had been slow, resulting in delays in the implementation of the institutional components of the loans of the Bank and other donors.
2.9 In particular, improvement in the delivery of quality public services to the population and in establishing a better environment for the private sector would require greater efficiency and reliability of public administration and more resources. Thus, as in the 1994 CAS, institutional reform and increased availability of public resources were identified as crucial steps to reducing poverty. The 1997 CAS noted that measures had been enacted eroding the tax base and the neutrality of the tax system and that long-term institution building was not progressing well, parallel institutions were proliferating, and Central Government control remained excessive. The CAS pointed out the need to tackle the modernization of the public sector through a three-pillared strategy based on reform of the state, decentralization, and judicial reform.
2.10 The main instruments to be used in the pursuit of the Bank’s strategy were ESW and investment lending. ESW would be carried out in the areas of education, health, and poverty to provide an analytical guide to the Bank’s lending program in the social sectors, which would include institutional-development components. A proposed Judicial Reform project was meant to address one of the weakest areas of public sector activity while a Second Pension Reform Loan would be considered if the depth of sector reform warranted it. At the same time, at the Government’s request, the proposed lending program was halved from previous years to $200 million per annum.
2.11 The 1997 CAS identified the crucial obstacles to further progress as institutional reform and resource availability. The Bank faced, however, a difficult conundrum, as there were indications that the Peruvian government’s commitment to reform was weakening, making the holistic modernization of the state and the needed fiscal effort unlikely. Given these constraints, the decision to attempt an incremental approach to public sector modernization by building in institutional reform components into individual loans was reasonable. The proposed attempt at wholesale reform of the judicial sector, on the other hand, seemed overly ambitious and out of line with the more realistic overall Bank strategy.

7
2.12 The 1997 CAS identified three main risks to the proposed country assistance program—continued institutional weaknesses, declining popular support for the reform program, and increased political pressures on the government as the 1998 municipal and 2000 presidential elections approached, possibly combining to weaken the government’s macroeconomic management and leading to backtracking on structural reforms. The risk analysis was not complemented, however, with the elaboration of an alternative Bank assistance strategy. On the contrary, the document asserted that calibrating the Bank’s lending program as a function of country performance was not appropriate for the present CAS. The conditions in the 1994 CAS and in all adjustment lending to Peru of maintaining macroeconomic stability and non-reversibility of structural reforms were not included in the 1997 CAS. The absence of triggers to reduce lending and of an alternative strategy reduced the leverage and the margin of maneuver the Bank would have in its negotiations with the Peruvian government once the downside risks started to materialize.5
2.13 In May 2001, a CAS Progress Report was approved. It aimed to assist the GOP in the political transition, particularly in restoring economic growth, reversing the recent deterioration in poverty indicators, and supporting institutional development. The instruments to achieve these goals were a Social Sector Programmatic Loan and a Second Rural Roads project. The Bank also fostered the inclusion of civil society in an ongoing dialogue to provide input for the next government’s agenda through such non-lending activities as contributing to organizing and financing the elaboration by Peruvian economists of a series of economic policy papers and a conference on poor people’s empowerment for inclusive development. It is questionable whether the CAS Progress Report should have been presented at that time since neither the Bank nor a government with barely two months of life should develop an assistance strategy on behalf of a democratically-elected incoming government.6 A new CAS is now in preparation.
Lending
2.14 Gross commitments from the Bank over FY92–00 were $3.4 billion, close to two-thirds of it in the form of adjustment lending. Apart from adjustment lending, which also included loans for finance, mining and energy, the Bank has been active in a variety of sectors including transport, agriculture, education, health, urban development and social protection. Commitments averaged $575 million per year during FY92–94, $370 million during FY95–97, and $200 million per year during FY98–00 (table 2.1).
5 The Regional Comments in Attachment C include observations on this issue. 6 The Region argues that, as the transition government had taken office and there was the need to protect social programs during the economic downturn and continue investments such as the rural roads project II, a totally poverty focused project, we needed a CAS Progress Report to bridge the gap until the new democratically elected government would take office. Both loans do not relate to one government platform but to issues/actions that came up from wide consultations with civil society and members of all the main political parties in Peru, and were reconfirmed by the Toledo administration when elected.

8
Table 2.1: World Bank Commitments, FY92-00 (US$ million) Sector FY92-94 FY95 FY96 FY97 FY98 FY99 FY00 Total
Power - 150 - - - - - 150 Transport a/ 150 - 90 - 150 - - 390 Mining 250 - - - - - - 250 Agriculture - - - 136 - - 9.6 145.6 Education - 146.4 - - - - - 146.4 Population, Health & Nutrition
34 - - - - - 80 114
Water & Sanitation - 150 - - - - - 150 Social Protection 100 - - 150 - - 5 255 Finance & Trade 1,150 - - 283 - 300 - 1,733 Other b/ 41.8 - - - 22.5 38 - 102.3
Total 1,725.8 446.4 90 569 172.5 338 94.6 3,436.3 of which: adjustment 1,400 150 - 283 - 300 - 2,133
a/ Includes El Niño Emergency loan in FY98. b/ Technical Assistance and Public Sector Management.
2.15 To date, OED has rated about 60 percent of the Bank’s net commitments to Peru during the 90s; all but one of the adjustment loans and two social protection loans. All were rated as having had satisfactory or highly satisfactory outcomes, with substantial institutional development impact, and, except for one operation, likely sustainability.
2.16 Through 1997, the Bank’s lending program was fully consistent with the objectives outlined in the strategy documents. Over time, the program gradually shifted from adjustment to investment lending, with some loans incorporating significant institutional development components. By 1997, however, the Government’s increasing reluctance to implement deep institutional reform largely derailed the Bank’s strategic objectives, and the FY98–00 lending program deviated significantly from the 1997 CAS proposals. Of $540 million in planned investment lending, only about $150 million materialized (of which $22.5 million was eventually cancelled and $50 million approved with one year delay). Instead, 80 percent of actual lending was made up by two loans: a $150 million El Niño emergency loan and a $300 million adjustment loan (annex table 3b).7
2.17 The first phase of the Bank’s involvement with Peru in the early 1990s was dominated by adjustment lending and in line with the Bank’s strategy. The design of the four adjustment loans in FY92–93 (financial sector, trade policy, SAL, privatization) was excellent, applying the latest lessons from experience, both technical and political: in particular, periods immediately following a deep and protracted economic crisis provide a unique window of opportunity to implement structural reforms.
2.18 By 1994, the Bank focused on supporting investments, particularly in the social sectors and in the rehabilitation of basic infrastructure. Projects were approved for Transport Rehabilitation, Basic Health and Nutrition and to support Peru’s social development fund (FONCODES). The lending program was again well-linked both to the
7 The Regional Comments in Attachment C include observations on this issue

9
country’s most pressing needs and to the Bank’s assistance strategy for the country. In particular, projects were related to the strategic goals of re-building the country’s infrastructure and increasing social expenditure directly benefiting the poor. The Transport Rehabilitation project (FY94) included institutional reforms crucial to good sector management—the development of an organizational structure to adequately plan and manage the national road network and the establishment of appropriate funding mechanisms for the maintenance and improvement of the road system. The FONCODES I loan appropriately focused Bank support on an ongoing and successful program in which government ownership was strong.
2.19 The Basic Health and Nutrition Loan (FY94) appropriately identified the need to improve basic health care, particularly in rural areas, and focused on financing the purchase of medical equipment and supplies, and providing training to health personnel. Unfortunately, the project did not address sectoral reform. 8 The initial loan requirement of a gradual increase in the percent of project costs to be financed by the Peruvian government to foster financial sustainability at the project’s conclusion was revised, jeopardizing the achievement of a main goal of the loan.
2.20 The Electricity Privatization Adjustment Loan (FY95) suffered from a design flaw that would eventually combine with weakening political will on the part of the government to limit its achievements. The loan appropriately identified privatization of government holdings in the sector and concomitant sector regulation by an autonomous agency to ensure adequate pricing and competition as crucial to the increase in capacity and reliability in electrical generation and distribution. However, the loan was designed so that privatization of the largest government-owned generation plant was a condition of third tranche release only. In the event, this condition was not met, and the third tranche was cancelled. In addition, electricity prices should have been increased well before privatization so that higher prices would not be associated in the public’s mind with private-sector energy provision.
2.21 Bank lending in 1995–97 followed the strategy proposed in the CAS fairly closely. Loans approved during those years included Rural Roads Rehabilitation (FY96), Irrigation Rehabilitation (FY97), Lima Water Rehabilitation (FY95), and Primary Education Quality (FY95), as well as a Debt and Debt Service Reduction Operation (DDSR FY97). In addition to the CAS proposals, a Sierra Natural Resources Development project to assist poor farmers, a follow-up loan to FONCODES and an adjustment loan for Pension Reform were approved, all in FY97. Some projects proposed in the CAS did not materialize, especially some with important institution-building objectives, such as loans in the municipal finance and management, primary health, mining, environment, and land and water management areas.
8 The Region notes that it would have been unrealistic and untimely for this project to focus on sectoral reforms. This project was designed in 1992/1993 when travel around the country was restricted because the Shining Path was still active. At that time, the highest priority was to reconstruct and provide basic health services in some areas of the country. During its implementation, however, the project developed an integrated attention model that was validated in the Project areas and adopted by MOH. The project also adapted some health facilities to local cultural conditions, thus de facto contributing to continuing reforms in the sector. The project also contributed to the preparation of the subsequent Health Sector Reform APL.

10
2.22 The project loans that were approved in 1995–97 were overall well-designed and incorporated lessons from experience. Some of them, particularly the rural roads, the water rehabilitation and management, and the irrigation sector projects included significant institutional development components that were correctly identified as essential to sustainability. The primary education quality project, like the basic health and nutrition project, focused on reconstructing service delivery only, rather than institutional or sectoral reform. Hence, the improvement provided in primary educational quality by Bank financing was unlikely to be sustainable.9
2.23 The DDSR and companion Pension Reform Adjustment Loan completed the Bank strategy initiated at the beginning of the 1990s of assisting Peru in reinserting itself in the international financial community. Reaching an agreement with commercial creditors on a DDSR operation was instrumental in the process. Tying disbursement of these loans to the depositing of $1 billion from privatization receipts in a fund (FCRP) at the Peruvian Central Bank to back public pension system liabilities was a good decision. The structural reforms contemplated in the Pension Reform Loan correctly tackled the main weaknesses in the Peruvian public and private pension systems. Still, there was a fundamental contradiction between the short-term financing needs of the Peruvian government and the more long-term goal of pension system reform. As a consequence, the Pension Reform Loan left the conditionality on structural reforms as “follow-up measures” to be implemented after tranche release; the measures were not implemented.
2.24 As mentioned earlier (para 2.16), the Bank’s lending program in FY98–00 did not follow the 1997 CAS. While the CAS had outlined a strategy focused on investment lending, the lending assistance was dominated by the El Niño Emergency Loan and a quick-disbursing Financial Sector Reform Loan. Several investment loans with important institution-building and/or environmental components did not materialize (Urban Transport, Water Resource Management TA, Urban Rehabilitation, Rural Water). In addition to the two emergency operations, loans were approved for Judicial Reform, Urban Property Rights, Health Sector Reform, and Agricultural Extension and Research, as proposed in the CAS.
2.25 The change in assistance strategy responded to the urgent need of the Peruvian government for budget and balance-of-payments support resulting from a combination of factors, some under the government’s control and others exogenous. Tax reductions and exemptions, the public sector wages and pension increase in 2000, other expenditure increases, and the slowdown in privatization combined with the effect of exogenous climatic and financial shocks to jeopardize fiscal stability in Peru for the first time since the coming to power of the Fujimori government. The Bank should have held closer to the strategy outlined in the CAS and pressed the Peruvian government to move ahead with structural reforms and social investment. Failing that, it should have stood firm against the rolling back of already-implemented reforms and the steady erosion of fiscal
9 The Region argues that both the Education Quality and Basic Health Projects have sustainable contributions to the sectors; e.g., curriculum improvement and the integrated health care model, among others. These projects also prepared the way for subsequent institutional reforms which are being assisted by follow-up Bank operations.

11
stability.10 Conversations with Peruvian technocrats revealed a strongly-held belief that a more firm approach of the Bank and other donors at that time would have had a significant chance of holding back the reversal in policy reform. Even if preventing policy roll-back had not been possible, shifting to adjustment lending in a context of generalized backtracking on the structural and macroeconomic fronts did not contribute to the achievement of the Bank’s goals in Peru. Rather, it gave the GOP the signal that it would receive Bank support regardless of the quality of its economic policies.11
2.26 The Urban Property Rights project (FY98) was most in line with the 1997 CAS. Its goal of creating a system for assuring formal and sustainable property rights for a predominantly poor sector of the Peruvian population fit neatly with fostering poverty reduction through market-based growth and public sector measures directly benefiting the poor. The loan was well-designed and built on an existing program in which the Peruvian government had already shown leadership and commitment.
2.27 The Judicial Reform Loan (FY98), on the other hand, was an overly-ambitious project given the constraints presented by the Peruvian political situation of the mid-to-late 1990s. By 1997, the deterioration in economic policy-making and political interference, including in the judiciary, were clear. In that context, the strategy of attempting to further institutional development gradually through focused institution-building in specific projects and sectors seemed adequate, while attempting to tackle reform of the entire judicial sector appeared unrealistic. The confidence that institutional re-design could shelter the judiciary from political meddling by the government was overly optimistic. The Bank misread Government commitment in this case. As a result of serious government interference with the independence of the judiciary, the Judicial Reform loan was dropped in September 1998, at the request of the Peruvian government. While the Bank was later praised for canceling the project, including by the NGO Lawyers Committee for Human Rights, the same NGO argued that the loan should not have been made in the first place because political interference was blatant: as much as seven months before loan approval, three judges of the Constitutional Tribunal, who had suggested that Fujimori could not run for a third time, were dismissed by Congress.
2.28 The El Niño Emergency Assistance Project was meant to support ongoing preventive infrastructure rehabilitation works to mitigate the impact of the upcoming El Niño weather phenomenon and to assist in the rehabilitation of damaged infrastructure after the event. It was well-designed.
2.29 The Financial Sector Reform Loan (FY99) had not been contemplated in the 1997 CAS. The operation responded to fiscal and balance of payments difficulties, and its stated goal was to further structural reforms in the financial and pension systems. The loan did contribute to the resolution of the banking difficulties, including the eventual closing of insolvent banks, and to the strengthening of the regulatory framework of the banking system. The loan also had some merit as a budget and balance-of-payments support operation. It identified the few policy areas which a government with little will to reform and beset by a crisis situation was already addressing or was willing to address
10 The Regional Comments in Attachment C include observations on this issue. 11 The Regional Comments in Attachment C include observations on this issue.

12
while allowing for the rapid channeling of emergency funds to the Peruvian government. The relevance of the loan as an instrument to avoid a systemic banking crisis was fairly low. Earlier, the country had successfully weathered the Mexican crisis precisely because of the relative strength of its banking system, a large proportion of which is foreign-owned. Peru’s high level of international reserves provided additional insurance. As it turned out, five months after the Russia crisis liquidity was ample. The loan did not address fundamental problems in the sector, which had been correctly identified in an ongoing Financial Sector Assessment, and which included the lack of transparency in government operations—particularly regarding the distribution of government deposits in the financial system—carried out through the Banco de la Nacion, and the lack of immunity against civil suits of the staff of the banking system’s supervisory agency (SBS), which reduced its effective independence from government pressures.12
2.30 In addition, the pension system component of the loan did not tackle the main problems of the sector, as correctly identified in the 1997 Pension Sector Reform Loan. It did not require the government to issue budgetary rules consistent with the accounting of the accrued costs of the contingent pension liabilities of the public pension system and did not index public system pensions to inflation—to break the implicit indexation to public sector salaries. On the private pension system, it did not address the issue of weak incentives to join the private pension system, 13 and only allowed an expansion from 1 to 5 percent of the limit of the portfolio that private pension systems are allowed to invest abroad, keeping the savings of the Peruvian working class captive to a slim and highly-volatile domestic financial market.14
2.31 The Health Reform loan (FY00) is an APL in support of a 10 year health reform program, by the end of which it is envisioned that the Peruvian population will have universal access to health services. The first phase will focus on developing a system of health insurance for poor mothers and children as well as assistance for institutional improvements. Because the issues in the sector are complex, the APL instrument was chosen to allow flexibility in designing strategy over time.
2.32 An Agricultural Extension and Research Loan was approved in FY00. Agriculture is the sector of the Peruvian economy where more reforms are pending. Protection levels increased in the late 1990s and the coverage of distortions broadened. Strengthening agricultural research and extension is one of the measures proposed in the agriculture ESW, although it is less relevant than the other needed reforms. Pushing ahead with a demand-driven but publicly-financed strategy for agricultural research and extension before liberalizing the sector—in particular lowering tariffs and surtaxes and removing
12 The Regional Comments in Attachment C include observations on this issue. 13 According to IMF projections, the replacement rates for the average worker in the public pension system are more than twice as high as in the private pension system. IMF, Recent Economic Developments, 2001. 14 The Region argues that the FSAL implemented a host of follow up measures to ensure sustainability in the 1997 PRAL loan’s reforms and 90 percent of the reforms in the pension component of the FSAL (as reflected in the conditionality) followed up on problems identified after the 1997 PRAL loan. The reform implemented under these loans provided a good foundation and move forward the reform process itself, but left some remaining key structural issues not fully addressed, such as the rationalization of the administrative cost structure and investment regime of AFPs. These are currently being addressed through an on-going FY03 AAA jointly being prepared with the government.

13
subsidies from water users in the irrigated coastal areas—could lead to a use of government resources for agricultural research in areas of comparative disadvantage where interest groups are strong.
2.33 The Indigenous and Afro-Peruvian People’s Development Learning and Innovation Loan was also approved in FY00. Although it had not been contemplated in the 1997 CAS, it fit well with the main goal of the strategy—reducing poverty and extreme poverty. The loan tackles a highly-relevant issue—the poor economic and social situation of indigenous and Afro-Peruvian groups.
2.34 In the context of a FY01 CAS Progress Report, a Programmatic Social Reform Loan was approved, with the stated objective of supporting the medium-term social reform program of the GOP. More accurately, however, the loan document also states: “The first loan of this program would emphasize the safeguarding of critical social expenditures especially beneficial to the poor during a difficult fiscal adjustment and political transition period.” In essence, the loan was budget support. This raises important questions about the appropriateness of the lending instrument. Transitional support to an outgoing care-taker Government runs counter to the intended nature of programmatic lending, which is meant to take place within an integrated medium term framework, where political support can be reasonably assessed. Also, the loan did not address the fundamental issue of the inadequacy of domestic budgetary funds for social expenditure. Until this issue is tackled, Bank funding for the protection of some basic social programs can only provide temporary relief to a long-term problem. 15
Analytical and Advisory Services
2.35 Bank analytical and advisory services were of high quality and addressed the areas most relevant to the assistance programs. A list is in annex table 4. The continued analytical work carried out by the Bank during the late 1980s despite the absence of lending was instrumental in building a data and knowledge base that could be quickly tapped into in 1990 during the “performance period” of non-lending. Policy notes elaborated in 1990–91 built on this already-existing data base and provided timely guidance on the most urgent stabilization and structural reform measures that needed to be addressed by the newly-elected government.
2.36 Once first-generation reforms had been completed in the first half of the 1990s, Bank strategy and ESW appropriately turned to second-generation reforms, particularly to sectoral reforms and their fiscal support base. In 1994, a public expenditure review was carried out simultaneously with the 1994 CAS that addressed the two principal reforms ahead—public sector reform and tax reform. A poverty assessment, a review of primary
15 The Region argues that the Programmatic Social Reform Loan does not relate to one government platform but to issues/actions that came up from wide consultations with civil society and members of all the main political parties in Peru. In fact, the Toledo Government reconfirmed these reform areas and in some respect has now gone beyond what was sought in the first operation. Also, the inadequacy of budgetary funds for social expenditures, while an issue, cannot be isolated from the inefficient use of existing funds. The PSRL continues to tackle the inefficiency issue and the second loan has now included budget “floor” benchmarks for selected priority social programs.

14
health care, and a review of the educational sector provided excellent analysis of the main issues to be addressed in the social sectors. Two analytical products that would have been highly relevant in the mid-1990s, as well as now, are an assessment of the health sector as a whole and an estimate of the fiscal cost of the Peruvian government’s development strategy. Health sector reform is a technically complex and politically-sensitive area where analytical support could be instrumental in supporting a government committed to sector reform. Given the absence of a strategic sectoral view in the FY00 Health Sector Reform loan, the elaboration of additional ESW in the sector is most pressing, following up on earlier ESW by the IADB.16
2.37 Building on the 1994 CAS and PER, the Bank could have provided an estimate of the resources needed to reach the goals outlined by the Peruvian government and the Bank in the infrastructure, health, education, and poverty-alleviation sectors. A missing ingredient throughout the 1990s in Peru was an interaction between macro-economic planning and sectoral needs. Macro-economic planning was carried out taking existing resource availability as a given and no calculation was made of what increase in the tax-to-GDP ratio was needed to meet sectoral goals. As a result, resources were and remain a crucial constraint to the achievement of the Bank’s and the government’s development strategy. The expenditure needs for the medium term estimated by ministries are roughly twice as high as what the macro-economic framework envisages based on a further reduction of the tax-to-GDP ratio in the next five years.
2.38 Interviews with policymakers in Peru revealed that ESW was one of the most valued of the Bank’s products. They thought relevance and quality of ESW produced during the 1990s was high and there was strong demand for it. The combination of best-practice knowledge with the adaptation to country circumstances, according to interviewees, made ESW useful. It also helped technocrats within the country defend best-practice sectoral strategies against short-term political expediency.
2.39 The quality of the AAA program for Peru since the 1997 CAS was assessed in a draft QAG report (April, 2002) and found to have been satisfactory overall, especially because of its concerted focus on issues of poverty reduction. At the same time, the report noted an inadequate focus and impact on sustainable growth, including limited responsiveness to the weakening economy during that time.
2.40 The Bank also played a catalytic role in broadening dialogue and consultation for poverty reduction through a Poverty Dialogue, bringing in the Government, other donors, civil society and the private sector. Through this vehicle, the Bank’s relationship with NGOs and the private sector was strengthened considerably.
16 The Region notes that in 1999, the Bank issued a red cover report “Peru: Improving Health Care for the Poor.” This report emphasized the issues related to primary care because of its focus on the poor's access to health services. However, it also analyzed many institutional problems of the sector (beyond primary care) and recommended reform options which were picked up by the FY00 Health Sector Reform APL. This loan presented a vision of a restructured health sector (not only a reorganized health ministry) but does not prescribe the detailed reforms in a 10 year period. The APL instrument provides flexibility for changing strategy and course, with one phase preparing the subsequent phases. Nevertheless, triggers for proceeding to subsequent phases were defined in the project.

15
Aid Coordination and Resource Mobilization
2.41 The Bank played a crucial role in helping Peru to reinsert itself into the international financial community. This process started in 1990 with the creation of a “support group” of bilateral donors and concluded in 1997 with the reaching of an agreement on a DDSR operation with commercial creditors. The Bank’s role in mobilizing resources for Peru in the early 1990s was particularly impressive. Its involvement, in cooperation with other multilaterals, in putting together this support of bilateral donors to help Peru clear arrears to multilateral agencies was efficient and innovative. Bank support of Peru’s radical adjustment program in the early 1990s contributed significantly both to Peru’s adjustment program and to resource mobilization.
2.42 The Bank also effectively mobilized resources in support of its own country assistance strategy up to 1997. At that point, however, the Bank started facing a government whose priorities had changed and that was reluctant to receive Bank support for the investment and public sector reform loans that would have furthered the strategy outlined in the 1997 CAS. Not only did the Bank continue to provide financial support in response to the country’s fiscal difficulties, it was also instrumental in mobilizing relatively large disbursements from other donors. Apart from short term relief, the primary impact of this external assistance, in the presence of policy deterioration, was increased foreign indebtedness.
2.43 Throughout the decade, the Bank, the IADB and the IMF have worked closely together. They played a mutually reinforcing role in helping Peru emerge from the 1990 crisis. The programs of the Bank and IADB have been complementary throughout (see annex table 3d). After the peak in economic performance in 1997, agreements with the IMF have been precautionary and have remained in force, despite shortfalls in fiscal targets, resulting in the diverging levels of outstanding debt shown in figure 2.1.
Figure 2.1: Peru. Debt Outstanding: All Multilaterals, IBRD, and IMF
0
1,000
2,000
3,000
4,000
5,000
6,000
1991 1992 1993 1994 1995 1996 1997 1998 1999 2000
US
$ M
illio
n
All MultilateralsIBRD
IMF
Source: World Bank Data.
16
3. The Development Impact of Bank Assistance
Growth, Poverty and Institutional Change
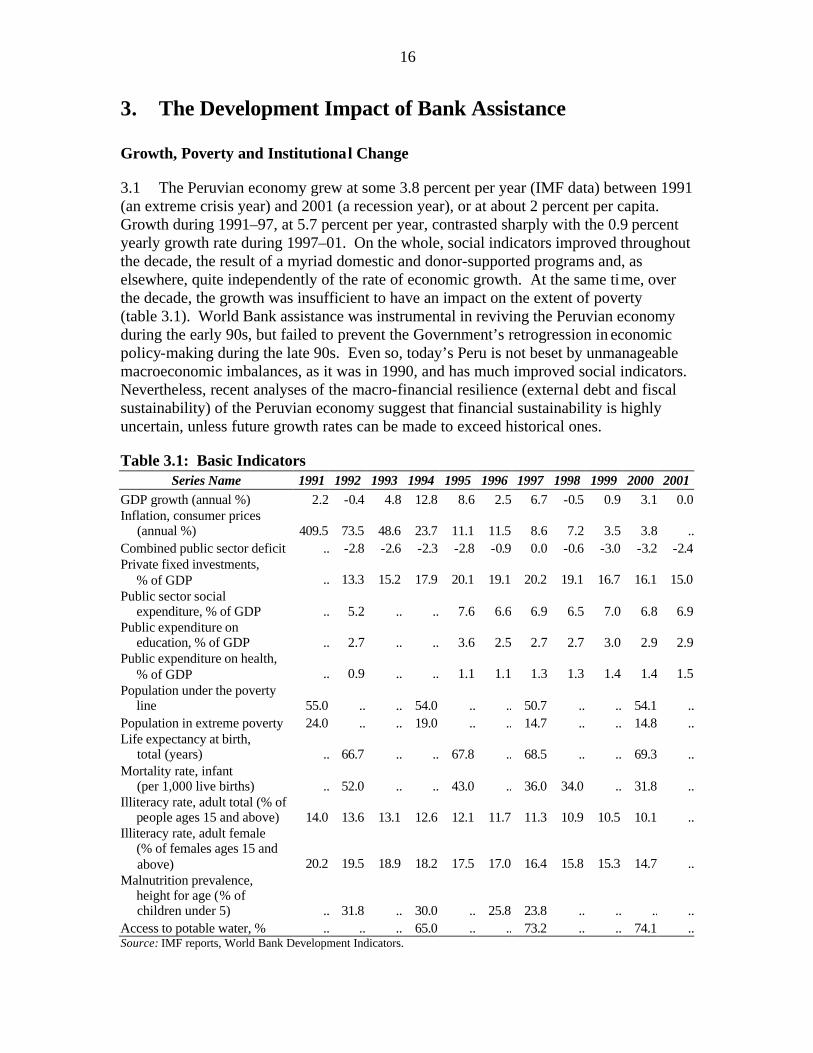
3.1 The Peruvian economy grew at some 3.8 percent per year (IMF data) between 1991 (an extreme crisis year) and 2001 (a recession year), or at about 2 percent per capita. Growth during 1991–97, at 5.7 percent per year, contrasted sharply with the 0.9 percent yearly growth rate during 1997–01. On the whole, social indicators improved throughout the decade, the result of a myriad domestic and donor-supported programs and, as elsewhere, quite independently of the rate of economic growth. At the same time, over the decade, the growth was insufficient to have an impact on the extent of poverty (table 3.1). World Bank assistance was instrumental in reviving the Peruvian economy during the early 90s, but failed to prevent the Government’s retrogression in economic policy-making during the late 90s. Even so, today’s Peru is not beset by unmanageable macroeconomic imbalances, as it was in 1990, and has much improved social indicators. Nevertheless, recent analyses of the macro-financial resilience (external debt and fiscal sustainability) of the Peruvian economy suggest that financial sustainability is highly uncertain, unless future growth rates can be made to exceed historical ones.
Table 3.1: Basic Indicators Series Name 1991 1992 1993 1994 1995 1996 1997 1998 1999 2000 2001
GDP growth (annual %) 2.2 -0.4 4.8 12.8 8.6 2.5 6.7 -0.5 0.9 3.1 0.0Inflation, consumer prices (annual %) 409.5 73.5 48.6 23.7 11.1 11.5 8.6 7.2 3.5 3.8 ..Combined public sector deficit .. -2.8 -2.6 -2.3 -2.8 -0.9 0.0 -0.6 -3.0 -3.2 -2.4Private fixed investments, % of GDP .. 13.3 15.2 17.9 20.1 19.1 20.2 19.1 16.7 16.1 15.0Public sector social expenditure, % of GDP .. 5.2 .. .. 7.6 6.6 6.9 6.5 7.0 6.8 6.9Public expenditure on education, % of GDP .. 2.7 .. .. 3.6 2.5 2.7 2.7 3.0 2.9 2.9Public expenditure on health, % of GDP .. 0.9 .. .. 1.1 1.1 1.3 1.3 1.4 1.4 1.5Population under the poverty line 55.0 .. .. 54.0 .. .. 50.7 .. .. 54.1 ..Population in extreme poverty 24.0 .. .. 19.0 .. .. 14.7 .. .. 14.8 ..Life expectancy at birth, total (years) .. 66.7 .. .. 67.8 .. 68.5 .. .. 69.3 ..Mortality rate, infant (per 1,000 live births) .. 52.0 .. .. 43.0 .. 36.0 34.0 .. 31.8 ..Illiteracy rate, adult total (% of people ages 15 and above) 14.0 13.6 13.1 12.6 12.1 11.7 11.3 10.9 10.5 10.1 ..Illiteracy rate, adult female (% of females ages 15 and above) 20.2 19.5 18.9 18.2 17.5 17.0 16.4 15.8 15.3 14.7 ..Malnutrition prevalence, height for age (% of children under 5) .. 31.8 .. 30.0 .. 25.8 23.8 .. .. .. ..Access to potable water, % .. .. .. 65.0 .. .. 73.2 .. .. 74.1 ..Source: IMF reports, World Bank Development Indicators.

17
3.2 The reform program of the early 1990s was one of the most radical and successful anywhere in the world. Inflation declined dramatically, investor confidence started to recover, and growth resumed. While recognizing that the Bank’s role vis-à-vis that of the Government is small, this radical improvement in the quality of economic policy-making in Peru was promoted by the Bank in an extremely efficient manner—by advising and supporting a government that had demonstrated strong ownership of the reform program.
3.3 In 1993–94, after the initial goals of macro-economic stabilization and implementation of first-generation structural reforms had been achieved, the main goals of the new Bank assistance program were poverty alleviation, infrastructure development, macroeconomic sustainability, and institution-building. The Bank’s assistance program was again successful in achieving most of its goals. Growth was high, investment, particularly foreign direct investment, shot up as confidence increased and privatization proceeded, the budget deficit was eliminated and inflation reached single digits. Greater resource availability and re-allocation of government expenditure allowed the rehabilitation of transport and basic infrastructure and a significant increase in social expenditure.
3.4 As a result of the resumption of growth, the pro-poor nature of the growth pattern, the elimination of terrorism, and the more progressive nature of government expenditure, poverty declined and other indicators of the well-being of the poor improved significantly. Between 1991 and 1997, the poverty rate declined from 55 percent to 51 percent while extreme poverty declined from 24 to 15 percent. Moreover, rural poverty, which in previous decades had proved intractable, experienced the steadiest decrease. Most importantly, indicators of access to basic infrastructure and social indicators such as school enrollment and infant mortality rates improved markedly.
3.5 Progress in the area of institutional reform was substantial in the early 1990s. Radical re-orientation of the role of the state in the economy requires institution-dismantling as well as institution-building. Substantial progress was made on both fronts. Perhaps the main and longest-lasting achievement of the early 1990s in the institutional front was the dismantling of a myriad government agencies such as development banks, the foreign commerce institute, and state-owned-enterprises. Institutional development also progressed. The Peruvian government with the help of donors, revamped or created some technically efficient and politically autonomous agencies such as the Central Bank, the tax collection agency (SUNAT), the customs agency (SUNAD), the competition supervision agency (INDECOPI), and the agency in charge of privatization (COPRI). Small groups of qualified technocrats with relative autonomy within their ministries and international-level salaries were set up in the Ministry of Finance and in various line ministries, financed by the Bank and other donors. These institution-building efforts were quite successful and their impact on development outcomes significant. However, while these autonomous agencies were islands of efficiency, in the absence of further public sector reform their sustainability is questionable.
3.6 During the mid-1990s, on the other hand, the institutional development impact of the Bank’s assistance program was negligible. The period immediately after the 1995 presidential election was the time to press ahead with extending isolated achievements in institutional development to the larger public sector. However, given the government’s

18
reluctance to do so, the Bank’s efforts at institutional development between 1994 and 1997 were undertaken as part of sectoral projects. As it turned out, by 1997 the government was not committed even to the limited institutional reform included in the Bank’s assistance program. All Bank loans were suffering significant delays in their institutional-development components and government interference with previously-autonomous agencies had started.
3.7 Between 1997 and 2000, the progress of the Bank’s assistance program toward achieving its goals was negligible. On the positive side, the fact that extreme poverty does not appear to have risen during a time of economic recession is encouraging and may be a sign that the social safety nets built over the 1990s are contributing to sheltering the poorest sectors of the population from the effects of economic downturns. Overall poverty, on the other hand, increased from 51 percent in 1997 to 54 percent in 2000. The increase in overall poverty during a time of economic crisis is not per se a sign that progress is not being made on building the basis for sustained poverty reduction. Laying the basis for a diversified economy that is resilient to economic downturns and has resources to provide appropriate social safety nets is necessarily a long-term project.
3.8 Because poverty reduction is a long-term objective that in the short run crucially depends on factors exogenous to a government’s control, the most reliable indicators of whether progress is being made are the evolution of government policy and inputs, outputs, and intermediate indicators. On this score, the Government’s backsliding on important policies bodes poorly. In particular, the record on institutional development and sustained investment in physical and human capital was especially poor in 1997-2000. Institutional development components of several WB projects were delayed or cancelled as a result of GOP’s unwillingness to carry out reforms such as decentralization or reform of the state. Bank supported social investment projects by the end of the decade were also curtailed and postponed by the halt of the privatization program and the lack of government counterpart funds. Even macro-economic stability—an area of concern that the Bank had declared as no longer relevant in Peru in 1994—and the open trading system established at the beginning of the decade were coming increasingly under pressure.
3.9 Between 1997 and 2000 a spate of sectoral and regional tax exemptions and rate reductions was passed that significantly reduced the neutrality of the tax system and had a fiscal cost of 2 points of GDP. This reduction in resource availability not only placed strict limits to much-needed expansion of infrastructure and social services, but also endangered the sustainability of achievements thus far. As a result of these fiscal measures—whose impact on tax collections was accentuated by the recession—, investment projects essential to the pursuit of the Bank’s assistance strategy were put on hold and all ongoing investment projects experienced dramatic reductions in counterpart funds.
3.10 After 1997, none of the structural reforms contemplated in the 1997 one-tranche Pension Reform Loan was implemented after loan disbursement and other loans witnessed similarly poor performance regarding institutional development. Evidence of politicization and lack of arms’-length management was apparent in the Social Fund for Compensation and Development (FONCODES), the Electricity Tariff Commission

19
(CTE) and the water and sewerage sector regulatory agency (SUNASS). Decentralization did not occur even in limited areas where it had been contemplated and was essential to the achievement of sectoral goals. In rural roads, for example, the transfer of road planning and management tools and appropriate financing to municipalities was behind schedule. The agency in charge of the Sierra Natural Resources Management and Poverty Alleviation Project (PRONAMACHS) was not decentralized as foreseen. Even the thus-far successful Urban Property Rights project saw progress in the politically-profitable mass titling component but relative neglect of the institutional development components that were fundamental to the sustainability of its achievements.
3.11 Lack of respect for the rule of law and increasing control by the executive of other branches of government and autonomous agencies also extended to the judiciary and the financial sector. In 1998, after the Peruvian congress passed a law depriving one of the governing institutions of the judiciary (Congreso Nacional de la Magistratura) of most of its powers and the executive director and the whole board of governors of the judicial academy (Academia de la Magistratura) resigned in protest, it became obvious that the Fujimori government was not interested in keeping a semblance of arms’-length relationship to the judiciary. As a result, the Bank's loan for Judicial Sector Reform was cancelled at the request of the Peruvian government.
3.12 A Financial Sector Assessment carried out in 1999 found a similarly distressing picture regarding the government’s handling of the ongoing banking difficulties. The Government did not allow the banking sector supervisory agency (SBS) to act transparently and with the autonomy it formally had to deal appropriately with bank resolution in what was not a systemic crisis. Moreover, the government used its deposits in the banking system, accounting for roughly 25 percent of all bank deposits, to support weak banks. It also forced “autonomous” agencies such as the public health insurance agency (ESSALUD) to convert their dollar deposits into local currency in order to help stem the ongoing currency depreciation that was placing heavy pressure on a banking system heavily indebted in dollars.17 The result of these government policies were fiscal losses and weakening of the rule of law.
3.13 The Bank’s assistance program in 1997-2000, therefore, was neither efficacious nor efficient in achieving its development goals as stated in the 1997 CAS. It devoted a relatively large amount of resources and much staff time and effort to support a government whose policies directly undermined its own ability to lay the groundwork for sustained growth and poverty-reduction. The Bank provided budget support without attempting to address the issues of the continuing erosion of an already weak tax base and of other policy reversals, while planned attempts at institutional reform were abandoned: the outcome of the Bank’s assistance during this period must be judged unsatisfactory.
Agriculture
3.14 The impact of the Bank on agricultural development has come primarily through its adjustment lending and policy advice. The opening up of the economy to free market
17 See the Region’s comment in footnote 3.

20
forces in the early 90s changed the environment for agriculture drastically, from a regime of indirect taxation, as a result of high industrial protection and exchange rate misalignment, to one which favors agriculture, in some ways excessively. As a result, during 1991-2000 agricultural GDP grew at 6.6 percent per annum, considerably faster than overall GDP. Because estimates of rural poverty over the decade show little change, there are questions about the distribution of growth between smallholders and modern agriculture, which need investigation.
3.15 The Bank has also begun to address other important issues in the sector, such as water management policy, where progress has been slow because of resistance of vested interests, and natural resource management, the long term sustainability of which will require clear decentralization policies. The issue of distortions in incentives, resulting from continued water subsidies, and from tariffs and surtaxes which have increased during the past few years, will need further attention.
Health and Education
3.16 The Bank has played a relatively small role in these sectors. Its assistance has been largely of a rehabilitation nature, in tandem with other donors, or is too recent to have had an impact. Such issues as major reform of the sectors or needed increases in government spending still remain to be tackled, although some beginnings have been made. In the health sector, the IADB developed and pilot-tested the maternal-child insurance and supported the drafting of the General Health Law, the Law on Modernization and Reform of Social Security in Health, and the rules and regulations for those laws. Other donors, including the Bank, supported these efforts. In 1999, the Bank issued two crucial sector reports one on health and the other on education (both in Red Cover) that have become the basis for most of the reforms now taking place in these sectors. The Bank and the IADB have been working together in the definition of, and negotiations with the Government, of these reforms. It is difficult to attribute leadership or impact on a single institution since many forces were/are pushing the sectors in the same direction.
3.17 Social indicators, such as immunization, infant mortality or illiteracy have continued to improve, including during the slowdown in economic growth after 1997. It is not possible to estimate the impact of the Bank’s program. As shown in annex tables 2g and 2h, social indicators are improving everywhere over the past several years for many reasons, and did so in Peru also during the late 1980s when Peru was in extreme economic crisis and when assistance from multilateral institutions was halted.
Private Sector Development
3.18 The reforms of the early 90s, in which the Bank played a significant role, totally altered the environment for private sector development and set off rapid private investment growth. As the decade progressed, two primary obstacles to private investment, the unpredictability of the judiciary and tax instability, became more pronounced and, together with growing political tension, put a damper on private investment after 1997. Other important impedime nts identified by IFC (appendix A) are uncertain follow-through on commitments by some Peruvian business groups and weak

21
corporate governance, including inadequate board oversight. In addition, access by Peruvian companies to long-term finance is a major constraint, which IFC helps to remedy. In spite of the general economic malaise since 1997, both IFC and MIGA have intensified their support (appendices A and B).
Mining and the Environment
3.19 Extractive industries are of enormous importance to the Peruvian economy, especially as export revenue earners. But they also raise important environmental and socio-economic concerns. In spite of good efforts, the Bank’s impact on environmental issues has been small and, in parallel to other developments, minimal after 1995. In the first half of the 1990s, when there was strong government commitment, Bank technical assistance, specifically for the energy and mining sectors, addressed reforms in the legal and regulatory framework, exploration and development rights, and environmental regulations. The ensuing privatization program was a great success, mining sector investment boomed, and environmental problems resulting from mining operations were beginning to be addressed.
3.20 By the mid-90s, government commitment started to wane. In 1996, the Bank tried to follow up on its earlier technical assistance efforts in the mining sector but was turned down by the Government. Towards the end of the 90s, the Bank tried again to interest the Government in broader environmental issues, again unsuccessfully. A World Bank report on environmental issues in Peru in FY00 noted that the Peruvian Government’s efforts to address the growing and increasingly diverse environmental problems were nominal at best, and confined to creating some institutions and passing some laws. The Bank has continued to include environmental components in individual projects but, faced with institutions that are not strong enough to meet the challenges and with weak commitment, its impact has been minor.
3.21 The inadequate regulatory environment and weak Central Government support for community development pose serious obstacles to harmonious development of mining. Some of the issues have been reviewed in reports on the activities of major mining companies, i.e. Yanacocha (Peru’s largest gold mine) and Antamina (Peru’s newest copper/zinc mine), both of which have received support from the World Bank Group through IFC and MIGA.18 A major finding of these reports is that the three main actors (the mining company, the Central Government, the local communities) did not have a three-way dialogue. For the most part, the companies interact with the Central Government, i.e. they pay taxes, they build roads, and the companies interact with the communities, i.e. they build some infrastructure and provide some services. But, the Central Government does not help the local communities, whose negotiation skills are limited, in their dealings with the companies. Only as the Antamina project moved into production did the Central Government become a more active partner in dialogues on community development. In addition, the benefits of mining to the surrounding
18 See e.g. “Large Mines and the Community. Socioeconomic and Environmental Effects in Latin America, Canada and Spain.” Edited by Gary McMahon and Felix Remy. International Development Research Centre and The World Bank. 2001.

22
communities tend to be very limited. Coordination between central, local and regional governments needs to be improved; the three way dialogue between government, companies and communities referred to above should involve government at all levels.
3.22 Prior to 2001, 20 percent of mining profits taxes was meant by law to be plowed back into the local communities (this was increased to 50 percent in 2001). But, little of these funds appears to reach the communities, and, furthermore, regulatory improvements are needed to identify: (i) who exactly should benefit; (ii) which level of government should administer these funds; and (iii) what type of investments should be made with the money. The Bank could provide assistance in this regard. Finally, as a foreign investment promotion effort, the Government decided to conclude “stabilization agreements” with the mining companies during 1998-00, under which 80 percent of profits are tax-free for 15 years, if reinvested. The impact on mining profits tax revenue could be substantial.
3.23 The lack of adequate regulation contributed, among others, to an important mercury spill for the Yanacocha mine in June 2000, in this particular instance because of the lack of regulation on transport of hazardous material. Some of the spill remains unaccounted for. A report on this incident was prepared by the Compliance Advisor Ombudsman of IFC/MIGA in July 2000, reporting limited illness among some individuals, and a team of medical experts agreed upon by the community, the company and government, is looking into this issue further. The Bank could provide assistance in improving environmental regulation. It is important to add that, while public criticism is often focused on large mines such as Yanacocha and Antamina (partly because of World Bank Group involvement) the environmental/social practices of other mining companies are generally of much lower standard.
3.24 There are also issues of land acquisition and resettlement. In the case of the Antamina mine, the campesinos were given money rather than resettled, because there was no suitable alternative land, or there was no time to find it, and the affected parties then demanded cash payments when it became apparent that the land-for-land approach originally envisaged would be difficult to implement in a timely manner. MIGA has now taken steps to help remedy some of these problems, which has helped improve relations between the company and the communities considerably. But, suspicions and perceptions of potential harm remain among the communities at large and more aggressive action will be needed by all parties involved to enhance the benefit of the mining sector to the Peruvian economy.
Indigenous People and Gender Issues
3.25 The Bank’s impact on the resolution of indigenous people and gender issues in Peru has been more indirect than direct, largely through its contribution to economic growth and poverty reduction. Estimates of the proportion of Peru’s population that is indigenous vary enormously, from 11 percent if speakers of indigenous languages only are included, to some 55 percent using a very broad set of criteria, such as community residence, traditional knowledge, and the like. Hence, it has not been unusual for the Government and others to look upon the issue primarily as one of poverty. (Except for the very small number of easily identifiable indigenous in the Amazon region.) Available

23
evidence does suggest that the indigenous are disadvantaged in terms of health, education or poverty. Where relevant, the Bank has included Indigenous People Development Plans in its assistance, e.g. to the social fund or to agricultural research and extension. Evidence on the outcome of Peru’s social fund (FONCODES) suggests that it was effectively targeted to the poor, rural and indigenous population.
3.26 Peru ranks below the Latin American and Caribbean average on the UN’s Gender Development Indicator. The need to focus on economic and political stabilization during the early 90s detracted attention from gender issues. More direct attention was given starting in 1996 with the creation of the Ministry of Women and Human Development, although it did not remain free from political interference. The Bank has addressed gender issues both directly (maternal mortality, women’s access to markets, property rights) and indirectly through its assistance in health, education and nutrition. Gender indicators have continued to improve.
Sustainability
3.27 In the mid-1990s, the progress achieved in laying the groundwork for private-sector-led growth and poverty reduction seemed likely to be sustained. The first-generation structural reforms implemented were so radical and had moved so fast as to be hard to reverse. As previously pointed out, institutional reform to support the new development strategy was proceeding apace albeit in a focused manner. While the dissolution of congress and the judiciary in 1992 cast a shadow on the government’s willingness to press ahead from isolated institution-building to a generalized improvement in the rule of law and public sector reform, the holding of open presidential elections in 1995 seemed to promise reform sustainability, including in the institutional front.
3.28 The largest threat to reform sustainability at the time was the uneven distribution of benefits and costs from the reform program. The new development strategy and the fiscal adjustment program that supported it generated large benefits for Peru’s wealthy and its poor but placed an enormous burden on the middle class. The wealthy benefited from expanded business opportunities, export growth, a rising skill premium and higher-quality services from privatized utilities while low rates and weak enforcement of personal income taxes kept their contribution to the fiscal adjustment effort limited. The poor benefited from particularly strong economic growth in the geographical areas and economic sectors where they were employed and from an increase and improvement in the targeting of basic social expenditure, and many gained access for the first time to water, electricity, and telephone services. Thousands of middle class members, on the other hand, lost their jobs in the downsizing of the civil service and state-owned-enterprises as well as in import-competing industries that went bankrupt during the ensuing trade liberalization. They saw their wages stagnate after undergoing a dramatic decline, and suffered from increases in utility prices and a re-direction of government expenditure toward the poor. They also paid the largest share of a tax reform program centered around the value added tax.
3.29 The lack of continuation of public sector reform in the mid-1990s endangered the sustainability of the achievements of the focused institutional development program of

24
the early 1990s. The respect of the rule of law, necessary for the sustainability of an arm’s-length relationship between government and autonomous institutions, did not develop. Moreover, many technocratic teams were financed by donors, and were dismantled after donor funds ceased, leaving the technical capacity of ministries much as it had been before their establishment and endangering the sustainability of project achievements. In fact, an increase in the fiscal effort was necessary to sustain the largely foreign-financed efforts. A lack of funds for maintenance meant that the condition of roads and other transport infrastructure rehabilitated in the earlier part of the decade was seriously deteriorating. Examples abound: the deterioration of the previously-rehabilitated infrastructure of the Lima Water and Sewerage Company, poor maintenance of rural school facilities, shortage of supplies for health sector projects and curtailment of counterpart funds for the social development fund FONCODES. Also contributing to the fiscal dire straits at the end of the decade was a sharp and untimely increase in public sector wages and pensions and a reduction in the payroll tax meant to gain middle class support in the upcoming presidential election. While the liberalization and macroeconomic stabilization of the early 1990s may appear unlikely to be reversed, the fiscal measures undertaken in the past few years and the increasing pressures for commercial protection endanger even the achievements in infrastructure, social services and social safety nets. For the immediate future, Government plans to reduce public expenditure by 2.5 points of GDP over the 2000–2004 period make the sustainability of program achievements in the infrastructure and social sectors highly unlikely.
4. Contributors’ Performance
Country Performance
A. The First Half of the 1990s
4.1 The Peruvian Government deserves most of the credit for the successful reform program of the early 1990s and most of the blame for the stagnation in reform in the mid-1990s and the policy reversals of the late 1990s. It was the Government that took the initiative in formulating and implementing the radical reform program supported by the Bank in 1990–95.
4.2 The Government efficiently mobilized resources to carry out the reforms. It rapidly set up a set of agencies and technocratic groups whose commitment to reform and technical skill were instrumental in the implementation of economic stabilization and structural reform measures. The Government also enhanced public support from the poor by increasing social expenditure and allocating it to basic infrastructure, health, and education and poverty-alleviation programs. Less effort was devoted to encouraging consensus by those negatively affected by the reform program, former government and SOE employees and the middle class as a whole. This weakened support from these groups and significantly contributed to the slowdown in reform effort in the latter part of the 1990s.

25
4.3 The Government’s record on eliciting social participation and support for the Bank’s assistance program was mixed. On the positive side, grass-roots participation was actively encouraged in basic health initiatives, such as the locally-run health posts CLAS, and in most of the projects supported by the Social Fund for Compensation and Development (FONCODES). On the negative side, business organizations were very influential, particularly regarding tax policy where the Bank believed that revenues should be increased, while trade unions and regional and local governments were systematically bypassed in the formulation and implementation of policies by the central government.
B. The Second Half of the 1990s
4.4 In the mid-1990s, the Peruvian government missed an important opportunity to press ahead with the next stage of structural reforms. It did not embark on the public sector reform that the 1994 and 1997 CASs identified as the necessary underpinning for the successful implementation of all other policies aimed at generating growth and poverty reduction. Moreover, the institutional-development components of Bank loans were weakly implemented, if at all. Public sector reform required fiscal resources to improve incentives and compensate losers, a strategic vision, and a realistic implementation plan. Most importantly, it required a willingness on the part of the government to relinquish micro-management and direct control of all aspects of government policy for short-term political benefit in the interest of improved governance. The Peruvian government of the mid-1990s was not ready for such a bold strategy. Moreover, starting in 1997, the government implemented policies that directly undermined institutional-strengthening and investments in physical and human capital that the Bank deemed fundamental to the implementation of its assistance program.
Bank Performance
A. The First Half of the 1990s
4.5 Bank performance in Peru during the first half of the 1990s was commendable. It exhibited high professional quality, prudence, creativity and efficiency. Activity focused on areas of Bank comparative advantage and it employed an appropriate mix of assistance instruments for the achievement of its goals. Many policy-makers interviewed for this report mentioned a meeting in January 1991 in New York City between Alberto Fujimori and the heads of the Bank, the IMF, the IADB and the UN, which proved crucial in convincing the Peruvian president about the benefits of the radical stabilization and liberalization program that he was to eventually implement. The Bank also showed an excellent combination of prudence and creativity by developing a new approach (the performance period) for strong-performing countries with protracted arrears that maximized Bank influence on and support to Peru while exhibiting needed caution in resuming lending.
4.6 In 1993–95, however, Bank assistance had notable weaknesses: it did not provide an estimate of the fiscal cost of the Government’s development strategy; timely ESW in education, health, and public sector reform; or an accurate analysis of key stakeholders

26
affected by the Government’s economic program. ESW on the education and health sectors—which was carried out only in 1997 for education and has not yet been carried out for the health sector as a whole—could have provided timely analytical support for much-needed sectoral reforms.
B. The Second Half of the 1990s
4.7 Throughout the decade, the Bank continued to provide high-quality analysis and maintained high quality for projects at entry. Once the Peruvian government’s reform will started to wane after 1995, it is unclear whether more resolute pressure from the Bank aligned with pro-reform forces within the Peruvian government might have been able to tip the balance toward public sector reform in the mid-1990s. Even in the absence of commitment to wholesale public sector reform, the Bank could have included bolder sectoral reform components in its health and education projects. It could also have been less pliant to client country pressure to overlook poor progress in the institutional-development components of loans. The Bank’s willingness to continue financing projects in which institutional reform was lacking was a signal to the Government that it would receive Bank support regardless of its economic policies.
4.8 Since 1997, the Bank did make a concerted and successful effort to improve its portfolio performance through a pro-active policy of closings and cancellations, focusing all loans on poverty alleviation. However, it should not have re-directed loans from investment projects to fast-disbursing structural adjustment lending in contradiction with its own country assistance strategy and at a time when progress in the structural and other fronts was poor. By agreeing to this shift in lending, the Bank ended up financing a government that was rapidly backtracking on economic reform. Ultimately, the Bank continued to provide budget support and disbursed the second tranche ($122 mn) of its Financial Sector Adjustment loan, even after long-standing allegations of corruption had been proven19 and after President Fujimori had announced his intention to resign because of the corruption scandal involving his chief advisor Montesinos.
4.9 It could be argued that the decision to continue lending to Peru in the late 1990s, especially adjustment lending, was made because the level of quality of Government policies was still acceptable (compared to other borrowers) even though the direction was clearly deteriorating. This evaluation would suggest that the latter should be the guiding principle. It could also be argued that pressure to maintain a minimum lending level, both from within the Bank and from without, led to the decision to lend even though no progress was being made towards the Bank’s assistance objectives and corporate goals. This evaluation argues against this course of action.
19 The Region argues that no-one knew at the time of the formulation of the FSAL the depth of corruption and state capture that has now come to light. When president Fujimori resigned, the disbursement of the second tranche of the FSAL had already been processed and could not have been held back at that point as all loan conditions established in the loan agreement had been met.

27
Other Donors
4.10 The partnership between the Bank, IMF, IADB and bilaterals, such as Japan, was excellent during the early 1990s period of reintegration of Peru in the international financial community. Cooperation has remained close, with the respective programs being largely additive. Adjustment programs were mostly cofinanced or in parallel, while investment lending was divided along geographical or functional lines. Continual “agreements” with the IMF during the past several years were all “precautionary,” and there have been no IMF drawings since 1997. The IADB conducted an evaluation of its own assistance program in Peru during the past decade, the Executive Summary of which is attached as appendix D.
Exogenous Factors
4.11 Perhaps the most important factor contributing to the great progress made by Peru in achieving high growth and poverty reduction up to 1997 was the eradication of terrorism, which led to the recovery in investor confidence, the redeployment of teachers and health workers to areas formerly affected by terrorism, the rehabilitation of damaged infrastructure, and the restoration of physical security to the poorest segments of Peru’s rural population. However, the free rein given to the military and security services to stamp out terrorism and collaborate in the drug war would eventually prove counter-productive, weakening the rule of law and creating a corruption ring the extent of which is not yet known. The influence of these sectors increased throughout the decade and eventually undermined progress in all fronts, including economic policy and poverty-reduction.
4.12 World economic trends were favorable up to 1997 and unfavorable thereafter. At first, world growth was relatively high, Peru’s terms of trade were favorable, and global liquidity abundant, leading to increased capital flows to developing countries. These helped support Peru’s strong policy performance and generated high rates of GDP growth and substantial poverty reduction. Starting in 1997, on the other hand, world economic trends were much less favorable. World economic growth slowed, the East Asian and the Russia-Brazil crises led to a decline in capital flows to emerging markets, and Peru’s terms-of-trade declined (table 2f). These unfavorable exogenous factors significantly contributed to Peru’s poor growth performance and poverty increase between 1997 and 2000. Poor growth also contributed to increasing pressures on the Government to backtrack on economic reforms.
4.13 A further exogenous factor was El Niño which affected Peru during 1997–98. El Niño increases the temperature of ocean water leading to a decline in output in fishing, a major source of income and exports, as well as heavy rains and floods that affect the agricultural sector and destroy physical infrastructure. While El Niño is recurring and predictable, and remedial measures were taken, it was an important factor in the decline in GDP in 1998.

28
5. Lessons and Recommendations
5.1 Reconciliation at the macroeconomic level between sectoral needs and overall resource availability is imperative. The Peruvian government’s current plan to eliminate the budget deficit by reducing public expenditure as a share of GDP between 2000 and 2004 needs to be reconciled with the costs of a poverty-reduction strategy. In the past there has been a stark disconnect between macro-economic planning, which has taken tax resources as given, and sectoral strategies. This has resulted first in stagnation and then in decline in resources available to finance the investments deemed crucial to achieving sustained poverty reduction. A public expenditure review should provide an estimate of the resources needed to achieve the goals of the development program to be agreed between the Bank and the new Peruvian government.
5.2 Institutional reform is crucial to an efficient Bank assistance program aimed at poverty-reduction. Improved rule of law and public sector reform are fundamental to encouraging the private sector and sustained poverty reduction. If the Government shows commitment to public sector reform, the Bank should provide analytical and financial support. If commitment is weak, the Bank should build institutional-development components into project and sector loans and condition disbursements to progress on the institutional front.
5.3 Increased investment in physical and human capital is essential to the long-term goal of sustained poverty-reduction. As the recent economic crisis and ensuing increase in poverty shows, the goal of sustained poverty reduction remains elusive. The development of a comparative advantage in increasingly-skilled labor-intensive activities is fundamental to economic diversification, reduced economic volatility, and sustained poverty reduction. The recommendations of the recent report on the educational sector should be used as input for sectoral reform, and analysis of the health sector should be carried out to support the Health Sector Reform Loan and complement the existing work on primary health care.
5.4 Accurate diagnosis of social groups in need of compensation from reform programs is crucial to reform sustainability. Perhaps internalizing critiques to Bank programs from the outside, Bank documents on Peru (particularly project documents on the Social Fund for Compensation and Development FONCODES) reflected a belief that the poor were being hurt by the short-term costs of liberalization and economic adjustment. That was not the case in Peru in the 1990s and is often not the case in other countries. The type of re-orientation of the role of the state in the economy supported by Bank programs, in particular re-focusing the government’s role from resource allocation to the provision of basic goods and services and a shift from protectionism to free trade, often benefit the poor and hurt the previously-sheltered and state-dependent middle classes. If this is indeed the case, the middle classes should be appropriately compensated to enhance the chances of reform sustainability, even while the main target group of Bank assistance benefits should continue to be the poor.

Peru at a glance 9/13/01
Latin Lower-POVERTY and SOCIAL America middle-
Peru & Carib. income2000Population, mid-year (millions) 25.7 516 2,046GNI per capita (Atlas method, US$) 2,080 3,680 1,140GNI (Atlas method, US$ billions) 53.4 1,895 2,327
Average annual growth, 1994-00
Population (%) 1.7 1.6 1.0Labor force (%) 2.9 2.3 1.3
Most recent estimate (latest year available, 1994-00)
Poverty (% of population below national poverty line) 54 .. ..Urban population (% of total population) 73 75 42Life expectancy at birth (years) 69 70 69Infant mortality (per 1,000 live births) 39 30 32Child malnutrition (% of children under 5) 8 9 11Access to an improved water source (% of population) 77 85 80Illiteracy (% of population age 15+) 10 12 15Gross primary enrollment (% of school-age population) 123 113 114 Male .. .. 116 Female .. .. 114
KEY ECONOMIC RATIOS and LONG-TERM TRENDS
1980 1990 1999 2000
GDP (US$ billions) 20.7 26.3 51.6 53.5Gross domestic investment/GDP 29.0 16.5 21.5 20.1Exports of goods and services/GDP 22.4 15.8 14.8 16.0Gross domestic savings/GDP 32.0 18.4 19.2 18.2Gross national savings/GDP .. .. 18.0 17.3
Current account balance/GDP -0.5 -5.4 -3.7 -3.0Interest payments/GDP 3.2 0.3 2.7 3.0Total debt/GDP 45.4 76.3 54.5 53.0Total debt service/exports 44.5 11.0 46.5 44.9Present value of debt/GDP .. .. 61.8 ..Present value of debt/exports .. .. 365.6 ..
1980-90 1990-00 1999 2000 2000-04(average annual growth)GDP -0.1 4.7 0.9 3.1 4.0GDP per capita -2.2 2.9 -0.8 1.4 2.3Exports of goods and services -0.9 8.5 7.6 7.9 5.5
STRUCTURE of the ECONOMY1980 1990 1999 2000
(% of GDP)Agriculture 10.2 8.5 8.5 8.6Industry 42.0 27.4 30.2 29.7 Manufacturing 20.2 17.8 16.0 15.6Services 47.8 64.1 61.3 61.7
Private consumption 57.5 73.7 69.9 70.6General government consumption 10.5 7.9 10.9 11.2Imports of goods and services 19.4 13.8 17.1 17.9
1980-90 1990-00 1999 2000(average annual growth)Agriculture 3.0 5.8 12.6 6.4Industry 0.1 5.4 -0.3 3.4 Manufacturing -0.2 3.8 -0.5 6.7Services -0.4 4.0 0.8 2.4
Private consumption 0.7 4.0 -0.4 3.9General government consumption -0.9 5.2 3.5 5.1Gross domestic investment -3.8 7.4 -13.4 -3.7Imports of goods and services -3.2 9.0 -15.2 3.6
Note: 2000 data are preliminary estimates.
* The diamonds show four key indicators in the country (in bold) compared with its income-group average. If data are missing, the diamond will be incomplete.
-20
0
20
40
95 96 97 98 99 00
GDI GDP
Growth of investment and GDP (%)
Peru
Lower-middle-income group
Development diamond*
Life expectancy
Access to improved water source
GNIpercapita
Grossprimary
enrollment
-30
-15
0
15
30
95 96 97 98 99 00
Exports Imports
Growth of exports and imports (%)
Peru
Lower-middle-income group
Economic ratios*
Trade
Domesticsavings
Investment
Indebtedness

Peru
PRICES and GOVERNMENT FINANCE1980 1990 1999 2000
Domestic prices(% change)Consumer prices 60.7 7,481.7 3.5 3.8Implicit GDP deflator 65.9 6,837.0 3.9 3.6
Government finance(% of GDP, includes current grants)Current revenue .. 11.4 14.5 14.7Current budget balance .. -6.2 -0.1 -0.2Overall surplus/deficit .. -7.9 -3.1 -2.7
TRADE1980 1990 1999 2000
(US$ millions)Total exports (fob) .. 3,321 6,119 7,028 Copper .. 700 776 931 Fishmeal .. 339 533 873 Manufactures .. 989 1,876 2,047Total imports (cif) .. 2,922 6,749 7,349 Food .. 460 566 482 Fuel and energy .. 305 641 1,084 Capital goods .. 886 2,133 2,109
Export price index (1995=100) .. 87 79 83Import price index (1995=100) .. 85 96 101Terms of trade (1995=100) .. 103 82 82
BALANCE of PAYMENTS1980 1990 1999 2000
(US$ millions)Exports of goods and services 4,631 4,120 7,696 8,603Imports of goods and services 3,970 4,086 9,028 9,706Resource balance 661 34 -1,331 -1,103
Net income -909 -1,733 -1,581 -1,542Net current transfers 147 281 994 1,018
Current account balance -101 -1,418 -1,919 -1,627
Financing items (net) 738 -723 1,061 1,497Changes in net reserves -637 2,141 858 130
Memo:Reserves including gold (US$ millions) 0 1,769 9,001 8,628Conversion rate (DEC, local/US$) 2.89E-7 0.2 3.4 3.5
EXTERNAL DEBT and RESOURCE FLOWS1980 1990 1999 2000
(US$ millions)Total debt outstanding and disbursed 9,386 20,064 28,117 28,358 IBRD 359 1,188 2,417 2,590 IDA 0 0 0 0
Total debt service 2,151 476 4,055 4,371 IBRD 38 0 244 281 IDA 0 0 0 0
Composition of net resource flows Official grants 31 180 149 .. Official creditors 383 106 569 636 Private creditors -94 18 883 798 Foreign direct investment 27 41 1,969 327 Portfolio equity 0 0 289 -259
World Bank program Commitments 60 0 300 5 Disbursements 140 0 381 266 Principal repayments 15 0 89 93 Net flows 125 0 291 173 Interest payments 24 0 155 189 Net transfers 101 0 137 -16
Development Economics 9/13/01
-10
-8
-6
-4
-2
094 95 96 97 98 99 00
Current account balance to GDP (%)
0
2,500
5,000
7,500
10,000
94 95 96 97 98 99 00
Exports Imports
Export and import levels (US$ mill.)
0
10
20
30
95 96 97 98 99 00
GDP deflator CPI
Inflation (%)
G: 4,080 A: 2,590
D: 734
C: 588
F: 8,264
E: 12,102
Composition of 2000 debt (US$ mill.)
A - IBRDB - IDA C - IMF
D - Other multilateralE - BilateralF - PrivateG - Short-term

Annex Table 2a: Peru - Key Economic and Social Indicators, 1991-2000
Series Name 1991 1992 1993 1994 1995 1996 1997 1998 1999 2000
Peru Average
1991-2000
Bolivia Average
1991-2000
Colombia Average
1991- 2000
Ecuador Average
1991-2000
Thailand Average
1991-2000
GDP growth (annual %) 2.2 -0.4 4.8 12.8 8.6 2.5 6.7 -0.5 0.9 3.1 4.8 4.0 2.8 1.5 3.5GNI per capita, Atlas method (current US$) 1,030.0 1,280.0 1,390.0 1,820.0 2,060.0 2,250.0 2,400.0 2,240.0 2,110.0 2,080.0 2,080.0 990.0 2,020.0 1,210.0 2,000.0GNI per capita, PPP (current international $) 3,240.0 3,290.0 3,450.0 3,890.0 4,290.0 4,370.0 4,570.0 4,430.0 4,490.0 4,660.0 4,660.0 2,360.0 6,060.0 2,910.0 6,320.0Agriculture, value added (% of GDP) 7.8 7.7 8.2 8.3 7.8 8.2 7.7 8.0 7.8 7.9 7.9 20.6 14.8 12.1 11.4Manufacturing, value added (% of GDP) 16.1 16.1 16.2 16.0 15.4 15.2 15.1 14.6 14.6 14.3 15.4 15.7 16.6 21.0 29.0Services, etc., value added (% of GDP) 67.2 66.9 65.1 63.6 64.3 64.4 64.5 64.9 64.7 64.9 65.0 60.7 53.4 50.9 49.7Exports of goods and services (% of GDP) 12.2 12.5 12.5 12.8 12.5 13.1 14.2 13.3 14.8 16.0 13.4 20.3 17.1 31.1 46.2Imports of goods and services (% of GDP) 14.5 15.5 16.3 16.2 18.2 18.1 18.6 18.6 17.1 17.9 17.1 28.1 19.2 27.6 45.6Current account balance (% of GDP) -6.3 -5.8 -6.6 -5.7 -7.7 -6.1 -5.2 -6.4 -3.7 -3.0 -5.7 -6.1 -2.1 -2.5 -1.2Total debt service (% of exports of goods and services) 25.0 20.3 56.9 17.7 15.7 34.4 37.5 26.8 46.4 42.8 32.4 32.4 35.3 24.8 14.9Gross international reserves in months of imports 5.8 5.7 6.4 9.6 8.5 10.8 10.4 9.2 9.6 8.7 8.5 5.6 6.6 3.3 5.3Gross domestic savings (% of GDP) 15.0 14.4 15.4 18.9 19.1 17.9 19.6 18.2 19.2 18.2 17.6 9.7 17.2 22.8 34.8Inflation, consumer prices (annual %) 409.5 73.5 48.6 23.7 11.1 11.5 8.6 7.2 3.5 3.8 60.1 9.2 20.5 43.8 4.5Current revenue, excluding grants (% of GDP) 13.7 15.1 15.1 16.4 16.9 17.5 17.6 17.6 16.5 16.4 16.3 16.5 12.6 15.8 17.7Expenditure, total (% of GDP) 15.9 18.7 18.1 18.5 19.1 18.0 17.3 18.1 19.6 19.3 18.3 22.0 14.9 15.3 18.0Overall budget deficit, including grants (% of GDP) -2.2 -3.7 -3.0 2.2 -1.1 2.8 0.6 -0.1 -2.2 -2.0 -0.9 -2.3 -2.6 0.5 -0.7Population, total 22.0 22.4 22.8 23.1 23.5 23.9 24.4 24.8 25.2 25.7 23.8 7.5 38.9 11.6 58.7Population growth (annual %) 1.8 1.8 1.7 1.7 1.6 1.7 1.8 1.7 1.7 1.7 1.7 2.4 1.9 2.1 0.9Urban population (% of total) 69.3 69.7 70.1 70.5 70.9 71.3 71.7 72.0 72.4 72.8 71.1 60.8 72.8 59.2 20.2Illiteracy rate, adult total (% of people ages 15 and above) 14.0 13.6 13.1 12.6 12.1 11.7 11.3 10.9 10.5 10.1 12.0 17.6 9.7 10.1 5.8School enrollment, primary (% gross) 117.6 116.6 117.7 120.6 122.9 123.2 122.8 126.4 .. .. 121.0 102.2 108.8 120.9 92.1Immunization, DPT (% of children under 12 months) 71.0 83.0 87.0 87.0 90.0 94.0 90.0 92.0 93.0 .. 87.4 57.2 79.4 79.4 92.9Improved water source (% of population with access) .. .. .. .. .. .. .. .. .. 77.0 77.0 76.5 91.0 71.0 80.0Sanitation (% of population with access) .. .. .. .. .. .. .. .. .. 76.0 76.0 66.0 85.0 59.0 96.0Life expectancy at birth, total (years) .. 66.7 .. .. 67.8 .. 68.5 .. .. 69.3 68.1 61.2 70.2 68.4 69.0Mortality rate, infant (per 1,000 live births) .. 52.0 .. .. 43.0 .. 36.0 34.0 .. 31.8 39.4 65.3 23.0 32.9 31.4
Source: WDI/GDF as of 04/18/02.

Annex 2 (continued) 32
Annex Table 2b: Comparative Tax Effort in Latin American Countries (% of GDP)
1995
1996
1997
1998
1999
2000 Average 95-00
Argentina Central Government 14.0 13.0 13.6 13.8 14.0 14.1 13.6 Other Government 8.4 8.5 9.0 9.1 - - 8.8 General Government 22.4 21.5 22.6 22.9 - - 22.4 Bolivia Central Government 16.2 17.2 17.0 17.5 16.6 17.2 17.0 Other Government 4.7 4.1 5.0 5.1 4.8 5.1 4.8 General Government 20.9 21.3 22.0 22.6 21.4 22.3 21.8 Chile Central Government 22.2 23.4 23.2 22.9 22.5 23.7 23.0 Other Government 1.6 1.7 1.9 1.9 2.0 1.9 1.9 General Government 23.8 25.1 25.1 24.8 24.5 25.6 24.9 Peru Central Government 16.9 17.6 17.6 17.6 16.3 16.2 17.0 Other Government 1.1 1.2 1.3 1.2 1.2 1.3 1.2 General Government 18.0 18.8 18.9 18.8 17.5 17.5 18.2 Uruguay Central Government 27.6 27.8 29.2 29.9 27.5 27.5 28.3 Other Government - - - - - - - General Government 27.6 27.8 29.2 29.9 27.5 27.5 28.3 Where data are missing (-) average is for subperiod/subgovernment. Source: IMF, Government Finance Statistics. Note: Revenue-to-GDP ratios will differ depending on source of data and/or coverage, but the evidence
on Peru’s low tax effort is consistent. See e.g.: IMF Working Paper, Taxation in Latin America: Structural Trends and Impact of Administration, by P. Shome, Feb. 1999; the paper shows tax-to-GDP ratios for 1992 and 1996, covering 15 countries in 3 groups: high-tax countries (Brazil, Chile, Costa Rica, Nicaragua, Uruguay), medium-tax countries (Argentina, Bolivia, Colombia, Mexico, Panama), and low-tax countries (Ecuador, Guatemala, Paraguay, Peru, Venezuela). Unpublished IMF data for Latin America’s nine largest economies also show Peru at the bottom in terms of tax effort, by a considerable margin.

Annex 2 (continued) 33
Annex Table 2c: Public Expenditure on Health and Education for Peru and Comparator Countries
Countries 1991 1992 1993 1994 1995 1996 1997 1998 1999 2000 2001
Education spending Peru .. 2.7 .. .. 3.6 2.5 2.7 2.7 3.0 2.9 2.9 (% of GDP) Bolivia 4.1 4.5 5.3 5.6 5.3 5.7 6.0 5.7 6.2 6.3 .. Colombia 2.4 2.7 2.8 3.0 3.1 3.8 3.9 4.0 .. .. .. Ecuador .. 3.2 2.8 2.8 3.1 3.2 3.1 3.1 .. .. .. Argentina 3.6 3.8 4.1 4.2 4.3 4.2 4.3 4.4 4.8 .. .. Chile 2.6 2.8 2.9 2.9 2.9 3.2 3.4 4.6 4.0 .. .. Mexico 2.9 3.2 3.6 3.9 3.7 3.7 3.7 3.8 .. .. ..
Health spending Peru .. 0.9 .. .. 1.1 1.1 1.3 1.3 1.4 1.4 1.5 (% of GDP) Bolivia 1.8 2.2 2.2 1.8 3.1 3.3 3.4 3.3 3.3 3.7 .. Colombia 1.0 1.2 1.4 1.3 1.6 2.0 2.0 2.0 .. .. .. Ecuador .. 1.0 0.8 0.7 1.1 1.0 1.0 0.9 .. .. .. Argentina 4.3 4.5 4.6 4.9 5.0 4.6 4.4 4.4 4.6 .. .. Chile 2.2 2.3 2.5 2.5 2.4 2.5 2.6 2.7 2.8 .. .. Mexico 3.2 3.4 3.6 3.6 3.5 3.3 3.7 3.9 4.4 4.3 ..
Source: IMF reports and database.

Annex 2 (continued) 34
Annex Table 2d: Peru Social Indicators and Millennium Development Goals Social Indicators 1990 1995 1999 20001 Eradicate extreme poverty and hunger: 2015 target = halve 1990 $1 a day poverty and malnutrition rates Population below $1 a day (%) .. 15.5 .. .. Poverty gap at $1 a day (%) .. 5.4 .. .. Percentage share of income or consumption held by poorest 20% .. 4.4 .. .. Prevalence of child malnutrition (% of children under 5) 10.7 7.8 .. .. Population below minimum leve l of dietary energy consumption (%) .. .. .. .. 2 Achieve universal primary education: 2015 target = net enrollment to 100 Net primary enrollment ratio (% of relevant age group) .. 90.8 103.1 .. Percentage of cohort reaching grade 5 (%) .. .. .. .. Youth literacy rate (% ages 15-24) 94.5 95.7 96.6 96.83 Promote gender equality: 2005 target = education ratio to 100 Ratio of girls to boys in primary and secondary education (%) 93.4 93.4 94.3 .. Ratio of young literate females to males (% ages 15-24) 95.1 96.1 96.8 97.0Share of women employed in the nonagricultural sector (%) 38.8 38.8 46.0 .. Proportion of seats held by women in national parliament (%) 6.7 10.8 .. .. 4 Reduce child mortality: 2015 target = reduce 1990 under 5 mortality by two-thirds Under 5 mortality rate (per 1,000) 75.0 59.0 47.0 41.4Infant mortality rate (per 1,000 live births) 54.0 43.0 34.0 31.8Immunization, measles (% of children under 12 months) 64.0 98.0 93.0 .. 5 Improve maternal health: 2015 target = reduce 1990 maternal mortality by three-fourths Maternal mortality ratio (modeled estimate, per 100,000 live births) .. 240.0 .. .. Births attended by skilled health staff (% of total) 78.0 56.0 .. .. 6 Combat HIV/AIDS, malaria and other diseases: 2015 target = halt, and begin to reverse, AIDS, etc. Prevalence of HIV, female (% ages 15-24) .. .. 0.2 .. Contraceptive prevalence rate (% of women ages 15-49) 54.7 64.0 .. 68.9Number of children orphaned by HIV/AIDS .. .. 8900.0 .. Incidence of tuberculosis (per 100,000 people) .. .. 228.0 .. Tuberculosis cases detected under DOTS (%) .. .. 95.0 .. 7 Ensure environmental sustainability: 2015 target = various (see notes) Forest area (% of total land area) 53.0 .. .. 50.9Nationally protected areas (% of total land area) .. 2.7 2.7 .. GDP per unit of energy use (PPP $ per kg oil equivalent) 6.3 7.8 8.9 .. CO2 emissions (metric tons per capita) 1.0 1.1 1.1 .. Access to an improved water source (% of population) 72.0 .. .. 77.0Access to improved sanitation (% of population) 64.0 .. .. 76.0Access to secure tenure (% of population) .. .. .. .. 8 Develop a Global Partnership for Development: 2015 target = various (see notes) Youth unemployment rate (% of total labor force ages 15-24) .. 11.4 .. .. Fixed line and mobile telephones (per 1,000 people) 26.2 50.2 97.0 111.3Personal computers (per 1,000 people) .. 14.9 35.7 40.9General indicators Population 21.6 million 23.5 million 25.2 million 25.7 million Gross national income ($) 16.8 billion 48.5 billion 53.3 billion 53.4 billion GNI per capita ($) 780.0 2060.0 2110.0 2080.0Adult literacy rate (% of people ages 15 and over) 85.5 87.9 89.5 89.9Total fertility rate (births per woman) 3.7 3.4 2.9 2.8Life expectancy at birth (years) 65.8 67.8 .. 69.3Aid (% of GNI) 1.6 0.7 0.9 0.8External debt (% of GNI) 78.7 59.5 57.8 55.0Investment (% of GDP) 16.5 24.8 21.5 20.1Trade (% of GDP) 29.6 30.7 31.9 33.8Source: World Development Indicators database, April 2002. Note: In some cases the data are for earlier or later years than those stated. Goal 7 targets: Integrate the principles of sustainable development into country policies and programs and reverse the loss of environmental resources.
Halve, by 2015, the proportion of people without sustainable access to safe drinking water. By 2020, to have achieved a significant improvement in the lives of at least 100 million slum dwellers.
Goal 8 targets: Develop further an open, rule -based, predictable, non-discriminatory trading and financial system. Address the Special Needs of the Least Developed Countries. Address the Special Needs of landlocked countries and small island developing states. Deal comprehensively with the debt problems of developing countries through national and international measures in order to make
debt sustainable in the long term. In cooperation with developing countries, develop and implement strategies for decent and productive work for youth. In cooperation with pharmaceutical companies, provide access to affordable, essential drugs in developing countries.

Annex 2 (continued) 35
Annex Table 2e: Peru – GDP by Sectors 1991–2000
1991
1992
1993
1994
1995
1996
1997
1998
1999
2000 Ave Growth 1991-2000
Agriculture 4.0 -9.1 9.0 13.2 9.5 5.2 5.4 1.5 11.7 6.2 6.6Fisheries -23.5 27.2 3.9 21.1 -13.9 -4.8 -1.8 -13.4 29.2 9.1 2.1Mining and Oil 3.6 0.9 10.2 12.0 4.2 5.1 9.0 3.8 12.9 2.4 7.1Manufacturing 5.4 -3.3 3.4 16.6 5.5 1.5 5.3 -3.2 -0.5 6.7 3.8Construction 0.0 2.3 20.3 33.3 17.4 -2.3 14.9 0.6 -10.5 -4.3 8.7Commerce 2.9 -0.9 2.6 16.3 11.1 0.9 7.8 -3.2 -1.9 5.1 4.7Other Services 1.1 1.3 3.5 8.9 8.5 3.3 6.0 0.3 0.5 1.8 4.3 GDP 2.2 -0.4 4.8 12.8 8.6 2.5 6.7 -0.5 0.9 3.1 4.8Source: Central Bank of Peru. Annex Table 2f: Peru – Terms of Trade and Mineral Prices 1990-2000
1990 1991 1992 1993 1994 1995 1996 1997 1998 1999 2000 Net barter terms of trade (1995 = 100) 93 87 95 89 95 100 96 104 90 83 83Gold (US$/oz. Troy) 354 363 344 360 384 385 388 332 294 279 279Copper (¢US$/lb) 111 106 103 87 105 133 104 103 75 71 82Zinc (¢US$/lb) 266 51 56 44 45 47 47 60 46 49 51 Source: Central Bank of Peru.

Annex 2 (continued) 36
Annex Table 2g: Comparative Trends in Social Indicators
Trend in Social Indicators Peru Bolivia Colombia Ecuador Indonesia Thailand Venezuela
Latin America & Caribbean
Low & middle income
Annual Growth Rates: 1990-1997* Illiteracy rate, adult total (% of people ages 15 and above) -3.5 -4.0 -3.2 -3.8 -4.3 -5.0 -3.9 -2.7 -2.2 School enrollment, primary (% gross) 0.5 1.6 .. -0.5 .. -1.5 .. 1.4 0.5 Immunization, DPT (% of children under 12 months) 3.2 5.0 -2.5 0.2 2.4 0.5 -1.0 2.1 -0.2 Improved water source (% of population with access) .. .. .. .. 0.0 .. .. .. .. Sanitation (% of population with access) .. .. .. .. 0.0 .. .. .. .. Life expectancy at birth, total (years) 0.6 0.8 0.5 0.3 0.8 -0.1 0.3 0.4 0.2 Mortality rate, infant (per 1,000 live births) -5.8 -3.6 -4.6 -5.9 -4.4 -3.5 -2.3 -3.8 -1.4 GDP per capita (constant 1995 US$) 3.3 1.8 2.0 1.0 5.4 5.6 1.1 2.1 1.9 Annual Growth Rates: 1997-2000* Illiteracy rate, adult total (% of people ages 15 and above) -3.8 -4.3 -3.4 -4.0 -4.6 -5.7 -4.2 -2.7 -2.3 School enrollment, primary (% gross) .. .. .. 0.0 .. .. .. 0.0 .. Immunization, DPT (% of children under 12 months) 1.6 14.6 0.0 0.0 0.0 .. 15.0 3.1 -2.7 Improved water source (% of population with access) .. .. .. .. 0.0 .. .. .. .. Sanitation (% of population with access) .. .. .. .. 0.0 .. .. .. .. Life expectancy at birth, total (years) 0.4 0.6 0.4 0.5 0.5 0.3 0.3 0.3 0.1 Mortality rate, infant (per 1,000 live births) -4.2 -2.7 -4.0 -2.8 -2.5 -1.3 -2.7 -2.8 -1.1 GDP per capita (constant 1995 US$) -0.6 0.3 -2.1 -3.5 -4.5 -1.8 -3.0 0.4 1.8
1990 Illiteracy rate, adult total (% of people ages 15 and above) 14 22 11 12 20 8 11 15 30 School enrollment, primary (% gross) 118 95 102 117 115 99 96 106 102 Immunization, DPT (% of children under 12 months) 72 41 88 75 61 92 61 71 75 Improved water source (% of population with access) 72 74 87 .. 69 71 .. 81 73 Sanitation (% of population with access) 64 55 82 .. 54 86 .. 72 42 Life expectancy at birth, total (years) 66 58 68 67 62 69 71 68 63 Mortality rate, infant (per 1,000 live births) 54 80 30 45 60 37 25 41 66 GDP per capita (constant 1995 US$) 1,905 832 2,119 1,475 777 1,999 3,350 3,275 1,129
1997 Illiteracy rate, adult total (% of people ages 15 and above) 11 16 9 9 15 5 8 13 26 School enrollment, primary (% gross) 123 106 .. 113.. 89.. 116 106 Immunization, DPT (% of children under 12 months) 90 58 74 76 72 95 57 82 74 Improved water source (% of population with access) .. .. .. .. .. .. .. .. .. Sanitation (% of population with access) .. .. .. .. .. .. .. .. .. Life expectancy at birth, total (years) 69 61 71 69 65 68 73 70 64 Mortality rate, infant (per 1,000 live births) 36 62 22 30 44 29 21 32 60 GDP per capita (constant 1995 US$) 2,408 943 2,439 1,584 1,137 2,958 3,607 3,805 1,287
2000 Illiteracy rate, adult total (% of people ages 15 and above) 10 14 8 8 13 5 7 12 24 School enrollment, primary (% gross) .. .. .. .. .. .. .. .. .. Immunization, DPT (% of children under 12 months) .. .. .. .. .. .. .. .. .. Improved water source (% of population with access) 77 79 91 71 76 80 84 85 79 Sanitation (% of population with access) 76 66 85 59 66 96 74 78 52 Life expectancy at birth, total (years) 69 63 72 70 66 69 73 70 64 Mortality rate, infant (per 1,000 live births) 32 57 20 28 41 28 19 29 58 GDP per capita (constant 1995 US$) 2,368 952 2,290 1,425 994 2,805 3,300 3,856 1,356 Source: World Development Indicators (2002). * Some observations correspond to the period 1997-1999 or 1991-1997.

Annex 2 (continued) 37
Annex Table 2h: Peru – Trends in Social Indicators Average Annual Growth Rates
Peru 1980 1985 1990 1997 1999 2000 1980-1985 1985-1990 1990-1997 1997-2000* Illiteracy rate, adult total (% of people ages 15 and above) 20.5 17.3 14.5 11.3 10.5 10.1 -3.5% -3.5% -3.5% -3.8% School enrollment, primary (% gross) 114 120 118 123 .. .. 1.2% -0.3% 0.5% .. Immunization, DPT (% of children under 12 months) 16 48 72 90 93 .. 22.0% 8.1% 3.2% 1.6% Improved water source (% of population with access) .. .. 72 .. .. 77 .. .. .. .. Sanitation (% of population with access) .. .. 64 .. .. 76 .. .. .. .. Life expectancy at birth, total (years) 60 63 66 69 .. 69 0.9% 0.8% 0.6% 0.4% Mortality rate, infant (per 1,000 live births) 81 72 54 36 .. 32 -2.4% -5.8% -5.8% -4.2% GDP per capita (constant 1995 US$) 2,569 2,320 1,905 2,408 2,336 2,368 -2.0% -3.9% 3.3% -0.6%
Source: World Development Indicators (2002). * Growth Rate for Immunization is estimated for the period 1997-1999.

Annex 3 38
Annex Table 3a: External Assistance to Peru
I. Yearly Average Net Receipts from All Donors for CY 1980-2000, (US$ million) Donors 80-90 91-00 1998 1999 2000 Bilateral 276 1,311 621 875 598 Multilateral 145 409 542 779 228 o/w IBRD 51 154 207 291 173 o/w IDB 54 192 200 388 4 Other -1 3 19 4 Total 420 1,722 1,181 1,659 826 Memo Item GDP (current US$ million) 56,831 51,597 53,466 Source: Geographical Distribution of Financial Flows to Aid Recipients, OECD, CD 2002. World Bank SIMA database as of May 8, 2002. II. World Bank Commitments by Sectors for FY 1980-2001, (US$ million) Sectors 80-90 91-01 1999 2000 2001 Agriculture 312 146 10Economic Policy 750 Education 44 146 Electric Power & Energy 124 150 Finance 86 883 300Health, Nutrition & Population 34 114 80Mining 8 250 Oil & Gas 119 12 Private Sector Development 30 Public Sector Management 15 61 38Social Protection 455 5 100Transportation 151 440 50Urban Development 83 Water Supply & Sanitation 41 150 Total 1,015 3,587 338 95 150 Source: World Bank Business Warehouse as of September 14, 2001.

Annex 3 (continued) 39
Annex Table 3b: World Bank Lending Program Proposed in FY97 CAS versus Actuals FY98 FY99 FY00 FY01 CAS Actual CAS Actual CAS Actual Actual
Judiciary Reform 22 22.5 Urban Transport 100 Urban Property Rights 88 38 Water Res. Mgmt. TA 20 El Niño 150.0 Health Sector Reform 50 27 Urban Rehabilitation 100 Pension Adj. Loan II 100 Fin. Sector Adj. 300 Rural Roads 60 50 Rural Water 50 Ag. Research & Extension 50 9.6 Indigenous People 5.0 Programmatic Social Adj. 100 Memo Adjustment Loans 0 0 100 300 0 0 100 Investment & Others 230 22.5 150 38 160 41.6 50 Emergency 0 150 0 0 0 0 Source: 97 CAS and World Bank data.

Annex 3 (continued) 40
Annex Table 3c: Peru – Bilateral ODA Commitments by Purpose, CY1990–1995, US$m, yearly averages
Sectors Canada Germany Japan Netherlands United States
Other donors Total
BILATERAL ODA COMMITMENTS BY PURPOSE 25.8 88.6 176.7 17.6 95.0 55.2 458.9
Social Infrastructure and Services 2.9 22.2 10.1 2.8 27.5 14.8 80.3
of which Education 0.1 6.0 1.8 0.7 1.6 3.3 13.5
of which Health 0.1 0.9 5.6 1.2 4.1 3.3 15.2
of which Water supply and sanitation 0.9 8.8 1.6 0.3 4.8 16.4
Economic Infrastructure and Services 0.5 0.2 5.9 0.8 0.6 9.5 17.6
of which Energy 0.2 0.1 1.7 0.0 5.1 7.0
of which Transport and Communications 0.3 0.1 3.9 4.2 8.5
Production Sectors 2.1 4.5 7.2 6.0 4.8 7.4 32.1
of which Agriculture, forestry and fishing 1.4 2.5 6.3 5.1 2.6 5.1 23.0
of which Industry, mining and construction 0.7 1.3 0.7 0.9 0.4 2.4 6.3
Other 20.3 61.8 153.4 7.9 62.1 23.4 328.9
Peru: Bilateral ODA Commitments by Purpose, CY1996–1999, $USm, yearly averages
Sectors Canada Germany Japan Netherlands United States
Other donors Total
BILATERAL ODA COMMITMENTS BY PURPOSE 16.5 152.5 511.2 25.8 149.7 57.7 913.3
Social Infrastructure and Services 4.7 37.5 134.9 1.5 52.8 29.3 260.7
of which Education 1.3 9.9 2.4 0.2 0.4 9.6 23.8
of which Health 0.1 2.3 9.3 0.8 7.6 6.8 27.0
of which Water supply and sanitation 0.2 18.8 121.6 2.3 142.8
Economic Infrastructure and Services 1.8 20.5 260.2 3.1 2.3 1.8 289.8
of which Energy 0.8 126.9 3.1 0.2 0.3 131.3
of which Transport and Communications 0.2 18.8 132.1 0.0 0.8 151.9
Production Sectors 1.9 7.4 28.5 6.7 3.5 7.1 55.1
of which Agriculture, forestry and fishing 0.2 5.6 25.1 6.0 0.8 4.7 42.4
of which Industry, mining and construction 1.7 1.1 2.2 0.7 2.7 2.0 10.3
Other 8.1 87.1 87.6 14.5 91.1 19.5 307.7
Source: Geographical Distribution of Financial Flows to Aid Recipients, OECD, CD 2002. World Bank SIMA database as of May 8, 2002.

Annex 3 (continued) 41
Annex Table 3d: World Bank and Inter-American Development Bank Commitments for Peru by Sector, $US m
IDB and WB commitments by
sector Calendar years
Sector Group 1991 1992 1993 1994 1995 1996 1997 1998 1999 2000Grand Total
WB 12 150 162Electric Power & Energy/Oil & Gas IDB 35 52 86
WB 30 150 90 150 420Transportation IDB 210 252 90 300 852
WB 250 250Industry/Mining IDB 25 230 255
WB 85 51 10 146Agriculture IDB 21 46 67
WB 146 146Education IDB 102 102
WB 34 80 114Health, Nutrition & Population IDB 68 87 155
WB 100 150 100 5 355Social Protection IDB 100 150 150 29 120 549
WB 150 150Water Supply & Sanitation IDB 1 140 141
WB 400 183 300 883Finance IDB 0
WB 750 750Multisector IDB 100 100
WB 23 38 61Public Sector Mgmt. IDB 430 222 2 4 386 23 2 247 1,315
WB 1,180 362 630 90 235 507 38 390 5 3,436Grand Total IDB 640 222 204 494 140 689 219 560 454 3,622 Source: WB and IDB.

Annex 4 42
Annex Table 4: ESW and CAS List for Peru, 1980-2001
Report Title Date Report #
Economic Reports Peru - Major development policy issues and recommendations (Vol.1) 04/01/81 3438Peru - Country economic memorandum (Vol.1) 11/01/84 5267Peru - Country economic memorandum (Vol.1) 12/01/85 5806Peru - Policies to stop hyperinflation and initiate economic recovery (Vol.1) 12/15/88 7460Peru - Policies to stop hyperinflation and initiate economic recovery (Vol.2) 12/15/88 7460Peru - At the crossroads : building a modern state (Vol.1) 03/31/94 11943Peru - Public expenditure review (Vol.1) 10/31/94 13190Peru - Policy Notes (green cover) 06/30/00 20290 - PE
Sector Reports Peru - Urban policy (Vol.1) 10/01/81 3353Peru - The management and sale of state owned enterprises (Vol.1) 08/01/82 4088Peru - Issues and options in the energy sector (Vol.1) 01/01/84 4677Peru - Agricultural policies for economic efficiency (Vol.1) 09/11/92 10605Peru - Poverty assessment and social policies and programs for the poor (Vol.1) 05/05/93 11191Peru - Establishing a competitive market environment (Vol.1) 07/22/93 11446Peru - A private sector assessment (Vol.1) 03/31/94 12096Peru - A user-based approach to water management and irrigation development (Vol.1) 04/11/95 13642Peru - How problems in the framework for secured transactions limit access to credit (Vol.1) 06/06/97 15696Peru - Agricultural development strategy (green cover) 03/05/98 17270 - PEPeru - Improving health care for the poor (Vol.1) 05/28/99 18549Peru - Education at a crossroads - challenges and opportunities for the 21st century (Vol.1) 12/30/99 19066Peru - Education at a crossroads - challenges and opportunities for the 21st century (Vol.2) 12/30/99 19066Poverty and Social Developments in Peru, 1994-1997 05/01/99 19651
ESMAP Paper Peru - Energy assessment status report (Vol.1) 8/1/85 ESM40 Peru - Proposal for a stove dissemination program in the Sierra (Vol.1) 2/1/87 ESM64 Peru - Guideline study for a short- and medium-term strategy for the energy sector (Vol.1) 12/1/90 10359 Peru - Study of energy taxation and liberalization of the hydrocarbons sector (Vol.1) 12/1/93 ESM159 Elimination of lead in gasoline in Latin America and the Caribbean - Status Report (Vol.1) 12/1/97 ESM200 Peru : reform and privatization in the hydrocarbon sector (Vol.1) 7/1/99 ESM216 Best practices for sustainable development of micro hydro power in developing countries (Vol.1) 8/1/00 21640 Peru : rural electrification (Vol.1) 2/1/01 ESM238
Country Assistance Strategy Documents Peru - Country Assistance Strategy (Vol.1) 10/28/94 12997Peru - Country Assistance Strategy (Vol.1) 06/26/97 16796Peru - Country assistance strategy progress report (Vol.1) 03/30/01 22033Source: World Bank Imagebank3 database.

Annex 5 43
Annex Table 5a: Comparative OED Ratings
Country Total o/w Outcome Inst. Devel. Imp. Sustainability Evaluated Adjustment % Satisf. % Satisf. % Substan. % Substan. % Likely % Likely
$m $m Adj. Adj. Adj.
Projects approved before FY 1991 Bank wide 202,685 34,632 71 68 34 38 54 56 LAC 53,517 11,909 66 73 34 46 57 75 Peru 1,054 115 40 100 13 .. 16 .. Colombia 5,659 803 74 72 17 0 66 100 Thailand 3,640 326 91 100 49 .. 81 .. Bolivia 809 255 77 80 45 51 76 100 Ecuador 1,165 199 75 50 38 50 38 50 Projects approved in FY 1991-2002 Bank wide 103,201 51,464 83 85 49 46 70 73 LAC 26,160 12,693 84 88 55 60 72 74 Peru 2,689 1,933 98 100 79 84 96 100 Colombia 1,104 304 75 100 55 100 44 100 Thailand 2,054 1,350 99 100 42 56 99 100 Bolivia 406 146 90 100 67 100 65 100 Ecuador 688 180 73 44 16 0 45 0
1) The Institutional Development Impact and Sustainability ratings have been in use only since FY89. Hence, the data for these two ratings for the period before FY91 apply for smaller levels of total net commitment than shown in columns 2 and 3 of the table.
2) Source: OED ratings database as of March 30, 2002.
Annex Table 5b: Comparative Supervision Ratings
Country No. of
projects Net commit.,
$m Projects at risk,
% Commitment at risk % Bank wide 1,429 100,220 18 15 LAC 296 21,929 10 11 Peru 8 416 25 8 Colombia 22 1,473 9 6 Thailand 8 811 13 2 Bolivia 17 647 12 16 Ecuador 12 402 0 0 Source: World Bank Business Warehouse as of May 22, 2002.

Annex 5 (continued) 44
Annex Table 5c: Annual Review of Portfolio Performance, FY1990–2002
Fiscal year 1990 1991 1992 1993 1994 1995 1996 1997 1998 1999 2000 2001 2002
# Proj. in portfolio 2 1 3 4 7 10 10 12 12 11 12 9 8
Net Comm Amt 110 82.5 1,000 692 976 1,422 1,112 1,298 1,191 1,344 1,139 516 416
% At Risk 100 100 100 75 28.6 30 30 0 8.33 9.09 8.33 11.1 25
# Proj At Risk 2 1 3 3 2 3 3 0 1 1 1 1 2
% At Risk 100 100 100 75 28.6 30 30 0 8.33 9.09 8.33 11.1 25
Comm At Risk 110 82.5 1,000 680 650 434 330 0 85 85 150 27 32
% Commit at Risk 100 100 100 98.3 66.6 30.5 29.7 0 7.14 6.32 13.2 5.24 7.7 Source: Business Warehouse as of May 20, 2002.

Annex Table 6: Costs of Bank Programs for Peru and Comparator Countries, FY91-00 Costs Regions/ Total Costs * Lending Completion Supervision Costs ESW completion Countries US$ m Costs, ** US$ m US$ m Costs, US$ m Bank wide 2,982.3 1,243.0 1,150.8 815.3LCR 501.8 201.1 202.9 110.1Peru 26.1 11.8 6.8 7.5Bolivia 27.8 10.6 13.2 4.0Colombia 30.6 13.4 12.9 4.4Ecuador 23.8 9.5 10.7 3.6Thailand 25.3 11.8 7.5 6.0Percentages Bank wide 42% 39% 27%LCR 40% 40% 22%Peru 45% 26% 29%Bolivia 38% 48% 14%Colombia 44% 42% 14%Ecuador 40% 45% 15%Thailand 47% 30% 24% Efficiency Table Average Costs Memo Commitment Average Average Per $1,000 of Average Regions/ Countries
Total Cost* US$ m
Number of Projects
Commitment US$ m
for satis. & nonrisky proj., $m
Costs per Project, $ 1000
Cost per $1,000 of commitm.
Commitm. for satis. & non risky proj.
Proj. Size, $m
Bank wide 2,982.3 2,674 242,060 208,551 1,115 12.3 14.3 91LCR 501.8 554 60,014 51,448 906 8.4 9.8 109Peru 26.1 27 3,586 3,484 965 7.3 7.5 133Bolivia 27.8 34 1,114 864 817 24.9 32.2 33Colombia 30.6 35 3,483 3,158 875 8.8 9.7 100Ecuador 23.8 24 1,288 959 991 18.5 24.8 54Thailand 25.3 25 3,793 3,617 1,012 6.7 7.0 152Source: World Bank CRM database as of September 21, 2001. * The amount of total costs includes lending completion costs, supervision, scheduled and unscheduled ESW, and dropped project costs. ** The amount of lending completion costs includes lending completion costs and dropped project costs.

Annex 7 46
Annex Table 7: Peru: Bank's Senior Management, CY 1991-2001
Year Vice President Country Director Chief/Resident Representative
1991 S Shahid Husain Armeane M. Choksi … 1992 S Shahid Husain Armeane M. Choksi … 1993 S Shahid Husain Rainer B. Steckhan … 1994 Shahid Javed Burki Rainer B. Steckhan … 1995 Shahid Javed Burki Yoshiaki Abe Fred Levy 1996 Shahid Javed Burki Paul Isenman Fred Levy 1997 Shahid Javed Burki Paul Isenman/Isabel Guerrero Fred Levy
(since July 1, 1997) 1998 Shahid Javed Burki Isabel Guerrero Fred Levy/Various staff acting:
Oswaldo Patino,
Livia Benavides, Noriko Iwase,
Luis Chang/Pierre Werbrouck (since October 1998)
1999 Shahid Javed Burki/ Isabel Guerrero Pierre Werbrouck David de Ferranti (since July 1, 1999)
2000 David de Ferranti Isabel Guerrero Pierre Werbrouck 2001 David de Ferranti Isabel Guerrero …
* Source: The World Bank Group Directory 1990-2001.

47 Appendix A
Overview of IFC Operations
Context: IFC’s activities in Peru have been affected by the country economic and political contexts. After the election of Alan Garcia as president in 1985, economic conditions in Peru deteriorated, and the IMF placed Peru on non-accrual status in 1986, with the World Bank following suit in 1989. With the 1990 election of Alberto Fujimori, a program of economic stabilization and structural reforms began. A key component was the privatization of state-owned enterprises. Reflecting the improving investment climate, IFC had its highest number of approvals, 24, in the 1990s. Economic growth was strong through 1997, but in 1998, El Nino’s impact on agriculture, the Asian financial crisis, and instability in Brazil undercut growth. Fujimori’s departure from office in 2000, following charges of corruption in his administration, introduced more political uncertainty with negative impact on private investment, and continuing economic slowdown. Even as economic reforms in Peru began to stall after 1997 and private capital flows to Peru declined, IFC’s investment program in Peru remained robust. The new government of Alejandro Toledo began in 2001, facing political and economic challenges, including a heavy external debt burden.
IFC Investment portfolio: Between March 1960 and March 2001, IFC approved 56 investments in 36 companies in Peru, totaling $819 million in financing (including $360 million from participants; $459 million from IFC’s own account), contributing to $2.5 billion in total project financing. Manufacturing, mining, and agribusiness are the sectors with the largest numbers of IFC approvals. IFC’s activities overall have been geared to post-privatization expansions of Peruvian companies.
Portfolio performance overview: Fourteen of the active investments have reached early maturity and could be evaluated. OEG supplemented four existing evaluations with “mini-evaluations” of the remaining ten investments, based on desk reviews. The resulting ratings are independent judgments of each project’s financial viability, environmental and social impacts, and broader development impacts in relation to approval expectations. The development outcome of eight among the 14 investments was rated satisfactory; six were rated less than satisfactory.
IFC’s non-investment activities: IFC has executed 12 Technical Assistance Trust Funds projects in Peru (see IFC table 2). The sectors covered were: financial markets (4), agribusiness (3), mining (2), textiles (2), and logistics (1). Three of the 12 projects led to investment projects. Nine of the 12 projects were technical in nature and the other three market-oriented. Three of the 12 projects are still active, but only one has been evaluated to date, rated satisfactory. In 1995, the Foreign Investment Advisory Service (FIAS) initiated a major diagnostic study on Peru’s investment climate. Though the FIAS study recommended the establishment of a Peruvian investment promotion agency, the Fujimori government did not accept the recommendation. FIAS is currently discussing the issue with the Toledo administration.
Privatization: Privatization has been a key component of economic reforms in Peru, and IFC Investment Staff view the current administration as ready to complete the privatization agenda. IFC has supported the privatization program in various ways, financing post-privatization programs as well as providing advisory services.
Investment climate: Although Peru moved from a high-risk country to a medium-risk country in 1997 (based on Institutional Investor Credit Risk ratings), net foreign direct investment flows have declined steadily since 1997. IFC’s Operational Department staff hope that the resolution of political uncertainty and the new administration will improve this situation. However, they identify major unresolved issues: follow-through on commitments by some Peruvian business groups and weak corporate governance, including inadequate board oversight. They identify the principal constraint Peruvian companies face as access to long-term finance; IFC’s primary role in projects has been to ease this finance constraint.
IFC’s record in relation to the Country Assistance Strategy (CAS) for Peru: IFC had little involvement with the 1994 CAS. In the 1997 CAS, IFC objectives emphasized mining and financial sectors; infrastructure, agribusiness, tourism, petroleum, and manufacturing were also noted. IFC’s approvals following this CAS reflect the implementation of the strategy in agribusiness and financial sector. There were no investments in infrastructure and petroleum as reforms slowed. Institutional strengthening in the regulatory framework for mining was not a key focus in the 1997 CAS, but subsequently, issues arose around environmental management and sharing of tax revenues between central and local governments, investors and local communities. With these developments, only one new IFC investment has been made in mining. The upcoming (July 2002) CAS will address mining issues; . the mining sector is currently part of an ongoing review of extractive industries by OED, OEG, and the industry departments. Source: Operations Evaluation Group: Desk Review and Discussions with IFC Investment Department Staff
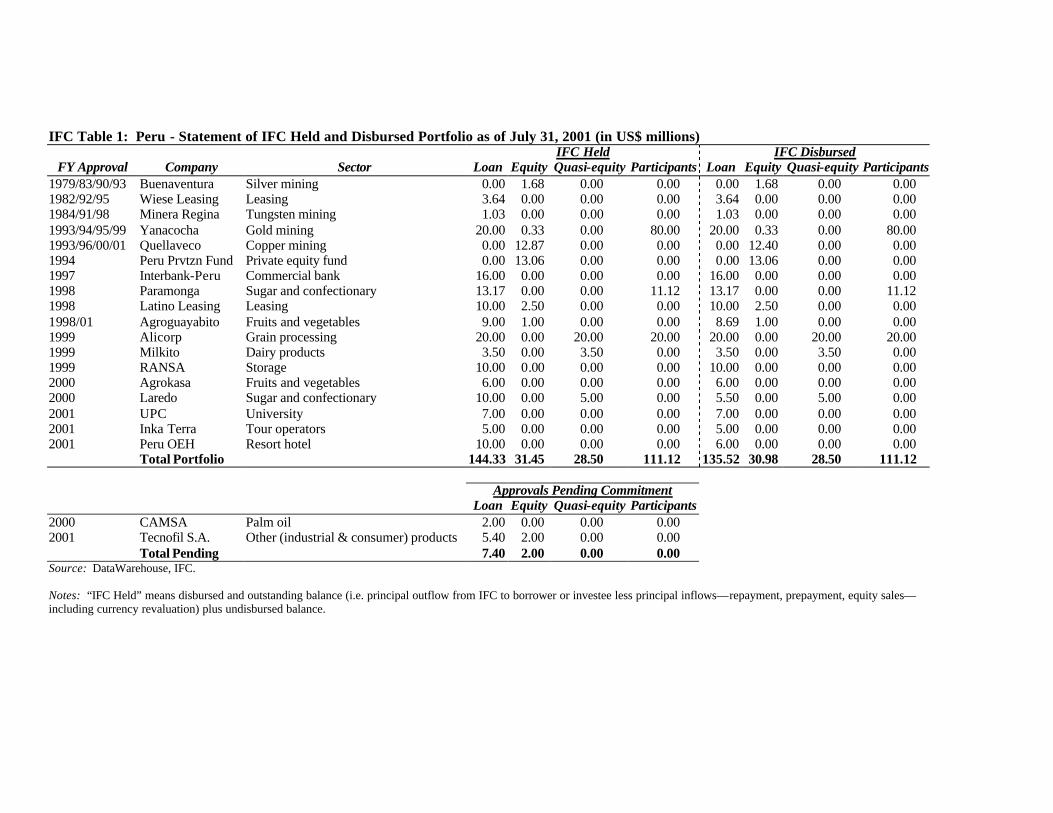
IFC Table 1: Peru - Statement of IFC Held and Disbursed Portfolio as of July 31, 2001 (in US$ millions) IFC Held IFC Disbursed
FY Approval Company Sector Loan Equity Quasi-equity Participants Loan Equity Quasi-equity Participants1979/83/90/93 Buenaventura Silver mining 0.00 1.68 0.00 0.00 0.00 1.68 0.00 0.00 1982/92/95 Wiese Leasing Leasing 3.64 0.00 0.00 0.00 3.64 0.00 0.00 0.00 1984/91/98 Minera Regina Tungsten mining 1.03 0.00 0.00 0.00 1.03 0.00 0.00 0.00 1993/94/95/99 Yanacocha Gold mining 20.00 0.33 0.00 80.00 20.00 0.33 0.00 80.00 1993/96/00/01 Quellaveco Copper mining 0.00 12.87 0.00 0.00 0.00 12.40 0.00 0.00 1994 Peru Prvtzn Fund Private equity fund 0.00 13.06 0.00 0.00 0.00 13.06 0.00 0.00 1997 Interbank-Peru Commercial bank 16.00 0.00 0.00 0.00 16.00 0.00 0.00 0.00 1998 Paramonga Sugar and confectionary 13.17 0.00 0.00 11.12 13.17 0.00 0.00 11.12 1998 Latino Leasing Leasing 10.00 2.50 0.00 0.00 10.00 2.50 0.00 0.00 1998/01 Agroguayabito Fruits and vegetables 9.00 1.00 0.00 0.00 8.69 1.00 0.00 0.00 1999 Alicorp Grain processing 20.00 0.00 20.00 20.00 20.00 0.00 20.00 20.00 1999 Milkito Dairy products 3.50 0.00 3.50 0.00 3.50 0.00 3.50 0.00 1999 RANSA Storage 10.00 0.00 0.00 0.00 10.00 0.00 0.00 0.00 2000 Agrokasa Fruits and vegetables 6.00 0.00 0.00 0.00 6.00 0.00 0.00 0.00 2000 Laredo Sugar and confectionary 10.00 0.00 5.00 0.00 5.50 0.00 5.00 0.00 2001 UPC University 7.00 0.00 0.00 0.00 7.00 0.00 0.00 0.00 2001 Inka Terra Tour operators 5.00 0.00 0.00 0.00 5.00 0.00 0.00 0.00 2001 Peru OEH Resort hotel 10.00 0.00 0.00 0.00 6.00 0.00 0.00 0.00 Total Portfolio 144.33 31.45 28.50 111.12 135.52 30.98 28.50 111.12 Approvals Pending Commitment
Loan Equity Quasi-equity Participants 2000 CAMSA Palm oil 2.00 0.00 0.00 0.00 2001 Tecnofil S.A. Other (industrial & consumer) products 5.40 2.00 0.00 0.00 Total Pending 7.40 2.00 0.00 0.00 Source: DataWarehouse, IFC. Notes: “IFC Held” means disbursed and outstanding balance (i.e. principal outflow from IFC to borrower or investee less principal inflows—repayment, prepayment, equity sales—including currency revaluation) plus undisbursed balance.

Appendix A (continued) 49
IFC Table 2: IFC’s Technical Assistance Trust Funds Projects in Peru # Approval date Assignment Description Amount 1 1/25/1989 Gold and silver from dole
concentrate Technical study. $110,000
2 7/19/1991 Hiero Peru Iron mine Technical audit. $14,0943 8/18/1995 Tejidos La Union Assess an integrated textile operation and
viability of a rehabilitation plan through restructuring and modernization.
$45,000
4 12/26/1995 Financial infrastructure design with focus on mutual funds
To support growth of capital markets and financial system infrastructure for small investor participants in the Programa de Participacion Ciudadana, a predecessor to the creation of the mutual fund industry.
$161,000
5 11/12/1997 Financial infrastructure design with focus on mutual funds
To continue supporting the growth of capital markets and financial system infrastructure for small investor participants in the Programa de Participacion Ciudadana, a predecessor to the creation of the mutual fund industry.
$60,000
6 1/28/1998 Textile market study To study Fabritex Peruna’s market position as well as the competitive position of the Peruvian cotton textile sector within a global context.
$75,000
7 2/10/1008 Development of a mutual fund industry
To complete the development work (shown in 4 and 5 above); this implementation phase would help expand the equity mutual fund.
$170,000
8 4/29/1998 Agroguayabito S.A., appraisal report
To assess the market risk for processed asparagus and tomato paste products, in the context of the Peruvian agribusiness sector.
$20,000
9 3/31/1999 CAMSA: Developing and environmental management system and marketing strategy
To develop an environmental management system and marketing strategy for the Hearts of Palm project in Iquitos, Peru.
$20,000
10 9/8/1998 Agroguayabito To monitor the technical parameters for industrial tomato paste production and train local staff.
$96,400
11 3/22/1999 Establishment of a secondary mortgage market entity
To assess the current status of the Peruvian housing finance system.
$60,000
12 12/14/2000 Establishment of combined wholesale market and logistics and distribution center in the city of Chiclayo.
To review the criteria for the formation of a warehouse and distribution center and wholesale market on a shared site in the northern Peruvian city of Chiclayo.
$72,000
Total $903,494 Source: Trust Funds Department, IFC.

Appendix B 50
MIGA Activities in Peru
Peru is MIGA’s third-largest client country in terms of outstanding exposure with a gross maximum liability of $298 million1 (as of June 30, 2002), accounting for 5.6 percent of MIGA’s total gross exposure. MIGA Guarantees
Peru became a member of MIGA on December 2, 1991. Between FY92 and FY02, MIGA supported 19 projects, facilitating estimated foreign direct investments of $3.4 billion. The cumulative issued maximum aggregate liability related to these projects amounted to $651 million. MIGA-insured projects were concentrated in the financial sector (8 projects), mining (3), and manufacturing (3). MIGA also supported projects in infrastructure, services, and tourism. Ten projects remained active in MIGA’s portfolio as of June 30, 2002.
MIGA underwrote its first guarantee in Peru during FY94. The most active years in terms of the number of new projects supported were the mid and late 1990s, while in terms of coverage issued, FY00 has thus far been the most intensive, with a guarantee volume of $213 million.
MIGA’s largest project in Peru to date, Compañia Minera Antamina S.A. (Antamina), involves the development and operation of Peru’s largest copper and zinc mine, with an estimated FDI of $2.1 billion. MIGA issued six guarantees totaling $107.5 million in support of the project during FY99 and FY00. The mine began full production in November 2001 and it is estimated that it will account for approximately 1.5 percent of Peru’s GDP. While the company had actively sought the involvement of affected local communities, some problems arose during the resettlement process. MIGA environmental and social experts have repeatedly visited the project and local communities to help improve relationships between them. Antamina’s community development plan has been awarded national recognition as an example of community consultations and social corporate responsibility.
MIGA has not received nor paid any claim in Peru.
Investment Marketing Activities
In June 2000, Peru participated in a joint UNCTAD/MIGA regional workshop on investment promotion for representatives from the member countries of the Andean Community. Assessment of MIGA Guarantee Operations
OEU has evaluated the development effectiveness of six mature projects which were supported between FY94 and FY97. In general, the projects were found to have had positive impacts in Peru. All but one are in the financial sector. Most of the mining projects MIGA had supported were cancelled by the investors before reaching maturity for MIGA evaluation.2 The manufacturing project which was evaluated involved the privatization of a zinc refinery.
Two pension fund management companies whose investors were insured by MIGA were evaluated in FY98. MIGA issued guarantees shortly after the pension reform and liberalization
1 MIGA’s net exposure was $190 million, or 5.9 percent of total liabilities. 2 Among the cancelled projects is Minera Yanacocha S.A., a joint IFC-MIGA project which has been evaluated by OEG. The Antamina project underwritten in FY99 is not mature enough for an evaluation.

51 Appendix B (continued)
(supported by an IBRD loan) in FY94 and FY95. MIGA insurance supported two of the five pension fund management companies, and IFC invested in another one. At the time of the evaluation (FY98), Integra had 456,663 partic ipants (or a 24.7 percent market share) and Profuturo had 450,266 participants (24.4 percent).
Both operations were rated “outstanding” in terms of their human capital investment and impacts on financial and capital markets. They have supported the implementation of private pension funds and, indirectly, contributed to an increase in domestic savings. The pension funds have generated employment in two ways: direct jobs at the fund management companies and indirect jobs via contracted administrative services and suppliers. The two projects have also contributed in a significant way to the growth of capital markets. They promoted the creation of new financial instruments and enhanced the further development of those already in existence.
Another evaluated project, the expansion of customer financing operations for Volvo’s local manufacturer of buses and trucks has allowed the company’s sales to grow, stimulating local sourcing. Consequently, the project was rated as “outstanding” in terms of downstream effects.
The results of the evaluations of two financial projects in FY01 were affected by the repercussions of the economic and financial crisis in Peru in the late 1990s. The crisis had an adverse impact on business volume, employment, training budgets, and the number of branches. One of the projects was successful in terms of becoming Peru’s second-largest provider of mortgages and leases; it introduced longer tenors to the market. It also induced other banks to offer new products and lower interest rates for clients. The mortgage products were catered to private individuals in Lima. OEU rated this project as “outstanding” in terms of its sectoral impacts. The second project focused on large corporations and a small residential mortgage program, and proved to be one of the more profitable banks in Peru.
The evaluated zinc refinery was one of the first privatizations of state-owned enterprises. As such, its successful completion had an outstanding demonstration effect. It was also noteworthy that, despite rationalizations and modernization, the number of employees was reduced only marginally, through attrition, rather than lay-offs. The operation is export-oriented and has generated outstanding macro-economic effects. It has also improved worker safety measures and wastewater treatment and is enhancing air emissions control.

MIGA Guarantees Issued in Peru 11/7/2002
No. Investor Investor Country
Project Enterprise Project Description Sector FY Effective Date
Coverage
Maximum Aggregate
Liability (US$)
Total Project Investment (US$)
FDI (US$) Estimated Local Jobs
Created
1 Compagnie Miniere Internationale Or France Mining 94 8/31/93 BC 1,404,000 47,281,387 47,281,387 1562 Compagnie Miniere Internationale Or France 94 11/14/93 BC 5,040,0003 Newmont Mining Corporation United States 94 10/21/93 BC 2,160,0004 Newmont Mining Corporation United States 94 10/21/93 BC 5,616,0005 Union Bank of Switzerland Switzerland 94 11/18/93 ABC 18,961,0006 Union Bank of Switzerland Switzerland 95 12/21/94 ABC 5,700,0007 Mine Or S.A. France 95 2/10/95 BC 6,404,0008 Newmont Mining Corporation United States 95 1/17/95 ABC 14,408,387 40,200,000 34,800,000 529 Citibank Overseas Investment
CorporationUnited States 94 9/8/93 ABC 1,800,000
10 Citibank, N.A. United States 94 9/14/93 ABC 3,024,00011 Internationale Nederlanden Bank, N.V. Netherlands Administradora de Fondos de
Pensiones Integra, S.A.Expansion of a pension fund Financial Services 95 7/1/94 AB 15,000,000 12,500,000 12,500,000 0
12 Cyprus Climax Metals Company United States Sociedad Minera Cerro Verde, S.A. Privatization, modernization and expansion of copper mine
Mining 95 8/23/94 ABC 50,000,000 154,000,000 141,000,000 0
13 BHP Copper Inc. United States Magma Tintaya S.A. Privatization and expansion of copper mine
Mining 95 6/1/95 ABC 24,000,000 328,000,000 328,000,000 0
14 Marubeni Corporation Japan Sociedad Minera refineria de Zinc de Cajamarquilla S.A.
Privatization of zinc refinery Manufacturing 96 7/3/95 ABC 9,360,000 61,000,000 61,000,000 0
15 Volvo Truck Corporation Sweden Volvo Peru S.A. Expansion of leasing company Financial Services 96 7/31/95 ABC 27,000,000 30,000,000 30,000,000 52
16 Banco Santander, S.A. Spain Banco Santander - Peru S.A. Expansion of branch banking operations Financial Services 97 1/15/97 AB 19,000,000 15,000,000 15,000,000 29
17 Citibank, N.A. United States Citibank, N.A. Lima Branch Branch expansion Financial Services 97 3/28/97 AB 13,500,000 15,000,000 15,000,000 0
18 BankBoston United States BankBoston, Peru Branch Branch expansion Financial Services 97 5/1/97 AB 15,000,000 104,000,000 104,000,000 8
19 Banco Santander S.A. Spain Banco Santander S.A.-Peru Expansion of bank's mortgage portfolio Financial Services 98 3/19/98 AB 15,399,687 15,000,000 15,000,000 144
20 Marriott International, Inc. United States 98 3/31/98 AB 4,500,000 51,000,000 35,000,000 34121 Marriott International, Inc. United States 98 3/31/98 AB 2,700,000
22 Bank of Nova Scotia Canada Inversiones La Rioja S.A. 98 6/30/98 ABC 27,000,00023 Banco Santander S.A. Spain Praxair Peru S.A. 98 6/30/98 AB 10,718,69324 S.A. White Martins Brazil 99 8/6/98 AB 2,679,673
25 Citicorp Canada Compania Minera Antamina S.A. 99 6/30/99 A, B, C 60,702,00026 Noranda Inc. Canada 99 6/30/99 A 2,550,00027 Rio Algom Limited Canada 99 6/30/99 A 2,550,000 2,106,000,000 2,106,000,000 128928 Teck Corporation Canada 99 6/30/99 A 1,700,00029 Mitsubishi Corporation Japan 2000 10/26/99 A 16,250,04730 Mitsubishi Corporation Japan 2000 10/26/99 A, B 23,709,95331 Banco Santander Central Hispano
S.A., New York BranchSpain Banco Santander Peru Addition of small-scale lending in the
form of long-term finance services to Banco Santander's branch operations in Peru
Financial Services 2000 12/23/99 A,B 50,908,125 100,000,000 100,000,000 0
32 Hydro-Quebec International, Inc Canada Consorcio Transmantaro S.A. 2000 12/28/99 A,B,C 61,150,000 164,100,000 151,600,000 3033 Hydro-Quebec International, Inc Canada 2000 12/28/99 A,B,C 20,187,50034 Hydro-Quebec International, Inc Canada 2000 5/24/00 A,B,C 16,150,00035 Hydro-Quebec International, Inc Canada 2000 5/24/00 A,B,C 24,225,000
36 Matsui & Co. (USA) Inc. United States Matsui del Peru S.A. Expansion of trading and investment activities
Other Services 2001 6/27/01 A,B 1,000,000 3,000,000 3,000,000 0
37 Banque Sudameris S.A. France Banco Wiese Sudameris Expansion of bank operations Financial Services 2002 5/31/02 A,B 58,428,583 50,000,000 50,000,000 038 Fraport AG Germany Lima Airport Partners S.R.L. Rehabilitation, development and
operation of Lima's international airportInfrastructure 2002 5/29/02 B 11,542,500 166,000,000 157,300,000 49
651,429,148 3,504,714,405 3,431,614,405 3720
Total Issued (June 30, 2002) Contracts: 38 Projects: 19Total Active (June 30, 2002) Contracts: 16 Projects: 10
Types of Coverage: A - Currency Inconvertibility
Tourism
Mining
Infrastructure
Lima Marriott Hotel as the project enterprise; Inversiones La Rioja, S.A.as the operating entity.
Construction and operation of a Marriott hotel in Lima
Minera Yanacocha Construction and operation of a gold mine
Profuturo, S.A. Establishment and operation of a Pension Management Fund
Financial Services 10,000,000 156421,000,000
21,633,018
Development of an open pit copper, zinc and molybdenium mine, concentrator and associated infrastructure
Design, construction and operation of a 220kV electrical transmission line linking the Central Northern Interconnected System to the Southern Interconnected System of Peru
ManufacturingExpansion and modernization of an industrial gases company, through construction and operation of a new plant.
15,133,018 6

Appendix C 53
Reform Backtracking and Weakening Governance 1996-99 Reversals in Economic Reforms Weakening Governance
March 1996 State Capitalization of Tax Debt from Sugar Companies: The government established a tax alleviation program, Programa Extraordinario de Regularización Tributaria (PERTA), allowing sugar companies to eliminate their debt to the public sector either by paying upfront 60 percent of its value or transferring stocks to the government for 70 percent of the original debt value.
November 1996 Preferential Tax Regime to Agricultural Producers: Congress approved legislation that granted a preferential tax regime to agricultural producers until 2001. Tax benefits included a reduced 15 percent income tax, lower contributions to the social security system, and the elimination of the minimum income tax and the Housing Fund contribution (FONAVI), unnecessarily complicating tax legislation and reducing the tax effort. As was the case with the PERTA, this preferential regime responded to the pressure of politically strong individuals and did not benefit the poorest producers of the agriculture sector who are mainly informal.
November 1996 Tax Amnesty to Agricultural Producers: In November 1996, the government deferred tax arrears from agriculture producers by 24 months. After this period, debt could be repaid in 96 monthly payments. Furthermore, this amnesty program offered a 60 percent tax reduction to agricultural producers that would immediately cancel their tax arrears.
April 1997 Protection on Agricultural Imports: A Supreme Decree lowered the two-level tariff regime from 25 percent and 15 percent to 20 percent and 12 percent of CIF prices, with agricultural products mainly included among the higher level. However, this legislation switched additional agricultural imports from the lower to the higher level of the tariff system and imp osed a 5 percent fixed surcharge to compensate for the tariff reduction. Thus, the effective result of this law was an increase in agricultural protection and tariff dispersion.
November 1997 Backtrack in Privatization Agenda: The government decided not to give Lima’s water and sewerage company (SEDAPAL) under concession, although there were pressing needs for large investments, especially to improve the sewerage system that currently creates major environmental damage. Following this decision, the Fujimo ri regime brought to a standstill the privatization program in oil and electricity generation, and indefinitely postponed concessions of ports and airports.
June 1998 Politicization of Social Fund FONCODES: Replacement of Alejandro Afusso, the successful and independent executive director of FONCODES, by Tomas Gonzalez Reategui, when it was widely known that the latter was within the closest political circle of the President. Project Status Reports evaluated negatively this change in leadership and expressed growing concerns about political interference in this institution.
March 1998 Weakened Consejo Nacional de la Magistratura (CNM). Amidst growing concerns about the lack of independence of the judicial system, Congress passed Law No. 26933 effectively undermining the authority of CNM, the entity responsible for the selection and removal of judges.

Appendix C (continued) 54
Reversals in Economic Reforms Weakening Governance
October 1998 Use of public funds deposits to support small banks. In mid-1998 the Fujimori government decided to allocate public funds in small, fragile banks in an effort to preserve financial stability. However, given the high concentration of the Peruvian banking system in large banks, it is arguable that the potential failure of the supported banks imposed any significant threat to the system. Public funds were mainly deposited in domestic currency when interest rates were around 34 percent in real terms. The bank selection criteria was never made public, and six out of the seven banks chosen to deposit these funds are currently under intervention or liquidation. This policy was a clear sign of the absence of transparency and lack of technical criteria that the government would demonstrate in more recent banking resolutions.
December 1998 Amazon Investment Promotion Law: This law grants tax exemptions and reductions in the income tax, the general sales tax, the special solidarity tax and the natural gas, petroleum, and derivatives tax, on most economic activities in the Amazon Region. The law includes provinces in 15 out of the 24 departments in the country. This law not only introduced price distortions and eroded tax revenues significantly, but it also fostered natural resource exploitation contributing to recent forest depletion.
January 1999 Political Replacements at MEF: In January 1999, prestigious economist Jorge Baca, resigns as Minister of Finance, and is replaced by the President of the Fujimori-dominated congress, Victor Joy Way. The team of advisors to the Minister, technocrats that promoted and carried out the most successful reforms of the Fujimori regime, also resigned amidst growing evidence of the lack of political will to maintain sound and responsible economic policies.
Early 1999 Expansion of TANS: The government not only slowdown the privatizations program, but actually reversed it by creating a National Airline (TANS), managed by the Air Force. Although the airline was created to provide service to some remote destinations not served by private providers, in 1999 TANS was already flying in the most profitable routes from Lima to Cuzco, Arequipa, Trujillo, and Chiclayo.

Appendix D 55
IADB, Office of Evaluation and Oversight, OVE Country Program Evaluation (CPE) PERU: 1990–2000
EXECUTIVE SUMMARY
In July 1990 when the new government of Peru took office, it faced two major challenges. First, it needed to address the immediate hyperinflationary-macroeconomic crisis, the re-insertion into the international financial community and to defeat terrorism. Second, it needed to find a viable long-term development strategy for the country, one, which could prove effective in dealing with three development challenges.
These development challenges included the following. First, an economy built upon capital-intensive primary product exporting which not only rendered the economy vulnerable to external shocks, (a cyclical problem) but also was unable to generate employment at rising wages (a structural problem). Second, a historical policy pendulum pattern swinging from pro-market which generated output, but not employment and contributed to high levels of social inequality to state intervention (which was temporarily successful in its quest, but led to large macroeconomic imbalances). The third challenge was the absence of successful intermedia tion of interests and the development of broad inclusive social compacts and their institutional basis in a participatory democratic context.
The country, supported by the Bank among others, embarked on an intensive macroeconomic stabilisation cum pro-market structural reform program. Macroeconomic imbalances were reduced and hyperinflation tamed. With the structural policies adopted Peru went, within a few years, from below the regional average to a pacesetter in pro-market policies. These policies not only contributed to surmounting the immediate crisis, but also appear to have laid the foundation for economic growth. Both domestic and foreign private investment and total factor productivity significantly increased and economic allocative efficiency improved. However, the intensity-speed of the reforms came at a cost. Vertical (with civil society) and horizontal (with the legislative and judicial branches of the state) accountability weakened to facilitate the speed of the reforms.
During the decade, Peru was the focal point for development assistance from both multilateral and bilateral institutions. The IDB was the first multilateral creditor to have its arrears cleared by Peru, and was the largest source of financing for the entire period. The Bank approved 227 discrete operations for Peru. Loans totalled $3.8 billion and non-reimbursable technical co-operation operations amounted to $97 million.
Interviews with authorities in Peru reveal a high degree of satisfaction with Bank’s de facto program. Indeed it should receive high marks for relevance. The Bank was deeply engaged in virtually all of the important issues facing the country. On efficiency, a review of the Peru portfolio shows a pattern of disbursements, and portfolio characteristics, which are significantly more positive than the Bank’s average. This result is indicative of the high local ownership of the program combined with effective collaboration between a very proactive Country Office and the Ministry of Economy and Finance. On efficacy, the picture is mixed: while most policy changes supported by the Bank were achieved, outcome results were less than anticipated. The Bank was relatively effective in promoting policy changes to enhance productivity, strengthen institutions of economic governance, and ensure targeted transfers to the extreme poor (contributing to reducing extreme poverty by almost half), as well as improving access to basic services such as water, education and health. In addition, it contributed towards removing bottlenecks in

Appendix D (continued) 56
infrastructure. The Bank’s exhortations for improving governance (reform of the executive, promotion of decentralisation) did not lead to policy changes (except for the institutions of economic governance) and the promotion of autonomy of regulatory agencies achieved less than the desired results.
Outcomes expected from the structural policies supported by the Bank produced significantly fewer positive results than had been anticipated. Indeed, with the exception of macroeconomic stability, many of the key challenges at the start of the 1990s remain challenges ten years later. The economy remains dependent on capital intensive, natural resource based, exports. Export diversification has not yet been realised to a desired level, partly due to the economy’s transformation being uncompleted, hence today the country is sensitive to terms of trade shocks. In addition, Peru continues to be unable to generate employment with rising real wages and to reduce the level of poverty. The institutional structure of governance in a democratic setting remains weak. Public opinion polls increasingly emphasis the problems of low wages, unemployment, poverty, and the lack of credibility of public institutions. The failure to overcome these structural problems contributed to the surprisingly rapid dismantling of the Fujimori Administration.
These unresolved development challenges remain in the agenda for both the Bank and the country. The extent to which that unfinished agenda is tackled in the coming years will determine whether the 1990s was just another turn of the policy pendulum. Indeed, sustainability is the most difficult area in which offer an informed evaluative judgement. During the post-reform period, during the late nineties, there was retrogression in structural policy stance in practically all areas: tax policy and administration, trade policy, labour market flexibility, and a weakening of the autonomy of regulatory agencies. Nonetheless, public opinion polls suggest that macro-structural reforms appear to enjoy support, and the downturn of 1998-2000 does not appear to have generated widespread calls for a total repudiation of the orthodox model. Thus, for both the Bank and the country, the ability to consolidate existing reforms and tackle the country’s remaining structural problems is the “unfinished agenda” which will determine if the 1990s were the beginning of a genuine transformation of the economy and society, and the elimination of the historical pendulum.

57 Attachment A
Comments Received from the Government and OED’s Response1
Government’s Comments OED’s Response It is not clear what the CAE means in paras 4.8 and 4.9, where it suggests that the Bank had evidence of corruption and, despite that, continued to lend. This needs clarification, as does the methodology used in preparing a CAE.
The CAE's argumentation centers on deteriorating governance, reversal of structural reforms and weakening of macro-economic management. It stresses the anomaly of disbursement of a large tranche of an adjustment operation despite the public outcry triggered by corruption revelations pictured in the media. OED's methodology for CAEs is available on its web-site: http://www.worldbank.org/oed/eta-cae_method.html
The interpretation that when the Bank strategy was applied outcome was satisfactory, but unsatisfactory otherwise, is biased, to say the least.
The CAE states explicitly that the Bank's role is small vis-a-vis other factors. During the first half of the 90s, when government policies were reformist and led to growth, they received Bank support and the outcome of that support is rated as satisfactory. During the late 90s, the Bank provided budget support without attempting to address fiscal erosion and other policy reversals, with negative consequences for sustainable growth. For this period, OED rates the outcome of the Bank's assistance program as unsatisfactory.
The success of a program depends largely on ownership by the implementing team. We think that if the Bank had supported more strongly the technocratic group, several of the necessary reforms would have been implemented.
OED fully agrees that "a more firm approach of the Bank and other donors (in the late 90s) would have had a significant chance of holding back the reversal in policy reform". (see para 2.25 of the CAE).
The Programmatic Social Reform Loan was a carefully designed operation resulting from wide consultations with Peruvian professionals, the private sector, donor agencies and civil society. It contained a Basic Outline of medium-term social policy, transcending the interim Government.
To the extent that the loan was primarily budget support to an outgoing care-taker Government, the CAE questions the appropriateness of the lending instrument, in the absence of a medium-term framework,. This is not the same as a "Basic Outline." Most importantly, the loan did not address the fundamental issue of the inadequacy of domestic budgetary funds for social expenditure.
In order to give better information on the benefits derived from the two loans providing free foreign exchange (the Financial Sector Adjustment Loan and the Programmatic Social Reform Loan), two Aide Memoires are attached to our comments.
The Aide Memoires are available upon request.
1 This is a summary of the key comments. The Government’s letter is attached.

Attachment A (continued) 62
Government’s Comments on the Draft CAE (translation of Spanish letter)
Republic of Peru MINISTRY OF ECONOMY AND FINANCE OFFICIAL LETTER NO. 0612-2002-EF/UC-PS Lima, July 30, 2002 Mr. Ruben Lamdany Manager Country Evaluation and Regional Relations Operations Evaluation Department The World Bank Lima, Peru Re: Peru - Country Assistance Evaluation (CAE) I am pleased to write to you at the behest of Mr. Javier Silva Ruete, Minister of Economy and Finance, with respect to the Peru - Country Assistance Evaluation, referred to hereinafter as Peru – CAE, sent to the former Minister, Pedro Pablo Kuczynski Godard in June of this year. In this regard, please note that the Peru – CAE document was reviewed by various agencies of the Ministry, particularly the agencies that were directly involved in the administration, follow-up, oversight, and, in some cases, execution of the operations covered by the document “1997 Country Assistance Strategy for Peru.” In this context, in my capacity as Head of the Sector Lending Coordination Unit of the Ministry of Economy and Finance – the negotiating agency for unrestricted loans, I would like to comment on the remarks made by the Bank’s evaluation group with respect to the nature and execution of the fungible transactions for which we were responsible during the period analyzed. These operations are the “Financial Sector Reform Loan” and the “Programmatic Social Reform Loan.” Both of them are unrestricted Peruvian Treasury loans. Some of these remarks do not necessarily correspond to the reality of the situation and do not accurately express what happened in Peru during the difficult times encountered in the late 1990s. These circumstances led to a political crisis of such proportions that it culminated in the resignation of Alberto Fujimori as President of Peru, which gave rise to the Transition Government of Mr. Valentín Paniagua, who was appointed by the Peruvian Congress. Nonetheless, we must acknowledge a certain self-critical edge implied in many passages of the Peru-CAE document, although, in our opinion, they are not quite what they should be. After reading these passages, one would gather that things worked well as long as the

63 Attachment A (continued)
Bank’s strategy was adhered to, and that they did not work well when financing continued to be extended despite the allegations of corruption and the fact that the Bank’s strategy was not being adhered to (paragraphs 4.8 and 4.9, page 24). This affirmation gives rise to two problems: 1) It is not clear exactly what is meant by paragraphs 4.8 and 4.9, page 24 of the Peru - CAE document. If the issue is that the Bank at the time had sufficient evidence proving the existence of corrupt acts and nevertheless continued to extend financing, this would constitute an obvious contradiction. We are sure that this is not what was intended by the Peru – CAE document. It could also erroneously be inferred that the Peruvian staff with whom [the Bank staff] worked was either involved in or aware of these acts of corruption, which is also not true. As we know, generalizations are not quite solid arguments, nor do they represent incontrovertible facts. In any case, it would be appropriate for the Bank to clarify this matter, with the sole purpose of facilitating understanding of the true meaning of the passages in question. In this same context, we would also be interested in knowing the methodology applied by the evaluation team during the course of its work. 2) The interpretation that when the Bank’s strategy was adhered to things went well and that when the Bank’s strategy was not adhered to things went badly constitutes, to say the least, a biased interpretation. The application of a program and the success of that program depend to a great extent on ownership of the program by the group administering it. In this regard, until 1999, Peru had a well-established group of technocrats that drove reforms, and to the extent the group had political support, it was able to implement them satisfactorily. That is to say, when the group was able to convince the politicians of the benefits of the reforms, they were implemented systematically. This is evidenced by the fact that now, despite several years of weakened economic policy and an unfavorable international environment, the fundamentals of the Peruvian economy are still relatively strong. On the other hand, when the politicians focused on other issues, such as reelection and the popularity of those in power, the group kept up its efforts, but was less successful in implementing reforms. It should be noted that in the more difficult environment for the group of government technocrats that was pushing for deeper market-oriented structural reforms, it was the Bank that opted to hold back its support initially. In other words, the Bank decreased its active participation at a crucial time for the strengthening and confirmation of reform policies that had been initiated in previous years. In this regard, from a counterfactual viewpoint, we would like to point out that if certain areas of the Bank had supported the group of reforms more decisively and openly in Washington, D.C., perhaps the essential objectives of the reform programs for the various sectors would have been achieved and today the content of the Peru – CAE document would be very different from that with which we are familiar.
Attachment A (continued) 64
Moreover, the document fails to be self-critical in the context of its policy recommendations. For example, we can cite the occasion on which the Bank recommended that fees on swaps between AFPs be prohibited by legal provision (for example, by Supreme Decree). It later refused to support our proposal to open up competition among AFPs. Its recommendations were unquestionably erroneous. Even the consultant hired by the Bank acknowledged this fact years later. Nonetheless, by the time that was acknowledged, it was more difficult to introduce competition in the AFP market. That is why the private pension system is still burdensome for plan members. To better understand and illustrate the benefits obtained as a result of the implementation and execution of the reform programs agreed to in the context of the negotiation of the unrestricted “Financial Sector Reform Loan” (IBRD 4497-PE) and the “Programmatic Social Reform Loan” (IBRD 4615-PE), enclosed please find two aide-mémoire. Finally, in order to refute some inappropriate assessments formulated in the Peru – CAE document with respect to the nature, objectives, and execution of the Social Reform Loan” (IBRD 4615-PE), we must point out that this operation was the result of a long, concerted joint effort of the Bank and the Peruvian Government. It included participation by a broad range of Peruvian professionals, private companies, cooperation agencies, and a round of consultations with civil society. As a matter of fact, in the Letter of Social Policy for this operation the then Minister of Economy and Finance (of the Transitional Government), Mr. Javier Silva Ruete, pointed out to Mr. James Wolfensohn that the operation “implements the Basic Outline of Social Policy with a medium-term horizon, with a view to reaching a consensus that will endure beyond this Administration.” And that is precisely what was achieved. I take this opportunity to express my sincerest regards. Yours truly, /s/ OSCAR BLANCO SÁNCHEZ Head of the Special Project for Coordination of the Financial Sector Adjustment Program cc: Mr. Javier Silva Ruete, Minister of Economy and Finance cc: Mr. Fernando Zavala Lombardi, Vice Minister of Economy

65 Attachment B
Additional Government Comments, Presented by Ivan Rivera, Advisor to the Executive Director, at the CODE Subcommittee Meeting,
September 4, 2002
Peru Country Assistance Evaluation
We welcome this CAE for Peru. It describes vividly, though in a highly summarized way, the main issues of the GOP-WBG relations during the 1991-2000 period. We thank OED for this work but we do not agree with significant parts of the evaluation, particularly with the evaluation of the period 1997-2000. We think that the evaluation of this period is too rigid, and does not adequately take into account exogenous factors that affected not only Peru but the whole developing nations in the period under analysis. Let me spell out the reasons of our concerns. First, the 1997 CAS was finished before Peru was struck by a chain of adverse exogenous shocks that began in December 1997 with the Tequila crisis and were followed by the East Asian, the Russian and the Brazilian crisis in the following year. On top of all this, Peru was hit by El Niño with particular severity (the 1998 Niño was by most standards as severe as the 1983 Niño when Peru’s GDP contracted more than 10% in single year) and in addition there was drastic deterioration in the terms of trade . This events obviously called for flexibility in the application of the economic program. The Bank and the Fund responded with the needed flexibility. The Bank supported the GOP with the FSAL II, which was co-financed by a large donor. This loan focused in preventing a potential systemic crisis in the financial system, by specifically addressing the reform of the framework for resolution of weak banks which was a missing chapter in the existing Banking law at that moment. The loan was supported by solid ESW: the Rapid Financial Sector Assessment for Peru, completed in record time after the Asian crisis, which was in sense the pioneering work in the development the FSAPs, that were subsequently implemented all over the world, Peru included. The Fund, after its experience in the East Asian crisis, also adjusted its program compliance criteria. This is confirmed by the fact that Peru had full compliance with the Fund program in 1997, 1998 and 1999, i.e most of the 1997 CAS period, despite the fall in tax revenues. The program only derailed in 2000 before the presidential elections. Second, the CAS did not have a low case because the base case was indeed the low case. Let me explain. The GOP asked explicitly to the Bank to restrict its lending to US $200 million average per year during the CAS period. This is clearly a low case compared to the average lending per year of US $480 in the 1991-1997 period. This GOP decision was mainly prompted by the fact that the GOP was receiving substantial amounts of concessional lending from a large bilateral donor in better financial terms than the Bank and by the fact that its absorption capacity was reaching its limits. This low case, with very good criteria given the increased volatility of the world economy, included one adjustment operation. This operation, exerting flexibility in face of the big exogenous shock, was adapted to the requirements of the potential financial crisis in Peru at that moment, and was mainly centered in the banking system rather than the originally

Attachment B (continued) 66
planned focus on the pension system. The fund acted with similar flexibility during the period permitting some counter cyclical leeway in its EFF program. Third, the voiced reversals in the reform program are minor when compared with the tremendous progress in reforms attained during the 1991-1997 period. This is recognized in the CAE when in para.1.11 states that “Resource allocation is now largely in line with comparative advantage. GDP growth is no longer beset by increasing indebtedness or large macroeconomic imbalances, and social indicators continue to improve.” These para. implies that tariff and tax reversals as listed in Annex 3 have been relatively minor. Moreover, the CAE fails to emphasize to positive advances in reform in these areas namely: the elimination of income tax breaks for mining and the termination of income tax breaks for mergers and acquisitions as well as some innovative experiments in the social sector as the CLAS (community managed primary health posts) and the rural roads project that was rewarded with the best project award in a Bank wide competition. Fourth, on the institutional side there was really no reversal in reform, what really happened is that the Fujimori government maintained its highly centralized way of doing business throughout the past decade. This is reflected, among others in the cancellation of the Judicial reform project and in the continued centralized management of projects like PRONAMACH and FONCODES. In retrospect, we can say that the early 90s reforms were so radical, probably one of the most radical in the world, that future advancement in reforms looked small by comparison. This is probably a cause of disappointment of the author of the CAE. Additionally, let me point out that second generation reforms as the reform of the state and decentralization in which the CAE rightly points there has been little progress, are institutional reforms that have to be placed in a medium term framework and require participation and ownership of all stakeholders to be sustainable. This was difficult to attain in the Fujimori government. All in all we call for more flexibility in this CAE evaluation for the above mentioned reasons and because, as we have discussed in this sub-committee, when analyzing the methodology for CAE evaluations, the attribution problem still needs to be addressed in a more rigorous manner in future CAEs. Unluckily the PERU CAE is still part of the old generation of CAEs where this problem was not addressed with sufficient rigor.

67 Attachment C
Comments by the Latin America and Caribbean Region and OED’s Response
Regional Comments OED’s Response The Peru CAE builds its main story line by using selective facts instead of trying to link Bank strategy to final outcome information on development effectiveness. As stated in the FY97 CAS, “the overriding objective of the Bank’s Assistance Program for Peru…[was].. to support the Government’s efforts to achieve sustained, continuous reduction of poverty.”1 Progress in supporting this objective, which was substantial in the nineties, is the one that should be measured to assess whether the implementation of the CAS was satisfactory. But the CAE’s conclusion is that the Bank’s assistance during FY97-00 lacked relevance as it did not promote its own strategy and assesses its outcome as unsatisfactory.
The share of the population below the poverty line declined during the high growth period (91-97) but then rose again during the recession years (97-00), thereby erasing earlier progress. At the same time the earlier reduction in extreme poverty appears to have remained stable since 1997. Because poverty reduction is a long term objective, the most reliable indicators of whether progress is being made are the evolution of government policy and inputs, outputs, and intermediate indicators. On this score, the Government’s backsliding on important policies since 1997 bodes poorly.
The main explicit argument provided by the report is that the composition of the Bank’s actual lending program bore little resemblance to the FY97 CAS. The facts are inconsistent with the strong conclusion: (i) Six of the ten loans in the FY97 CAS have been delivered and a seventh will be delivered in FY03. (ii) The FY97 CAS explicitly states in three different parts that the Bank would be prepared to consider an adjustment operation, if justified by program content and financial requirements.2 (iii) Two operations included in the CAS—one not delivered (Water Resource Management) and another approved but not signed (Judicial Reform) —covered precisely areas where there was inadequate institutional progress and so were directly responsive to the deteriorating governance situation that the CAE correctly emphasizes. (iv) Of the two loans not in the FY97 CAS, the Indigenous LIL, came about from the indigenous consultations in1997 and 1998. The other, El Niño Emergency loan was designed to help manage an emergency of major proportions which had not been envisaged in the CAS. (v) On the issue of triggers, as explicitly said in the CAS, the proposed lending was equivalent to what would have been a low-case scenario, given the government’s low demand for financial support from the Bank, so any trigger on country-wide grounds would have been redundant. Moreover the CAS said “failure to improve project implementation could result in further reductions”3. In fact, the portfolio was turned around following the actions spelled out in the FY97 CAS.
The deviation of the FY98-00 lending program from the proposals contemplated in the ’97 CAS is well illustrated in the CAE (paras 2.16, 2.24). Of $540mn planned investment lending, only about $150 mn materialized (of which $22.5mn was cancelled and $50 mn approved with one year delay). Instead 80 percent of actual lending was made up by two loans: a $150 mn El Nino emergency loan and a $300 mn adjustment loan. The large amount of adjustment lending was not justified for several reasons, including the limited reforms achieved.
1 FY97 CAS for Peru, Report # 16796, page i. 2 FY97 CAS for Peru, page 17, para 55 and Annex A2 (page 1 and page 2). 3 FY97 CAS for Peru, page 18.

Attachment C (continued) 68
Regional Comments OED’s Response
The CAE also argues that the Bank's assistance program during FY97-00 was “neither efficacious nor efficient” in achieving its development goals. Again it fails to assess actions against development conditions. First, in terms of the overall policy and institutional assessment, the CPIA (Country Policy and Institutional Assessment)4 does indeed show some deterioration after 1997 but to the LAC average, and close to that of Brazil. This was of concern, but not dramatic. Aggregate lending levels were already constrained by the low demand of the government—that had plenty of alternative sources in this period.
The CPIA is a weak indicator of development conditions, and is backward looking. As the Region’s final comment below suggests, the pre-1997 average CPIA rating was lower, than the post-1997 one. The former was influenced by the crisis years of the late 80s, the latter by the high growth years of the early 90s.
The Bank management did make a decision to reshape a planned financial adjustment loan in the wake of the 1997 crisis. We have to assess the effectiveness of this in relation to a likely counterfactual. Had the financial sector collapsed, it is highly probable that the recession would have been more severe and poverty would have increased substantially more than what we have seen in the last 3 years, as shown by other countries where the financial system went into crisis.
As discussed in para 2.29 of the CAE, the relevance of the FY99 financial sector loan as an instrument to avoid a systemic banking crisis was fairly low. Earlier, Peru had successfully weathered the Mexican crisis precisely because of the strength of its banking system, a large proportion of which is foreign-owned. Peru’s high level of international reserves provided additional insurance.
The argument that the Bank yielding to pressures to do adjustment lending is based on the only adjustment loan made during the FY97-00 period, the Financial Sector Adjustment Loan (FSAL). The pre-FSAL numbers, as well as the assessment of the joint IMF-WB FSAP, support the Region’s view that the operation helped prevent Peru’s financial system from collapsing. The analysis of Peru’s banking system fragility had been backed by an exhaustive rapid financial sector assessment prior to loan preparation. The conditionality of the FSAL allowed the authorities to undertake prompt and autonomous intervention and to use market based merger techniques to save weak banks while mitigating costs to the state and avoiding systemic contagion. This was an area where policies were still being effectively implemented, despite the overall deterioration in governance.
The “one” adjustment loan made up 54 percent of the total FY98-00 lending program. (Another 27 percent was made up by the El Nino Emergency loan). In several instances, the resolution of banking difficulties was handled in a non-transparent manner (para 1.9 and 3.12 of the CAE).
With respect to the rest of the program, as opportunities for broad-based reforms were not available, the Bank program focused on how to get the most poverty impact in our new projects. As we closed and cancelled operations, only 8 projects remained at the end of the Fujimori period, which were all focused on poverty. As the situation deteriorated the Bank moved to a redefinition of our strategy that aimed to: (i) focus all operations on poverty reduction; (ii) work intensively with civil society where the Bank played an important leadership role at a time when this was not a popular cause and (iii) achieve improvements in our portfolio both in terms of quality and poverty focus.
The most important factor for poverty reduction is growth which requires broad-based reforms, including macro-economic and structural. Whether opportunities for such reforms were available or not is open to question: the Government, in its comments on the CAE, states that if the Bank had supported more strongly the reform oriented technocratic group within the government, several of the necessary reforms would have been implemented (see also para 2.25 of the CAE).
4 The CPIA is a Bank-generated indicator on the Bank’s own assessment of a country’s performance.

69 Attachment C (continued)
Regional Comments OED’s Response
When assessing the outcome of the Bank strategy, the CAE hardly focuses on the improvements in poverty indicators which have been mostly sustained up to now. We would like to point to evidence from two sources—on final outcomes and on the development effectiveness of Bank projects. Income poverty did rise in 1997-2000 because of the macroeconomic recession—as systematically happens in any recession. However, the improvements in extreme poverty have not been lost and all other social indicators continued to improve throughout the decade. There is no evidence of a break in the series in 1997 as several social indicators, including extreme poverty, improved in the 1997-99 period.
It is implausible to attribute improvements in social indicators to the program of the Bank. Social indicators improve for myriad reasons; they improved in Peru also during the late 80s when Peru was in extreme economic crisis and when assistance from multilateral institutions was halted.
In terms of measured development effectiveness of Bank loans, performance was better during the FY97-00 period than in the FY91-00 period according to OED assessments. If we look at outcome performance ratings for Bank loans in the FY97-00 period, defined as the extent to which the projects’ major relevant objectives were achieved efficiently, 100 percent of the projects had a satisfactory or better performance compared to 97 percent in the FY91-96 period. Moreover, the sustainability and institutional development impact ratings are much higher than the Bank-wide average of OED assessments. Peru’s environment, was assessed by OED as conducive to sound development impact of the Bank portfolio through the nineties. The Bank-wide average in 2000 is lower than that for Peru in the three categories: Overall Outcome at 80 percent, Institutional Development impact at 55 percent and Sustainability at 60 percent.5 Like CPIAs, these numbers show Peru quite favorably throughout the 1990's.
The outcomes of two of the largest loans approved in recent years (the FY98 $150 mn El Nino Emergency loan and the FY99 $300 mn FSAL) were rated by OED, as, respectively, moderately unsatisfactory and moderately satisfactory. More importantly, in the broader context of evaluating the overall assistance strategy, the Bank’s program and the FSAL lacked relevance, as they did not promote the Bank’s own strategy of advancing institutional reform and poverty reduction, and did not respond appropriately to the weakening economic policy environment.
Finally regarding the alleged inefficiency, Peru has an average cost per project of US$965,000, that is below the Bank wide average of US$1,115,000. The average cost per US$1,000 of commitment for Peru is 7.3, lower than the 12.3 bank wide. And the average cost per US$1,000 of commitment for satisfactory and non risky projects is at US$7.5, significantly lower than LCR (US$9.8) and bank wide (US$14.3).
It is correct that the Peru program has been efficient in the narrow sense of cost per $ committed. However, in the larger sense of costs and $ committed per reforms achieved, it was not efficient after 1997.
In view of the above information, it is difficult to understand the empirical basis for the CAE’s assessment of unsatisfactory performance for the post-1997 period, whether this is being assessed with respect to: (i) the FY97 CAS (with which it was broadly consistent outside shock-related design shifts), (ii) objective measures of development effectiveness, or (iii) in contrast to the performance in the pre-1997 period—for which the average CPIA rating was lower not higher, and for which loan outcomes were no better.
In the post-97 period, the Peruvian economy stagnated, the fiscal deficit increased as did the rate of poverty, and private investment declined. The Bank provided budget support without attempting to address the issues of the continuing erosion of an already weak tax base and of other policy reversals, while planned attempts at institutional reforms were abandoned: hence, the unsatisfactory outcome rating for the Bank’s assistance program.
5 Figures 3.2, 3.3 and 3.4 of the latest ARDE report of OED, pages 11 and 12, Report 23342 of December 20, 2001 "2001 Annual Review of Development Effectiveness."

Attachment D 70
MANAGEMENT ACTION RECORD
OED Recommendations Management Response
1. Over the past 5 years, government revenues have decreased in relation to GDP from a position already lower than that in comparable countries. In its policy dialogue, the Bank should emphasize the importance of increasing public revenue in a progressive manner. This is particularly important today given the high volatility in international capital markets.
The CAS that is now under preparation includes a program of increasing public revenues in a progressive manner as triggers for the high case and a floor for the base case.
2. The scarcity of domestic resources, available to finance expenditures needed for poverty reduction, is expected to grow worse with the additional requirements for health and education sector reforms and for the expected decentralization. A Public Expenditure Review should provide an estimate of the resources needed to achieve the goals of the development program to be agreed between the Bank and the Government.
A Public Expenditure review that has recently been completed analyzes the levels and efficiency of poverty programs and does provide an estimate of the resources needed to achieve the goals of continued poverty reduction.
3. Improved rule of law and public sector reform are fundamental to encourage the private sector and sustain poverty reduction. If the Government shows commitment to public sector reform, the Bank should provide analytical and financial support. If commitment is weak, the Bank should build institutional-development components into project and sector loans and condition disbursements to progress on the institutional front.
The IDB has a substantial program of public sector reform that the Bank will complement with AAA, technical assistance and a decentralization loan.

71 Attachment E
September 13, 2002 CODE2002-0073
Report from CODE Committee on Development Effectiveness
Informal Subcommittee’s Report on Peru Country Assistance Evaluation
(Meeting of September 4, 2002)
1. The Informal Subcommittee (SC) of the Committee on Development Effectiveness met on September 4, 2002 to discuss the Country Assistance Evaluation (CAE) for Peru (CODE2002-0066).
2. OED remarked that the Bank’s impact in Peru during the first half of the 1990s was substantial, and the outcome of Bank assistance for this period was judged as satisfactory. However, the Bank’s program during 1997-2000 was neither efficacious nor efficient in achieving its development goals. It devoted a large amount of resources to a Government whose policies undermined sustainable growth and poverty reduction objectives. Starting in 1997, the Government was no longer committed to the Bank’s assistance program and, despite policy reversals, the Bank yielded to pressure to redirect loans from investment projects to fast-disbursing structural adjustment lending in contradiction to its own strategy. OED also noted that the Bank had trouble identifying the turning point in economic and political developments in the country and did not adjust its strategy accordingly. The outcome of the Bank’s assistance during this period was, therefore, judged as unsatisfactory.
3. Management welcomed the CAE and noted that many of its findings and recommendations had been incorporated in the new CAS. However, Management emphasized that the evaluation had the advantage of hindsight and benefited from information that had not been available to the Bank team at the time. Management also pointed out that the Bank was not the only player in Peru and there were other more significant donors, thus, it was difficult to attribute country developments to the Bank’s program per se. Management further stressed that the situation in Peru had to be understood in context. Peru had been a success story and a good performer in the early 1990s. The 1997-2000 period had been one of great stress in the region due to external shocks such as the Asian and Russian crises, the devaluation of the Brazilian currency, and El Nino. The deterioration in Peru was less than expected despite these circumstances because of the measures taken to bolster the financial system during the crisis. Lastly, Management considered that the Bank did react to policy reversals by significantly decreasing support to Peru in 1999 and 2000.
4. The Chair representing Peru thanked OED for its evaluation but noted that the evaluation was too rigid and did not adequately account for the chain of adverse exogenous shocks that hit Peru in the 1997-2000 period. Given these shocks, the Bank had responded with the needed flexibility and helped prevent a systemic financial crisis. Despite external circumstances, Peru had been in full compliance with the IMF program till 2000. The Chair also stressed that the reversals in the reform program were minor in comparison to the tremendous progress achieved in the 1991-1997 period, and this progress had also been recognized in the CAE. He noted that the reforms in the early 1990s were so radical that future reforms looked small in comparison. With regard to

Attachment F (continued) September 13, 2002 CODE2002-0073
72
institutional reform, the Chair noted that there had been no reversals. The Fujimori Government had simply maintained its highly centralized mode of operations. He agreed that the second generation of reforms included institutional reforms but these needed to be placed in a medium term framework and required the participation and ownership of all stakeholders to be sustainable.
5. The SC welcomed the CAE and thanked both OED and Management for their participation. The SC raised the following issues:
6. Evaluation Methodology. Some members agreed with Management with regard to the benefits of hindsight. They questioned how OED methodology could be adjusted to account for this factor. Other members inquired whether OED’s country evaluations were leading to risk-averse behavior by Staff as getting involved in countries under stress bears a risk for being evaluated poorly by OED. OED responded that the learning objective of evaluation requires that all current information must be used. Attribution was also discussed and members agreed that it was difficult to attribute country outcomes to the Bank’s program per se. OED concurred that the Bank was not a major player in Peru and the CAE stated that the country bears the primary responsibility for good and bad outcomes. However, the goal of the CAE was to examine the Bank’s program and ascertain whether the Bank had done the right things given the circumstances. Management agreed that including all available information is important for learning but noted that the evaluation rating should be adjusted to the information available at the time to account for hindsight. Management also suggested that a methodology needed to be developed to assess the counterfactual as this was the only way to truly evaluate the Bank’s interventions.
7. Context. The SC stressed the importance of understanding the context in which the Peru program was being carried out and agreed that the CAE should have accounted more for external circumstances. However, one member asked about the usefulness of the FSAL. Management replied that the FSAL had helped to prevent a financial crisis and a reversal of poverty reduction gains. Management had considered Peru’s vulnerability in the late 1990s to be much greater than in 1994, when the country solved its financial troubles without support from the Bank.
8. Turning Points. The SC agreed with OED’s findings with regard to turning points in country circumstances and expressed concern that the Bank typically had trouble identifying turning points and adjusting its programs accordingly. In this regard, many members questioned how the Bank deals with success cases that begin to reverse reforms. Management agreed that the Bank had been slow to recognize the turning point in Peru but stressed that the 1997 CAS had a much smaller program for Peru at the request of the Government. Management also noted that though governance problems were present in the early 1990s, the Bank only began to recognize and directly address governance issues in the late 1990s when they became central to Bank programs. Furthermore, Management stressed that it was important to consider the counterfactual. If the Bank had not come forward with its FSAL, a systemic banking crisis may have occurred in Peru.
9. Institutional Development. The SC noted that many of the problems that arose in the late 1990s were as a result of institutional weaknesses. Members wondered whether the Bank could have focused more on institutional development and pro-poor activities when the reforms were first being carried out in the early 1990s. The SC stressed the importance of institutional development and the strengthening of civil society as part of the reform process. It noted the importance of lessons learned in this regard in the case of Peru and hoped this would be reflected

Attachment E (continued)
September 13, 2002 CODE2002-0073
73
in future programs and CASs. Management agreed that they should have focused more on institutional strengthening during the early reforms.
10. Role of the Board. Members noted that there had been significant deviations from the CAS and wondered if the Board had been consulted when Management moved from a program that largely involved investment operations to budget support. Management responded that there had been one adjustment operation programmed as part of the 1997 CAS and the FSAL had been the only adjustment operation in this time period. Furthermore, the FSAL had been discussed and approved by the Board. Overall, the SC agreed that a CAS should be a living document that adapts to changing country circumstances, but stressed that the Board needed to be consulted when such changes are made.
11. Remaining Issues. Members asked about the remaining structural problems in Peru and wondered how the upcoming CAS addressed these. One member asked OED if Peru was now ready for adjustment lending and whether the new CAS had sufficiently incorporated the concerns raised in the CAE.
Sharon Weber Chairperson, CODE Subcommittee
Distribution Executive Directors and Alternates President Bank Group Senior Management Vice Presidents, Bank, IFC and MIGA