perth light rail study - western australian planning ... · pdf file5.1.1 rigid vehicles 26...
TRANSCRIPT

Perth Light Rail Study Feasibility Study for a Light Rail Alignment between Subiaco and East Perth Department for Planning and Infrastructure
13 August 2007

Perth Light Rail Study 0284/05
Prepared for
Department for Planning and Infrastructure
Prepared by Maunsell Australia Pty Ltd Level 1, 629 Newcastle Street, PO Box 81, Leederville 6902, Western Australia T +61 8 9281 6100 F +61 8 9281 6295 www.maunsell.com ABN 20 093 846 925
In association with
Faber Maunsell, UK
13 August 2007
60011133
© Maunsell Australia Pty Ltd 2007
The information contained in this document produced by Maunsell Australia Pty Ltd is solely for the use of the Client identifiedon the cover sheet for the purpose for which it has been prepared and Maunsell Australia Pty Ltd undertakes no duty to or accepts any responsibility to any third party who may rely upon this document.
All rights reserved. No section or element of this document may be removed from this document, reproduced, electronically stored or transmitted in any form without the written permission of Maunsell Australia Pty Ltd.
Perth Light Rail Study T:\78105106 - Perth Light Rail\00\doc\reports\Final Report\Perth Light Rail Study Report_13Aug07_Final.doc Revision 0 13 August 2007

Quality Information Document Perth Light Rail Study
Ref 60011133
Date 13 August 2007
Prepared by Shona Robb, Abra DeKlerk, Neil Rippon, Denis Leviny
Reviewed by Lara Poloni, Chris Tatam
Final Report
Revision History
Authorised Revision Revision
Date Details Name/Position Signature
A 22/05/2007 Draft Report for Working Group Review
Chris Tatam Director Transport Infrastructure pp.
B 23/07/2007 Final Draft Report for Steering Committee Review
Chris Tatam Director Transport Infrastructure pp.
0 13/08/2007 Final Report Chris Tatam Director Transport Infrastructure
Perth Light Rail Study T:\78105106 - Perth Light Rail\00\doc\reports\Final Report\Perth Light Rail Study Report_13Aug07_Final.doc Revision 0 13 August 2007

Table of Contents Foreword iExecutive Summary iv1.0 Introduction 1
1.1 Study Purpose 21.2 Study Scope and Objectives 21.3 Stakeholder Consultation Process 31.4 Report Structure 4
2.0 Planning Context 52.1 History of Light Rail Transit in Perth 52.2 Perth Transport Planning Studies 6
2.2.1 Perth Network City Strategic Planning Framework 62.2.2 City of Perth Inner City Transport Study 62.2.3 Streetcar Inner City Transport System for Perth – Various Studies 8
3.0 Existing Land Uses and Transport Networks 93.1 Land Use and Activity Centres 9
3.1.1 Perth Central Business District (CBD) 113.1.2 Subiaco Commercial Precinct 113.1.3 West Perth Commercial Precinct 123.1.4 Royal Perth Hospital 123.1.5 Subiaco Oval 123.1.6 WACA and Gloucester Park 133.1.7 Perth Central Railway Station 133.1.8 Perth Foreshore 133.1.9 Growth Area – Northbridge Link 133.1.10 Growth Area – Riverside 143.1.11 Growth Area – Queen Elizabeth II Medical Centre 143.1.12 Growth Area – University of Western Australia 14
3.2 Road Network 153.3 Public Transport Networks 17
3.3.1 Heavy Rail Network 173.3.2 Bus Network 17
3.4 Summary 184.0 The Role of Light Rail in Urban Centres 20
4.1 Public Transport Modes 204.1.1 Heavy (Suburban) Rail 204.1.2 Buses 214.1.3 Monorail 224.1.4 Light Rail 23
4.2 Role of Light Rail in Perth 244.2.1 Light Rail as a Mass Transit System 244.2.2 Light Rail as an Urban Regeneration Catalyst 24
5.0 Light Rail Transit Technology Options 265.1 Light Rail Vehicles 26
5.1.1 Rigid Vehicles 26
Perth Light Rail Study T:\78105106 - Perth Light Rail\00\doc\reports\Final Report\Perth Light Rail Study Report_13Aug07_Final.doc Revision 0 13 August 2007

5.1.2 High-Floor Vehicles 275.1.3 Low-Floor, Articulated Vehicles 285.1.4 Low Floor Vehicle Interior Design 295.1.5 Vehicles Suitable for Perth 29
5.2 Types of Operation 315.2.1 Single-ended Operation 315.2.2 Tram-train Operation 325.2.3 Type of Operation Suitable for Perth 33
5.3 Access for All 335.3.1 Access Suitable for Perth 35
5.4 Light Rail Power Supply 355.4.1 Electrified Power Supply 355.4.2 Options Instead of Overhead Electrification 365.4.3 Alternative Power Sources 385.4.4 Power Supply Suitable for Perth 38
5.5 Light Rail Track 385.5.1 Track Geometry 385.5.2 Types of Track 385.5.3 Track Suitable for Perth 41
5.6 Supporting Light Rail Technology 425.6.1 Signalling and Control Systems 425.6.2 Information Systems 435.6.3 Ticketing Systems 44
5.7 Depot Requirements 445.7.1 Depot Requirements for Perth 47
5.8 Alternative Rubber-Tyred Technology 476.0 Light Rail Transit for Perth – Summary of Issues 50
6.1 Public Transport Planning Concepts 506.2 Conflicting Network Issues 516.3 Technological Issues 52
7.0 Alignment Selection 547.1 Identifying Route Options 54
7.1.1 Option 1 : UWA – East Perth 557.1.2 Option 2 : UWA – Subiaco – East Perth 567.1.3 Option 3 : UWA/Jolimont – East Perth 577.1.4 Option 4 : Suburban Orbital Loop 587.1.5 Option 5: Terrace Loop 59
7.2 Option Refinement 607.3 Preferred Option 63
8.0 Integration with the Public Transport Network 658.1 Introduction 658.2 Service Integration and Interchange 658.3 Future Network 66
8.3.1 Impact on the Suburban Bus Network 668.3.2 Impact on the Passenger Rail Network 678.3.3 Impact on Central Area Transit (CAT) 69
Perth Light Rail Study T:\78105106 - Perth Light Rail\00\doc\reports\Final Report\Perth Light Rail Study Report_13Aug07_Final.doc Revision 0 13 August 2007

8.3.4 Impact on the Free Transit Zone (FTZ) 709.0 Detailed Assessment of Preferred Route 71
9.1 Streetscape Design and Road Space Allocation 719.1.1 Kerbside Uses 719.1.2 Land Use Review 739.1.3 Road Space Trade-Offs 77
9.2 Depot Location 799.2.1 Claisebrook Depot 809.2.2 Jolimont Depot 81
9.3 Transport Impact of Route Options 829.3.1 SATURN Modelling 829.3.2 Isolated Intersection Analysis 839.3.3 SATURN Modelling Results 849.3.4 Isolated Intersection Analysis Results 859.3.5 Concluding Remarks 87
10.0 Service Capacity 8810.1 Estimated Patronage Demand 88
10.1.1 Use by Residents 8810.1.2 Use by Employees 89
10.2 Specific Institutional Demand 9010.2.1 University of Western Australia – Nedlands/Crawley Campus 9010.2.2 Queen Elizabeth II Medical Precinct 9210.2.3 Existing CAT system 9410.2.4 Patronage Estimate 94
11.0 Concept Design and Engineering Assessment 9511.1 Street Environment Criteria 9511.2 Streetscape and Stop Design 95
11.2.1 Streetscape Design 9511.2.2 Stop Design 97
11.3 Streetscape Cross Sections 9911.3.1 Cross Section Design 1 – The Transit Mall 9911.3.2 Cross Section Design 2 – Mixed Traffic Environment 10011.3.3 Cross Section Design 3 – Mixed Traffic Environment with Median 10111.3.4 Cross Section Design 4 – Utilising Median in a 40-metre Reserve 10211.3.5 Cross Section Design 5 – Utilising Road Space in a 40-metre Reserve 10311.3.6 Cross Section Design 6 – One-way Westbound Traffic 10411.3.7 Cross Section Design 7 – One-way Eastbound Traffic 10511.3.8 Cross Section Design 8 – Two-way Traffic in a 20-metre Reserve 107
11.4 Light Rail Alignment Concept Design 10911.5 Hay Street Engineering Option Assessment 129
11.5.1 Bridge Assessment 12911.5.2 Freeway Ramp Traffic Impacts 129
11.6 Cost Estimate 13011.6.1 Infrastructure Costs 13011.6.2 Operating Assumptions 13111.6.3 Rollingstock Costs 132
Perth Light Rail Study T:\78105106 - Perth Light Rail\00\doc\reports\Final Report\Perth Light Rail Study Report_13Aug07_Final.doc Revision 0 13 August 2007

11.6.4 Operating Costs 13211.6.5 Cost Summary 133
12.0 Light Rail and Local Economic Development 13412.1 Economic Impacts of Light Rail – Capturing Value 13412.2 Land Use Change and Densification 13512.3 Strategies to Ensure the Capture of Light Rail Economic Benefits 135
13.0 Light Rail in a Future Central Perth 13713.1 A Strategic Context - Network City Priority Strategies for the Future 13713.2 Future Light Rail Network 13713.3 Issues for Resolution 139
14.0 Conclusions 14014.1 Findings 140
14.1.1 The Role of Light Rail in the Study Area 14014.1.2 Light Rail Technology and Options for Perth 14114.1.3 Route Alignment Selection and Design 14214.1.4 Traffic Modelling 14314.1.5 Patronage 14414.1.6 Feasibility and Costs 14414.1.7 Future Light Rail Network 145
14.2 Issues for Resolution 14514.2.1 Detailed Micro-Simulation Modelling 14514.2.2 Planning and Consultation 14614.2.3 Patronage Forecasting and Economic Analysis 146
15.0 References 147
Perth Light Rail Study T:\78105106 - Perth Light Rail\00\doc\reports\Final Report\Perth Light Rail Study Report_13Aug07_Final.doc Revision 0 13 August 2007

List of Figures Figure 1.1 Study Area 1Figure 1.2 Study Scope and Objectives 2Figure 2.1 Perth Tramway Routes in the 1940’s 5Figure 2.2 Perth Light Rail Network Proposed in the City of Perth Study 7Figure 2.3 Concept for an Inner City Transport System 8Figure 3.1 Existing Land Use in Perth and Subiaco 9Figure 3.2 Key Activity Centres and Growth Areas 10Figure 3.3 Vehicle Circulation in the City of Perth CBD 15Figure 3.4 Existing Public Transport Routes in the Perth Light Rail Study Area 17Figure 3.5 Existing Perth CAT Bus Network 18Figure 3.6 Sketch of Study Area 19Figure 4.1 Perth Metropolitan Heavy Rail Network 21Figure 4.2 Extent of Metropolitan Bus Network 22Figure 5.1 Rigid Tram in Melbourne, Australia 27Figure 5.2 Rigid Streetcar in Philadelphia, USA 27Figure 5.3 Light Rail Transit Station in Calgary, Canada 27Figure 5.4 Profiled Platforms in Manchester, UK 27Figure 5.5 Modern Articulated LRV in Melbourne, Australia 28Figure 5.6 Low-Floor Articulated LRV in Nottingham, UK 28Figure 5.7 Interior of a Low-Floor Combino LRV 29Figure 5.8 Low-Floor LRV in Nottingham, UK 29Figure 5.9 Bombardier Flexity Swift LRV in Central Croydon, UK 30Figure 5.10 High Speed LRV Operating in Croydon, UK 30Figure 5.11 Single-ended Operation in Karlruhe, Germany 31Figure 5.12 Single-ended Operation in Toronto, Canada 31Figure 5.13 Double-ended Tram in Melbourne, Australia 33Figure 5.14 Double-ended LRV in Sydney, Australia 33Figure 5.15 Desirable Platform Heights and Gaps for Light Rail Operations 34Figure 5.16 High-Floor LRV at Calgary CBD Station 34Figure 5.17 High Platform into a Tram in Croydon, UK 34Figure 5.18 Breda LRV in San Francisco, USA 35Figure 5.19 Low-Floor Tram Platform in Melbourne, Australia 35Figure 5.20 Overhead Power Supply in Melbourne 35Figure 5.21 Overhead Power Supply in Manchester 35Figure 5.22 Wind-Proof Overhead Wiring in Manchester, UK 36Figure 5.23 Pantograph Connecting to LRT Overhead Wire 36Figure 5.24 Bordeaux LRV with Third Rail Power Supply 37Figure 5.25 Third Rail Power Supply in Bordeaux 37Figure 5.26 Third Rail Technology, France 37Figure 5.27 Sleeper Ballasted Track in Croydon, UK 39Figure 5.28 Sleeper Ballasted Track in Sydney, Australia 39Figure 5.29 Concrete Track Slab in Croydon, UK 40Figure 5.30 Calmed Street Track in Karlsruhe, Germany 40Figure 5.31 Grassed Track in Freiburg, Germany 41Figure 5.32 Grassed Track in Barcelona, Spain 41
Perth Light Rail Study T:\78105106 - Perth Light Rail\00\doc\reports\Final Report\Perth Light Rail Study Report_13Aug07_Final.doc Revision 0 13 August 2007

Figure 5.33 LRV Signalling at Junction in Karlsruhe, Germany 42Figure 5.34 Light Rail Control Room in Birmingham, UK 42Figure 5.35 LRT Signage in Melbourne 44Figure 5.36 Real Time Information Displays in Melbourne 44Figure 5.37 LRV Maintenance Equipment in Croydon, UK 46Figure 5.38 Light Rail Depot in Sydney, Australia 46Figure 5.39 Depot Interior in Barcelona, Spain 46Figure 5.40 LRV Wheel Lathe in Croydon, UK 46Figure 5.41 Rubber-tyred LRV in Nancy, France 47Figure 5.42 Rubber-tyred LRV in Caen, France 47Figure 6.1 Plenty of Road Space in Perth – Hay Street, Subiaco 51Figure 6.2 Narrow Roads in Perth’s City Centre – Hay Street (CBD) and Rokeby Road
(Subiaco) 51Figure 6.3 Light rail in traffic (below left) or segregated tracks (below right) 52Figure 7.1 Option 1 55Figure 7.2 Option 2 56Figure 7.3 Option 3 57Figure 7.4 Option 4 58Figure 7.5 Option 5 59Figure 7.6 Option A and Option B 62Figure 7.7 Preferred Option 64Figure 8.1 Service Integration and Interchange Points 65Figure 8.2 Subiaco Locality Plan 68Figure 8.3 Existing Perth CAT and FTZ 69Figure 9.1 Kerbside Uses 71Figure 9.2 Kerbside Use Survey Areas 72Figure 9.3 Kerbside Use Survey Local Areas 72Figure 9.4 Kerbside Use Survey Local Areas – Focus on Non-Car Parking Uses 73Figure 9.5 Land Uses Perth CBD 73Figure 9.6 Land Uses Hay Street, Subiaco 74Figure 9.7 Land Uses, Subiaco Activity Centre 75Figure 9.8 Land Uses, Hampden Road 76Figure 9.9 Land Uses, Broadway 77Figure 9.10 Claisebrook Depot Site and Location 80Figure 9.11 Jolimont Depot Location 81Figure 9.12 Jolimont Depot Site 81Figure 10.1 Walk Catchment 88Figure 11.1 Cross Section Design along Alignment Length 96Figure 11.2 Central Platform A 97Figure 11.3 Central Platform B 98Figure 11.4 Central Platform C 98Figure 11.5 Kerbside Extension Platform 98Figure 11.6 Island Platform 99Figure 11.7 Cross Section Design 1 – The Transit Mall 99Figure 11.8 Stop Arrangement for Design 1 100Figure 11.9 Cross Section Design 2 – Mixed Traffic Environment 101Figure 11.10 Stop Arrangement for Design 2 101
Perth Light Rail Study T:\78105106 - Perth Light Rail\00\doc\reports\Final Report\Perth Light Rail Study Report_13Aug07_Final.doc Revision 0 13 August 2007

Figure 11.11 Cross Section Design 3 – Mixed Traffic Environment with Median 102Figure 11.12 Stop Arrangement for Design 3 102Figure 11.13 Cross Section Design 4 – Utilising Median in a 40-metre Reserve 103Figure 11.14 Stop Arrangement for Design 4 103Figure 11.15 Cross Section Design 5 – Utilising Road Space in a 40-metre Reserve 103Figure 11.16 Stop Arrangement for Design 5 104Figure 11.17 Cross Section Design 6 – One-way Westbound Traffic with Al Fresco Dining 104Figure 11.18 Cross Section Design 6 – One-way Westbound Traffic with Loading/Parking Bay 105Figure 11.19 Stop Arrangement for Design 6 105Figure 11.20 Cross Section Design 7 – One-way Eastbound Traffic 106Figure 11.21 Stop Arrangement for Design 7 106Figure 11.22 Cross Section Design 8 – Two-way Traffic in a 20-metre Reserve 107Figure 11.23 Stop Arrangement for Design 8 107Figure 11.24 Stop Arrangement for Design 8 – Plan 108Figure 11.25 Concept Design – Broadway / Princess Road 112Figure 11.26 Concept Design – Broadway / Stirling Highway / Hampden Road 113Figure 11.27 Concept Design – Hampden Road / Monash Avenue 114Figure 11.28 Concept Design - Thomas Street / Aberdare Road 115Figure 11.29 Concept Design – Rokeby Road / Thomas Street 116Figure 11.30 Concept Design – Rokeby Road / Hay Street 117Figure 11.31 Concept Design - Hay Street / Hamilton Street 118Figure 11.32 Concept Design – Hay Street / Thomas Street 119Figure 11.33 Concept Design - Havelock Street 120Figure 11.34 Concept Design - Hay Street, West Perth 121Figure 11.35 Concept Design – Murray Street Mall 122Figure 11.36 Concept Design - Barrack Street 123Figure 11.37 Concept Design - Hay Street, Mercedes College 124Figure 11.38 Concept Design - Hay Street / Hill Street 125Figure 11.39 Concept Design - Hill Street / Wellington Street 126Figure 11.40 Concept Design - Hill Street / Wittenoom Street / Royal Street 127Figure 11.41 Concept Design – Claisebrook Depot 128Figure 13.1 Schematic Diagram of the Future Light Rail Network 138Figure 13.2 Future Light Rail Network 138
Perth Light Rail Study T:\78105106 - Perth Light Rail\00\doc\reports\Final Report\Perth Light Rail Study Report_13Aug07_Final.doc Revision 0 13 August 2007

List of Tables Table 4.1 Comparison of Passenger Rail Attributes 20Table 6.1 Planning Concepts for Perth 50Table 7.1 Joining Up Activity Centres 60Table 7.2 Option Assessment Matrix 63Table 8.1 Opportunities for Integration and Interchange 66Table 9.1 Desirable Road Reserve Activities and Required Space 78Table 9.2 Trade Offs 79Table 9.3 Comparison of overall Intersection Performance 85Table 9.4 Isolated Intersection Analysis Results 87Table 10.1 Residential Demographics and Mode Share 89Table 10.2 Employee Demographics and Mode Share 90Table 10.3 UWA Student and Staff Numbers 90Table 10.4 UWA Trips 91Table 10.5 UWA Mode Splits 91Table 10.6 UWA Daily Light Rail Patronage 92Table 10.7 Predicted Staff, Visitor and Patient Numbers 92Table 10.8 QEIIMC Conservative Patronage Estimate 93Table 10.9 QEIIMC Realistic Patronage Estimate 93Table 10.10 QEIIMC Patronage Comparison Summary Table 93Table 10.11 Red CAT Patronage, 2004 and 2012 94Table 10.12 Patronage Estimate 94Table 11.1 Cross Sections 96Table 11.2 Track Types in Possible Transit Mall Locations 100Table 11.3 Engineering Design Specifications 109Table 11.4 Concept Design Plans 110Table 11.5 Indicative Infrastructure Costs 131Table 11.6 Service Frequency Assumptions 132Table 11.7 Anticipated Light rail Fleet Requirements 132Table 11.8 Annual Network Operating Costs 133Table 11.9 Cost Summary 133Table 14.1 Technological Design Criteria 141
Perth Light Rail Study T:\78105106 - Perth Light Rail\00\doc\reports\Final Report\Perth Light Rail Study Report_13Aug07_Final.doc Revision 0 13 August 2007

Foreword
It is estimated that the Perth metropolitan area will experience a fifty percent population increase within the next 30 years, to a total of approximately 2.4 million people1. At present, each person within the Perth metropolitan area makes an average of 3.1 trips per day which will equate to about 17.7 million trips in 2037. This represents a phenomenal challenge, but also a tremendous opportunity for public transit systems to be developed to meet this growth, including a possible inner-city transit system.
At present approximately 80% of all daily trips are undertaken by car, with the remaining 20% undertaken on foot, by bicycle and by public transport. It will not be possible to sustain this current mode split in 30 years time unless a substantial proportion of valuable land is dedicated to the provision of wider, longer roads. It will also not be possible to accommodate all of these additional people within the Metropolitan Region if housing development continues to be built at existing low densities (12.7 dwellings per net hectare on average)2.
Therefore two key strategies of the Department for Planning and Infrastructure’s Network City strategic plan for the Perth and Peel regions have been identified to help shape Perth’s future growth; essentially, to investigate and propagate higher development densities for residential and commercial land uses across the whole of the metropolitan area, but specifically at locations around transit nodes, existing Activity Centres and along Activity Corridors; and to facilitate access to such areas by aligning transport infrastructure and services with land uses.
The concept of a light rail system for Perth has stemmed directly from the Network City strategies, particularly for the central and inner areas where higher density development has already occurred and has been well supported by bus and heavy rail infrastructure and services. However, the continuing success of Transit Oriented Development, village-style living and the popularity of new high density apartments in the inner suburbs of Subiaco, West Perth, Northbridge and East Perth is beginning to overwhelm the capability of existing transit systems. The consolidation and growth of educational and health facilities in the inner west has been an incentive to investigate the feasibility of introducing a larger capacity, higher frequency transit service between the key demand centres of inner Perth: on-street light rail.
This study has been undertaken based on a brief that required investigation into route feasibility for a light rail alignment between the City of Subiaco and East Perth. While there was no requirement within the brief to justify light rail as a desirable mode of transit for the alignment (as opposed to a bus-way), previous studies completed for City of Subiaco (SKM, 2005) reviewed the benefits of a light rail system and concluded that such a system should be developed for Perth. Work carried out in association with planning for the expansion of Queen Elizabeth II Medical Centre has outlined the critical requirement for improved public transport services to and from the precinct in order to meet the demand for travel for peak hour employee movements. The University of Western Australia (UWA) has also documented projected student enrolments over the next 10 years; a growth rate of 3.7% per year and a cap on car parking will create a heightened demand for public transit services to and from the University that would be difficult to meet by buses alone.
1 State of Environment Report, Western Australia 2007 http://www.soe.wa.gov.au/report/human-settlements/transport.html2 Department for Planning and Infrastructure Dialogue with the City Issues Paper http://www.dpi.wa.gov.au/mediaFiles/dialogue_issues.pdf
Perth Light Rail Study T:\78105106 - Perth Light Rail\00\doc\reports\Final Report\Perth Light Rail Study Report_13Aug07_Final.doc Revision 0 13 August 2007 Page i

The expected patronage of a light rail system serving UWA, QEIIMC, Subiaco Activity Centre, West Perth Neighbourhood Centre, Perth CBD and the East Perth Riverside commercial and residential redevelopment area, is estimated at around 45,000 trips per average week day3. To put this in perspective, the total daily patronage of the northern heavy rail line to Joondalup is about 50,000 trips per day.
The reality is that by the time a light rail system is implemented in Perth, the demand will most likely be sufficient to patronise a more frequent service than initially proposed by this report, and these services will most likely operate at capacity. Demand certainly already exists for this type of transit mode in Perth, and this demand will only increase over time, particularly across inner suburbs and between key activity nodes.
An on-street light rail system operating at high frequency must be assured a prioritised corridor within the road reserve in order to meet scheduling commitments and provide an efficient and effective level of service. There is little point investing in large scale infrastructure without making the most efficient use of it, which involves delivering a service that guarantees a predictable journey time and consistent schedule to sustain patronage levels.
Perth has many narrow roads that are presently largely occupied by private vehicles; mostly space for the movement and parking of cars and light commercial vehicles. City centre street environments are also more than movement corridors, with land uses such as cafes and restaurants spilling out onto the pavement. The provision of trees and street furniture enhances the overall amenity of the area.
It is not possible to retrofit an on-street light rail system through the central areas and Activity Centres of Subiaco and Perth without experiencing a significant degree of change to the street environment and the allocation of road space to other users. Street users are not just motorists and pedestrians. A full complement of street users includes:
� Pedestrians who are shoppers, browsers, public transport customers, commuters and joggers � Motorists who are passing through, or looking for a parking space, or have a exact local
destination � Cyclists and/or people utilising other forms of non-motorised transport, who are also either
passing through or stopping in the area to work and shop, or provide courier services to businesses
� Public transport vehicles that are passing through, picking up or dropping off passengers, or stopping at a terminus
In addition, city centre street environments are increasingly seen as more than just a movement corridor, with land uses such as cafes and restaurants spilling out onto the pavement. The variety of street users and uses is complex, multitudinous and invariably interrelated, and therefore road space needs to be prioritised from one location to another depending on the needs of each user group and the specific character of the area.
The delivery of light rail into Perth has been found to be feasible, and should also be socially acceptable as long as the communities and planning authorities associated with the proposed route are included in discussions regarding final route adoption, streetscape design and land use change. Businesses will adapt to serve the custom brought by the light rail system, providing a sufficient lead time is available to make transition plans and adjust to any loss of on-street parking. Local housing development plans will respond to the changing environment and potential for a denser built form.
3 based on today’s figures and an assumed increase in public transport mode share over the next 10 yearsPerth Light Rail Study T:\78105106 - Perth Light Rail\00\doc\reports\Final Report\Perth Light Rail Study Report_13Aug07_Final.doc Revision 0 13 August 2007 Page ii

Perth is not the first place in the world to implement a light rail system into an existing urban area. Cities all over the world are investigating light rail opportunities, technological options and system types to suit their individual requirements. Perth has every reason to explore the benefits that light rail could bring to both the mobility and accessibility of the city, but also the economic regeneration influence that permanent public transport infrastructure can bring to local and regional centres.
The cost of delivering such a system will be multiple millions of dollars; naturally this project incorporates not just the provision of rails on roads, but also includes signalling changes and installation of a priority system for light rail, depot construction as part of integrated developments, drainage and street realignment, displacement and relocation of existing on-street facilities, land acquisition and remediation, stop design and provision of materials, purchase of light rail vehicles and operations system, and on-going operational costs from year to year.
However the cost of not investigating new transit options for Perth could be much higher: the social impacts of enforced car ownership, the environmental impacts of undertaking 2.7 trips per person per day by private car, the economic impacts of providing more road space to accommodate peak hour traffic flow demands, and the unsustainable physical impacts upon the city of allowing cars to dominate the inner metropolitan area.
This report provides an assessment of the physical feasibility of introducing light rail into a specific area of inner Perth, but more detailed work is still required. This is a stepping stone towards a more comprehensive technical and economic feasibility assessment and business case for a light rail system that will serve the business and residential communities of inner Perth and could form the basis of a larger light rail network across Perth that could be introduced over the next 25 years.
Perth Light Rail Study T:\78105106 - Perth Light Rail\00\doc\reports\Final Report\Perth Light Rail Study Report_13Aug07_Final.doc Revision 0 13 August 2007 Page iii

Executive Summary The Perth Light Rail Study has been commissioned by the Department for Planning and Infrastructure to investigate the feasibility of introducing a light rail alignment between East Perth and the City of Subiaco. Such an alignment would connect some of the major Activity Centres of inner Perth, and would provide improved public transport capacity between the Queen Elizabeth II Medical Centre (QEIIMC), the University of Western Australia’s (UWA) Crawley campus and the Perth CBD.
The purpose of this study has been to identify a route for a light rail service that could link Subiaco with East Perth. The project included an engineering feasibility study to investigate the physical dimensions of a light rail system that could be suitable for Perth, including:
� A detailed review of technological options � An assessment of the impact of a light rail system on:
– Existing public transport services and patronage – Traffic circulation patterns – Public on-street facilities – The development potential of adjacent land – Other planning issues including the amenity of the urban streetscape
� Development of: – A concept design – Preliminary costing of the infrastructure, discounting the new signalling requirements and the
cost of any additional land
Members of stakeholder organisations were invited to sit on a project Steering Committee and also a project Working Group to assist the development of the study and decision making processes.
During project inception the Steering Committee agreed that the study needed to be undertaken in light of the prospective roles light rail could be required to fulfil in Perth; light rail as a mass transit system, and light rail as a place-making urban regeneration catalyst.
The Role of Light Rail As a mass-transit system, light rail can provide a mixture of the on-street accessibility of buses and the higher speed and service reliability of heavy rail. It can be put on the street like a bus, or in a separate corridor like a train. It can also provide new network links between key activity nodes and a fast and efficient service if the appropriate road space and direct route alignment can be identified.
Light rail is more visual than buses due to the greater level of permanent infrastructure introduced into the urban realm, and it is because of this that it is often claimed to assist the regeneration of urban areas that require a boost to their local economy; the provision of a permanent public transport service with a high degree of visibility and permanence, which attracts businesses, employment and spending.
Technology Options Light rail vehicles vary in size with a wide range of configurations from single car rigid vehicles to the longer articulated vehicles. Two types of light rail operations exist:
� Single-ended vehicles that the driver can only operate from the front that require a turnaround loop at the end of each line
Perth Light Rail Study T:\78105106 - Perth Light Rail\00\doc\reports\Final Report\Perth Light Rail Study Report_13Aug07_Final.doc Revision 0 13 August 2007 Page iv

� Double-ended vehicles where the driver can operate the vehicle from cabs located at each end of the vehicle
Light rail transit vehicles can be propelled by various types of power including overhead electric, third-rail electric, diesel and alternative fuels. They can operate over a variety of smooth surfaces that can be designed to complement the surrounding environment. Light rail systems also require depots to provide a safe and secure location for storage of vehicles, facilities for efficient and economic inspection and cleaning of vehicles and for regular maintenance. The Steering Committee adopted a position that a light rail system for Perth comply with the following attributes:
� Low-floor double-ended electric light rail vehicles � Overhead power supply using light weight span wires to minimise visual intrusion (ground-level
pickup could be possible once technology is more reliable) � Provision of two depot sites, one with a heavy maintenance facility � Brick or block-paved track for transit malls, concrete track corridor for other street sections � Vegetated track adjacent to parklands and residential areas � Advanced real time information and tracking systems � The use of SmartRider for ticketing with integrated public transport fares
Route Alignment and Depot Locations Five potential light rail route alignment options were identified and were reviewed by the Working Group and Steering Committee. A single base route was selected from these five, linking QEIIMC and UWA to East Perth via Subiaco and the Perth CBD. The route incorporated an extension along Hay Street to a potential secondary depot site at Jolimont and included two sub-route options through Subiaco:
1. Rokeby Road (primary place making) 2. Thomas Street (superior operating speed mass transit)
The Steering Committee workshopped the two sub-routes and judged each against three overarching project objectives:
� Creating an economic catalyst for development � Ensuring nett positive impact on local area � Facilitating an integrated public transport system
The Rokeby Road option was selected as the preferred route due to its larger patronage catchment area and place-making potential.
The primary depot (inclusive of the maintenance facility) location has been proposed between Royal Street and Brown Street in the East Perth, adjacent to Central TAFE and close to Claisebrook railway station. A secondary depot location has been proposed in Jolimont between the Matthews Netball Centre and the Pat Goodridge Hockey Centre off Selby Street.
Alignment Design Characteristics The road reservation width along the majority of the route is 20 metres, although there are some 16 metre pinch points in the Perth CBD area and more generous widths in the outer city areas (30-40 metres). A collection of desirable streetscape characteristics and facilities along the light rail route
Perth Light Rail Study T:\78105106 - Perth Light Rail\00\doc\reports\Final Report\Perth Light Rail Study Report_13Aug07_Final.doc Revision 0 13 August 2007 Page v

were compiled from discussions with local Council traffic engineering and planning officers, the results of kerbside and land use surveys along the preferred route, and specific road design standards for:
– Traffic lanes – On-street car parking – Pedestrian circulation space – Dedicated light rail lanes – Service vehicle bays – Trees and shop awnings – Easy access light rail stops – Al fresco dining space
Some flexibility is required along the road reservation between route sections to allow for a variety of uses within the streetscape.
Public Transport Integration The following issues regarding existing public transport services and future modal integration are relevant to the preferred alignment:
� The Red CAT route would be discontinued upon introduction of the light rail � The Free Transit Zone would be maintained. Any cross-boundary trips between the Cities of
Perth and Subiaco would generate at least a Zone 1 fare � Interchange between heavy and light rail would be possible at Subiaco, Perth Central, William
Street and Claisebrook railway stations � New interchange opportunities would arise between light rail and bus at the Jolimont depot site,
Stirling Highway at UWA, and QEIIMC
Feasibility Traffic Impact In general the results of traffic modelling show no fatal flaws along the proposed light rail route, although results from the assessment of isolated intersections conclude that some increased congestion will occur at:
� Intersection between Rokeby Road / Bagot Road � Intersection between Stirling Highway / Broadway / Hampden Road
The reintroduction of two-way traffic along a number of current one-way routes such as William Street, Barrack Street, Murray Street, and Roberts Road could potentially address anticipated negative impacts that result from the implementation of a light rail route. Detailed traffic and public transport micro-simulation will be required to clarify levels of impact and appropriate network changes as well as potential schedule integration.
Patronage The total daily weekday patronage on the light rail system can be estimated as the sum of the residential and employee use, plus the QEIIMC/UWA specific growth and the lunch peak Red CAT patronage, which equates to some 45,600 trips per day. This is similar to the current daily patronage of the northern heavy rail commuter line to Joondalup.
Engineering A concept design was developed for the preferred alignment utilising the design parameters agreed for technology and street environment. It has been found that the alignment is physically possible to implement and it is probable that increased economic activity would occur alongside the light rail corridor.
Perth Light Rail Study T:\78105106 - Perth Light Rail\00\doc\reports\Final Report\Perth Light Rail Study Report_13Aug07_Final.doc Revision 0 13 August 2007 Page vi

The concept design segregates the light rail corridor from the vehicle carriageways for as much of the alignment as physically possible without causing detriment to the pedestrian environment and general street amenity; there are a few locations where mixed traffic and light rail corridors have been proposed. A traffic management plan would need to accompany the detailed design for each of these sections of the alignment.
Costs It is estimated that infrastructure costs will be in the order of $252 million, rolling stock costs $140 million and annual operating costs $10 million. The infrastructure cost estimate includes indicative costs for land acquisition of the two depot sites and a 10 percent provision for urban design and place-making initiatives to ensure the successful integration of the light rail infrastructure into the surrounding streetscape.
Future Network Extensions A light rail link between Subiaco and East Perth could potentially be the core of a new light rail network for central Perth, which in future could branch out across the inner metropolitan Perth area. Key trip generators external to the core route that could act as anchors for new termini in the inner metropolitan area could include:
� Perth Airport � Curtin University � North-eastern inner suburb activity centre (Mt Lawley to Embleton) � North-western inner suburb activity centre (Northbridge to Yokine) � South-eastern inner suburb activity centre (Victoria Park to Waterford) � Challenge Stadium
There may also be a demand to connect Claremont to South Perth via an inner orbital route, which could provide interchange opportunities with the radial routes.
The successful implementation and ultimate expansion of a light rail system in Perth will be governed by the ability to implement the proposed core route and in developing and funding resolution to the following significant physical constraints:
1) Crossing of the Mitchell Freeway and commuter rail reserve in the Leederville area 2) Crossing of the Mitchell Freeway and commuter rail reserve in the East Perth area 3) Crossing the Swan River via the Causeway in East Perth
Overall Benefit Cities all over the world are investigating light rail opportunities, technological options and system types to suit their individual requirements. Given its planned growth, Perth has good reason to explore the benefits that light rail could bring to both the mobility and accessibility of the City, the QEIIMC and other medical facilities, UWA and other educational institutions, and major sports and entertainment stadia. Even more critically, light rail can provide the economic regeneration support that permanent public transport infrastructure can bring to local and regional growth areas.
Perth Light Rail Study T:\78105106 - Perth Light Rail\00\doc\reports\Final Report\Perth Light Rail Study Report_13Aug07_Final.doc Revision 0 13 August 2007 Page vii

Way Forward There are a number of issues that require further investigation, such as the:
� Position and impacts of the light rail within a one-way vehicular environment � Detailed position of light rail stops to fulfil Disabled Discrimination Act, 1992 (DDA) requirements
and permit access to minor roads � Provision of numerous property access points through the central area � Net impact on local business due to the removal of on-street car parking on the route through
activity centres and corridors
To progress the findings of this study to implementation, further actions will be required:
� Detailed micro-simulation modelling � Planning and consultation � Patronage forecasting � Economic Analysis
Perth Light Rail Study T:\78105106 - Perth Light Rail\00\doc\reports\Final Report\Perth Light Rail Study Report_13Aug07_Final.doc Revision 0 13 August 2007 Page viii

1.0 IntroductionThe Perth Light Rail Study has been commissioned by the Department for Planning and Infrastructure to investigate the feasibility of introducing a light rail alignment between East Perth and the City of Subiaco. The study area is shown in Figure 1.1, which also illustrates the location of key Activity Centres and major public transport nodes.
Figure 1.1 Study Area
The fundamental scope of this study is to understand whether a light rail system can physically be accommodated within Perth’s road network between these two locations; however the process of selecting a physically feasible alignment requires an assessment of more than engineering capabilities. This study incorporates an assessment of strategic economic considerations that investigates the reality of the “place-making” potential of the proposed route alignment, and also undertakes a localised analysis of transport integration, traffic circulation patterns, land use planning potential, street-environment and technical design criteria, system capacity requirements, social preferences, and political direction to produce a more robust route feasibility study output.
This report will inform relevant planning agencies, Councils and other stakeholders on the technical requirements and planning issues associated with a light rail system for Perth before any further decisions are made regarding the viability of implementing such a project. It must be emphasised that this study was not conducted to justify the need for light rail transit in Perth, but whether such a proposal has merit to warrant further detailed investigation. Accordingly, the study process has been overseen by a Steering Committee and Working Group led by the Department for Planning and Infrastructure (DPI) including relevant State and local government agencies as well other stakeholders.
University of Western Australia
Queen Elizabeth II Medical Centre
Subiaco Activity Centre and Oval
WACA and Riverside
Central BusinessDistrict
West Perth Activity Centre
Royal Perth Hospital
Harbour Town
PrincessMargaret Hospital
Study Area Train Station Bus Station Park n Ride
Perth Light Rail Study T:\78105106 - Perth Light Rail\00\doc\reports\Final Report\Perth Light Rail Study Report_13Aug07_Final.doc Revision 0 13 August 2007 Page 1

1.1 Study Purpose The Western Australia State Government’s Network City planning strategy, announced in November 2005, supports a more compact inner city mixed use development that is supported by a high quality public transport system in Perth. A key part of the Network City strategy is to develop higher density, inner suburban corridors that link major activity centres with improved public transport.
Specifically, this study has originated from a ministerial initiative to investigate the feasibility of implementing a light rail route linking Subiaco, the Perth Central Business District (CBD) with East Perth in essentially the inner city area of Perth. Additionally, the capability of public transport to serve the growing demand between the Perth CBD and both the University of Western Australia’s Crawley campus and the Queen Elizabeth II Medical Centre have also been included for review as part of this light rail study.
The purpose of this study has been to identify the route and technology requirements for such a light rail route, and to assess the interrelated social, economic, planning, design and transport integration issues. The scope of the study did not extend to include a full patronage and economic analysis and therefore recommendations have not been made concerning whether the light rail route should be constructed.
1.2 Study Scope and Objectives The original study scope and objectives of this study are outlined in Figure 1.2.
Figure 1.2 Study Scope and Objectives
Identify existing land uses, growth areas and potential for land use change
Confirm engineering feasibility and depot locations
Include traffic impact, public transport network impacts, and implications for the Free Transit Zone
Gather data from State and local Government
Undertake technology review
Identify route alignment options
Identify impacts of preferred option
Prepare concept design and draft report
Prepare route plans and cost estimate
Undertake high-level economic review
Undertake service capacity estimate
Examine integration issues with existing public transport and a future light rail network
Con
sult
with
Wor
king
Gro
upan
dS
teer
ing
Com
mitt
ee
Preparation of final report
Project Inception
Perth Light Rail Study T:\78105106 - Perth Light Rail\00\doc\reports\Final Report\Perth Light Rail Study Report_13Aug07_Final.doc Revision 0 13 August 2007 Page 2

1.3 Stakeholder Consultation Process The Perth Light Rail Study involved many stakeholders. Potential modifications to the regional and local road network required the assistance of Main Roads Western Australia (MRWA) and local authority traffic engineers and urban designers. The development of a new public transport system required input from the Public Transport Authority (PTA) and Department for Planning and Infrastructure (DPI) officers, particularly regarding impact on and integration with existing transport networks. Ongoing input from local authority, DPI and East Perth Redevelopment Authority (EPRA) personnel will be critical to the management of potential integration, and interaction with, existing activity centres and proposed developments.
To ensure that the project addressed the concerns of all key stakeholders, members of key stakeholder organisations were invited to form part of a Project Steering Committee. The role of the Committee was to ensure that each stage of the project was reviewed and agreed upon by each organisation. The project could only progress through each stage when sign-off was achieved at Steering Committee level. The Steering Committee were asked to make decisions on the following key elements of the project:
� Propulsion, system and vehicle technology options � Guiding principles and design criteria for route derivation � Transport Modelling � Engineering Assessment � Patronage Estimate Methodology � Cross Section Route Design Options � Selection of Preferred Route Option
The Steering Committee members were:
� Steve Beyer – Director Urban Transport Systems, DPI (DPI Project Director) � Clare Moore – Team Leader Urban Transport Systems, DPI (DPI Project Manager) � Des Snook – Executive Director, Road Network Services, MRWA � Reece Waldock – Chief Executive Officer, PTA � Tony Morgan – Chief Executive Officer, East Perth Redevelopment Authority � Chester Burton – Chief Executive Officer, City of Subiaco � Peter Monks – Director of Planning and Development, City of Perth � Councillor Chris Hardy – City of Perth � Councillor Lisa Scaffidi – City of Perth � Richard Farrell / Michael Kane – Principal Policy Advisor, Office of Minister for Planning and
Infrastructure
A Working Group was also created to provide technical support to the Steering Committee and also to the Project Team, and has been attended by technical officers from the same organisations. The role of the Working Group was to provide technical and specific agency input to provide information and guidance on detailed aspects of the project. The Working Group members were:
� John Venables – Traffic Operations Manager, MRWA � Mark Burgess –Executive Director Transperth, PTA � Mark Hedges – Executive Director Planning and Development, EPRA � Anne Edmonds – Senior Manager Planning, EPRA � Geoff Glass / Sue Burrows – Director Development Services, City of Subiaco
Perth Light Rail Study T:\78105106 - Perth Light Rail\00\doc\reports\Final Report\Perth Light Rail Study Report_13Aug07_Final.doc Revision 0 13 August 2007 Page 3

� Russell Kingdom – Manager Urban Development, City of Perth � Michael Priest – Traffic Engineer, City of Perth � Matt Buckels – Transport Planner, University of Western Australia
In addition, one-on-one meetings were undertaken with key stakeholder groups during the streetscape design stage and depot location assessment to ensure that the concerns of each organisation can be accurately reflected in the design. The final design will complement the existing urban setting of each street and activity centre:
� City of Subiaco (streetscape design) � City of Perth (streetscape design) � Town of Cambridge (depot location) � City of Nedlands (depot location) � University of Western Australia (depot location) � East Perth Redevelopment Authority (depot location)
1.4 Report Structure The study report comprises 15 chapters which include the following topics:
Chapter Content
2Overview of the planning context, history of light rail in Perth, review of previous planning studies, and summary of the current public transport network, land use and activity centres
3 Existing land use and transport networks (growth areas, activity centres, road network, public transport networks)
4 Background to the role of light rail in urban centres
5 Light rail technology options that are available internationally and interstate with a recommendation for the technology that is appropriate for use in Perth
6 Light rail transit as an application in the Perth context7 The development of alternative light rail route options
8 Public transport integration opportunities and issues for the bus network and railway stations
9 Engineering assessment, including an analysis of streetscape design and road space allocation, depot requirements and traffic and transportation impacts
10 Service capacity estimates
11 Streetscape design options, including review of road reservation widths, existing verge and ground floor uses, light rail stop designs and overall implementation cost estimate
12 Strategic economic assessment including potential land use opportunities and value capture
13 A future light rail network across Perth and how this proposed system fits in as a first phase
14 Overall conclusions of the study and way-forward to progress the implementation 15 References cited and other literature that has been reviewed
Perth Light Rail Study T:\78105106 - Perth Light Rail\00\doc\reports\Final Report\Perth Light Rail Study Report_13Aug07_Final.doc Revision 0 13 August 2007 Page 4

2.0 Planning Context 2.1 History of Light Rail Transit in Perth In January 1899, the first electric tram route was opened in Perth with a service along Hay Street between the former Transperth depot in East Perth and Thomas Street in West Perth. Other tram lines were added in the early 1900’s to create a network of routes to Nedlands, Subiaco, Wembley, Mt Hawthorn, Leederville, North Perth, Highgate, Mt Lawley, Victoria Park, South Perth and Como. The first electric trams between the City and North Perth were implemented in December 1906 via Beaufort, Bulwer and Fitzgerald Streets.
Figure 2.1 shows the network of radial rail, tram and trolleybus routes that operated in Perth in the 1940’s when urban development was contained within a relatively compact city. The tramway routes followed the main streets with local shopping precincts into Perth CBD. In the late 1950’s and 1960’s, as population and suburban development increased, the tram and trolleybus network was decommissioned and converted to diesel buses.
Figure 2.1 Perth Tramway Routes in the 1940’s
Perth Light Rail Study T:\78105106 - Perth Light Rail\00\doc\reports\Final Report\Perth Light Rail Study Report_13Aug07_Final.doc Revision 0 13 August 2007 Page 5

2.2 Perth Transport Planning Studies This section provides a brief overview of recent planning studies which have formed a basis for this alignment investigation study.
2.2.1 Perth Network City Strategic Planning Framework
The Network City strategic planning framework was released in November 2005 by the Western Australian Planning Commission (WAPC). It is the new strategic framework for guiding Perth and Peel to a sustainable future. It resulted from an open, consultative process initiated by the Minister for Planning and Infrastructure, Hon Alannah MacTiernan in 2003 known as Dialogue with the City.
The Network City strategy espouses eight fundamental principles against which all regional policies are to be tested:
� Manage growth by sharing responsibility between industry, communities and government � Plan with communities � Nurture the environment � Make fuller use of urban land � Encourage public over private transport � Strengthen local sense of place � Develop strategies which deliver local jobs � Provide affordable housing
Specifically, Network City outlines the concepts of activity centres, activity corridors and transport corridors as part of the planning framework. The transport elements include the creation of urban villages to support activity corridors, higher density around transport nodes, providing a wide range of high quality transport including rail, bus, ferries, pedestrian / cycle and reducing car dependency through travel demand management.
For public transport, the strategy provides guidelines for activity corridors and centres which are of direct relevance to this study such as to:
� Provide frequent bus [or other rapid transit] services along activity corridors with a minimum 15 minute frequency each way in peak period with good user amenity.
� Provide queue jump facilities or dedicated transit lanes where required which may mean taking lanes away from cars if necessary as well as implementing bus priority at intersections to minimise delays.
� Consider dedicated transit options along the busiest activity corridors. � Provide feeder bus services to major activity centres from surrounding communities. � Provide local pedestrian infrastructure links to bus stops, interchanges and stations to facilitate
pedestrian access.
The WAPC has prepared a draft State Planning Policy which confirms Network City replaces Metroplan as the major metropolitan strategic planning document.
2.2.2 City of Perth Inner City Transport Study
In 2002, the City of Perth commissioned the Inner City Transport Study, which examined options for the inner city transport system in Perth. The core study area was Perth CBD, with a wider study area
Perth Light Rail Study T:\78105106 - Perth Light Rail\00\doc\reports\Final Report\Perth Light Rail Study Report_13Aug07_Final.doc Revision 0 13 August 2007 Page 6

extending approximately 8 km from central Perth. Links to the adjacent inner suburbs, such as Subiaco and Victoria Park, were also addressed.
The study also included a review of alternative transport modes that included conventional buses, electric buses, optically-guided buses, light rail transit (LRT), funiculars, moving sidewalks, cable cars, people movers, monorail systems and ferries.
A public transport system for the central area within the City of Perth was developed to cater to the following transport objectives:
� An inner city distribution of commuters from the train and bus stations. � Tourist, convention and entertainment movements to and within the CBD. � Travel between the inner residential suburbs and Perth CBD.
Various inner city scenarios were presented with a discussion of the advantages and disadvantages of each. The compatibility between the inner city transport scenarios and the proposed William Street and Mitchell Freeway options for the South West Metropolitan Railway were also broadly addressed.
A strategic light rail network was proposed for the inner suburbs linking major universities with Perth CBD. This network plan is shown Figure 2.2.
Figure 2.2 Perth Light Rail Network Proposed in the City of Perth Study
Source: HGM, 2002
Proposed Line 1 Proposed Line 2
Perth Light Rail Study T:\78105106 - Perth Light Rail\00\doc\reports\Final Report\Perth Light Rail Study Report_13Aug07_Final.doc Revision 0 13 August 2007 Page 7

2.2.3 Streetcar Inner City Transport System for Perth – Various Studies
The City of Subiaco commissioned a study in February 2005 that examined the concept of a Streetcar Inner City Transport System for Perth. It considered some of the benefits that such a system could deliver over time including the ability to develop more residential, mixed use and commercial development close to the City. This would have potential to slow incremental suburban growth on the edge of Perth and reduce expenditure on infrastructure in outer areas.
The main purpose of this report was to stimulate discussion with key stakeholders and the community. This study was not to be considered as a rigorous transport analysis, but rather the beginning of a potentially large planning process.
The concept plan from the report is shown Figure 2.3 with connections to the Circle Route and heavy rail network indicated.
Figure 2.3 Concept for an Inner City Transport System
Source: SKM, 2005
The City of Subiaco commissioned a study in March 2005 to review the feasibility of an improved public transport in the inner areas of Perth over a period of 20 to 30 years. It considered the use of a streetcar (or a combination of streetcar and high frequency buses) operating on a broad network.
The report indicated that a streetcar system linking the UWA, QEII Medical Centre, Subiaco, West Perth, Perth CBD, East Perth, Victoria Park, Bentley Technology Precinct, Curtin University and the Canning Bridge Railway Station on the Perth to Mandurah Railway is likely to deliver the greatest benefit in the short term. This report was not a feasibility study or a master plan. The intention was to raise awareness of the benefits of a streetcar system and to raise issues that would need to be the subject of more rigorous examination.
Perth Light Rail Study T:\78105106 - Perth Light Rail\00\doc\reports\Final Report\Perth Light Rail Study Report_13Aug07_Final.doc Revision 0 13 August 2007 Page 8

3.0 Existing Land Uses and Transport Networks 3.1 Land Use and Activity Centres Development is controlled partly by land use designations, which are defined by the local Town Planning Scheme of each local authority, or by the East Perth Redevelopment Authority’s (EPRA) plans and schemes for a number of inner city areas. The land use zones applicable across this project’s study area are illustrated in Figure 3.1.
Figure 3.1 Existing Land Use in Perth and Subiaco
It can be seen quite clearly that there are locations where commercial land uses have been grouped together to create busier areas, known as activity centres, town centres, or activity corridors. These types of land uses tend to stimulate more travel to and from the area, for example the CBD of Perth, or the centre of Subiaco. This is because these areas are generally densely developed and generate a large number of jobs. More demand for travel means there will be a greater need for transport access and transport options.
At present, most residential areas are spread out around activity centres of varying sizes, but there are limited opportunities to reside in the activity centres themselves. This tradition is changing, and already there are more inner city apartments being constructed in West Perth, East Perth, Northbridge and Subiaco. By providing housing in locations where there is already a high level of activity there are three important transport issues that arise:
1) Some people may no longer need to travel far to get to work and may by able to walk. 2) Other people may work in a neighbouring activity centre where parking is at a premium and
therefore short public transport trips are a desirable and more affordable mode.
Perth Light Rail Study T:\78105106 - Perth Light Rail\00\doc\reports\Final Report\Perth Light Rail Study Report_13Aug07_Final.doc Revision 0 13 August 2007 Page 9

3) Remaining residents may work some distance away on or off the rail network and may need to travel on a variety of transport modes to reach their destination.
Identifying activity centres and transport nodes within the study area provides the basis for the development and alignment definition of a light rail route. Route development should seek to connect these activity centres, which over time will assist with the revitalisation of areas between centrally located hubs, for example West Perth which is located between Subiaco and the CBD.
As defined in line with the principles of Network City (2004), these centres “are locations where a range of activities are encouraged, including employment, retail, living, entertainment or higher education”. A number of activity centres and activity nodes have been identified within the study areaand are illustrated in Figure 3.2.
Figure 3.2 Key Activity Centres and Growth Areas
There are large and small activity centres. At the top of the activity centre hierarchy sits the Perth CBD, based on the large range of functions found in one location. Subiaco would be a second tier activity centre, and the future East Perth and West Perth centres would be third tier.
Specialised activity centres such as the UWA, QEIIMC and Proposed Entertainment Precinct (including the Perth Arena) are specific destinations for students, medical needs and recreation. There is the potential to diversify land uses around these precincts to attract a more balanced range of people throughout the day and into the night.
Perth Light Rail Study T:\78105106 - Perth Light Rail\00\doc\reports\Final Report\Perth Light Rail Study Report_13Aug07_Final.doc Revision 0 13 August 2007 Page 10

3.1.1 Perth Central Business District (CBD)
The Perth CBD is of prime importance to this study area as it has the highest trip generation rate in the metropolitan area. Furthermore, the planning initiatives and patterns toward inner city living will increase this rate and require better connections to East and West Perth.
� Inner city living increased by 46 percent between 1996 and 2001. � 56 percent of the population reside in apartments. � There is a high proportion of lone person households and couples without children. � 32 percent of CBD households do not own a car. � 25 percent of residents walk to work.(Source: 2001 ABS Census – available at time of writing)
Murray Street Hay Street St Georges Terrace
3.1.2 Subiaco Commercial Precinct
Subiaco activity centre is a regional centre with high order functional diversity. It has a prominent cultural and entertainment precinct which attracts a number of evening and weekend trips.
� There is a high proportion of young singles, couples and young families living in the area. � 55 percent of the residents in Subiaco are classified as Professionals � 70 percent of residents take the car to work, 14 percent take public transport, 11 percent walk,
and 4 percent cycle � The Subiaco Shopper Survey, October 2003 showed that 86 percent of shoppers in Subiaco went
there to purchase discretionary items or essential household items which suggests it is a destination of particular choice for the majority of shoppers
� The same survey reported that shoppers do not consider car parking to be a significant issue in Subiaco, in contrast to business owners who feel the car parking supply is limited
� The redevelopment of a significant proportion of central Subiaco has increased the vitality, economic prosperity and accessibility of the shopping and entertainment precinct, and has also greatly increased the number of local residents
(Source: 2001 ABS Census – available at time of writing)
Perth Light Rail Study T:\78105106 - Perth Light Rail\00\doc\reports\Final Report\Perth Light Rail Study Report_13Aug07_Final.doc Revision 0 13 August 2007 Page 11

Subiaco Railway Station Rokeby Road café precinct Hay Street traffic calming
3.1.3 West Perth Commercial Precinct
This precinct is a major employment zone with a high degree of information technology, mining, medical and other higher order industries in the area. West Perth is a growing inner city residential area.
� Between 1996 and 2001, the West Perth residential population increased by 71 percent. � 31 percent of people do not own a car. � Walking is the most preferred method of travel to work. (Source: 2001 ABS Census – available at time of writing)
Hay Street shopping village in West Perth
Wellington Street at the Harbour Town Shopping Centre
3.1.4 Royal Perth Hospital
Royal Perth Hospital (RPH) has been a major tertiary hospital in the CBD, offering specialised medical surgeries / patient treatment. The Hospital will be reduced in size in forthcoming years with 90 percent of the beds moving from RPH. The majority will be distributed to two other major hospitals, including Sir Charles Gardiner / QEII Medical Centre4. Currently, 34 percent of visitors to RPH use public transport, which may be due to proximity to the train station and connecting CAT bus services. Residences for RPH employees are scattered over the entire metropolitan area with few employees living within walking distance.
3.1.5 Subiaco Oval
The Subiaco Oval is another major special event attractor. It is located within a short walk distance to both West Leederville and Subiaco railway stations, although there remains a public transport capacity shortfall during popular sporting events. The future of the stadium is currently in question; sizable expansion is currently being considered from 43,000 to 60,000 seats, however there are also options to relocate the entire facility elsewhere. Future uses for this site could therefore vary considerably and cannot be included with any certainty in this study at this point in time.
4 Source of RPH figures from Travel Survey Results, Royal Perth Hospital (SKM, July 2004)
Perth Light Rail Study T:\78105106 - Perth Light Rail\00\doc\reports\Final Report\Perth Light Rail Study Report_13Aug07_Final.doc Revision 0 13 August 2007 Page 12
3.1.6 WACA and Gloucester Park
Both these activity centres are located in the EPRA Riverside redevelopment site. They are major event attractors and trip generators during both regular and special events and are currently serviced by conventional bus and CAT bus services. There are development proposals to upgrade the WACA precinct; however uncertainty exists regarding the future of the oval and the likelihood of such redevelopment.
3.1.7 Perth Central Railway Station
Perth Central railway station is a very important transport facility for the CBD. It is the largest intermodal transfer station in the Perth metropolitan railway network and provides an excellent connection to the Wellington Street Bus Station. Public transport passengers would benefit if a light rail service connected with the station as this would provide people with a greater route choice for onward travel to and from the station.
Perth Central railway station has the largest number of station boardings as all suburban railway lines meet at this central point. Major redevelopment on adjacent land as part of EPRA’s Northbridge Link Project will increase accessibility and prominence of the Perth Central railway station and also increase demand for transport.
3.1.8 Perth Foreshore
The Perth Foreshore has been a largely underutilised precinct and is partially severed from the CBD due to issues of slope, distance and traffic. However, the growth of activity in recent years on the foreshore has seen the creation of an entertainment / cultural precinct and can stimulate a large number of trips for one-off events.
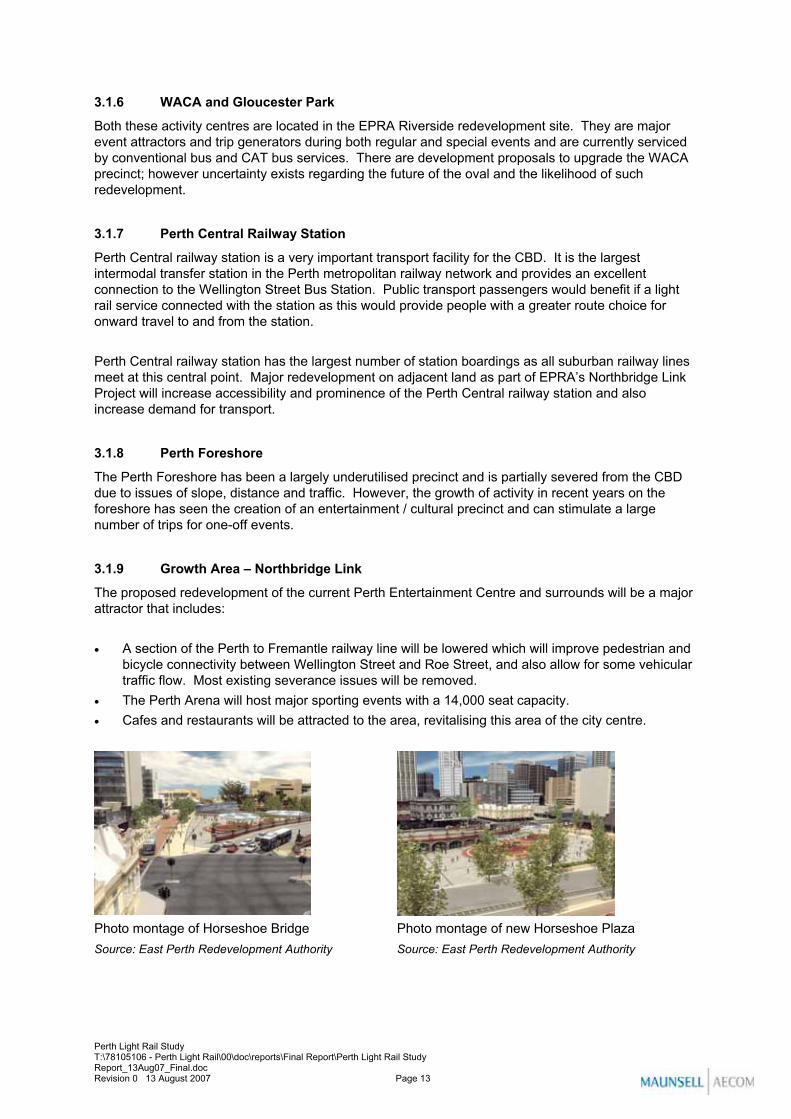
3.1.9 Growth Area – Northbridge Link
The proposed redevelopment of the current Perth Entertainment Centre and surrounds will be a major attractor that includes:
� A section of the Perth to Fremantle railway line will be lowered which will improve pedestrian and bicycle connectivity between Wellington Street and Roe Street, and also allow for some vehicular traffic flow. Most existing severance issues will be removed.
� The Perth Arena will host major sporting events with a 14,000 seat capacity.� Cafes and restaurants will be attracted to the area, revitalising this area of the city centre.
Photo montage of Horseshoe Bridge Source: East Perth Redevelopment Authority
Photo montage of new Horseshoe Plaza Source: East Perth Redevelopment Authority
Perth Light Rail Study T:\78105106 - Perth Light Rail\00\doc\reports\Final Report\Perth Light Rail Study Report_13Aug07_Final.doc Revision 0 13 August 2007 Page 13

3.1.10 Growth Area – Riverside
The East Perth area is currently undergoing substantial redevelopment and revitalisation in an effort to make more of this central riverside location. The current plans for expansion show a 40 hectare master planned community able to accommodate 5,000 residents, office space, 1000 employees, and 4,000m2 of retail space within the next 10-15 years.
Existing view of East PerthSource: EPRA – Riverside Master Plan
Proposed Riverside redevelopment Photos Courtesy of EPRA
3.1.11 Growth Area – Queen Elizabeth II Medical Centre
Located adjacent to the Crawley campus of UWA, the Queen Elizabeth II Medical Centre (QEIIMC) is a major employment generator as well as a specialised activity centre. The QEIIMC will be redeveloped and extended over the next 13 years, in line with State Government future health priority plans. The opportunity to integrate light rail into the new hospital development has been provided for in the precinct structure plan. The QEIIMC is planned for expansion to 1430 beds by 2020, and would employ over 11,000 staff. The main users of light rail to and from QEIIMC would therefore be hospital employees and some hospital visitors.
The King Edward Memorial Hospital and Princess Margaret Hospital will be amalgamated into the QEIIMC. Therefore the sites left behind on Bagot Road and Hay Street will become areas prime for new development within the City of Subiaco.
3.1.12 Growth Area – University of Western Australia
The University of Western Australia (UWA) Crawley campus is the major university campus on the north side of the Swan River in Perth. It generates a large quantity of trips, a large proportion of which are undertaken by public transport.
UWA has approximately 2,900 full time employees and 17,200 students who generate about 24,000 trips each week between Perth CBD and the UWA campus during term time. The University enrolment is growing at a rate of 4 percent per annum; the strategic campus plan for UWA has growth to 20,000 students by 2010 (Source: UWA – Strategic Directions 2005) up to a maximum of 25,000.
Mounts Bay Road Hackett Drive (Somerville Auditorium / student centre)
Hamden Road in the Hollywood shopping and café precinct
Perth Light Rail Study T:\78105106 - Perth Light Rail\00\doc\reports\Final Report\Perth Light Rail Study Report_13Aug07_Final.doc Revision 0 13 August 2007 Page 14

3.2 Road Network The Perth CBD and Subiaco areas are served by a well established road network. Generally these areas are served by a largely grid based road network, with the Mitchell / Kwinana Freeway dissecting the study area north – south. The road network generally experiences heavy traffic congestion during peak traffic periods, with the section of Loftus / Thomas Street between the Mitchell Freeway and Hay Street commonly acknowledged as one of the busiest roads in Perth. At a local level numerous direct access points to businesses, on street parking and a range of other verge activities impact on the ability for roads to provide consistent levels of mobility and access, and as such the potential to include light rail in addition to the existing road aspects.
The City of Perth has recently approved the return to two-way on many city centre streets, a decision which has been integrated into the City of Perth’s 5-year works plan (July 2007). Typically Barrack Street and/or William Street could be considered for possible change. However, given the unknown details about which streets will be upgraded and when, this study has been based on the current street network.
More specifically the potential implementation of a light rail system is likely to impact on the following roads within the study area. The following roads form prominent east-west routes through the study area:
� Wellington Street is a four lane dual carriageway road, which connects the northern component of Thomas Street with East Perth and passes the Perth Central railway station. In the context of a Perth CBD road network, Wellington Street fulfils a vital role in providing east-west traffic mobility through the general area. The Yellow CAT bus route runs along the full extent of the road with the Red and Blue CAT routes both intersecting at Perth Central railway station.
� Murray Street is shown in Figure 3.3. It is a one-way street eastbound from Thomas Street through the eastern Perth CBD up to William Street. Murray Street is a pedestrian mall between William Street and Barrack Street. From Barrack Street to Pier Street Murray Street is a one-way street westbound after which it changes to a short section of two-way street between Pier Street and Irwin Street, followed by a one-way street in the opposite (eastwards) direction up to Victoria Square.
� Hay Street is shown in Figure 3.3. It forms a parallel pair with Murray Street and extends from Trinity Avenue at the WACA Oval to Bennett Street as a two-way street. From Bennett Street it extends westbound up to Irwin Street, followed by a short section of two-way street up to Pier Street. From Pier Street to Barrack Street Hay Street changes back to an eastbound direction up to Barrack Street. The Hay Street pedestrian mall extends from Barrack Street to William Street after which Hay Street continues as a one-way street westbound through West Perth across Thomas Street through Subiaco up to Railway Road / Roberts Road, after which it reverts to a dual carriageway facility.
Figure 3.3 Vehicle Circulation in the City of Perth CBD
Wellington Street
Murray Street
Hay Street
Willi
am S
treet
Bar
rack
Stre
et
Vic
toria
Ave
Irwin
Stre
et
Pie
r Stre
et
Ben
nett
Stre
et
Perth Light Rail Study T:\78105106 - Perth Light Rail\00\doc\reports\Final Report\Perth Light Rail Study Report_13Aug07_Final.doc Revision 0 13 August 2007 Page 15

� Roberts Road is a one-way facility eastbound past Subiaco Oval up to Thomas Street. Together with Hay Street (westbound), Roberts Road forms a one-way pair of roads providing circulation and access to the northern heart of Subiaco.
� Stirling Highway provides a link between Fremantle, Cottesloe, Claremont, Crawley / UWA and the Perth CBD via Mounts Bay Road. It is a high patronage bus route connecting the City Busport and the educational and medical precincts of UWA and QEIIMC.
As mentioned the study area road network consists primarily of a grid road system and in the Perth CBD the following prominent north-south roads cross / intersect with the above east-west roads:
� Hill Street is a one-way street providing the southbound connection from Lord Street via Wittenoom Street into East Perth. Hill Street has traffic signal controlled intersections with the abovementioned east-west roads.
� Barrack Street is a one-way facility northbound from The Esplanade through the Perth CBD, with traffic signal controlled intersections at the abovementioned east-west roads, to form an important public transport route through Mount Lawley. Together with William Street, Barrack Street forms a one-way pair of roads providing connectivity between the Perth CBD and Northbridge.
� William Street is a one-way facility southbound through Northbridge and the Perth CBD up to The Esplanade. Similar in character to Barrack Street, it provides an important public transport link.
Both Barrack Street and William Street feature prominently on both the Red and Blue CAT bus routes.
� Thomas Street is an important north-south connecting road that stretches from the Mitchell Freeway through West Perth / Subiaco along Kings Park to Aberdare Road and then as Winthrop Avenue to an intersection with Stirling Highway / Mounts Bay Road.
The following three roads have important local roles for activity centres and neighbourhood shopping precincts in Subiaco and Nedlands, and could be directly affected by light rail:
� Rokeby Road is a two-way facility categorised by extensive pedestrian and related verge activity, direct access to businesses and a generally slow speed environment. It is arguably the most important local road strongly associated with the successful regeneration of Subiaco.
� Hampton Road as a two-way street fulfils an important main street function in a slow speed environment with on-street parking and direct access to businesses. It directly links (via Hampton Road / Broadway) the QEII medical precinct with the UWA campus in Crawley.
� Broadway is a two-way street from Stirling Highway southwards through Crawley / Nedlands to Melville Water Foreshore along the Swan River. The section just south of Stirling Highway becomes very congested during peak traffic periods as it provides the only traffic signal controlled intersection east of Dalkeith Road.
Perth Light Rail Study T:\78105106 - Perth Light Rail\00\doc\reports\Final Report\Perth Light Rail Study Report_13Aug07_Final.doc Revision 0 13 August 2007 Page 16

3.3 Public Transport Networks The public transport network in the study area is shown in Figure 3.4 and consists of heavy rail infrastructure for passenger transportation, and a variety of bus network options; the CAT (Central Area Transit) bus system which is free and consists of three one-way circular routes, and the general bus routes which serve the outlying suburban areas, particularly those without access to the heavy rail network.
Figure 3.4 Existing Public Transport Routes in the Perth Light Rail Study Area
3.3.1 Heavy Rail Network
The inner city transport system currently includes free travel on the heavy rail network within the designated Free Transit Zone (FTZ) inclusive of the West Perth, Central Perth, McIver, and Claisebrook Stations. These stations provide a linear coverage that services the inner city suburbs of Perth City.
The new Southern Suburbs Railway from the City to Mandurah has seen the development of two new stations in Perth CBD; Esplanade and William Street. The Fremantle line west of Perth Central railway station will be located underground until west of Lake Street.
3.3.2 Bus Network
The inner city transport system provides free travel on the bus network within the designated Free Transit Zone and three specially designed CAT bus routes in Perth CBD, as shown in Figure 3.5.
Perth Light Rail Study T:\78105106 - Perth Light Rail\00\doc\reports\Final Report\Perth Light Rail Study Report_13Aug07_Final.doc Revision 0 13 August 2007 Page 17

Figure 3.5 Existing Perth CAT Bus Network
Source: Public Transport Authority website, 2006
The existing bus services into the CBD operate on the following corridors:
� From the south over the Narrows Bridge to the City Busport with some routes continuing via Mill Street and St Georges Terrace to East Perth and other routes going to the Wellington Street Bus Station via Barrack and William Streets.
� From the east over the Causeway to Adelaide Terrace or Hay Street. � From the west via Kings Park Road and Mounts Bay Road. � From the north via Fitzgerald Street from the north-western inner suburbs and Scarborough
Beach Road. � From the north via William and Beaufort Streets from the north-central suburbs.
3.4 Summary This appraisal of existing land uses, planned growth areas and existing transport network infrastructure builds a picture of:
a) where a light rail service would best complement the transport system b) where a light rail service would best support land uses and trip requirements
It also helps to identify areas where the light rail would be less likely to perform well, for example through large expanses of park land, across hilly areas, or through low-density suburban districts.
Figure 3.6 is a sketch of the study area that illustrates the alignment of the existing rail infrastructure and location of major parks, hills and river course, all of which present barriers for the light rail, or would require careful integration. Figure 3.6 also indicates the predominant land use types across the study area and highlights the major and minor activity centres and growth areas of East Perth, QEIIMC and UWA.
Perth Light Rail Study T:\78105106 - Perth Light Rail\00\doc\reports\Final Report\Perth Light Rail Study Report_13Aug07_Final.doc Revision 0 13 August 2007 Page 18

Figure 3.6 Sketch of Study Area
Subiaco
CBD
Kings Park
Stirling Highway
Thomas Street
Major Commercial Areas Minor Commercial Areas Residential Areas ParklandHilly Topography
Major Activity Centres Minor Activity Centres EPRA Riverside Redevelopment Area QEIIMCUWA Major Roads Heavy Rail Network
Perth Light Rail Study T:\78105106 - Perth Light Rail\00\doc\reports\Final Report\Perth Light Rail Study Report_13Aug07_Final.doc Revision 0 13 August 2007 Page 19

4.0 The Role of Light Rail in Urban Centres This section provides a brief overview of different public transport modes and hierarchies based on a balance between system patronage capacity and the travel time / distance relationship. This section then provides an insight into the two main roles light rail can fulfil in central and inner urban locations, both or either of which may be relevant to Perth.
4.1 Public Transport Modes There are many forms of public transport that can be utilised in urban areas including heavy rail, light rail, monorail, and a variety of bus infrastructure options. Each mode serves a particular purpose with very distinctive characteristics. The mode of public transport is typically determined by the passenger demand in a corridor. A general rule-of-thumb for economic feasibility is given as follows:
� Bus Rapid Transit 2,000 to 10,000 passengers per hour per direction � Light Rail Transit 5,000 to 10,000 passengers per hour per direction
(upper crush capacity limit of 20,000 passengers per hour per direction) � Heavy Rail 15,000 to 20,000 passengers per hour per direction
(upper crush capacity limit of 40,000 passengers per hour per direction)
Table 4.1 provides a US-developed comparison of passenger rail attributes.
Table 4.1 Comparison of Passenger Rail Attributes
Type of System Characteristic Light Rail Transit Suburban Rail Regional Rail
Typical Vehicles Articulated Trams or LRT vehicles (1 – 3 cars)
Electrified subway (4 – 10 cars)
Locomotive hauled or self propelled trains (2 – 8 coaches)
Typical Route Length (km) 8 - 24 8 - 24 32 - 80 Average Station Spacing (km) 0.4 – 1.6 0.8 – 3.2 3.2 – 8.0 Typical Primary Passenger Market
Trips within densely developed urban areas
Trips within densely developed urban areas
Trips within metropolitan areas between outer suburbs, major urban centres and the CBD
Frequency in Peak Period 2 – 5 minutes 3 – 8 minutes 30 – 60 minutes Frequency in Off-Peak Period 10 – 20 minutes 10 – 20 minutes 1 – 3 hours
Source: Feasibility Study for the South East Wisconsin Regional Planning Commission, August 1998
Four main public transport modes are further discussed below:
4.1.1 Heavy (Suburban) Rail
Internationally heavy rail primarily serves the need to transport people quickly over longer distances, operating in a completely segregated right of way, with stations spaced several kilometres apart or more. The contemporary Northern and Southern Suburbs Railways in Perth have station spacing up to five kilometres apart and are substantially patronised by people choosing to “park and ride”.
Perth’s heavy rail network is well represented in the study area, with the Fremantle, Joondalup and Midland lines converging at Perth Central Station. There are eight railway stations within the study
Perth Light Rail Study T:\78105106 - Perth Light Rail\00\doc\reports\Final Report\Perth Light Rail Study Report_13Aug07_Final.doc Revision 0 13 August 2007 Page 20

area; however the network only passes through the northern edge and does not provide good access to the southern and central sections of the study area; passengers are required to interchange with bus services.
Figure 4.1 Perth Metropolitan Heavy Rail Network
4.1.2 Buses
Buses primarily serve a local demand, transporting people over short distances and delivering passengers into railway stations and activity centres. Stops are spaced closely together, every 400 metres or so, to effectively serve local communities.
Regional express bus routes are also feasible initiatives where a prioritised corridor can be provided. Buses can be designed to operate as part of a guided system and also switch to on-road operations, which make them very versatile and flexible. Such initiatives are often referred to as Bus Rapid Transit (BRT), which provides much improved speed of operation and generally longer travel distances to local bus services. BRT is capable of providing service capacity similar to lower order light rail systems and can fulfil a commute-to-work role in the peak hour, but may not have the developmental impact of light rail.
Perth Light Rail Study T:\78105106 - Perth Light Rail\00\doc\reports\Final Report\Perth Light Rail Study Report_13Aug07_Final.doc Revision 0 13 August 2007 Page 21

Perth’s bus network is particularly effective in the CBD where free bus services operate within the City of Perth municipal boundary. Services from the north, east and south are a particularly important part of the public transport network in Perth as they serve a large number of city commuters who do not have direct access to the heavy rail network. These services either feed into the closest heavy rail line, or in many instances run straight into the City. Figure 4.2 illustrates the extent of the metropolitan bus network.
Figure 4.2 Extent of Metropolitan Bus Network
4.1.3 Monorail
Monorail is generally provided for a specific purpose, for example to link two airport terminals, or to provide a shuttle service between major rail stations on different lines. They are used as short shuttle services and can be designed to operate without drivers. In urban areas, monorail systems are normally elevated to avoid interaction with other transport systems.
Monorail systems are not suitable for environments where multiple stops and destinations are required. They are also costly due to their primarily elevated structures. Monorail systems are often accused of being unsightly and therefore not really suitable for mixed use residential areas. The main reason however why monorail is not seen as a suitable public transport mode for the study area is because it is highly unlikely to have the same positive place-making potential offered by light rail.
Perth Light Rail Study T:\78105106 - Perth Light Rail\00\doc\reports\Final Report\Perth Light Rail Study Report_13Aug07_Final.doc Revision 0 13 August 2007 Page 22

4.1.4 Light Rail
Light rail systems provide a middle tier to a three-tier public transport hierarchy including rail and bus. Light rail can be provided as on-road or off-road infrastructure and can serve “middle distance” and / or “short distance” trips, depending on the design of the system.
� Off-road light rail systems operate much like heavy rail except on a smaller network with stations spaced closer together. Metropolitan light rail systems can operate at speeds of up to 80km/h without interruption between stops. An example is the Tyne and Wear Metro in the UK.
� On-street light rail systems can be further divided into street cars and trams. – “Street Car” is a North-American term for a steel-on-steel rail system set on-street to serve a
short, often circular route, within a city centre location. These systems are ideal for distributing people from heavy rail stations throughout a central business district, and also tend to assist the mobility of tourists. Street car systems have a large number of small vehicles that operate at a high frequency and reasonably low speed, with stops approximately every 300 metres or less. An example is the Portland Streetcar in the USA.
– Tram systems also operate with steel-on-steel rail infrastructure and look very similar to the modern day streetcars, however tram networks generally serve high-medium density urban areas and can be quite extensive, delivering people across many kilometres. Trams are immediately accessible to people on the street and have a major impact on the design of any
Perth Light Rail Study T:\78105106 - Perth Light Rail\00\doc\reports\Final Report\Perth Light Rail Study Report_13Aug07_Final.doc Revision 0 13 August 2007 Page 23

environment they are located within. If a dedicated corridor can be allocated to the system, trams can operate at the posted highway speed limits. Trams can also run in mixed traffic, like the streetcar, and effectively provide a central streetcar route as part of the network, through pedestrian precincts and in transit-only environments. The main difference in the central area is that stops are spaced further apart than in a streetcar system, approximately every 500 metres, to ensure a reasonable through-service. In non-central locations, tram stops might be spaced up to 1km apart, particularly if urban growth and densification has not reached the prerequisite demand level to support a tram stop.
On-road light rail systems can also operate off-road if designed as part of a metropolitan light rail system.
This study focuses on the provision of on-street light rail, and therefore the role of the system will be divided between supplying a service between areas in need of medium capacity public transport facilities, and delivering the prospect of urban regeneration to inner urban areas.
4.2 Role of Light Rail in Perth 4.2.1 Light Rail as a Mass Transit System
Light rail in urban centres can provide a mixture of the on-street accessibility of buses and the higher speed and service reliability of heavy rail. Light rail can be put on the street like a bus, or in a separate corridor like a train. It moves slower than a train and therefore serves a more local demand, but is bigger than a bus and can therefore be used on routes between busy areas.
Light rail can provide new network links between key activity nodes and a fast and efficient service if the appropriate road space and direct route alignment can be found. This creates an ideal system for transporting a large number of people. To ensure a quick travel time between nodes, the number of stops on the system must be carefully managed. Stops are positioned at key trip generators and trip attractors where the bulk of the demand will reside. This type of system can afford to operate through “dead running” areas (where people will not want to board or alight from the system) in order to secure the quickest route between key locations.
4.2.2 Light Rail as an Urban Regeneration Catalyst
Light rail is more visual than buses due to the greater level of permanent infrastructure introduced into the urban realm, and it is because of this that it is often claimed to assist the regeneration of urban areas that require a boost to their local economy; the promise of a permanent public transport service with a high degree of visibility and permanence, which attracts businesses, employment and spending.
Perth Light Rail Study T:\78105106 - Perth Light Rail\00\doc\reports\Final Report\Perth Light Rail Study Report_13Aug07_Final.doc Revision 0 13 August 2007 Page 24

Busy locations or those with multiple demands on the road space and street environment are exciting locations for a light rail route, however positioning a new system within a well-utilised road reserve can be quite problematic and often requires the removal of existing amenity in order to accommodate the light rail system. In most circumstances this is a trade-off between vehicle lanes (carriageways and parking lanes) and light rail.
In such locations, light rail vehicles will operate quite slowly, and may be minimised to one-way operation. The system will cater well for local patronage; however the slower pace of the overall route may discourage the patronage of through-passengers who have no desire to access an intermediate area and typically only wish to get from A to B.
Perth Light Rail Study T:\78105106 - Perth Light Rail\00\doc\reports\Final Report\Perth Light Rail Study Report_13Aug07_Final.doc Revision 0 13 August 2007 Page 25

5.0 Light Rail Transit Technology Options This chapter summarises the key issues relating to the selection of the most appropriate light rail technology for Perth, which includes the vehicles, power supply, track and other supporting systems. The scope covers mostly steel-wheel-on-steel-rail technologies which are compatible light rail vehicles operating along urban streets with crossing pedestrians or other vehicular traffic. A short discussion on rubber-tyred technologies with a single guidance rail is also included.
European and Australian terminology ‘tram’ and ‘tramway’ is used in this discussion. A tram is equivalent to the US term ‘streetcar’ or ‘trolley’ and both are forms of light rail. In particular, ‘street tram’ refers to the type of vehicle which is most suitable for city centre streets. A glossary of light rail terms has been included in Section 15.
This chapter investigates how the following technological issues are addressed elsewhere in the world and suggests suitable options for Perth:
� Light Rail Vehicles � Types of Operation � Access for All � Power Supply � Track � Supporting Technology � Depot Requirements � Alternative Systems
The recommendations of the Steering Committee regarding technology options are included in Chapter 6.
5.1 Light Rail Vehicles Light rail vehicles (LRV) vary in size with a wide range of configurations from single car rigid vehicles to the longer articulated vehicles that can be coupled into trains. The following paragraphs briefly describe the characteristics of the basic vehicle options:
� Rigid Vehicles � High Floor Vehicles � Low Floor Vehicles � Low Floor Vehicle Interior Design
5.1.1 Rigid Vehicles
Many historic tramways use a rigid vehicle, comprising a single body section usually running on two four-wheeled bogies. An example of a typical rigid high-floor tram (Z3 class) in Melbourne is shown in Figure 5.1. The carrying capacity of this type is limited to around 100 (seated plus standing), and the length of the rigid body may cause clearance problems on sharp curves. North American cities, such as New Orleans, have ordered replicas of historic rigid vehicle designs, and more modern rigid designs are in use in Philadelphia and Hong Kong, as shown in Figure 5.2. However, the market is far smaller than that for articulated vehicles, and there are no standardised product lines now available. Accordingly the rigid vehicle is not recommended for general use in Perth, though historic or replica vehicles might be used on certain tourist services as seen in Portland, Oregon.
Perth Light Rail Study T:\78105106 - Perth Light Rail\00\doc\reports\Final Report\Perth Light Rail Study Report_13Aug07_Final.doc Revision 0 13 August 2007 Page 26

Figure 5.1 Rigid Tram in Melbourne, Australia Figure 5.2 Rigid Streetcar in Philadelphia, USA
5.1.2 High-Floor Vehicles
Historically, most light rail vehicles had a floor height of 800mm or more above rail level, with several steps at each entrance for access from kerb-height platforms. Prior to 1990, many new and upgraded light rail networks adopted high platforms as the only way to achieve level boarding with Calgary and Manchester as examples of these new start-up systems. A LRT station platform in Calgary, Canada is shown in Figure 5.3 where passengers must enter the station via an underpass beneath the tracks or from one end of the platform, similar to heavy rail stations. Many cities, particularly in Germany, converted some or all of their tramway routes to ‘Stadtbahn’ with higher speeds, greater segregation from road traffic and often also high platforms. Stuttgart, Frankfurt and Düsseldorf are examples of high-floor Stadtbahn networks.
The main disadvantage of high floor operation is the difficulty of accommodating the high platforms necessary for level access, and the associated steps and ramps, particularly in a city centre street. Unless the street is very wide the high platform presents an obstruction for pedestrians, whereas a low platform is often seen as part of the general footway. Manchester adopted a ‘profiled platform’, as shown in Figure 5.4, with short raised platforms giving access to a pair of doors leading to an area for wheelchairs and pushchairs, and other doors accessed by steps on the vehicle. However, these have not been adopted elsewhere, and when one stop with profiled platforms was relocated, a conventional high platform was installed instead.
Portland, Oregon has both high floor light rail vehicles that operate to the outer suburbs and low-floor streetcars that operate a loop route within Portland CBD.
Figure 5.3 Light Rail Transit Station in Calgary, Canada Figure 5.4 Profiled Platforms in Manchester, UK
Perth Light Rail Study T:\78105106 - Perth Light Rail\00\doc\reports\Final Report\Perth Light Rail Study Report_13Aug07_Final.doc Revision 0 13 August 2007 Page 27

5.1.3 Low-Floor, Articulated Vehicles
In the early 1990’s, low-floor vehicles were introduced based on mechanical designs with independent wheels and other novel features. Many of the early designs have been problematic, but the more recent standardised (modular) products have been sold in large numbers and have been largely problem-free5. One supplier now offers a 100 percent low-floor design using small wheels linked by a conventional axle, rather than independent wheels. Low platforms are much easier to accommodate in the street environment, and low floors at the entrances are almost universal for new light rail vehicle orders except on those networks which must retain compatibility with high platforms. There is some variation in the actual floor height between networks (the Siemens ULF design in Vienna offering the lowest at 190mm), but a value of 350mm is a good compromise between acceptability on street and compatibility with a wide choice of vehicle designs including tram-trains.
Portland provides an example of the development of level boarding. The first route opened in the mid-1980’s before low floor designs became widely available. Platforms were low, but the vehicles had high floors. Wheelchair users boarded the vehicles using lifts, but these were often unreliable, extending stopping times, and were of no use to the other groups who benefit from level boarding. When more vehicles were needed to handle increased demand and route extensions, low-floor designs meeting US standards had become available and Portland was one of the first buyers. Now the lifts have been abandoned and the high-floor vehicles are confined to busy routes where they only operate coupled to a low-floor vehicle.
The overwhelming majority of light rail vehicles supplied in recent decades have been articulated (consisting of several rigid sections, connected by pivoting joints but not separable in normal operation). A modern articulated light rail vehicle in Melbourne is shown in Figure 5.5. The Nottingham street tram in Figure 5.6 shows how short articulated sections are compatible with severe horizontal and vertical curvature.
Figure 5.5 Modern Articulated LRV in Melbourne, Australia Figure 5.6 Low-Floor Articulated LRV in Nottingham, UK
All suppliers now offer standardised product lines of articulated tram, which can be adapted to the needs of a particular city, and may also allow some customisation of visual appearance while retaining the same mechanical design. It is suggested that the trams for Perth should be based on one of these designs. There may be potential to arrange a vehicle purchase consortium with other State governments in Australia, specifically Victoria (Melbourne), South Australia (Adelaide), and Queensland (Goldcoast). In recent years various cities have specified their requirements in such a way that only a highly-customised (“bespoke”) design can meet them. However, bespoke designs increase cost and could compromise reliability, particularly for a relatively small light rail network 5 Siemens Combino has suffered from severe problems relating to metal fatigue, but this has little to do with the provision of a low floor.
Perth Light Rail Study T:\78105106 - Perth Light Rail\00\doc\reports\Final Report\Perth Light Rail Study Report_13Aug07_Final.doc Revision 0 13 August 2007 Page 28
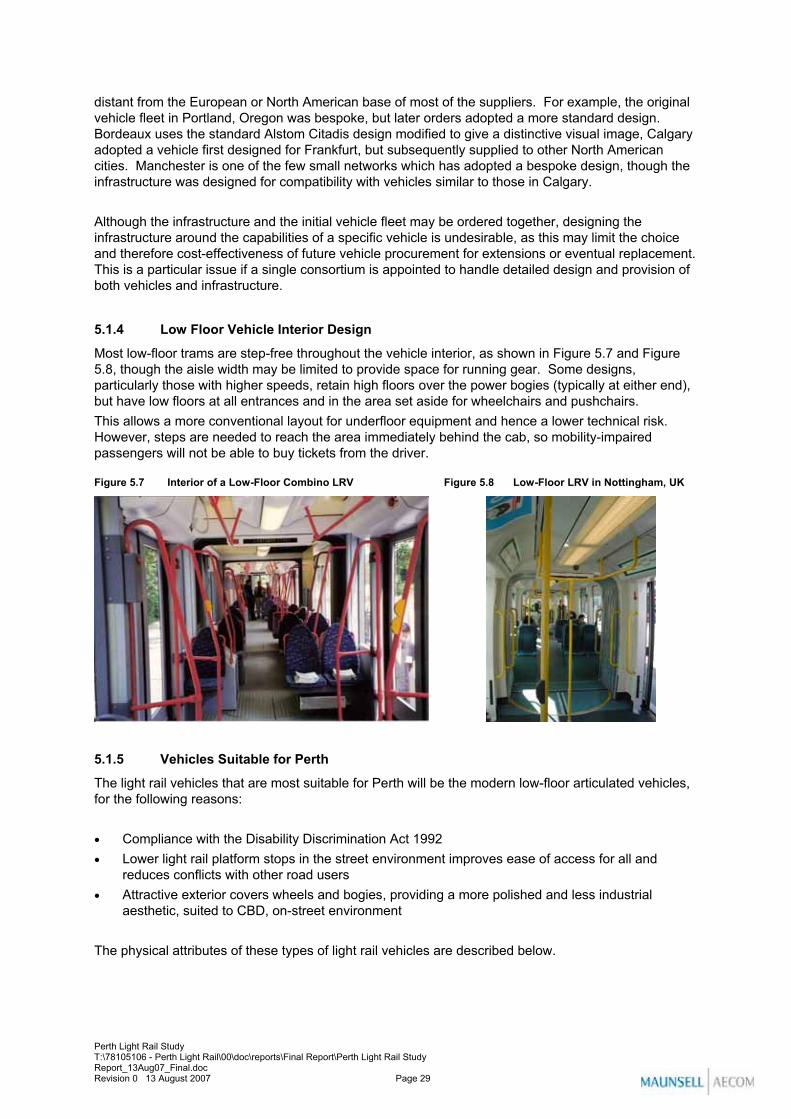
distant from the European or North American base of most of the suppliers. For example, the original vehicle fleet in Portland, Oregon was bespoke, but later orders adopted a more standard design. Bordeaux uses the standard Alstom Citadis design modified to give a distinctive visual image, Calgary adopted a vehicle first designed for Frankfurt, but subsequently supplied to other North American cities. Manchester is one of the few small networks which has adopted a bespoke design, though the infrastructure was designed for compatibility with vehicles similar to those in Calgary.
Although the infrastructure and the initial vehicle fleet may be ordered together, designing the infrastructure around the capabilities of a specific vehicle is undesirable, as this may limit the choice and therefore cost-effectiveness of future vehicle procurement for extensions or eventual replacement. This is a particular issue if a single consortium is appointed to handle detailed design and provision of both vehicles and infrastructure.
5.1.4 Low Floor Vehicle Interior Design
Most low-floor trams are step-free throughout the vehicle interior, as shown in Figure 5.7 and Figure 5.8, though the aisle width may be limited to provide space for running gear. Some designs, particularly those with higher speeds, retain high floors over the power bogies (typically at either end), but have low floors at all entrances and in the area set aside for wheelchairs and pushchairs. This allows a more conventional layout for underfloor equipment and hence a lower technical risk. However, steps are needed to reach the area immediately behind the cab, so mobility-impaired passengers will not be able to buy tickets from the driver.
Figure 5.7 Interior of a Low-Floor Combino LRV Figure 5.8 Low-Floor LRV in Nottingham, UK
5.1.5 Vehicles Suitable for Perth
The light rail vehicles that are most suitable for Perth will be the modern low-floor articulated vehicles, for the following reasons:
� Compliance with the Disability Discrimination Act 1992 � Lower light rail platform stops in the street environment improves ease of access for all and
reduces conflicts with other road users � Attractive exterior covers wheels and bogies, providing a more polished and less industrial
aesthetic, suited to CBD, on-street environment
The physical attributes of these types of light rail vehicles are described below.
Perth Light Rail Study T:\78105106 - Perth Light Rail\00\doc\reports\Final Report\Perth Light Rail Study Report_13Aug07_Final.doc Revision 0 13 August 2007 Page 29

Vehicle Dimensions Trams have been supplied in lengths of 50m or more and capacities (seated plus standing) of 400 or more people, but are also available in lengths of less than 30m. Typical is the smaller of the two vehicle types used in Bordeaux; it is 33m long and 2.4m wide, with 48 seats and 170 standing passengers at four per square metre of floor space. Alternatively a larger vehicle could be used to give a higher ratio of seated passengers, or more comfortable seats for longer journeys, or more space for luggage. Vehicles of 2.65m width should be used if space permits, as this is the widest vehicle generally available; widths of 2.4m or less are available, but have less carrying capacity and are not significantly cheaper.
Vehicle Capability Typical street trams can operate round curves of 20m radius or less, though most authorities recommend that curve radii should be kept as large as possible, and a normal minimum radius of 25m is recommended. The current designs of low-floor street trams tend to be built up from a number of standard modules, so can be supplied in a wide range of lengths and other configurations. These modules are shorter than traditional articulated body sections, so there is less of an overhang as the vehicle goes round curves. These designs have top speeds of between 70 km/h and 80 km/h, and air conditioning is either a standard fitment or available as an option. Examples of this general type are the Alstom Citadis, Siemens Combino and Bombardier Flexity Classic or Flexity Outlook.
Street trams generally have motors on two thirds of their axles; these can climb gradients of 5 percent without difficulty, and many will be compatible with a 6.5 percent gradient. Vehicles with motors on all axles which can climb gradients of up to 10 percent may have slightly better acceleration on level track, but cost more and may have more restrictive internal layouts. The worst case is when a ‘dead’ vehicle has to be rescued by another vehicle; this is easier if the steep sections have good access so that most or all passengers can leave the vehicle before rescue takes place. The specification for the vehicles should include the maximum envisaged gradient (possibly also taking into account any planned extensions) and the vehicle rescue scenarios.
Other tram designs, such as the Siemens Avanto and Bombardier Flexity Swift, are suitable for both inner city services as shown in Figure 5.9 and outer suburban services over longer distances with speeds up to 105 km/h as shown in Figure 5.10. These designs tend to be supplied for the North American market, and also upgraded tramways such as the German Stadtbahns. Calgary, Portland and Manchester use vehicles generally of this type. However, they are less suitable for narrow streets in city centres, as they are generally available only in 2.65m width and incompatible with curves of less than 25m radius and with very steep gradients. They also tend to be available only for 1435mm gauge. Other than the incompatibility of some of the highest-speed vehicles with the steepest gradients, there is no trade-off between performance and hill-climbing.
Figure 5.9 Bombardier Flexity Swift LRV in Central Croydon, UK Figure 5.10 High Speed LRV Operating in Croydon, UK
Bombardier Flexity Swift in George Street, Croydon (London). This vehicle type is also suitable for longer distance, higher speed light rail lines with wide station spacings, as shown in the photo on the right.
Perth Light Rail Study T:\78105106 - Perth Light Rail\00\doc\reports\Final Report\Perth Light Rail Study Report_13Aug07_Final.doc Revision 0 13 August 2007 Page 30

All trams can be coupled together for vehicle rescue purposes. Some are capable of being operated in service while coupled together, and even of coupling and uncoupling while in service. However, automatic couplers project from the front of the vehicle and may be a hazard to pedestrians or other road vehicles; retractable designs are available but these may be a source of unreliability.
Climate Control Features for Perth Air conditioning is available on all current tram designs, though careful specification will be required to ensure that the system capacity is appropriate for the conditions in Perth. Other design features, such as doors which close automatically after a few seconds, and reflective window films, can reduce the thermal gain of the vehicle and hence the workload of the air conditioning system.
5.2 Types of Operation Two types of light rail operations exist with single-ended vehicles that require a turnaround loop at the end of each line or double-ended vehicles where the driver changes ends to reverse directions.
5.2.1 Single-ended Operation
Most street tramways in central Europe use ‘single ended’ vehicles, with a cab at one end and doors only on the right hand side in the direction of travel (although the vehicles are capable of moving in both directions, for example in emergencies and for depot shunting). Very large single-ended operations are found in European cities such as Frankfurt, Amsterdam, Prague and Berlin, as well as the older North American tramways including Philadelphia and Toronto. Accordingly, all the street tram designs are available in single-ended variants, and the modular nature of the designs means that there should be no difficulty in supplying one for left-hand running. Examples of single-ended tram operations are shown in Figure 5.11 with front (left) and rear (right) of unidirectional trams in Karlsruhe and a streetcar in Toronto in Figure 5.12. While headlights and wipers are provided at both ends, the rear end does not have an enclosed cab and the coupler is not shielded.
Figure 5.11 Single-ended Operation in Karlruhe, Germany Figure 5.12 Single-ended Operation in Toronto, Canada
Single-ended vehicles should be slightly cheaper, and a vehicle of a given length will carry more passengers. However the use of single-ended vehicles imposes several constraints on the infrastructure:
� All stops must have platforms on the same side (presumably the left in the case of Perth) so ‘island’ platforms are not possible.
� At the end of every route and at any place where services regularly reverse, a turning-round loop (or occasionally a reversing triangle) is required so that the vehicles can return in the opposite direction. It is often difficult to provide this in a built-up area (though a loop could be laid round-
Perth Light Rail Study T:\78105106 - Perth Light Rail\00\doc\reports\Final Report\Perth Light Rail Study Report_13Aug07_Final.doc Revision 0 13 August 2007 Page 31

the-block through a parallel street), and the tight curves can lead to excessive wheel-rail wear and noise.
� The depot design is more complicated, since vehicles must be able to arrive and depart cab first.
5.2.2 Tram-train Operation
A tram-train is a vehicle that can run both on a conventional railway and on a street tramway. The best-known application is Karlsruhe in Germany, but similar concepts are now in operation or planned in several European countries.
Tram-train is most likely to be relevant in a city where the existing rail network:
� Mainly serves a catchment with potential to generate significant passenger flows � Is not achieving this potential because it does not serve key destinations � Cannot be converted to light rail (for example because longer-distance passenger or freight trains
use it and cannot be segregated onto other tracks)
In Karlsruhe, all three factors applied, because there was an extensive network of railways serving nearby communities and also carrying other train services, but the city’s station is about 1km from the centre.
A decision will need to be made at an early stage on whether there is potential for tram-train operation in Perth, either on the initial route or on later extensions. This will allow the correct choice to be made in several design decisions for the initial route, which effectively fix system-wide parameters and therefore have a strong effect on the feasibility of later tram-train extensions.
� Track gauge: The vast majority of tramways are laid to 1435mm gauge, with 1000mm also fairly widespread, so vehicles and other components are most readily available for these gauges. Most of the railways in the Perth area are to 1067mm gauge, and as well as allowing for tram-train a 1067mm gauge tramway would permit operation of heritage vehicles from the historic Perth tramway. 1067mm gauge tramways exist in Hong Kong, Tallinn (Estonia), several routes in Japan including a tram-train network under construction, and also the San Francisco cable car and various other heritage tramways. However, modular vehicle designs are most readily available in 1000mm or 1435mm and specification of a different gauge is likely to increase costs somewhat.
� Rail profile: Laying a rail of a profile compatible with tram-train operation will minimise the need to modify railway or tramway infrastructure if the two are later connected. However, a non-standard profile could increase first cost and have a slightly larger groove in the street than would otherwise be needed.
� Platform/floor height: As discussed below, the vehicle floor should be the same height as the platforms, and therefore all platforms must be at the same height. Therefore, for tram-train either the non-railway sections must use the railway platform height, or the railway platforms must be rebuilt to a different height. Adopting a platform height less than about 350mm will constrain the choice of tram-train designs.
� Track Geometry: Tram-trains are likely to be less compatible with features such as tight horizontal and vertical curves or steep gradients.
� Vehicle Width: The tram-train cannot be wider than the width available on the railway, unless railway clearances are increased. Ideally the tram-train should be close to the permitted width of the rail vehicles, as this minimises the platform stepping distance on railway sections.
Perth Light Rail Study T:\78105106 - Perth Light Rail\00\doc\reports\Final Report\Perth Light Rail Study Report_13Aug07_Final.doc Revision 0 13 August 2007 Page 32

� Novel Features: A novel power supply or other features on the tramway may make it more difficult and costly to operate tram-trains.
Other issues, such as the signalling, are addressed in the design of the tram-train vehicle and need not constrain the initial tramway design.
5.2.3 Type of Operation Suitable for Perth
Most of newer networks, and those which have undergone major upgrades, have adopted double-ended operation. Examples include Portland, Manchester and Bordeaux along with most others in France, Spain, the UK and North America, and most of the German Stadtbahns. On these networks the vehicles have cabs at each end and doors on each side.
The small additional vehicle cost is clearly outweighed by the greater flexibility in providing infrastructure, particularly when a new tramway is built in an existing built-up area. Accordingly double-ended operation is likely to be the right choice for Perth, where a minimal amount of land is required for reversing directions at the end of the line.
Examples of double-ended operations are shown for a Melbourne Combino tram (D1 class) in Figure 5.13 and a Sydney Siemens Variotram in Figure 5.14.
Figure 5.13 Double-ended Tram in Melbourne, Australia Figure 5.14 Double-ended LRV in Sydney, Australia
5.3 Access for All Existing tramways have often had to compromise on accessibility for historic reasons. For example, networks using single-ended operation often have the terminus tram stop on the sharply-curved reversing loop, so it is not possible to provide a platform level with and close to the entrance steps. Bremen for instance partly overcomes this problem with vehicle-mounted wheelchair lifts.
Step-free access from the street via the platform to the vehicle is seen as essential for any new transport system. As well as providing unassisted access for those in wheelchairs, level boarding makes the tram very attractive for the infirm and those with heavy luggage and small children. It is also likely to improve safety and reduce the dwell times at stops.
However, the new tramways have solved the problem by locating stops on straight (or very gently curved) sections of track, and providing a platform which is the same height as the vehicle steps at all entrance doors, along with gentle ramps to reach the platform from street level. Both high and low floor networks are able to achieve stepping distances of less than 25mm both horizontally and
Perth Light Rail Study T:\78105106 - Perth Light Rail\00\doc\reports\Final Report\Perth Light Rail Study Report_13Aug07_Final.doc Revision 0 13 August 2007 Page 33

vertically, these dimensions being compatible with wheelchairs and pushchairs. The results of a survey conducted in the Libertin project are summarised in Figure 5.15.
Figure 5.15 Desirable Platform Heights and Gaps for Light Rail Operations
Source: Libertin Light Rail Thematic Network report, February 2005. http://www.libertin.infoTo achieve these stepping distances it is necessary to maintain the position of the track accurately (only a problem for ballasted track), to impose a speed limit on any non-stopping trams, and to adjust the vehicle suspension to keep a constant body height as the wheel diameter reduces with wear.
Examples of step-free platforms onto light rail vehicles are provided here. Step-free access can be provided with high-floor light rail vehicles if a platform is provided, as shown in Figure 5.16 at a LRT station along the transit mall in downtown Calgary. In Figure 5.17, the small horizontal and vertical stepping distance between the platform and tram is shown at Mitcham Junction on the Croydon tram network.
Figure 5.16 High-Floor LRV at Calgary CBD Station Figure 5.17 High Platform into a Tram in Croydon, UK
In San Francisco, California, some of the stops on the LRT system have high platforms and others do not. The light rail vehicles, manufactured by Breda, have variable-height entranceways, as shown in Figure 5.18. Upon entering a car at a street-level stop, the passenger must walk up a few stairs; when
Perth Light Rail Study T:\78105106 - Perth Light Rail\00\doc\reports\Final Report\Perth Light Rail Study Report_13Aug07_Final.doc Revision 0 13 August 2007 Page 34

the train enters a tunnel or approaches a high-level stop, the stairs rise up to the level of the car floor. This type of vehicle and operation is not recommended for Perth.
5.3.1 Access Suitable for Perth
Access from a low platform at a “Superstop” onto a Citadis tram in Melbourne is shown in Figure 5.19. The passengers are guided to the platform with handrails and a tactile edge to the kerb. The main elements of this stop design would be appropriate for the Perth light rail system.
Figure 5.18 Breda LRV in San Francisco, USA Figure 5.19 Low-Floor Tram Platform in Melbourne, Australia
Source: http://en.wikipedia.org/wiki/Muni_Metro Source: VicRoads Melbourne www.vicroads.vic.gov.au
Other features to support accessibility include information systems, illuminated tactile buttons and opening/closing tones for doors, abundant and visible handrails, and priority seats for the infirm.
5.4 Light Rail Power Supply Light rail transit vehicles can be powered by various types of power including overhead electric, third-rail electric, diesel and alternative fuels.
5.4.1 Electrified Power Supply
Almost all tramways employ conventional electric traction fed by overhead wires as shown in Figure 5.20. The most common voltage for new tramways is 750V, though some existing networks use a lower voltage. The higher voltages commonly used on railways are not used in the street for safety reasons. The newer LRT systems use single lightweight span wires with the pantograph on the roof of the vehicle to minimise visual intrusion as shown in Figure 5.21.
Figure 5.20 Overhead Power Supply in Melbourne Figure 5.21 Overhead Power Supply in Manchester
Perth Light Rail Study T:\78105106 - Perth Light Rail\00\doc\reports\Final Report\Perth Light Rail Study Report_13Aug07_Final.doc Revision 0 13 August 2007 Page 35

The main victim of high winds is the overhead power line. Trams operate successfully in storm-prone areas, such as Hong Kong, though the overhead line equipment is heavier and more visually obtrusive than in other cities. The overhead line equipment provided in central Manchester is based on a design for Hong Kong, and therefore illustrates the weight of equipment needed for typhoon resistance as shown in Figure 5.22. The pantograph, as shown in Figure 5.23, also improves the reliability of operations during windy weather.
Figure 5.22 Wind-Proof Overhead Wiring in Manchester, UK Figure 5.23 Pantograph Connecting to LRT Overhead Wire
Overhead line in Manchester, based on the Hong Kong 'typhoon-proof' design
The introduction of the pantograph improved the reliability of light rail operations in windy weather.
5.4.2 Options Instead of Overhead Electrification
The visual intrusion of overhead wires has been a concern in several recent light rail projects. While it can be mitigated by careful design and integration with other street furniture, there are some emerging technologies which might allow wire-free operation in sensitive areas. The following have some potential to be viable in a timescale of five to ten years.
� Diesel: This is a low-risk option, as hybrid diesel-electric tram-trains operate in several cities (though running on electric power on street sections). The noise, vibration and emissions would be similar to a diesel bus, and much lower than a diesel train. However, this is still likely to be unacceptable in those sensitive areas where there are objections to overhead wires.
� Energy storage: Flywheel, battery and super-capacitor technologies allow energy to be stored so zero-emission operation is possible without overhead lines for short sections. The trams recently supplied to Nice have batteries for wire-free operation over short distances, while the Bordeaux vehicles have them as a backup for the ground-level contact system discussed below. Other energy storage technologies are not in commercial use on a rail vehicle; the ULEV-TAP 2 project in Europe is seeking to develop the technology for a diesel-flywheel hybrid. The feasibility of an energy storage option depends on the capacity of the energy store but also on how quickly it can be replenished. Any use in Perth would require detailed study of the size and position of sensitive parts of the route, and comparison with the capabilities of near-market systems.
� Live rail: Light rail vehicles take power from a live rail in Amsterdam and elsewhere. However for safety reasons this is not possible on sections where the track is accessible to pedestrians or motor vehicles. Therefore, while it might allow wires to be omitted on suburban sections, it is not appropriate for city centres. Even on fully segregated track there may be a problem where low platforms are used, as passengers are readily able to step down onto the track.
� Ground-level street pickup: The new tramway in Bordeaux makes use of a novel system (Alstom’s APS) in visually sensitive areas comprising about 10km of the initial 24.5km network, as
Perth Light Rail Study T:\78105106 - Perth Light Rail\00\doc\reports\Final Report\Perth Light Rail Study Report_13Aug07_Final.doc Revision 0 13 August 2007 Page 36
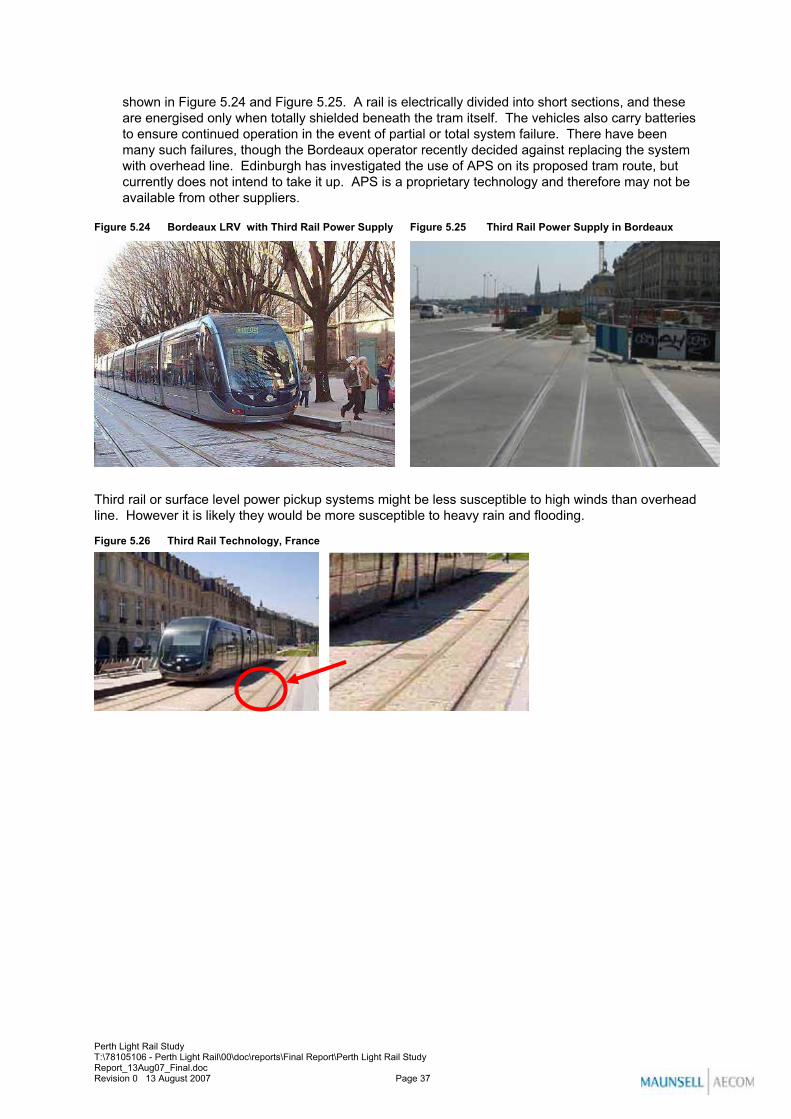
shown in Figure 5.24 and Figure 5.25. A rail is electrically divided into short sections, and these are energised only when totally shielded beneath the tram itself. The vehicles also carry batteries to ensure continued operation in the event of partial or total system failure. There have been many such failures, though the Bordeaux operator recently decided against replacing the system with overhead line. Edinburgh has investigated the use of APS on its proposed tram route, but currently does not intend to take it up. APS is a proprietary technology and therefore may not be available from other suppliers.
Figure 5.24 Bordeaux LRV with Third Rail Power Supply Figure 5.25 Third Rail Power Supply in Bordeaux
Third rail or surface level power pickup systems might be less susceptible to high winds than overhead line. However it is likely they would be more susceptible to heavy rain and flooding.
Figure 5.26 Third Rail Technology, France
Perth Light Rail Study T:\78105106 - Perth Light Rail\00\doc\reports\Final Report\Perth Light Rail Study Report_13Aug07_Final.doc Revision 0 13 August 2007 Page 37
5.4.3 Alternative Power Sources
Other technologies not considered viable within a ten-year timescale are mentioned here.
� Gas: Compressed Natural Gas (CNG) or Liquefied Petroleum Gas (LPG) are the most common technologies for reducing bus emissions below those attainable with clean diesel engines. However, the gas system uses a modified internal combustion engine so is likely to be rejected on the same grounds as the diesel option. We are not aware of any research or development taking place into gas-powered light rail vehicles.
� Fuel cell: Ultimately fuel cells promise operation with no emissions except water, and their potential for use in road vehicles should eventually generate a large market and low prices. Again however, no significant development has yet taken place on fuel-cell-powered light rail vehicles. There are some small-scale service trials on buses, but the technology is far from being commercially viable. Fuel cell may be considered medium technical risk, but not deliverable in the likely timescale for an initial route.
5.4.4 Power Supply Suitable for Perth
The Perth light rail network should adopt an overhead electrification system during the planning stages of the project. It is anticipated however that there could be considerable support for the Ground-Level Street Pickup system, which is under on-going development and improvement. It is possible that if the Perth light system is implemented in 5-10 years time the technology available to support a Ground-Level Street Pickup propulsion system may be sufficiently advanced to merit credible consideration.
5.5 Light Rail Track Light rail track geometry and type of track are described below.
5.5.1 Track Geometry
Curve radii of less than 25m are not generally recommended, although for street tram operation radii down to 20m or slightly less can be considered where there is no practicable alternative. It is recommended to change the radius gradually between a straight and a sharp curve (a transition curve), particularly with the modular designs using short body shells, as these vehicles can have poor lateral ride when passing over abrupt changes in curvature.
Complex geometry (such as reverse curves or simultaneous horizontal and vertical curvature) should be avoided if possible, and if unavoidable some consultation with a range of vehicle suppliers should take place to ensure compatibility.
5.5.2 Types of Track
Different types and treatments are available for the construction of light rail track. They are:
� Sleeper with ballasted track � Street and block paved track � Vegetated track
Perth Light Rail Study T:\78105106 - Perth Light Rail\00\doc\reports\Final Report\Perth Light Rail Study Report_13Aug07_Final.doc Revision 0 13 August 2007 Page 38

Sleeper/ballasted Track Consisting of flat-bottom rail on transverse sleepers in a stone bed, this closely resembles railway track, though a lighter rail section may be used to reduce costs. It is likely to be the cheapest form of track, but it is not suitable for areas where pedestrians or motor vehicles have general access (crossing places can be created using concrete or rubber panels). Ballasted track on a tight-radius is shown in Figure 5.27 with an LRV on a curve in Croydon, UK. Another example is shown in Figure 5.28 with a Variotram stopped at a station at Darling Harbour in Sydney.
Figure 5.27 Sleeper Ballasted Track in Croydon, UK Figure 5.28 Sleeper Ballasted Track in Sydney, Australia
Note a tram signal in the background left and in front of it a track-mounted wire loop to interrogate the on-vehicle transponder.
Sleeper ballasted track in inner city Sydney.
Ballasted track can also move over time, so monitoring and corrective action is required to keep the alignment within limits, especially alongside platforms or other areas with tight clearances. Sometimes certain sleepers are made longer and butted against the edge of the platform, to prevent the track moving far enough for the vehicle to scrape the platform edge.
Close attention is also required to tight curves on ballasted track, where thermal expansion can move the track and risk loss of contact with the overhead line. While Croydon has had no problems on its own tight curves, those in Sheffield are fitted with expansion joints and in Nottingham they are set in concrete. Occasionally off-street slab track is also seen, where a conventional flat-bottom rail rests on a continuous concrete base.
A more recent trend is to bring the surface up to rail level at tram stops, either by using a short section of street track or by embedding sleeper track in concrete. This improves safety by making it less likely that someone falling onto the track will be carried underneath a vehicle.
Street and Block Paved Track This track type is required in all areas where road vehicles have access. Different networks have used variations on essentially the same concept. The rail used is flat-bottomed but the head is enlarged and contains a groove for the wheel flanges. It is mounted to concrete sleepers or laid in slots in a continuous concrete slab, the gaps around the rail then being backfilled with more concrete or another material.
Traditional track systems use direct rail mounting but more recent street track has the rail encapsulated in an elastic polymer, with no rigid fixing. This reduces transmitted vibration and stray electric currents, but a floating rail may rotate outwards on sharp curves, giving a sub-optimal wheel-rail interface and risking unnecessary noise and wear. Gauge bars linking the rails may reduce this problem. There have also been some reliability problems with separation of the rail from its polymer,
Perth Light Rail Study T:\78105106 - Perth Light Rail\00\doc\reports\Final Report\Perth Light Rail Study Report_13Aug07_Final.doc Revision 0 13 August 2007 Page 39

so pre-encapsulated rail is now preferred over pouring of the polymer on site. On sections where vibration is particularly sensitive (such as alongside theatres), the track slab may itself be floated in elastic polymer.
To allow free access by pedestrians and other road vehicles, the top of the rails must be flush with the surface. This may be achieved by bringing the concrete slab up to road level, but it is more likely that the surface will be made up from asphalt or block paving to suit the surrounding area. Block paving is often used to deter general use by other vehicles but still permit essential access and turning moves.
An example of track work in concrete slabs in Croydon, UK is shown in Figure 5.29. Track in a calmed traffic street in Karlsruhe, Germany is shown in Figure 5.30 that allows other vehicles to share the right-of-way.
Figure 5.29 Concrete Track Slab in Croydon, UK Figure 5.30 Calmed Street Track in Karlsruhe, Germany
Block paved street track on a tram-only section in Croydon, with remedial works under way between passing trams.
Block-paved bidirectional track, used as part of a traffic-calming scheme near Karlsruhe.
The interface between the road surface and the tramway rail is critical, as it must maintain integrity and level while minimising the transmission of stray currents and vibrations. If the surface drops below rail level, the rail can become a tripping and skidding hazard. Drainage of street track is also critical, as the rail groove tends to collect the water from the surrounding surface. Cross-drains are provided at intervals, collecting the water from between the rails via metal grids and from the grooves via holes drilled into collectors. As a further precaution against stray current, the reinforcement of the concrete slab is usually made electrically continuous and connected to provide an alternative path for the traction return current.
A variation of street track uses a much shallower rail and hence requires less deep excavation. This has been used in Prague for some time, and from time to time has been proposed for use elsewhere to reduce the extent of the track slab and therefore the amount of utility work. However there are concerns about its longevity in service, and it is difficult to lay this type of rail on curves.
Vegetated Track Vegetated track is essentially similar to street track, but surfaced with turf or a low-growing plant. The main reason for a vegetated track is to minimise visual intrusion, though it may also reduce noise somewhat. Stray current minimisation is a particular issue for vegetated track; for this reason the only applications in the UK use a conventional flat-bottom rail mounted on a concrete strip proud of the vegetated surface. Other countries however make very effective use of track where the vegetation is nearly flush with a grooved rail. Examples of trams operating on vegetated track with the surrounding landscaping in Freiburg, Germany and Barcelona, Spain are shown in Figure 5.31 and Figure 5.32 respectively.
Perth Light Rail Study T:\78105106 - Perth Light Rail\00\doc\reports\Final Report\Perth Light Rail Study Report_13Aug07_Final.doc Revision 0 13 August 2007 Page 40
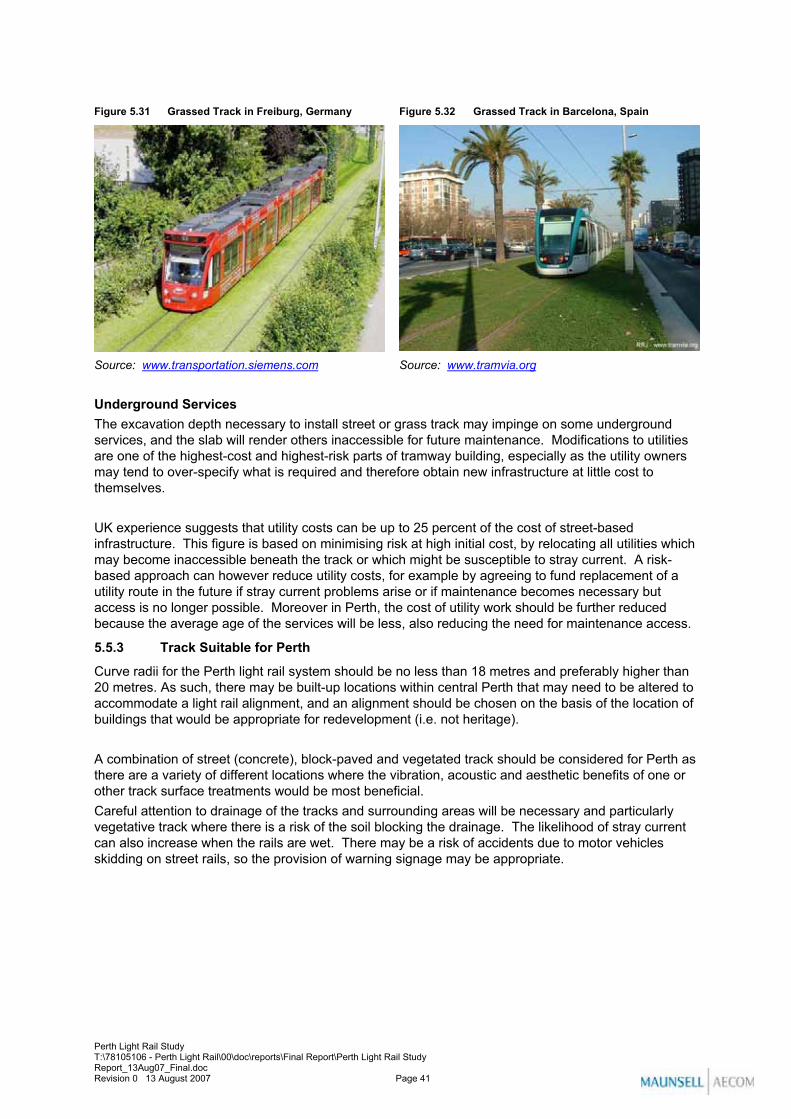
Figure 5.31 Grassed Track in Freiburg, Germany Figure 5.32 Grassed Track in Barcelona, Spain
Source: www.transportation.siemens.com Source: www.tramvia.org
Underground Services The excavation depth necessary to install street or grass track may impinge on some underground services, and the slab will render others inaccessible for future maintenance. Modifications to utilities are one of the highest-cost and highest-risk parts of tramway building, especially as the utility owners may tend to over-specify what is required and therefore obtain new infrastructure at little cost to themselves.
UK experience suggests that utility costs can be up to 25 percent of the cost of street-based infrastructure. This figure is based on minimising risk at high initial cost, by relocating all utilities which may become inaccessible beneath the track or which might be susceptible to stray current. A risk-based approach can however reduce utility costs, for example by agreeing to fund replacement of a utility route in the future if stray current problems arise or if maintenance becomes necessary but access is no longer possible. Moreover in Perth, the cost of utility work should be further reduced because the average age of the services will be less, also reducing the need for maintenance access.
5.5.3 Track Suitable for Perth
Curve radii for the Perth light rail system should be no less than 18 metres and preferably higher than 20 metres. As such, there may be built-up locations within central Perth that may need to be altered to accommodate a light rail alignment, and an alignment should be chosen on the basis of the location of buildings that would be appropriate for redevelopment (i.e. not heritage).
A combination of street (concrete), block-paved and vegetated track should be considered for Perth as there are a variety of different locations where the vibration, acoustic and aesthetic benefits of one or other track surface treatments would be most beneficial. Careful attention to drainage of the tracks and surrounding areas will be necessary and particularly vegetative track where there is a risk of the soil blocking the drainage. The likelihood of stray current can also increase when the rails are wet. There may be a risk of accidents due to motor vehicles skidding on street rails, so the provision of warning signage may be appropriate.
Perth Light Rail Study T:\78105106 - Perth Light Rail\00\doc\reports\Final Report\Perth Light Rail Study Report_13Aug07_Final.doc Revision 0 13 August 2007 Page 41

5.6 Supporting Light Rail Technology Light rail systems require various supporting technology in the forms of signalling and control systems, information and real time information systems, and integrated ticketing equipment. General information has been provided in 5.6.1/2/3 that could be applied to the Perth system.
5.6.1 Signalling and Control Systems
Unlike railways, tramways are driven on line of sight like a road vehicle. The driver is responsible for proceeding at a safe speed and for stopping short of any obstruction, including another tram ahead as well as a road vehicle or pedestrian on the track.
Some signalling is still required to establish priority at junctions and on any bidirectional tracks. This is closely integrated with the traffic signals on shared and intersecting highways. To avoid confusion with road and railway signals, tramway signals consist of white bars, horizontal for stop, vertical for proceed if safe to do so, and inclined for a divergence to left or right. An example of the light rail signalling at a junction in Karlsruhe, Germany is shown in Figure 5.33. A light rail control room where the light rail operations are monitored from is shown in Figure 5.34.
Figure 5.33 LRV Signalling at Junction in Karlsruhe, Germany Figure 5.34 Light Rail Control Room in Birmingham, UK
Complex tramway junction at a crossroads in Karlsruhe. Note the combination of coloured traffic lights with white-bar signals for trams.
Light rail control room for Midland Metro in Birmingham, UK.
General traffic along the tramway track should be diverted into parallel lanes and streets wherever possible, since any queues building up will delay the trams. Traffic crossing the track is less of a problem, as it can be dealt with by traffic signals. For fast and reliable operation of the tramway, trams should also have priority at highway junctions. Achieving proper interaction with road traffic is critical to achieving the performance of the tramway, and micro-simulation at the design stage (using a product such as PTV’s VISSIM) is therefore recommended.
Several systems are available to locate and identify approaching trams. Most commonly these use loops between the rails, interacting with a vehicle-mounted transponder, but systems with GPS vehicle location and radio data transmission are worth considering as an alternative, and can readily be applied to buses too. Information transmitted from the tram to the infrastructure includes:
� Presence of a tram (to activate priority over traffic) � Identity of the tram (relayed back to tramway control) � Intended route of the tram (to activate motorised points and an appropriate signal phase, also to
update real-time displays at stops along the route)
Perth Light Rail Study T:\78105106 - Perth Light Rail\00\doc\reports\Final Report\Perth Light Rail Study Report_13Aug07_Final.doc Revision 0 13 August 2007 Page 42

� Readiness to start from certain stops (so that these priorities are not requested until the tram is ready to proceed)
Each tramway network has a central control room. While they do not routinely operate signals, controllers can monitor the movement of vehicles and intervene if necessary. The controller has radio communication with all vehicles and usually also monitors CCTV images of tram stops. Tramway control may be co-located with the city’s highway control room, or have the facility to modify the behaviour of the traffic control system in the surrounding streets. The controllers also deal with tram movements into, out of and usually within the depot, public enquiries via help points, and routine and emergency isolations of the overhead line. For this last reason, the control room must be staffed whenever the overhead line is energised, even if no trams are operating.
5.6.2 Information Systems
It is usual for cables to be laid along the tramway route, often through ducts incorporated in the track slab. These can carry a SCADA system which deals with all the data transmission requirements of the tramway. This includes tram location, signal control, CCTV, remote operation of power circuit breakers, and also ticketing and passenger information.
Passenger information systems must take into account as far as practicable the needs of those with poor hearing, sight or cognitive skills. Best practice is to fit some combination of the following:
� Posters and signage at each stop giving general service, network and fare information, details of the surrounding area and interchange with other transport modes, as shown in Figure 5.32.
� Tactile surfaces to define the platform edge and ramps, and often also the information point. � Visual display on each platform, showing the route and expected departure times of the next few
trams from that platform, and having the ability to display special messages from the controllers. � Public address at stops, usually not used for routine announcements as this would annoy the
people in the surrounding area. � ‘Help point’ which can automatically announce service information when a button is pressed, or
put passengers in communication with the controller. � ‘Emergency button’, usually integrated with the help point, but with a separate button to put in a
priority call and point CCTV cameras towards the caller. � Display of destination, and often also the route or route number, on the ends and sides of each
vehicle.� Ability for the driver to make public address announcements inside and outside a vehicle, again
not routinely used but for example the driver can announce the route outside the tram if they see a blind person on the platform.
� Visual and automated audible information system within the vehicle, typically giving the next stop and the destination of the tram.
� Buttons to request the driver to stop at the next tramstop, and a display to show it is stopping (may not be necessary if all trams call at all stops).
� Emergency buttons inside the tram, activating an intercom to the driver.
Examples of the static tram information displays with a network map and tram sign at a tram “Superstop” and real time information displays in Melbourne are shown in Figure 5.35 and Figure 5.36 respectively.
Perth Light Rail Study T:\78105106 - Perth Light Rail\00\doc\reports\Final Report\Perth Light Rail Study Report_13Aug07_Final.doc Revision 0 13 August 2007 Page 43

Figure 5.35 LRT Signage in Melbourne Figure 5.36 Real Time Information Displays in Melbourne
Source: Transit Australia, Dec. 2005 Source: Transit Australia, Dec. 2005
Light Emitting Diode (LED) information displays are also used to show the next arriving trams and to display service information.
5.6.3 Ticketing Systems
Smartcard ticketing technology is now widely used throughout the world with new LRT systems. For Perth, the SmartRider ticketing system would be used because it has been adopted for the buses and trains. The SmartRider card reader could be installed near the doorways on the light rail vehicles similar to the bus operations.
An issue for the light rail system is the payment of cash fares since the light rail drivers will not be likely to handle money or sell tickets. The cash fares could be sold at ticket vending machines at each light rail stop or on the vehicles.
Fare inspectors would board the light rail vehicles to check for valid tickets. Any passengers without a valid ticket would be fined as on the Perth metro trains.
All passengers would be required to touch the reader before boarding and after leaving the tram at all stops, even for journeys wholly within the free zone. This allows for a non-flat fare scale outside the free zone.
5.7 Depot Requirements The purpose of a depot can be described as follows:
� Providing a safe and secure location for storage of vehicles not in service (especially in areas of high vandalism).
� Providing facilities for efficient and economic inspection and cleaning of vehicles and for repairing minor faults and replacement of wearing parts prior to entering service.
� Providing space, facilities and equipment in a light maintenance shop for carrying out the necessary periodic running maintenance work schedules on the vehicles.
� Providing space, if required, for other services necessary for the operation and maintenance of the system, e. g. permanent way, overhead line equipment, power supply.
� Providing facilities (if applicable) for major overhaul and heavy repair of components and vehicles.
Perth Light Rail Study T:\78105106 - Perth Light Rail\00\doc\reports\Final Report\Perth Light Rail Study Report_13Aug07_Final.doc Revision 0 13 August 2007 Page 44

For any LRT system, the depot is the operational base. At least one must be functioning at the latest by the time the system or its first route is to be opened for public service. It would however be an advantage if at least a usable part of it could be used well before that time for:
� Serving as a contractor’s site (track laying, power supply installation etc.). � Final commissioning of the passenger vehicles. � Staff training.
The depot may comprise one, and possibly a second, major basic installation:
� A stabling yard, cleaning and running maintenance facilities in a light maintenance shop. � A heavy maintenance and overhaul workshop (if applicable).
The location or locations for a depot will be a major issue in terms of its location, size and the future expansion of the network. The focus should be on the proximity of vacant land that is not only capable of supporting a depot in terms of size but is suitable in terms of adjacent land uses and potential planning impacts.
The activities that normally occur in a depot e.g. for maintenance, wash down of rail-cars and rail-car changeovers need to be accommodated within a location that can be connected to the first phase of the LR route. This last point is important in the overall strategic transport framework as the possible extension of the LR network will require the depot to service these extensions from a location that is ideally central or able to be efficiently connected to dispatch the required rail-cars to meet demand. There may be sites in proximity to the route where ground level parking is supplied. It may be possible to construct the depot on one of these areas and to use the air space above for multi-storey parking.
The storage yards do not need to be elaborate. Unlike buses, electric LRT cars have no engines that are temperature sensitive. They will start reliably in any ambient temperature experienced by North American and European cities. There is no necessity to house them in enclosed buildings, although in extreme climates simple roofing over the storage tracks is sometimes installed. Also, the cars require no fuelling stations, thereby eliminating the possibility of fuel spills.
A light rail depot is required for the following reasons:
� Equipment for vehicle interiors to be cleaned, vehicle exteriors to be washed and vehicles to be topped up with sand, generally on arrival, but possibly on departure (three vehicle lengths).
� Secure storage for the entire fleet. � A workshop, generally with capacity for 10 to 20 percent of the fleet, but not less than three
vehicles.
If possible, the depot track layout should be designed so there is no place where a derailment can prevent the entire fleet leaving the storage sidings or the depot itself.
Examples of light rail maintenance facilities are shown for Croydon, UK and Sydney in Figure 5.37and Figure 5.38 respectively.
Perth Light Rail Study T:\78105106 - Perth Light Rail\00\doc\reports\Final Report\Perth Light Rail Study Report_13Aug07_Final.doc Revision 0 13 August 2007 Page 45

Figure 5.37 LRV Maintenance Equipment in Croydon, UK Figure 5.38 Light Rail Depot in Sydney, Australia
Depot track for re-filling sand boxes (foreground)and tram wash (background) (Croydon)
Light rail maintenance facility in Sydney that is along the tracks beside of the main light rail route.
Usually trams can enter and leave the workshop under their own power, with sections of the overhead line able to be isolated for safe working. Sometimes as small electric shunter is provided for moving dead trams. A small network will generally have a road-rail maintenance vehicle, with a tower or platform for overhead line repairs, and a coupling to tow a dead tram. Heavier maintenance, such as rail grinding or track tamping, will be carried out by external contractors using their own equipment.
The workshop typically has an area for light maintenance, with a pit between the rails to access underfloor equipment, as shown in Figure 5.39. If low-floor vehicles are operated, much of the electronic equipment is mounted on the roof so high-level platforms are required to provide access to these areas.
A wheel lathe is usually provided so that wheels can be re-profiled without removal from the vehicle, as shown in Figure 5.40. If the chosen design has independent wheels rather than conventional axles, then a design compatible with these is necessary. Finally, the heavy maintenance area (25-30 percent of the workshop) is likely to be equipped with jacks to raise an entire vehicle off its bogies.
Figure 5.39 Depot Interior in Barcelona, Spain Figure 5.40 LRV Wheel Lathe in Croydon, UK
Interior of tram depot in Barcelona, showing pit for underfloor access and jacks for lifting tram off bogies.
Wheel lathe in Croydon tram depot. Note also red and green overhead line status indicators at far end of shed.
Perth Light Rail Study T:\78105106 - Perth Light Rail\00\doc\reports\Final Report\Perth Light Rail Study Report_13Aug07_Final.doc Revision 0 13 August 2007 Page 46

The depot is likely to be the base for operation and maintenance, so will probably also include the staff car park, signing-on and welfare facilities, control room and offices for the management and administration staff.
The land requirements for the depot will comprise of the following:
� Fenced outdoor yard for secure vehicle storage. � Buildings for administration and operations. � Facilities for vehicle maintenance, such as daily washing and cleaning and periodic major
servicing. � Buildings for the storage of supplies. � Staff parking.
The amount of land required for depot facilities depends upon the quantity of vehicles operating on the system and the layout of the proposed system. Other factors to take into account are the availability of land in appropriate locations and the neighbouring land uses.
5.7.1 Depot Requirements for Perth
It is expected that the Perth tram route would operate for approximately 19 hours per day. This is typical for linear centralised routes, and allows sufficient time for routine maintenance of track and vehicles assuming that some vehicles could come out of service during after the afternoon peak with a less frequent service in the evenings. Occasional day-long closures might be necessary for exceptional maintenance, but would be scheduled for the least busy days.
The depot should preferably be located close to the light rail route. It is important to be integrated with other public transport services, such as the bus routes and a railway station, so that the LRT drivers and maintenance workers can easily get to the depot.
Depot requirements for the preferred route alignment are discussed in more detail in Section 9.2.
5.8 Alternative Rubber-Tyred Technology This section briefly discusses the Bombardier GLT or TVR and the Translohr systems, which are the rubber-tyred modes most closely resembling light rail. Other rubber-tyre transit technologies are essentially standard buses with some form of guidance system, and are not considered here. Examples of these vehicles are shown in Figure 5.41 and Figure 5.42 for Nancy and Caen in France, respectively.
Figure 5.41 Rubber-tyred LRV in Nancy, France Figure 5.42 Rubber-tyred LRV in Caen, France
Perth Light Rail Study T:\78105106 - Perth Light Rail\00\doc\reports\Final Report\Perth Light Rail Study Report_13Aug07_Final.doc Revision 0 13 August 2007 Page 47

In both systems, a multi-section articulated vehicle is carried on rubber tyres but steered by a mechanical guidance mechanism to follow a grooved rail laid along the centre of the intended path and flush with the running surface. Unlike conventional buses, the guidance system steers several axles along the length of the vehicle, so that all parts of it closely follow the rail even on the sharpest curves. While both Bombardier and Translohr use this concept, differences in the shape of the rail and nature of the wheel-rail interface mean that they are not compatible with each other.
Both suppliers offer electric traction, which in principle can be fed from a single wire with current return via the guide rail6. Bombardier vehicles can be fitted with a diesel engine and built to the maximum dimensions permitted for buses (24m long), and hence are able to operate in unguided mode. Lohr claims unguided operation is possible for short distances using battery power; this might for instance avoid the need for complex pointwork in the depot. Lohr vehicles are available for single or double-ended operation, Bombardier for single-ended only.
A 2002 study visit sponsored by the US Federal Transit Administration viewed a trial of both technologies in Paris. The following prices were quoted:
Price (million Euro/$AUS) Manufacturer Bombardier Lohr
Vehicle 2.1 ($AUS 3.5) 2.1 ($AUS 3.5) Infrastructure per km 3.1 ($AUS 5.2) 4.3 ($AUS 7.2)
An overall cost saving over light rail of between 12 - 24 percent is predicted.
Translohr has contracts for Clermont-Ferrand in France and three Italian cities: Venice/Mestre, Padua and L’Aquila. The Bombardier technology is now in use in the French cities of Nancy and Caen. However there have been significant concerns with operation of this system, notably uncontrolled lateral movement of the rear section in the transition between guided and unguided operation soon after the opening of the route at Nancy. After twice striking an overhead wire support, the route was shut down for some time for investigation and rectification. The Caen network does not use unguided running in normal service.
Rubber-tyred vehicles are likely to be able to climb steeper gradients than trams, and may also be compatible with tighter curves.
In view of the limited service experience compared with tramways, it is appropriate to be cautious about the suitability and benefits of modes of this type. In particular:
� If the vehicle is built to dimensions suitable for unguided street operation, then it could operate unguided in this mode over the whole route with no need for special infrastructure (unless there are significant width constraints). However the vehicles are smaller than many street trams, so the resulting network would have lower carrying capacity and/or higher operating costs.
� If the vehicles are built to a similar size to trams, then unguided operation is unlikely to be possible in the highway, and therefore guidance infrastructure will be needed over the entire route.
� If rubber tyres are guided to follow exactly the same path, the road surface needs to be highly rigid to prevent rutting. This requirement along with the central guiderail means that the guideway is of similar construction to street tramway track, and presents the same problems with respect to utility diversions.
6 The Nancy TVR system uses two-wire overhead for compatibility with existing trolleybuses.
Perth Light Rail Study T:\78105106 - Perth Light Rail\00\doc\reports\Final Report\Perth Light Rail Study Report_13Aug07_Final.doc Revision 0 13 August 2007 Page 48

� On segregated sections a tram can use cheaper ballasted track, but it is not evident how the cost of rubber-tyre infrastructure might be reduced on these sections.
� The vehicle is of a similar weight to that of a tram, and as rubber tyres are less energy-efficient, the power consumption is likely to be greater.
� Vehicle and infrastructure costs are not much less than those of a comparable tram system. � Asset life is unproven. � On tramways the whole weight of the vehicle rests on the wheels. This is not the case for guided
rubber-tyre vehicles, which may therefore be more prone to loss of guidance if there is an obstruction in the rail groove.
� The technology is proprietary.
Perth Light Rail Study T:\78105106 - Perth Light Rail\00\doc\reports\Final Report\Perth Light Rail Study Report_13Aug07_Final.doc Revision 0 13 August 2007 Page 49

6.0 Light Rail Transit for Perth – Summary of Issues 6.1 Public Transport Planning Concepts Selecting an appropriate alignment for a light rail route and choosing a suitable system type will depend on the purpose of the route. However there are some basic concepts for planning any new public transport system that will ensure the route demonstrates effectiveness of purpose, and maximises operational efficiencies. Typical applications of planning concepts applicable in Perth are shown in Table 6.1, as defined by the Study Working Group.
Table 6.1 Planning Concepts for Perth
Subject Concept Reason In Perth Create CONNECTIONS between major activity nodes
Centres of travel demand between which the majority of people will need to travel
Perth CBD, Subiaco Activity Centre, QEIIMC, UWA campus
Provide DIRECT ROUTES along identified demand corridors
Direct routes mean quicker journey times
Stick to main streets and avoid residential roads
Land Use
Provide LAND USE OPPORTUNTIES that may in future utilise the counter-peak directional flow capacity
If people can be encouraged to travel in both directions during rush hour (by building a balance of houses and offices in and around each activity node), the system is twice as efficient
More office space in Subiaco and East Perth; higher density living in the CBD and around the QEIMC
Provide for INTERCHANGE with other transport modes
This provides an opportunity to use public transport to reach many more destinations
CBD and Subiaco railway stations, CAT and other bus services, park n ride locations
INTEGRATE the system with the street environment to avoid conflict and maintain a safe operating environment
By setting out where people can walk, drive and cycle, the street character is developed and becomes safer for all road users
Shared environments like Murray Street Mall, or along Rokeby Road
Transport
Provide a RELIABLE system that people can depend on
A reliable system means more people will use it
Provide priority at traffic signals, and dedicated light rail lanes
Create a LEGIBLE route by minimising turns and attempt to retain both tracks on the same street
A straight-forward route helps passengers know where to get on and off (strong legibility), and reassures people they are travelling in the right direction
Avoid narrow streets
Provide the best pedestrian and disabled ACCESS to the route alignment and to the stops
If people are going to use the system they need to be able to get to and from the route safely and easily
Position stops outside major activity nodes and ensure the local network of footpaths provides access
People
Design the system CAPACITY TO SUIT DEMAND
The number of trams and the frequency of the timetable should be designed to suit the number of people who want to use the service
Apply all of the above
Perth Light Rail Study T:\78105106 - Perth Light Rail\00\doc\reports\Final Report\Perth Light Rail Study Report_13Aug07_Final.doc Revision 0 13 August 2007 Page 50

6.2 Conflicting Network Issues Typically, Perth is a car-oriented city and motorists are accustomed to a generous amount of road space; convenient routes with wide road reservations providing multiple lanes ensure capacity is rarely at a premium. There is limited congestion in the city centre and inner urban areas, aside from a few hot spots during peak hours.
Figure 6.1 Plenty of Road Space in Perth – Hay Street, Subiaco
Nevertheless, as the city grows so will the demand for travel. Without alternative mode choices, people will be compelled to travel by private car. This will be particularly problematic for the city centre and inner urban areas where there is limited opportunity to expand road widths. Traffic flow can be optimised by employing various traffic management techniques and controlling access to car parking areas; however the value of these methods is limited.
Figure 6.2 Narrow Roads in Perth’s City Centre – Hay Street (CBD) and Rokeby Road (Subiaco)
The application of additional public transport is therefore a vital component to ensuring the city centre and inner urban areas remain accessible to everyone, maintain a high standard of street amenity and do not become choked by vehicles and the resulting emissions.
In the past, buses and light rail vehicles have operated in a mixed traffic environment. Where traffic flows are minimal, this is an acceptable arrangement, however if traffic levels increase then the public transport vehicles are delayed by the congestion, which degrades the reliability of the services, frustrates passengers and ultimately reduces patronage.
Perth Light Rail Study T:\78105106 - Perth Light Rail\00\doc\reports\Final Report\Perth Light Rail Study Report_13Aug07_Final.doc Revision 0 13 August 2007 Page 51

In order to operate effectively and efficiently, any on-road public transport system requires dedicated road space, particularly in locations where there are many motor vehicles. By reallocating some road space for sole use by public transport vehicles, the remaining street environment may require a new approach. Modal priorities may need to be established, for example, a preference may be for footpaths and street trees rather than on-street car parking or an additional traffic lane.
Figure 6.3 Light rail in traffic (below left) or segregated tracks (below right)
Traffic may be displaced by the introduction of public transport lanes, which will result in traffic being removed from the system as motorists switch to using public transport. Some of the remaining drivers will find alternative routes. It is critical that an applicable route be identified and traffic be redirected accordingly so that capacities on parallel routes can be managed, and traffic does not negatively impact on surrounding residential areas.
The following issues are relevant to the Perth networks:
� The one-way systems in the City of Perth and City of Subiaco may need to be adjusted in places to facilitate the introduction of a light rail system. Loss of carriageway space on a one-way road will cause an imbalance in the road network for traffic circulation.
� If the light rail alignment is proposed along narrow roads, traffic may need to share road space with the light rail vehicles. In such an instance, through-traffic access would need to be tightly controlled or removed.
� If the light rail alignment is proposed along streets that experience high pedestrian movement, then the street environment must still provide an attractive environment for pedestrians, including sufficient air space to permit the retention of large street trees and shop awnings.
6.3 Technological Issues The light rail technology for Perth needs to consider the following general design features:
� Likely capacity of between 150 and 300 passengers per vehicle. � Serves several major stadiums, so it will be expected to carry large numbers of passengers to
and from sporting or other events. � Preferred minimum curve radius of 25 metres allows retention of reasonable operating speeds.
An absolute minimum of 18 metres can be accommodated with reduced operating speeds. � Maximum gradient 6.5 percent over a distance of 300m. � Maximum gradient at a stop no more than 5 percent but preferably no greater than 3 percent. � Continuous hours of operation approximately 5am to midnight, seven days a week.
Perth Light Rail Study T:\78105106 - Perth Light Rail\00\doc\reports\Final Report\Perth Light Rail Study Report_13Aug07_Final.doc Revision 0 13 August 2007 Page 52

� Extreme climate conditions, with air conditioning essential in summer and the risk of high wind and heavy rain in winter. The weather in Perth can be quite extreme.
The Steering Committee approved the technology options, based on the information provided in Chapter 5 and discussions during committee sessions. It was agreed that the light rail technology have the following attributes:
� Low-floor double-ended electric light rail vehicles � Overhead power supply using light weight span wires to minimise visual intrusion (ground-level
pickup could be possible once technology is more reliable) � Advanced real time information and tracking systems � SmartRider for ticketing with integrated fares
The Steering Committee also approved desirable features of the track and street environment:
� Brick or block-paved track for street sections minimises sharing with other road traffic; block paving helps to enforce traffic separation
� Vegetated track adjacent to parklands and residential areas
Perth Light Rail Study T:\78105106 - Perth Light Rail\00\doc\reports\Final Report\Perth Light Rail Study Report_13Aug07_Final.doc Revision 0 13 August 2007 Page 53

7.0 Alignment Selection 7.1 Identifying Route Options The project Working Group discussed the merits of various route alignment options and brainstormed the most appropriate location for the core part of a future light rail system for Perth. While the brief stipulated a focus on linking Subiaco and East Perth, the Working Group discussed options of broadening the influence of the core alignment to include a wider area, potentially including the Town of Vincent activity centres, particularly Northbridge and Leederville.
Route options were developed based on the following broad criteria:
� Directness of route (number of turns) � Number of vehicles required for the same peak service frequency � Legibility (length of main roads used versus local streets) � Number of traffic signals and potential points of delay along the route � Total length of track required (proxy for the cost of the light rail infrastructure) � Amount of overlap of the walk-in catchment areas for 400m to light rail stops versus 800m to
railway stations
Further to the above broad criteria, the identified route options were checked against the following practical and / or social issues to ensure the routes would be viable:
� Hay Street Mall – proposition unacceptable to the City of Perth � St Georges Terrace – gradient is too steep at western end � Adelaide Terrace – too busy, main route for traffic and buses from south of the river � Riverside Drive – too remote from the centre of the CBD � Victoria Avenue – St Mary’s Cathedral restricts movement of light rail vehicles, impossible � Bennett Street – gradient is too steep � Plain Street – gradient is too steep and this route is deemed a major north-south vehicular artery � Hale Street – gradient is too steep � Kings Park Road – not supported by City of Perth � Harvest Terrace – gradient too steep and connection to Murray Street too sharp � Colin Street – narrow street with a residential component � Outram Street – narrow street with a residential component � Roberts Road – too remote from Subiaco centre of activity � Winthrop Avenue – too remote from QEIIMC � Fairway – gradient too steep between Fairway and Hampden Road
Five light rail route options were identified by the Working Group as a potential core route for a light rail network:
� Option 1 UWA – East Perth (via Thomas Street and Winthrop Avenue) � Option 2 UWA – Subiaco – East Perth (via Rokeby Road) � Option 3 UWA/Jolimont – East Perth � Option 4 Suburban Orbital Loop � Option 5 Terrace Loop
Perth Light Rail Study T:\78105106 - Perth Light Rail\00\doc\reports\Final Report\Perth Light Rail Study Report_13Aug07_Final.doc Revision 0 13 August 2007 Page 54
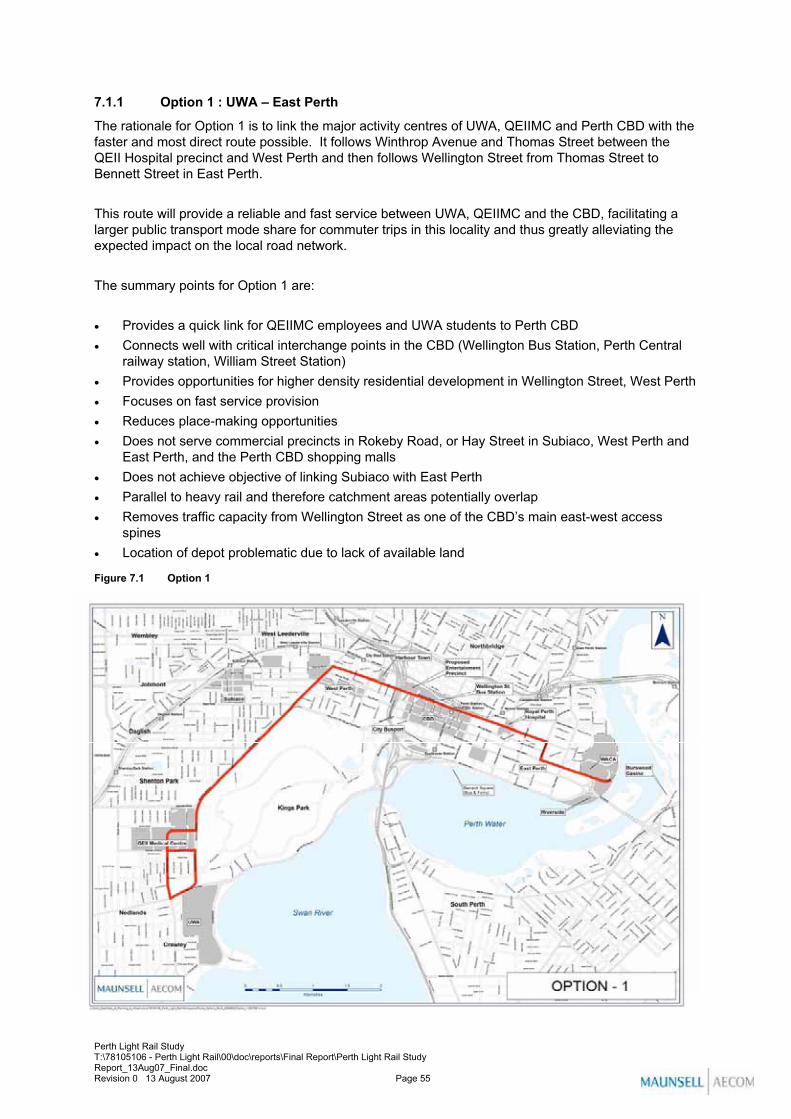
7.1.1 Option 1 : UWA – East Perth
The rationale for Option 1 is to link the major activity centres of UWA, QEIIMC and Perth CBD with the faster and most direct route possible. It follows Winthrop Avenue and Thomas Street between the QEII Hospital precinct and West Perth and then follows Wellington Street from Thomas Street to Bennett Street in East Perth.
This route will provide a reliable and fast service between UWA, QEIIMC and the CBD, facilitating a larger public transport mode share for commuter trips in this locality and thus greatly alleviating the expected impact on the local road network.
The summary points for Option 1 are:
� Provides a quick link for QEIIMC employees and UWA students to Perth CBD � Connects well with critical interchange points in the CBD (Wellington Bus Station, Perth Central
railway station, William Street Station) � Provides opportunities for higher density residential development in Wellington Street, West Perth � Focuses on fast service provision � Reduces place-making opportunities � Does not serve commercial precincts in Rokeby Road, or Hay Street in Subiaco, West Perth and
East Perth, and the Perth CBD shopping malls � Does not achieve objective of linking Subiaco with East Perth � Parallel to heavy rail and therefore catchment areas potentially overlap � Removes traffic capacity from Wellington Street as one of the CBD’s main east-west access
spines � Location of depot problematic due to lack of available land
Figure 7.1 Option 1
Perth Light Rail Study T:\78105106 - Perth Light Rail\00\doc\reports\Final Report\Perth Light Rail Study Report_13Aug07_Final.doc Revision 0 13 August 2007 Page 55

7.1.2 Option 2 : UWA – Subiaco – East Perth
The rationale for Option 2 is to service the commercial, sporting and entertainment precincts in Perth and Subiaco in addition to the key activity centres of the UWA campus and the QEII Hospital precinct. It passes through the commercial precincts in Rokeby Road and Hay Street in Subiaco, Hay Street in West Perth and East Perth, and the Perth shopping malls in order to maximise accessibility and convenience for shoppers going to these businesses.
The summary points for Option 2 are:
� Provides a direct link between Subiaco CAD, Perth CBD and East Perth � Creates place-making opportunities in West Perth and Subiaco � Provides a visible, convenient and accessible service in the heart of the CBD � Good access to William Street Station � Connects to Subiaco Station for UWA students and QEII Hospital staff � May create traffic congestion, parking and amenity issues along Rokeby Road � Slower commuter route to the QEIIMC precinct and the UWA campus from the CBD � Location of depot problematic due to lack of available land
Figure 7.2 Option 2
This route will provide a reasonable link to Subiaco Station from UWA and QEIIMC via the Rokeby Road precinct. It will provide a permanent link between Subiaco and Perth CBD, providing opportunities to increase the vibrancy of West Perth. This option fulfils the objective to link Subiaco with East Perth.
Perth Light Rail Study T:\78105106 - Perth Light Rail\00\doc\reports\Final Report\Perth Light Rail Study Report_13Aug07_Final.doc Revision 0 13 August 2007 Page 56

7.1.3 Option 3 : UWA/Jolimont – East Perth
The rationale for Option 3 is to cater to two types of travel markets - commuters and students to UWA and the QEIIMC precinct, and shoppers to the commercial and entertainment precincts in Subiaco and Perth. It follows Winthrop Avenue and Thomas Street between the QEIIMC precinct and West Perth and then follows Murray Street from Thomas Street to Barrack Street in the CBD and then Hay Street through East Perth. The route would also serve the centre of the Subiaco Activity Centre with a second line linking Jolimont to West Perth along Hay Street.
The summary points for Option 3 are:
� Quick link for QEIIMC employees and UWA students to Perth CBD � Direct link between Subiaco CAD, Perth CBD and East Perth � Connects with critical interchange points in the CBD � Direct and higher frequency link between the CBD and East Perth Riverside development � Visible, convenient and accessible service in the heart of the CBD � Place-making opportunities in Subiaco, West Perth and Jolimont � Initial capital investment higher than Options 1 or 2 � Potential for staging and better opportunities for network expansion
Figure 7.3 Option 3
This route will essentially deliver all the benefits of Option 1 and Option 2 without the potential problematic issue of negotiating the narrow environment of Rokeby Road. The layout of the route will result in higher service frequencies in Perth CBD.
Perth Light Rail Study T:\78105106 - Perth Light Rail\00\doc\reports\Final Report\Perth Light Rail Study Report_13Aug07_Final.doc Revision 0 13 August 2007 Page 57

7.1.4 Option 4 : Suburban Orbital Loop
The rationale for Option 4 is to deliver an orbital public transport route for inner Perth serving key rail stations outside the CBD and providing an express route between QEIIMC, UWA and Perth CBD if a link is established along Mounts Bay Road.
The summary points for Option 4 are:
� Multiple interchange opportunities with heavy rail � Permanent orbital link between UWA, Subiaco, West Leederville, Northbridge and Perth CBD � Place-making opportunities in West Leederville and Northbridge � Express Service for QEIIMC employees and UWA students to CBD � Does not connect to East Perth and therefore does not conform to study brief � Feasibility of a first stage without a Mounts Bay Road link would be unlikely � Traffic congestion issues crossing Mitchell Freeway and Loftus Street � Will require complex scheduling
Figure 7.4 Option 4
This orbital link illustrates some of the alternative route options that could be considered other than a direct link between Subiaco and East Perth.
Perth Light Rail Study T:\78105106 - Perth Light Rail\00\doc\reports\Final Report\Perth Light Rail Study Report_13Aug07_Final.doc Revision 0 13 August 2007 Page 58

7.1.5 Option 5: Terrace Loop
The rationale behind Option 5 is to deliver an orbital public transport route for inner Perth that provides a link through to East Perth. This route does not provide good modal transfer opportunities in the CBD and therefore will not deliver a convenient service between UWA, QEIIMC and Perth CBD. The northern link along Roe Street does not provide any real benefit to public transport users and detracts from the objective of linking Subiaco to East Perth. St Georges Terrace and Adelaide Terrace do not offer a significant patronage during evenings and weekends due to the dominance of business / office land uses.
The summary points for Option 5 are:
� Poor link for QEIIMC employees and UWA students to Perth CBD � Poor interchange opportunities with heavy rail in Perth CBD � Southern section circuitous through CBD – Malcolm Street not a viable route as it is too steep � Northern section duplicates heavy rail corridor � Route does not provide a link through the centre of Perth CBD � Limited place-making opportunities � Route along St Georges and Adelaide Terraces will be subjected to severe traffic congestion � Barrack Street rail crossing could be difficult to negotiate due to steep approach from the CBD
Figure 7.5 Option 5
This orbital link parallels the existing railway line for a great proportion of the route and does not provide a direct service between activity centres.
Perth Light Rail Study T:\78105106 - Perth Light Rail\00\doc\reports\Final Report\Perth Light Rail Study Report_13Aug07_Final.doc Revision 0 13 August 2007 Page 59

7.2 Option Refinement All options were considered to have reasonable merit. Options 1, 2 and 3 each shared some similarities in route alignment choice. The main differences between these options were:
� The manner in which Subiaco is served (Rokeby Road or Hay Street) � The use of Thomas Street as a high speed route between QEIIMC and Perth Central railway
station� The choice of route through the Perth CBD – Wellington Street, Murray Street or Hay Street
In order to select two alignment options for further consideration, the Working Group reviewed the potential routes in greater detail and attempted to identify which elements were:
a) most desirable from a transit point of view b) most desirable from a place-making point of view c) responded to the brief most accurately
Table 7.1 outlines the street locations that were considered by the Working Group, where the primary emphasis was to provide improved connections between existing and expanding activity centres, providing modal interchange opportunities and also opening up communities that currently have little or no public transport provision. Table 7.1 details the benefits and disbenefits of accommodating the light rail in a variety of streets that could provide such connections. This discussion helped to identify preliminary route options and to highlight no-go areas.
Table 7.1 Joining Up Activity Centres
Location Benefit Disbenefit Nedlands – linking UWA to the north
Fairway Will serve the UWA Crawley Campus
Will become internal to the UWA campus as expansion occurs
Broadway Will best serve the local community and accommodate an expanding UWA campus
Will remove existing on-street facilities and require a redesign of the streetscape
Subiaco – linking UWA and QEIIMC to Subiaco and the CBD
Hampden Road Will serve the Hollywood Village and allow for a direct link into the new QEII precinct
Will remove existing on-street facilities and require a redesign of the streetscape
Rokeby Road Will directly serve the Subiaco Activity Centre including side streets, and Hay Street
Will remove existing on-street facilities and require a redesign of the streetscape
Thomas Street Will provide a direct link from the QEII precinct to the CBD. Will provide access into Kings Park
Will not directly serve the Subiaco Activity Centre
West Perth – linking Subiaco to the CBD
Wellington Street Will provide direct links to Harbour Town shopping centre Difficult to link with Subiaco route
Murray Street Will potentially be the least disruptive link through West Perth Difficult to link with Subiaco route
Hay Street Will provide a direct link to the West Perth commercial precinct
Will impact on existing on-street facilities and require a redesign of the streetscape
Kings Park Road Will provide a direct access from Will change the existing nature of the
Perth Light Rail Study T:\78105106 - Perth Light Rail\00\doc\reports\Final Report\Perth Light Rail Study Report_13Aug07_Final.doc Revision 0 13 August 2007 Page 60

Thomas Street into the CBD street Central Perth – Linking West Perth to East Perth
Wellington Street
Will provide direct links to the new Northbridge Link development, Perth Central Rail Station and Wellington Street Bus Station
Will not directly serve the CBD shopping precinct or William Street Rail Station
Murray Street
Will provide direct links to the centre of the CBD shopping precinct and William Street Rail Station
Will not provide a direct link to Perth Central Rail Station or Wellington Street Bus station. Will remove existing on-street facilities and require a redesign of the streetscape
Hay Street Will provide direct links to the centre of the CBD shopping precinct
Will not provide a direct link to Perth Central Rail Station, William Street Station or Wellington Street bus station. Will remove existing on-street facilities and require a redesign of the streetscape
St Georges Terrace
Will provide direct links to the commercial centre (offices) of the CBD
Will not provide good links to any heavy rail stations and will not directly serve the CBD shopping precinct. Difficult to access due to steeper gradients
East Perth – linking the Riverside with the CBD
Wellington Street
Will reduce the length of the spur line and provide a shorter link to Claisebrook Station and Central TAFE
Will not link in effectively with the Riverside development due to steep gradients
Murray Street Is not a viable option due to the location of the cathedral
Hay Street
Will create a focus for redevelopment in East Perth and link directly through to the Riverside site
Will remove existing on-street facilities and require a redesign of the streetscape
Adelaide Terrace
Will provide access to the Riverside and park and will provide a direct link to the Causeway which could form a route extension in the future
Will not directly serve the residential community of East Perth nor have the capability of stimulating new development alongside the park
Other Destinations – providing links to other inner city activity centres
Jolimont
Extending out to Jolimont provides a link to a potential depot site and sets a direction for westward network expansion in the future
Will remove existing on-street facilities and require a redesign of the streetscape
West Leederville
Provides for a link between Subiaco and Leederville, serves St John of God Hospital and the medical precinct, provides a link to Leederville rail station
Will remove existing on-street facilities and require a redesign of the streetscape
Northbridge
Provides a link between Leederville and Northbridge and from Northbridge to the City, serves China Town and the night time entertainment precinct
Will remove existing on-street facilities and require a redesign of the streetscape
Perth Light Rail Study T:\78105106 - Perth Light Rail\00\doc\reports\Final Report\Perth Light Rail Study Report_13Aug07_Final.doc Revision 0 13 August 2007 Page 61

It was decided at Steering Committee level that the two routes taken forward for further assessment should provide a viable commuter route for QEIIMC and UWA whilst still providing a direct link between Subiaco and East Perth. The roads available to provide these links are limited and therefore the differences between the preferred two options are only critical through Subiaco.
A base route was established which greatly resembled Option 3, with two alternatives through Subiaco, A vs B, as shown in Figure 7.6:
� Option A links Thomas Street and Hay Street along Rokeby Road � Option B links Rokeby Road and Hay Street along Thomas Street
Figure 7.6 Option A and Option B
Both options serve the same key activity nodes. The main difference is reflected travel time; a trip between UWA and the CBD using option A will take longer than option B. This is a function of the route length, the proportion of dedicated carriageway space for the light rail, the number of signalised intersections, number of light rail stops and number of turns required.
Perth Light Rail Study T:\78105106 - Perth Light Rail\00\doc\reports\Final Report\Perth Light Rail Study Report_13Aug07_Final.doc Revision 0 13 August 2007 Page 62

7.3 Preferred Option The Steering Committee was required to choose between Option A and B through Subiaco. To undertake this task the Steering Committee completed a route objective matrix which compares one option with the other against 13 criteria, with the overall preference shown in Table 7.2. The criteria were developed by both the Working Group and the Steering Committee earlier in the Study process.
Table 7.2 Option Assessment Matrix
Objective Criteria Assessment Option A Option B Place-making potential Activity centres served �
Access to Growth Areas Growth areas served �
Access by Community, Number of Stops
Residential areas served �
Economic Catalysts for Development
Serving Major Patronage Generators
Commercial and institutional areas served
�
Negative Impact on Visual Amenity
Qualitative assessment of negative impact
� �
Positive Influence on Urban Streetscape
Qualitative assessment of positive impact
� �
Least Impact on Traffic Circulation
Residential areas within 50m of route
�
Nett Positive Impact on Local Area
Least Impact on Local Car Parking
Locations where parking is permanently removed
�
Overall Journey Time / Length of Overall Route
Direct comparison �
Achieve Modal Split from Private Cars to Public Transport
Qualitative assessment of probable mode switch - priority
�
Ability to Integrate with Future Transport Network
Qualitative assessment of e-w and n-s future linkages
� �
Route Staging Potential Ability to construct route in logical stages
�
FacilitateIntegratedPublicTransport
Implementation / Operating / Construction Cost
Direct comparison �
The Steering Committee recognised that Option B had some positive advantages, particularly that the Thomas Street road reservation can accommodate light rail without loss of carriageway space, and would therefore be less disruptive to existing traffic patterns and on-street car parking. The Steering Committee also recognised that Option B would provide a quicker journey between UWA/QEII and the CBD than Option A.
However the Steering Committee felt that the advantages of Option B were outweighed by the superior place-making potential of Option A which is seen to serve the heart of Subiaco. Other concerns regarding Option B included the significant construction and land acquisition issues required to widen Thomas Street. The Steering Committee indicated a clear preference for Option A as the route option taken forward to concept design.
Perth Light Rail Study T:\78105106 - Perth Light Rail\00\doc\reports\Final Report\Perth Light Rail Study Report_13Aug07_Final.doc Revision 0 13 August 2007 Page 63

Figure 7.7 Preferred Option
Perth Light Rail Study T:\78105106 - Perth Light Rail\00\doc\reports\Final Report\Perth Light Rail Study Report_13Aug07_Final.doc Revision 0 13 August 2007 Page 64

8.0 Integration with the Public Transport Network 8.1 Introduction This section discusses the potential to integrate the bus and heavy passenger rail networks with the proposed on-street light rail system and highlights particular opportunities to restructure the complete public transport network to complement the light rail services and avoid duplication of routes. The effect of an expanded light rail system on the future strategic public transport network has been reviewed and the potential impact of light rail on the Perth Free Transit Zone is also discussed.
8.2 Service Integration and Interchange The proposed light rail alignment between the UWA campus, QEIIMC, Subiaco, West Perth, Perth CBD and East Perth requires excellent integration with the existing rail network, the suburban bus network and the inner city CAT system. Without good transport integration with the bus and rail network, the LRT patronage will be limited to walk-in patronage along the route.
Potential locations for service integration and interchange could occur in many convenient locations, as shown in Figure 8.1.
Figure 8.1 Service Integration and Interchange Points
The key opportunities for integration and interchange between public transport services, including the light rail are shown in Table 8.1.
Perth Light Rail Study T:\78105106 - Perth Light Rail\00\doc\reports\Final Report\Perth Light Rail Study Report_13Aug07_Final.doc Revision 0 13 August 2007 Page 65

Table 8.1 Opportunities for Integration and Interchange
Location Mode Jolimont TerminusMatthews Netball Centre
Pat Goodridge Hockey Centre
� Circle Bus Route � Local buses � Park n Ride
Queen Elizabeth II Medical Centre � Local buses � Potential Shenton Park shuttle bus
University of Western Australia Stirling Highway
� Circle Route � Local buses
Subiaco Transit Mall Subiaco
� Heavy Rail � Local buses
Murray Street Transit Mall William Street railway station
� Heavy Rail � Blue CAT
Claisebrook Terminus Claisebrook railway station and Central TAFE
� Yellow CAT � Heavy Rail
8.3 Future Network The future heavy rail network in unlikely to change and therefore the anticipated interchange opportunities between rail services should be relatively simple to arrange. However the future local and regional bus network is relatively flexible; routes can be added or altered to increase total service area coverage, improve access to public transport, and provide a greater number of transport route options for bus and rail users. Therefore elements of the future bus network will most probably be changed to complement the new light rail system and provide a new web of local feeder bus services and cross town regional services that intersect with the light rail.
8.3.1 Impact on the Suburban Bus Network
There are three main types of bus route that would be affected by the introduction of light rail along the proposed alignment:
� The Circle Route – a regional bus route with the highest patronage in the Perth metro area � Local western suburbs bus services � The Subiaco Shuttle – a locally funded, short-distance route between UWA, QEIIMC and Subiaco
railway station
Circle Route The Circle Route operates at least every 15 minutes during weekdays. It could connect with the light rail at the Jolimont Terminus, at QEIIMC and at the Stirling Highway / Hampden Road intersection for the UWA campus. Connections between light rail and Circle Route services at Stirling Highway and Jolimont Terminus would provide for strategic public transport connections independent from the heavy rail network. The Circle Route would be a feeder service to light rail at the Jolimont bus/light rail interchange with passengers from the north (Floreat, Wembley, Innaloo, Churchlands) and south (UWA, Shenton Park). Likewise, the light rail would feed the Circle Route at Jolimont for passengers continuing north to Churchlands and Stirling.
Western Suburbs Bus Routes In order to maximise the efficiency of operations in the overall public transport network that includes light rail, a major change in the way that the bus network operates from the Western Suburbs would be required. The local bus routes that currently operate from the Western Suburbs to the centre of Perth
Perth Light Rail Study T:\78105106 - Perth Light Rail\00\doc\reports\Final Report\Perth Light Rail Study Report_13Aug07_Final.doc Revision 0 13 August 2007 Page 66

would be terminated at the light rail terminus in Jolimont, specifically those from Claremont, Floreat, City Beach and Swanbourne. Bus routes from the south west would continue to serve the centre of Perth, although providing opportunity to interchange with light rail on Stirling Highway.
This change to the western suburbs bus network would require through passengers to transfer between bus and light rail to complete their journey into Perth city centre. Passengers may anticipate a prohibitive time penalty associated with modal transfer and may be discouraged from using public transport. Therefore it would be crucial to develop a facility that creates a seamless transfer environment between services operating on very high frequencies, particularly during the 3 hour morning and evening peak periods. The frequency of the bus and light rail services would need to be sufficiently high so that the transfer waiting time is minimised. The overall travel time to central Perth could not be significantly longer that existing bus trips. The kilometres saved by not operating local bus services into the centre of Perth could be reinvested in a several high frequency feeder bus routes.
The local bus routes in the Western Suburbs that could be reconfigured to be feeder routes to the Jolimont Terminus are:
� Routes 81, 84, 85, 91, 92, 94, 95 (City Beach – Perth) � Route 27, 28 (Claremont – East Perth via Subiaco and West Perth)
Routes that would be maintained but could be adapted to higher speed, less frequently stopping services are: � Route 23 (Claremont – Perth via Mounts Bay Road) � Routes 24, 25 (Claremont – Perth via Kings Park Road)
Subiaco Shuttle Route 97 The Subiaco Shuttle Route 97, which is jointly funded by Transperth, the City of Subiaco, QEIIMC and UWA, was introduced in 2001 to provide a frequent bus service between the UWA campus at Crawley, the QEII Medical Centre and the Subiaco railway station via Shenton Park and Rokeby Road in Subiaco. It currently operates every 15 minutes during the daytime on weekdays, every 30 minutes on Saturdays and hourly on Sundays.
Introduction of the light rail route along Rokeby Road would replace Route 97, which could be discontinued. Route 26 through Shenton Park could be modified to cover areas in Shenton Park furthest away from the light rail route, for example Hensman Road, Nicholson Road and Derby Road.
8.3.2 Impact on the Passenger Rail Network
The passenger railway network is unlikely to expand or change to any significant degree in the central metropolitan area (over and above current improvements); therefore impacts on the rail network are not going to influence route changes, but instead could alter peak hour and total patronage figures and impact upon the function of particular stations. The frequency of services, stopping patterns, and the number of carriages could all be influenced by integration with the light rail system, as could station expansion plans and platform width requirements.
Heavy Rail Patronage The light rail alignment will parallel the heavy rail Fremantle line for a short length between Subiaco and the centre of Perth, but it is not anticipated that this will decrease passenger numbers on the Fremantle line between Subiaco and William Street / Perth Central stations. The light rail system will generate a new patronage market and supplement the capacity between the high demand corridor between UWA, Subiaco and Perth.
Perth Light Rail Study T:\78105106 - Perth Light Rail\00\doc\reports\Final Report\Perth Light Rail Study Report_13Aug07_Final.doc Revision 0 13 August 2007 Page 67

Station Access and Design Pedestrian access between the light rail stops and the railway stations will require special consideration to maximise the legibility and safety so that passengers can easily transfer between these two modes. Each railway station has different issues with improving the physical connection between the train and light rail stops as summarised below:
Subiaco Railway Station� Passengers will need to walk from the lower level train platforms at the railway station north of
Roberts Road to the closest light rail stop on Hay Street or Rokeby Road (< 200 metres). � There is not a direct line-of-sight between the heavy rail platform and the light rail stop so
directional signage will be required at the railway station, along Rokeby Road and at the light rail stops.
� Detailed patronage forecasting will provide information regarding the predicted number of interchanging passengers, and advise whether any element of the station design would require revision to support the safety and legibility of the transit environment.
Figure 8.2 Subiaco Locality Plan
Source: www.maps.google.com.au
Perth Central and William Street Railway Stations
� Passengers will need to walk from the light rail stop in Murray Street Mall to Perth Central which will have several entrances. They would have options to walk to the entrance of the railway station underneath William Street or to cross Wellington Street at William Street or via Forrest Place to the existing station.
� There will not be a direct line-of-sight between the train platforms at Perth Central or William Street stations and the light rail stop in Murray Street Mall; therefore appropriate directional signage will be required inside both railway stations, and also at street level along William Street, in Murray Street Mall and at the light rail stops.
� Detailed patronage forecasting will provide information regarding the predicted number of interchanging passengers, and advise whether any element of the station design would require revision to support the safety and legibility of the transit environment.
Perth Light Rail Study T:\78105106 - Perth Light Rail\00\doc\reports\Final Report\Perth Light Rail Study Report_13Aug07_Final.doc Revision 0 13 August 2007 Page 68

� It would be important to ensure passengers exiting the railway station at Murray Street Mall were well directed to their street-level destination of choice, including light rail, prior to arriving at street level. This would help to avoid conflict between pedestrians and light rail vehicles, and would combat pedestrian congestion at the station entryway.
Claisebrook Railway Station� Passengers transferring from the train to light rail would need to use a ramp and overpass and
then walk up to 200 metres to the light rail stop at Central TAFE. � There will not be a direct line-of-sight between the train platforms at Claisebrook station and the
light rail stop at Brown Street; therefore appropriate directional signage will be required inside the railway station, along the short route around Central TAFE and at the light rail stop.
8.3.3 Impact on Central Area Transit (CAT)
The existing CAT system in Perth CBD and the Free Transit Zone (FTZ) are shown in Figure 8.3. It is acknowledged that this system with change with the opening of the Southern Suburbs Railway, but the details of these changes have not yet been finalised.
Figure 8.3 Existing Perth CAT and FTZ
Introducing light rail will impact upon the operation of the three CAT bus routes to varying degrees.
The Red CAT route, which operates every 5 minutes during the daytime on weekdays and every 25 minutes on weekends, would be discontinued as its route would essentially be duplicated by the light rail alignment between West Perth and East Perth. The light rail would provide a more legible east-west public transport than the Red CAT route that operates on a one-way circuit.
Perth Light Rail Study T:\78105106 - Perth Light Rail\00\doc\reports\Final Report\Perth Light Rail Study Report_13Aug07_Final.doc Revision 0 13 August 2007 Page 69

The removal of the Red CAT route would free-up a large number of buses that could be utilised to increase the frequency of the Yellow or Blue CAT routes, or devise a new cross town route.
The Yellow CAT route would be maintained along Wellington Street every 10 minutes on weekdays and every 30 minutes on weekends. An opportunity for interchange with light rail at Brown Street could offer alternative travel options for the residents of East Perth.
The Blue CAT route that operates north-south between Northbridge and the Perth foreshore would not be affected by the light rail and would continue to operate the same levels of service at every 7 minutes during the daytime on weekdays and every 15 minutes during the evenings and on weekends. The Blue CAT route would only be affected if a future north-south LRT line was built from Perth foreshore to Morley as part of a future extension. An opportunity for interchange with light rail at Barrack Street and William Street will provide more legible and useful links across the centre of Perth.
8.3.4 Impact on the Free Transit Zone (FTZ)
The Free Transit Zone (FTZ) is the same as the Perth Parking Management Act area as shown in Figure 8.3.
Based on the existing FTZ boundary, light rail passengers destined for Subiaco and Western Suburbs from inside the FTZ would pay a Zone 1 fare. Only if special funding arrangements were considered to extend the Free Transit Zone into Subiaco, would this change. Any cross-boundary trips between the Cities of Perth and Subiaco would generate at least a Zone 1 fare.
There are some options to consider regarding the future of the FTZ should light rail be introduced:
� Remove the FTZ, but provide free services only on the CAT bus routes in Perth CBD. This would eliminate the complications of fare payment on the light rail, but would discourage the existing short trips with passengers using the Red CAT bus between West Perth, Perth CBD and East Perth. Under this arrangement the light rail would be excluded from the free services.
� Retain the FTZ as it stands. A policy decision regarding light rail would need to be made if it is to be considered part of the FTZ or not. If the light rail is included then measures would need to be incorporated as part of the ticketing system to enforce payment for trips extending outside the FTZ (possible using smartcard technology for boarding and alighting passengers).
� Expand the FTZ to Subiaco CBD to the shopping precincts of Hay Street and Rokeby Road. This would require additional funding, a revision to the policy and an agreement about funding towards the light rail fares and other services.
If the FTZ boundary remains unchanged it will only impact upon those trips undertaken wholly within the zone between West Perth and East Perth. Many of these trips are on the Red CAT bus which operates every five minutes on the most direct and convenient route to the West Perth and East Perth commercial precincts. If the Red CAT is discontinued when the light rail is implemented, it would be expected that most of the Red CAT patronage would be allocated to the light rail system.
Perth Light Rail Study T:\78105106 - Perth Light Rail\00\doc\reports\Final Report\Perth Light Rail Study Report_13Aug07_Final.doc Revision 0 13 August 2007 Page 70

9.0 Detailed Assessment of Preferred Route This section presents the results of more detailed planning and engineering investigations of the preferred route alignment, including streetscape design, road space allocations, depot locations and layout, and traffic modelling.
9.1 Streetscape Design and Road Space Allocation This section describes how the Steering Committee and Project Team collaborated to identify the large number of issues and concerns regarding the street environment that the light rail would occupy. There are a range of demands for street space in this changing environment which required a review in order to achieve a balance of complementary uses. In most locations there are one or two key elements of the local street life that are a priority for people currently living and working in the local area, local businesses, current and future public transport users and future residents along each section of the route.
9.1.1 Kerbside Uses
A survey was undertaken of kerbside uses along the entire light rail route alignment. The results of this survey provided detailed local knowledge on the use made of kerbsides in each local centre and along major roads. The survey results also provided an estimated total number of on-street car parking bays that would be lost due to the requirement for light rail priority lanes and additional pedestrian circulation space. Figure 9.1 illustrates the total number of on-street car parking bays, motorcycle parking spots, bus zones, loading zones and taxi zones that are presently situated on either side of the total length of road alignment identified for the light rail route. A reasonable proportion of kerbside along the route length is used only as carriageway space and does not have another purpose (such as Hay Street in Jolimont, and Thomas Street), however this has not been reflected in the graph as these distances cannot be accounted for in vehicle units.
Figure 9.1 Kerbside Uses
1043
2181 31 6
0
200
400
600
800
1000
1200
Car Parking MotorcycleParking
Bus Zone Loading Zone Taxi Zone
Veh
icle
Uni
ts
Figure 9.1 indicates that car parking occupies by far the largest proportion of the kerbside. This also suggests that maintaining the small number of existing loading zones, taxi zones and motorcycle parking areas could be quite easily achievable.
Perth Light Rail Study T:\78105106 - Perth Light Rail\00\doc\reports\Final Report\Perth Light Rail Study Report_13Aug07_Final.doc Revision 0 13 August 2007 Page 71

The survey was undertaken on a block by block basis, and therefore it is possible to break the total route results down into local areas or particular street lengths. Figure 9.2 illustrates the manner in which the results in Figure 9.1 have been presented.
Figure 9.2 Kerbside Use Survey Areas
Figure 9.3 demonstrates that the West, Central and East Perth sections of the alignment from Havelock Street to Trinity College have the most diverse variety and proportion of kerbside uses.
Figure 9.3 Kerbside Use Survey Local Areas
0
50
100
150
200
250
300
350
Princess toRokeby
Thomas to Hay Selby toHavelock
Havelock toBarrack
Barrack to Trinity Hay to Brown
Car Parking Motorcycle Parking Bus Zone Loading Zone Taxi Zone
Perth Light Rail Study T:\78105106 - Perth Light Rail\00\doc\reports\Final Report\Perth Light Rail Study Report_13Aug07_Final.doc Revision 0 13 August 2007 Page 72

Figure 9.4 Kerbside Use Survey Local Areas – Focus on Non-Car Parking Uses
9.1.2 Land Use Review
The land use review was undertaken to understand the existing proportion of properties that utilised the verge for alfresco dining or drinking. It also gives an overview of the variety of ground floor land uses and what proportions are present in each local area along the light rail route.
The light rail route through the Perth CBD is mostly retail along the ground floor as shown in Figure 9.5; 5% of the land use frontages utilise the verge space for al fresco activities.
Figure 9.5 Land Uses Perth CBD
Perth Central District (Milligan Street – Irwin Street) Non-food
RetailFoodretail
Al fresco dining
Bar and entertainment
Al fresco bar
Residential Office
162 41 20 13 8 2 23
Residential 4%
Bar Al Fresco 1%
Bar 1%Food Al Fresco 4%
Food 7%
Retail 54%
Office 29%
Perth Light Rail Study T:\78105106 - Perth Light Rail\00\doc\reports\Final Report\Perth Light Rail Study Report_13Aug07_Final.doc Revision 0 13 August 2007 Page 73
0
10
20
30
40
50
60
70
80
90
100
Princess toRokeby
Thomas to Hay Selby toHavelock
Havelock toBarrack
Barrack to Trinity Hay to Brown
Car Parking Motorcycle Parking Bus Zone Loading Zone Taxi Zone

The large proportion of retail in the CBD stimulates a more continuous stream of pedestrian activity throughout the day than office accommodation does and large amounts of activity on the weekend. However a large proportion of offices will create higher levels of pedestrian activity in the morning, lunch and evening peaks. These land uses suggest reasonable levels of street use during each day with busy peak periods where footpaths may become congested. There is probably a high demand for 1-2 hour on-street car parking to facilitate short shopping trips.
The implications for current land uses in the CBD of a light rail system will be increased pedestrian activity around the stops. It will be important to ensure that sufficient pedestrian circulation space is provided within the road reservation which not only complements existing activity levels but also allows room for growth.
There is more of a balance between office and retail along Hay Street, Subiaco, as shown in Figure 9.6; over 6% of the frontages make use of the verge for al fresco activities.
Figure 9.6 Land Uses Hay Street, Subiaco
Subiaco, Hay Street (Thomas Street – Roberts Road) Non-food
RetailFoodretail
Al fresco dining
Bar and entertainment
Al fresco bar
Residential Office
101 7 13 3 1 7 86
The balance of retail and offices along Hay Street in Subiaco create a similar situation as in the CBD although there is more pronounced peak hour activity compared to all day activity. There is an existing demand for long-term off-street parking by employees who commute by private car and short-term on-street car parking to serve shoppers. Many businesses along Hay Street are associated with a large number of short employee and visitor trips per day.
The implications for current land uses in Hay Street, Subiaco of a light rail system will be the pressure placed on the vehicular activity stimulated by the office space. Light rail will provide opportunity for travel choice and a change in travel behaviour from car use to light rail patronage. An increase in pedestrian activity around the stops along Hay Street will be inevitable. It will be important to ensure that access to properties and off-street car parking is maintained, or alternative access arrangements are made. An adaptation in travel behaviour will be necessary for the employees and visitors of businesses along Hay Street and a change in retail focus may result.
Perth Light Rail Study T:\78105106 - Perth Light Rail\00\doc\reports\Final Report\Perth Light Rail Study Report_13Aug07_Final.doc Revision 0 13 August 2007 Page 74
Retail47%
Office40%
Residential3%
Food3%Food Al Fresco
6%Bar1%
Bar Al Fresco

The light rail route through the Subiaco Activity Centre is mostly retail along the ground floor as shown in Figure 9.7; 5% of the land use frontages utilise the verge space for al fresco activities.
Figure 9.7 Land Uses, Subiaco Activity Centre
Subiaco Activity Centre Rokeby Road (Hay Street – Thomas Street) Non-food
RetailFoodretail
Al fresco dining
Bar and entertainment
Al fresco bar
Residential Office
78 5 5 1 0 1 9
The dominant proportion of retail in the Subiaco Activity Centre stimulates a continuous stream of pedestrian activity throughout the day and during the weekends. These land uses suggest high levels of street use during each day with congested footpaths during peak periods. There is probably a high demand for 1-2 hour on-street car parking to facilitate short shopping trips.
The implications for current land uses in the Subiaco Activity Centre of a light rail system will be increased pedestrian activity. As with the CBD, it will be important to ensure that sufficient pedestrian circulation space is provided within the road reservation which not only complements existing activity levels but also allows room for growth.
There is more of a balance between office and retail along Hampden Road, on the Subiaco/Nedlands border, as shown in Figure 9.8; over 6% of the frontages make use of the verge for al fresco activities.
Perth Light Rail Study T:\78105106 - Perth Light Rail\00\doc\reports\Final Report\Perth Light Rail Study Report_13Aug07_Final.doc Revision 0 13 August 2007 Page 75
Bar1%
Food Al Fresco5%
Food5%
Residential1%
Office9%
Retail79%

Figure 9.8 Land Uses, Hampden Road
Hampden Road VillageNedlands / Subiaco (Monash Avenue – Stirling Highway) Non-food
RetailFoodretail
Al fresco dining
Bar and entertainment
Al fresco bar
Residential Office
18 9 3 0 0 7 17
The larger proportion of restaurants in the Hampden Road village area is likely to generate more vehicular activity at lunchtimes and evenings, accompanied by a reasonable amount of localised pedestrian activity. Throughout the day this location is popular with local students and other residents, most of who will most likely access the area on foot. These land uses therefore suggest reasonable levels of street use during each day with busier periods for vehicular activity around lunch and dinner when demand for car parking will be at its peak.
The implications for current land uses in Hampden Road of a light rail system will be maintaining a suitable level of car parking in the area and also maintaining a pleasant street environment for al fresco dining. It will be important to ensure that sufficient pedestrian circulation space is provided within the road reservation that complements the outdoor dining areas.
The light rail route through the Broadway neighbourhood shopping centre is mostly retail along the ground floor as shown in Figure 9.9 and there is a higher than average proportion of food retail,however none of the land use frontages utilise the verge space for al fresco activities.
Perth Light Rail Study T:\78105106 - Perth Light Rail\00\doc\reports\Final Report\Perth Light Rail Study Report_13Aug07_Final.doc Revision 0 13 August 2007 Page 76
Retail33%
Office31%
Food17%
Residential13%
Food Al Fresco6%

Figure 9.9 Land Uses, Broadway
Broadway Shopping Centre Nedlands (Stirling Highway – Princess Road) Non-food
RetailFoodretail
Al fresco dining
Bar and entertainment
Al fresco bar
Residential Office
21 10 0 0 0 3 10
The large proportion of retail in the Broadway neighbourhood shopping precinct stimulates a continuous stream of pedestrian activity throughout the day, although the location of a large supermarket probably creates peak traffic periods after work and on Saturdays. There are a reasonable number of restaurants which will generate more vehicular activity at lunchtimes and evenings, accompanied by a reasonable amount of localised pedestrian activity.
The implications for current land uses along Broadway of a light rail system will be vehicular activity in the AM and PM peak periods and on Saturdays, particularly at the intersection with Stirling Highway. It will be important to ensure that sufficient off-street car parking can be provided to support small local businesses during the period where the light rail is being constructed and is newly operational.
Summary The results for each area show already thriving areas adopting an al fresco dining and drinking environment where the street space allows. The light rail alignment can be designed to foster continued growth of al fresco within the Perth CBD, Subiaco Activity Centre and other smaller local centres. Additional verge width could also be provided for in new growth areas such as West Perth in anticipation of local business expansion and the redesign of Hay Street as part of the light rail project. Careful review of car parking requirements will need to be undertaken to avoid negative impacts on small local businesses, which should take account of the anticipated reduction in demand for car parking due to the proximity of the light rail.
9.1.3 Road Space Trade-Offs
The road reservation of the majority of the streets allocated for the light rail route are at best approximately 20 metres wide, building to building, sometimes narrowing to 16 metres at pinch-points. Within these road reservations there is a demand for a minimum of 6 metres of verge to accommodate pedestrian footpaths, landscaping, street furniture and underground utilities. The remaining 14 metres is then generally split into 4 lanes to provide for vehicular traffic travelling in 2 directions.
Perth Light Rail Study T:\78105106 - Perth Light Rail\00\doc\reports\Final Report\Perth Light Rail Study Report_13Aug07_Final.doc Revision 0 13 August 2007 Page 77
Retail47%
Food23%
Residential7%
Office23%

The manner in which the road space is allocated can differ depending on traffic flows and demand for alternative uses, such as in Hay Street where traffic flows in a single direction and the demand for pedestrian circulation space is higher than average.
The list in Table 9.1 represents the activities noted by the Steering Committee and Project Team as desirable within the road reserve, and an approximate width required for each singular entity.
Table 9.1 Desirable Road Reserve Activities and Required Space
Desirable Road Reserve Activities
Description Ave space required (m)
Traffic Lanes A two-way road requires at least one lane in each direction. Most roads are two-way. 6.4
Dedicated light rail lanes
The proposed light rail system requires 2 parallel tracks that do not share road space with other vehicles. 7.5
The Disability Discrimination Act (1992) requires access for all. The dimensions of a stop platform must allow for wheelchair access and circulation space. In most cases 2 platforms are required opposite one another to serve both directions of travel.
5.6
On Street car parking can be restricted to one side of the road as detailed here. 2.8
Easy access light rail stops
orOn Street Car Parking orService vehicle bays
Service vehicle bays can be restricted to one side of the road as detailed here. 2.8
Pedestrian circulation space
Minimum footpath width is 3 metres to accommodate pedestrian circulation, wheelchair users and the location of other street furniture and signage.
6
A minimum of 1.5 metres must be provided for café style al fresco dining. More space would be required to serve meals. This example restricted al fresco dining to one side of the road.
1.5 *
Trees generally require a minimum of 1.5 metres to allow for the canopy to not interfere with street level activities. Larger trees will require more room.
1.5 *
Al Fresco Dining SpaceandTrees
orStreet furniture
Additional street furniture such as benches require more room on the footpath 1 *
Minimum road width with dedicated light rail, street vitality & pedestrian access 28.5 m *additional to footpath
It can be seen that to accommodate every desirable use requires over and above what is available in Perth’s street network. Therefore in order to provide an attractive and functional environment, a system of trade-offs is required, where for example traffic speed and capacity might be reduced to enable the fast and reliable delivery of light rail services, or car parking might be reduced to provide easy access light rail stops and additional pedestrian circulation space. These are summarised in Table 9.2.
Perth Light Rail Study T:\78105106 - Perth Light Rail\00\doc\reports\Final Report\Perth Light Rail Study Report_13Aug07_Final.doc Revision 0 13 August 2007 Page 78

Table 9.2 Trade Offs
Desirable Road Reserve Activities Trade Off Traffic Lanes Reduced On Street Car Parking Removed from vibrant street sections Al Fresco Dining Space Maintained and enhanced Pedestrian circulation space Maintained and enhanced Trees Maintained or replanted Street furniture, awnings Amended to suit new environment Bus Stops Removed (buses rerouted) Service vehicle bays Retained where absolutely necessary Dedicated light rail lanes Provided in high traffic areas Easy access light rail stops Provided at every stop
Within the street environment there are only two constants; the building line and the position of the light rail tracks. The light rail tracks must remain as straight as possible along the alignment and therefore the rest of the road uses can be designed around the transit infrastructure. The width of the verge and position of the kerb are entirely flexible depending upon desired traffic volumes, pedestrian activity, land uses, variety of travel choices and desired shelter and landscaping. In some locations there may be localised factors that must be included as constants, such as historic structures, protected trees and sculptures.
9.2 Depot Location The location of at least one depot facility is an absolute requirement for the light rail system. Due to the centralised nature of the Perth route alignment there is limited land available for a large depot. Additionally, the facility needs to incorporate heavy engineering and maintenance as well as washing and housing of light rail vehicles. This type of use does not immediately fit within the existing and planned commercial and residential environment.
Therefore it is proposed that two depots would be created for the Perth light rail system. The provision of two depots splits the demand for land and also increases the probability of identifying a suitable site for the heavy maintenance facilities. The provision of two depots also creates potential to split the vehicle fleet overnight which will facilitate system operation at each end of the service schedule.
Perth Light Rail Study T:\78105106 - Perth Light Rail\00\doc\reports\Final Report\Perth Light Rail Study Report_13Aug07_Final.doc Revision 0 13 August 2007 Page 79

9.2.1 Claisebrook Depot
The primary depot (inclusive of the maintenance facility) is proposed to be located between Royal Street and Brown Street in the City of Perth, adjacent to Central TAFE and close to Claisebrook railway station, as shown in Figure 9.10.
Figure 9.10 Claisebrook Depot Site and Location
The site is owned by the City of Perth, and is currently used as a public car park. EPRA is interested in developing the site into a mixed use, higher density development. It would be necessary to incorporate a depot as part of an integrated development, screening the depot from neighbouring uses and integrate the whole development with the surrounding locality, thereby realising the full potential of the site and also enabling the operation of the initial part of the light rail network. This site could incorporate the operations room, or such a facility could be combined with existing PTA operations.
It is possible that the Claisebrook depot could be sufficient for the operation of the first stage of the Perth Light rail system (the alignment selected by this study) including overnight storage of all vehicles. However if the network is to expand into the future, another depot would be required in a more easily accessible location. If this preliminary depot site is to be considered in further detail it would be prudent to plan for the stabling of a larger fleet to support an expanded light rail system of the future.
Perth Light Rail Study T:\78105106 - Perth Light Rail\00\doc\reports\Final Report\Perth Light Rail Study Report_13Aug07_Final.doc Revision 0 13 August 2007 Page 80

9.2.2 Jolimont Depot
A secondary depot is proposed to be located in Jolimont between the Matthews Netball Centre and the Pat Goodridge Hockey Centre off Selby Street, as shown in Figure 9.11 and Figure 9.12.
Figure 9.11 Jolimont Depot Location
Figure 9.12 Jolimont Depot Site
The site is owned by the City of Cambridge and is currently used as a car park for the sporting facilities on the weekend and also as a weekday park n ride site. The area is flanked by residential properties and therefore would not be suitable for heavy maintenance activities.
It could be possible to incorporate a ground floor depot as part of an integrated transit development with buses and park n ride car parking, which would also accommodate the weekend parking demand. The new development would require multiple entry points off Selby Street for cars and buses, and a second storey facility for car parking and ancillary sporting facilities (changing rooms, toilets, administration, physiotherapist and entertainment space).
Perth Light Rail Study T:\78105106 - Perth Light Rail\00\doc\reports\Final Report\Perth Light Rail Study Report_13Aug07_Final.doc Revision 0 13 August 2007 Page 81

9.3 Transport Impact of Route Options The operation of the light rail and the effect on traffic of both infrastructure and traffic management changes was assessed by the use of network wide and discreet junction modelling.
No allowance has been made in the transport impact modelling for a potential reduction in traffic volumes as a result of a mode shift towards public transport or the redistribution of vehicle trips away from the light rail route. It is likely that mode shift and redistribution will occur in practise and therefore the resultant transport impact documented in the following section is assumed to be a conservative estimate.
The City of Perth’s existing SATURN model was utilised to assess the network wide implications of the Light Rail service, and further aaSIDRA analysis was carried out at certain isolated intersections to evaluate junction performance in areas not covered by the City of Perth’s model.
9.3.1 SATURN Modelling
The primary purpose of the SATURN modelling was to provide a comparison of existing network performance with operations following the infrastructure and traffic management changes resulting from the implementation of light rail services.
Modelling of the light rail scenario was carried out by the City of Perth’s SATURN modelling consultant. The present/base year model was utilised on the assumption that the network is currently saturated and therefore any future year scenarios would not show significant growth due to the network capacity restraint.
The SATURN modelling only considered the preferred option.
In order to assess the future impact, the current model was edited to reflect the network and operational changes in the following ways:
� Link capacity � Intersection capacity and operation � Traffic signal timings and phasing
Network changes were carried out for both the existing AM and PM peak models to provide comparative models for each peak period.
Link capacities were altered where necessary to reflect new road and intersection layouts required to simulate potential light rail operations. In all cases within the SATURN model area, it was assumed that the light rail would run on designated, segregated lanes / lines. Therefore the maximum number of traffic lanes that could be incorporated within the existing reserve, in concert with the segregated light rail route, was modelled. However, it should be noted that subsequent design work has identified areas where the modelled lane arrangements could not be accommodated within the road reserve. Results at these locations are discussed in Section 9.3.3. There are however some locations where more traffic lanes could be accommodated than have been modelled. It is expected that these potential lane configuration changes could have a significant impact on the outcome of the SATURN modelling.
Following the modification of lanes on certain links, intersection arrangements were altered to suit proposed lane configurations. Due to the constraints of the existing road reserve, some dedicated turning lanes were removed and traffic signal phasing altered to reflect this.
Perth Light Rail Study T:\78105106 - Perth Light Rail\00\doc\reports\Final Report\Perth Light Rail Study Report_13Aug07_Final.doc Revision 0 13 August 2007 Page 82

Existing cycle times were retained within the model to retain consistency with the current linked signal timings operating within the model area. To imitate the effect of the tram movements at each intersection, the length of tram phase was reduced to a proportion of the total cycle length (per cycle length), based on a phase time of 14 seconds for each tram. The light rail frequency within the network was assumed to be 5 minutes in each direction, therefore the equivalent lost time at each intersection was 14 seconds in every 150 seconds (based on the assumption that in an average 5 minute period, 2 trams will pass through the intersection, one in each direction). This approach is further explained in the Isolated Intersection Analysis below.
Traffic signal offsets were determined based on travel times along the light rail links to minimise the delays to light rail.
Following the completion of the network changes, results for link and intersection performance were output for both the existing and light rail scenarios in each peak period.
9.3.2 Isolated Intersection Analysis
As the existing City of Perth’s SATURN model does not cover the entire proposed light rail routes, additional isolated intersection analysis was carried out.
Intersection model, aaSIDRA 3.0 was utilised to carry out intersection analysis at a number of key locations to determine the impact of new layouts and signal phasing resultant from the introduction of light rail. Similarly to the SATURN analysis, the maximum achievable link capacity within the constraints of the existing road reserve was utilised.
Intersection analysis was carried out on the basis of comparison between optimised signal timings. This avoids any misleading results, should the present signals be running inappropriate timings.
In most cases, the light rail was assumed to be running in a segregated area, however the intersections that were investigated on Rokeby Road, assume that the light rail will run with traffic in a mixed environment. In these cases the light rail will be subject to the same delays as traffic, with operation only affected by changes to junction layout and not by the introduction of additional phases / lost time.
The tram phase in aaSIDRA was modelled by first finding the amount of traffic signal time required to allow the tram to pass safely through a junction. This was assumed to be 14 seconds every time a tram arrives (typically between 2.5 and 5 minutes) at a signalised junction. As aaSIDRA can only analyse traffic movements, "or phases", which appear every cycle of the traffic signals (typically 120 -180 seconds), the equivalent time required in one traffic signal cycle is 14 seconds multiplied by the ratio of traffic signal cycle length over the tram frequency.
As optimised signal timings were used for comparison, the use of a fixed lost time phase as utilised in the SATURN modelling was not appropriate. Therefore the isolated intersection comparison assumes that a minimum of one full light rail stage would appear in each cycle, even if that cycle was less than the 150 second frequency. The exception occurs at the Rokeby Road / Hay Street intersection, where two light rail lines meet. The frequency of the Jolimont route was assumed to be half that of the frequency on Rokeby Road. For the purposes of intersection analysis, it was assumed that one light rail phase would be called for the north-south route every cycle and the demand for the east west route would be once every other cycle. Therefore within the intersection analysis one light rail stage appears for 14 seconds each cycle with an additional light rail phase of only 7 seconds appearing in each cycle. This shorter light rail phase based on a 10 minute frequency was employed at the Rokeby Road / Roberts Road intersection.
Perth Light Rail Study T:\78105106 - Perth Light Rail\00\doc\reports\Final Report\Perth Light Rail Study Report_13Aug07_Final.doc Revision 0 13 August 2007 Page 83

9.3.3 SATURN Modelling Results
In general the results of the SATURN Modelling show no fatal flaws along the proposed light rail route, although some intersections may be subject to long delays. The following provides a brief discussion of the outcomes at key intersections:
� Hay Street / Plain Street; the results of the SATURN modelling indicated that long delays would be experienced on Hay Street, especially in the PM peak period. The majority of this delay was likely to be the result of the loss of traffic lanes at the intersection. However, there may be some scope to improve performance through alterations to signal timings. A further option would be to provide shared use of traffic and light rail lanes on the approaching links. However this would mean that light rail will be subject to the same delays as traffic.
� Hay Street / Bennett Street; similarly to the previous intersection, the loss of traffic lanes is likely to cause long delays to vehicles. Shared use could be considered if delays to traffic were to be minimised.
� Hay Street / Irwin Street; this intersection was modelled as two-way on Hay Street west of the intersection with a single eastbound lane replacing the current two lanes. As a result eastbound demand at the junction was in excess of the available capacity. Subsequent to the modelling, investigations into junction design identified issues with the provision of the westbound traffic lanes on Hay Street west. Due to the road reserve constraints and junction arrangement, a concept that removed westbound traffic between Hay Street and Barrack Street was examined, with buses still accommodated sharing with light rail. As the removal of the westbound traffic lanes would allow the two eastbound lanes to be retained this will provide similar capacity to the existing situation, therefore eastbound traffic should be accommodated adequately. However, the closure of Hay Street to westbound traffic would cause some redistribution of traffic on local road links.
� Barrack Street / Murray Street; as modelled, some of the movements at this location were operating very close to capacity and displayed associated delays. Initially only a single traffic lane in Murray Street had been incorporated, subsequent investigations showed that two traffic lanes could be provided, increasing the intersection capacity. Additionally there was also some scope to adjust signal timings and further increase the capacity.
� Murray Street / Havelock Street and Hay Street / Havelock Street; the proposed light rail service would run segregated through these junctions. Initial modelling showed that the intersections were over capacity and was subsequently modelled as per existing layouts. The removal of lanes on the road links and right turn lanes at the stop lines could cause problems for the intersection operation even when redistribution of traffic was taken into account. If light rail services were to remain segregated in this area, consideration would have to be given to the banning of right turns from Havelock Street at the intersections. Alternatively, light rail could run in mixed traffic through these junctions, but are likely to be subject to delays. However, it should be noted that the Murray Street and Hay Street approaches at each intersection would suffer delays. At the Murray Street intersection, the base PM model showed that the demand for this link was in excess of the available capacity. In general, the most serious cause for delay was the reduction in capacity due to the introduction of light rail phases to the existing signal staging.
� Hay Street / Thomas Street; The SATURN modelling indicated that this intersection could still operate satisfactorily during the AM peak period, however during the PM peak additional delay would be experienced.
Long delays may be experienced on the Hay Street East approach as initial modelling suggested that demand at Hay Street would exceed available capacity.
Perth Light Rail Study T:\78105106 - Perth Light Rail\00\doc\reports\Final Report\Perth Light Rail Study Report_13Aug07_Final.doc Revision 0 13 August 2007 Page 84

Queues are likely to build on this approach throughout the peak period. This was due to the removal of a through lane for traffic, and also as a result of the light rail phase at the signals.
� Claisebrook Link; at the time when SATURN modelling was carried out, the proposed route along Hill Street was removed from the highway between Wellington Street and Wittenoom Street. Subsequently, this was no longer a feasible option with the light rail located within Hill Street resulting in a delay in the number of traffic lanes available to general traffic. Intersection and link arrangements on Hill Street between Hay Street and Wellington Street were maintained as previously modelled, however, arrangements at Wellington Street and Wittenoom Street would reflect the requirement to retain the light rail route with traffic. Although this would mean a reduction of lanes for northbound traffic on Hill Street, the output from the SATURN model suggested that significant capacity remains along this link. In addition, the major movement along Wellington Street would not be subject to any loss in capacity as a result of these changes. Similarly at Wittenoom Street, the SATURN output indicated that significant capacity remained at this location.
In general, the remainder of those intersections not detailed above should operate without significant increases in existing delay. Table 9.3 shows a comparison of overall intersection performance for all the intersections on the light rail route within the City of Perth model, for the existing situation and following the implementation of light rail.
Table 9.3 Comparison of overall Intersection Performance
V/C %Average
Delay (Secs)
LOS V/C %Average
Delay (Secs)
LOS V/C %Average
Delay (Secs)
LOS V/C %Average
Delay (Secs)
LOS
- - - 31 16 B - - - 27 15 B
43 20 B 69 49 D 53 21 C 66 50 D
50 32 C 81 39 D 44 34 C 85 42 D
34 16 B 54 24 C 29 18 B 51 24 C
40 25 C 47 27 C 43 27 C 55 26 C
32 21 C 63 27 C 55 27 C 85 39 D16 48 D 23 28 C 17 36 D 22 28 C
37 21 C 49 17 B 46 10 A 55 17 B
42 41 D 49 39 D 44 40 D 61 50 D
57 21 C 70 27 C 42 24 C 51 26 C
36 27 C 49 22 C 34 23 C 44 22 C
22 24 C 63 25 C 27 17 B 32 24 C24 23 C 35 21 C 32 15 B 59 26 C
23 25 C 32 27 C 42 58 E 50 83 F
49 32 C 73 33 C 37 29 C 27 24 C
39 27 C 32 34 C 29 16 B 30 35 C
63 27 C 73 33 C 62 38 D 71 49 D
31 12 B 32 24 C 20 22 C 27 28 C41 24 C 45 28 C 33 23 C 35 28 C
Hill Street / Wittenoom Street 31 22 C 30 23 C 16 30 C 16 39 D
Hay Street / Colin Street
Hay Street / Thomas Street
Hill Street / Goderich StreetHill Street / Wellington Street
Murray Street / Elder StreetMurray Street / George Street
Murray Street / Havelock Street
Hay Street / Havelock Street
Barrack Street / Murray Street
William Street / Murray Street
Murray Street / Milligan Street
Hay Street / Victoria Avenue
Hay Street / Irwin StreetHay Street / Pier Street
Hay Street / Barrack Street
Intersection
Existing AM AM with Light Rail Existing PM PM with Light Rail
Hay Street / Plain Street
Trinity Avenue / Hay Street
Hay Street / Bennett Street
Hay Street / Hill Street
Full SATURN modelling results are included at Appendix A.
9.3.4 Isolated Intersection Analysis Results
As previously discussed aaSIDRA analysis was carried out at key intersections along the route, in areas not covered by the SATURN model. Initially, the junction of Stirling Highway with Broadway and Hampden Road was investigated using SATURN as a stand alone intersection. However, to retain consistency this location was re-examined as an isolated intersection using aaSIDRA.
Perth Light Rail Study T:\78105106 - Perth Light Rail\00\doc\reports\Final Report\Perth Light Rail Study Report_13Aug07_Final.doc Revision 0 13 August 2007 Page 85

Below is a brief discussion of the results of the analysis at each of the isolated intersections examined:
� Hay Street / Rokeby Road; Analysis of this intersection was based on preferred Route Option A, with both light rail routes crossing at this junction. As mentioned previously the light rail movements were modelled on the basis of lost time per cycle with the light rail phases appearing every cycle for north-south routes and every other cycle for east-west movements. As the optimised cycle time at this location is less than the frequency of light rail services, the modelled lost time was in fact greater than that likely to be experienced. Even given the over estimation of the light rail impact, the intersection shows only a slight deterioration in service.
� Hay Street / Railway Road / Roberts Road; similar to the previous intersection, the operation of this junction was not seriously effected by the introduction of light rail. This was primarily due to the fact that the light rail route could be incorporated at the intersection with no loss in lane capacity for vehicles. Although some deterioration of service could be expected as a result of the introduction of the light rail phase, there are only small increases in delay even in the busier PM peak period.
� Rokeby Road / Bagot Road; In this area the light rail would run in a mixed traffic environment on Rokeby Road, therefore for comparison, no additional light rail phase was incorporated. The reduction in capacity was as a result of changes to lane configuration on Rokeby Road. The present arrangement which allows through traffic to utilise two lanes which merge downstream of the junction was amended to only allow through traffic to utilise the outside lane. This was to prevent potential conflict between cars and light rail, during merging. Operation was not only effected by the lack of capacity at the stop line, but also by right turning traffic blocking through vehicles. However, despite this, aaSIDRA analysis indicated that an acceptable level of service could be maintained, albeit with significantly increased cycle times. The removal of some on-street parking around the junction could be considered and the existing lane arrangements retained, resulting in no deterioration in level of service, but this would need to be examined in more detail with due regard to road safety considerations. The analysis at this location showed that in order to maximise capacity, the existing cycle time for these signals will need to be increased, most significantly in the PM peak when demand is greatest. However, it should be noted that aaSIDRA analysis does not take into account redistribution of traffic as a result of delays at intersections; therefore there may be the scope for traffic to find alternative routes which was not considered in this assessment.
� Rokeby Road / Nicholson Road; As with the junction of Rokeby Road with Bagot Road, the lane arrangements on the Rokeby Road approaches had been altered to minimise conflicts between cars and light rail. Due to the fact that demand at this location was lower than at Bagot Road, the intersection could continue to operate effectively following the introduction of light rail.
� Stirling Highway / Broadway / Hampden Road; Initial SATURN analysis at this location was subsequently superseded by aaSIDRA isolated intersection analysis. The use of aaSIDRA allows the existing junction to be more accurately modelled, particularly in respect to short lanes. Examination of the results for the existing peak period operations identified problems with the present junction operation, especially in respect to the Broadway approach. During the PM peak, the junction results show an overall degree of saturation in excess of 90 percent for all approaches with an average for the intersection approaching 96 percent. By effecting changes to allow segregation of light rail and traffic at the stop lines and hence introduce priority for light rail at the intersection, the available capacity was exceeded and very long delays could be expected especially on the Hampden and Broadway links. Due to the queuing on Broadway and Hampden Road, the intersection analysis suggested that delays would increase if priority for light rail was implemented at the signals. In order to operate priority at this location, significant traffic would need to be redistributed away from the Broadway / Hampden Road intersection.
Perth Light Rail Study T:\78105106 - Perth Light Rail\00\doc\reports\Final Report\Perth Light Rail Study Report_13Aug07_Final.doc Revision 0 13 August 2007 Page 86

As the major movement from Broadway is the right turn into Stirling Highway, the introduction of traffic signals at Bruce Street could potentially relieve some of this right turn demand and provide improvement in the operation of the entire intersection. Unfortunately, the likely reassignment of traffic could not be quantified without further detailed sub-area investigation.
Table 9.4 shows the comparative results at each of the previously discussed intersections:
Table 9.4 Isolated Intersection Analysis Results
V/CAverage
Delay (Secs)
LOS V/CAverage
Delay (Secs)
LOS V/CAverage
Delay (Secs)
LOS V/CAverage
Delay (Secs)
LOS
Hay St / Railway Rd / Roberts Rd 0.68 21.8 C 0.71 24.6 C 0.825 34 C 0.84 41.1 D
Hay St / Rokeby Road 0.64 24.9 C 0.73 38.5 D 0.704 21.2 C 0.79 36.0 D
Rokeby Road / Bagot Road 0.81 37.2 D 0.81 37..8 D 0.968 59.9 E 0.97 63.8 E
Rokeby Road / Nicholson Road 0.67 12.2 B 0.68 15.5 B 0.75 13.1 B 0.81 15.3 B
Stirling Highway / Broadway / Hampden Road 0.89 50.6 E 1.14 138.3 F 0.96 68.7 E 1.24 244.4 F
Intersection
Existing AM AM with Light Rail Existing PM PM with Light Rail
Full aaSIDRA intersection analysis results are included in Appendix A.
9.3.5 Concluding Remarks
The transport modelling output of SATURN and aaSIDRA is conservative as no allowance has been made for a potential proportional reduction in traffic volumes, which could occur as a result of a mode shift towards public transport or the redistribution of vehicle trips away from the light rail route. It is possible that certain intersections may be less congested than projected.
In general the results of the SATURN Modelling show no fatal flaws along the proposed light rail route, although some intersections may be subject to long delays. Results from the assessment of isolated intersections conclude that some increased congestion will occur at particularly the intersections of Rokeby Road / Bagot Road and Stirling Highway / Broadway / Hampden Road. A possible way to deal with the anticipated negative impacts that could result from the implementation of a light rail route would be to consider the reintroduction of two-way traffic along a number of current one-way roads such as William Street and Barrack Street in a north-south axis and Murray Street and Roberts Road in an east-west axis. The traffic management system employed on these roads will directly influence the projected impact of the light rail route upon traffic along Hay Street and Murray Street through West Perth and especially Subiaco.
A more accurate assessment of transport impacts could only be quantified through detailed sub-area analysis using a micro-simulation model that fully comprehends the entire study area, thereby providing a more accurate assessment of the likely redistribution of traffic away from the light rail route and to quantify a potential mode shift towards public transport. The potential impact on projected traffic volumes as a result of rapid development in and adjacent to the light rail corridor is difficult to assess without access to a detailed development plan for the areas under consideration. As such the traffic growth rate to be applied in the study area should be carefully assessed when more detailed micro-simulation modelling is undertaken.
Perth Light Rail Study T:\78105106 - Perth Light Rail\00\doc\reports\Final Report\Perth Light Rail Study Report_13Aug07_Final.doc Revision 0 13 August 2007 Page 87

10.0 Service Capacity This section presents the methodology used to examine the anticipated demand for light rail services along the preferred alignment. The results of the calculation are also presented, and give an indication of the average daily use of the whole system.
10.1 Estimated Patronage Demand It is expected that the light rail system would be used by:
� People living and/or working within reasonable walking distance from a light rail stop. � People who currently use the Red CAT.
Specific large proportions of people are expected to use the system to and from UWA, QEIIMC and within Perth CBD particularly during the AM, lunch and PM peak periods.
10.1.1 Use by Residents
This is calculated based on the following information:
� A reasonable walk distance is assumed to be 500m. � The population of the 500m catchment can be garnered from the ABS Census 2001 data7, using
Census Collection District zones, the smallest data collection zone available.
Figure 10.1 Walk Catchment
7 ABS data from the 2001 census was available at the time of analysis and reporting. Future patronage calculations undertaken (as recommended in “Way Forward”) should utilise data from the 2006 census.
Perth Light Rail Study T:\78105106 - Perth Light Rail\00\doc\reports\Final Report\Perth Light Rail Study Report_13Aug07_Final.doc Revision 0 13 August 2007 Page 88

� The ABS Estimated Stocks of Dwellings WA (1996) indicates that the average household size in Nedlands/Subiaco/Perth is between 1.9 and 2.1 persons per dwelling.
� Adopted trip generation assumptions for households (STEM, DPI) conclude that each household generates up to 8.5 trips per day.
Using this data we can calculate approximately how many dwellings exist within the 500m catchment.
Therefore the total number of household trips made by local residents on an average weekday is the total number of dwellings within the 500m catchment multiplied by 8.5.
Population growth forecasts can be taken from WA Tomorrow (WAPC, 2005) to estimate an increase in trips into the future.
A mode share for public transport can be extracted from Strategic Transport Evaluation Model (STEM), demonstrating the proportion of trips undertaken by public transport destined either for Perth CBD, or elsewhere within the inner suburbs. This proportion can be related to the total number of trips per household, thereby providing an approximate number of daily trips undertaken by public transport. Use made of the light rail system will form a proportion of these public transport trips.
The data utilised to calculate residential patronage is detailed in Table 10.1. The 25% mode share for public transport is an assumption for future public transport use in the study area based on existing mode share and predicted future increase in trips. The 15% mode share for light rail is taken as a direct 60% proportion of all public transport trips in the study area.
Table 10.1 Residential Demographics and Mode Share
Demographics and Mode Share 2007 2012Under 15 years old 2,449 3,184Working Age 9,897 10,472Over 65 2,276 2,672Grand Total 14,622 16,328Dwellings at 2 people/dwelling 7,311 8,164Trips at 10 trips per Household 62,144 69,395Public transport trips at 25% mode share 15,536 17,349Light rail trips at 15% mode share 9,322 10,409
10.1.2 Use by Employees
This is calculated based on the following information:
� A reasonable walk distance is assumed to be 500m. � The working population of the 500m catchment are can be garnered from STEM (DPI) data;
STEM zones are based on CCD zones and therefore the data is comparable. � A trip attraction rate (number of trips made by employees) can be retrieved from STEM and
attributed to each CCD zone. When the trip attraction rate is doubled, the resulting figure is a trip generation rate per person per day to and from the workplace. Nominally this rate will be less than 2 trips per day; this takes into account the proportion of employees sick or on holiday on an average day. The adopted average trip attraction rate for the study area is 0.7 trips per employee which makes a total of 1.4 trips per person per day to and from the workplace.
This data provides a reasonable robust understanding of how many trips are made by employees on an average weekday.
Perth Light Rail Study T:\78105106 - Perth Light Rail\00\doc\reports\Final Report\Perth Light Rail Study Report_13Aug07_Final.doc Revision 0 13 August 2007 Page 89

Employment population growth forecasts have been reviewed from Metropolitan Land Use Forecasting System 1991-2026 (Ministry for Planning, 1995). There is very little variation predicted in this document regarding the general rate of employment in Perth, Subiaco or Nedlands local government areas. However, it is probably that more recent information on employment levels may suggest that these projections are overly conservative.
The same mode share can be used for employees using public transport as has been used for residents. Use made of the light rail system will form a proportion of these public transport trips.
The data utilised to calculate employment patronage is detailed in Table 10.2.
Table 10.2 Employee Demographics and Mode Share
Demographics and Mode Share 2001 2007 2012 Part time employees 21,132 19,308 18,511 Full time employees 75,532 67,703 64,311 Grand Total 96,664 87,011 82,822 Trip rate 0.7 (1.4 return) 135,329 121,815 115,951 Public transport trips at 25% mode share 33,832 30,454 28,988 Light rail trips at 15% mode share 20,299 18,272 17,393
10.2 Specific Institutional Demand A calculation of local employees and future local employees at a generic level is useful as a base. However, it is worthwhile bolstering this information with known increases in trip generation caused by large staffed facilities. In this case, we are aware of:
� An increase in student and staff numbers at the UWA Nedlands/Crawley Campus. � An increase in employment at the QEIIMC. � Hollywood Private Hospital is also expanding although to a lesser degree that will most likely
have a minimal impact on public transport patronage.
10.2.1 University of Western Australia – Nedlands/Crawley Campus
Future student and staff numbers can be calculated based on data provided by UWA. Table 10.3 presents the assumed growth rate in student and staff numbers in 2012, 2016 and 2020. There are in fact over 17,000 students enrolled at UWA in 2007, however the “Equivalent Fulltime” figure has been provided by UWA to estimate daily patronage.
Table 10.3 UWA Student and Staff Numbers
2007 Annual increase
2012 2016 2020
Equivalent Fulltime Students 14,500 3.5% 17,221 19,762 22,677 Staff 3,000 3.5%* 3,563 4,089 4,692
*assumed
STEM provides a trip attraction rate for UWA at 0.6/person/day, which works out as a trip generation rate of 1.2 trips per person per day. The total number of trips can be calculated by multiplying the number of students and staff by this trip rate, as shown in Table 10.4 for 2012, 2016 and 2020.
Perth Light Rail Study T:\78105106 - Perth Light Rail\00\doc\reports\Final Report\Perth Light Rail Study Report_13Aug07_Final.doc Revision 0 13 August 2007 Page 90

Table 10.4 UWA Trips
Total Students Trips at rate 0.6/1.2 (return) 2012Students 17,641 21,170 Staff 3,650 4,380 Total 21,291 25,550 2016Students 19,762 23,714 Staff 4,089 4,906 Total 23,851 28,621 2020Students 22,677 27,213 Staff 4,692 5,630 Total 27,36 32,843
There is a cap placed on the future availability of car parking for both students and staff. The total number of trips undertaken by car can be calculated, based on an average car occupancy rate of 1.2 persons per car. The remaining trips must therefore be undertaken by public transport or by a non-motorised form of transport, as shown in Table 10.5. The alternative is that a strict car sharing program be introduced to increase the car occupancy rate.
Table 10.5 UWA Mode Splits
Total car parkingspaces
Car mode share at 1.2 occupancy
Publictransport and
Non-Motorised
share
Non-Motorised
modeshare
Publictransport
mode share
Light Rail modeshare
2012Students 2750 19% 81% 12% 69% 35%Staff 1500 49% 51% 12% 39% 19%Total 4250 24% 76% 12% 64% 32%2016Students 2750 17% 83% 12% 71% 36%Staff 1500 44% 56% 12% 44% 22%Total 4250 21% 79% 12% 67% 33%2020Students 2750 15% 85% 12% 73% 37%Staff 1500 38% 62% 12% 50% 25%Total 4250 19% 81% 12% 69% 35%
The number of people able to access the site by walking or cycling is unlikely to increase unless additional student accommodation is constructed on the campus. Therefore the majority of these trips will need to be undertaken by public transport. Approximately 76 percent of all predicted daily trips to and from UWA in 2012 will need to be accommodated through public transport modes, non-motorised modes and/or car pooling arrangements. Use made of the light rail system will form a significant proportion of the public transport trips. Table 10.6 details the daily light rail patronage associated with UWA students and staff trips.
Perth Light Rail Study T:\78105106 - Perth Light Rail\00\doc\reports\Final Report\Perth Light Rail Study Report_13Aug07_Final.doc Revision 0 13 August 2007 Page 91

Table 10.6 UWA Daily Light Rail Patronage
Public Transport Daily Patronage
Light Rail Daily Patronage
2012Students 14,669 7,335 Staff 1,694 847 Total 16,363 8,182 2016Students 16,909 8,454 Staff 2,158 1,079 Total 19,067 9,533 2020Students 19,987 9,994 Staff 2,795 1,397 Total 22,782 11,391
10.2.2 Queen Elizabeth II Medical Precinct
Future staff, visitor and patient numbers are based on data provided by DPI, detailed in Table 10.7.
Table 10.7 Predicted Staff, Visitor and Patient Numbers
Additional Existing Stage 1 2012 Stage 2 2016 Stage 3 2020 TOTAL 2020
Staff Approximate additional staff Staff5,600 1,116 2,046 2,418 11,180
Beds Additional Beds Beds600 120 220 260 1,200
Visitors/Patients Approximate additional visitors/patients Visitors/Patients2,100 420 770 910 4,200
STEM provides a trip attraction rate for QEIIMC at 0.8 trips per person per day, which can be doubled to find the daily trip generation rate per person, (1.6 trips per person per day). The total number of trips can be calculated by multiplying the number of staff, visitors and patients by this trip rate. QEIIMC also has a cap on the future availability of car parking.
The following two tables show two estimates of the number of people using the light rail per day; a conservative estimate and a realistic estimate. The calculation is based on the supply of car parking available, STEM trip generation data, and car occupancy assumptions. A worst case scenario of 2 staff shifts (day and night) has been assumed. The results for both scenarios suggest that 100 percent of visitors and patients will be able to arrive to the site by car (assuming that the expected number of visitors and patients arrive at a reasonably steady rate throughout the day and do not all arrive at once – 81 percent of total daily visitors/patients can be accommodated if the daily quota arrives all at once); there may still be a proportion of visitors who arrive by light rail but this is expected to be minimal.
The key difference between the conservative and realistic estimates is the parking supply; the conservative estimate assumes maximum usage of the car parking supply, whereas the realistic estimate assumes car parking bays are assigned to particular shifts, where 70 percent of the total bays are available for the day shift, and 30 percent reserved for night shift arrivals prior to day shift departures.
Perth Light Rail Study T:\78105106 - Perth Light Rail\00\doc\reports\Final Report\Perth Light Rail Study Report_13Aug07_Final.doc Revision 0 13 August 2007 Page 92

Table 10.8 QEIIMC Conservative Patronage Estimate
CONSERVATIVE ESTIMATE - ASSUMES MAXIMUM USAGE OF CAR PARKING SUPPLY BASED ON STAFF DAY AND EVENING SHIFT + PEOPLE PER CAR TRIPS
People Trips8
CarParkingSpaces
Peopleby Car9
Shift Trips by car10 Car
MSPT and NM MS
NMMS
PTMS
LRTMS
Staff – Day (70%) 7,826 12,522 4,400 5,280 8,448 67% 33% 12% 20.5% 10.3%Staff –Night(30%) 3,600 5,760 4,400 5,280 8,448 100% 0% 0% 0% -Patients / Visitors 4,200 8,400.0 1,700 3,400 3,264 39%
Table 10.9 QEIIMC Realistic Patronage Estimate
REALISTIC ESTIMATE - ASSUMES ASSIGNED CAR PARKING SPACES 70/30 SHIFT SPLIT USAGE OF CAR PARKING SUPPLY
BASED ON STAFF DAY AND EVENING SHIFT + PEOPLE PER CAR TRIPS
People Trips
CarParkingSpaces
Peopleby Car
Shift Trips by car
CarMS
PT and NM MS
NMMS
PTMS
LRTMS
Day 7,826 12,522 3,080 3,696 5,914 47% 53% 12% 41% 20%
Night 3,600 5,760 1,320 1,584 2,534 44% 56% 12% 44% 22%Patients / Visitors 4,200 8,400 1,700 3,400 n/a 100% min min min min
Approximately 55% of staff daily trips predicted for 2020 will need to be accommodated by public transport modes, non-motorised modes and/or car pooling arrangements. Use made of the light rail system will form a significant proportion of the public transport trips.
Table 10.10 presents a comparison between the estimates. The “realistic” estimate produces a result which would appear to be the more likely of the two outcomes on the basis of the level of information currently available on the QEIIMC project. The output from the second estimate has been used in the final patronage estimate.
Table 10.10 QEIIMC Patronage Comparison Summary Table
Public Transport Trips DAY
Public Transport Trips NIGHT
LRT Daily Trips DAY
LRT Daily Trips NIGHT Total LRT Trips
CONSERVATIVE 2,571 0 1,286 0 1,286
REALISTIC 5,105 2,534 2,553 1,267 3,820
8 allowing for sick/ holiday9 car occupancy rate 1.2 for staff and 2 for visitors and patients (vehicle trip generation rate per car = 1.92)10 car occupancy rate multiplied by trip generation rate
PT = Public Transport
NM = Non-Motorised
LRT = Light Rail
MS = Mode Share
Perth Light Rail Study T:\78105106 - Perth Light Rail\00\doc\reports\Final Report\Perth Light Rail Study Report_13Aug07_Final.doc Revision 0 13 August 2007 Page 93

10.2.3 Existing CAT system
The Red CAT would essentially be replaced by the Light Rail route and therefore it is assumed that the daily passenger trips would transfer directly to the light rail system. This would take into account a large proportion of trips undertaken between origins and destinations that are both within the 500m catchment area, particularly trips taken at lunch time. The lunch time period represents one of the three major periods of activity for the Red CAT on an average weekday. Table 10.11 details the average number of people recorded travelling on the Red CAT system during lunch hour (per day) during 2004. These figures have been extrapolated for 2012 based on two different growth assumptions, both of which are detailed in Perth’s CAT and FTZ Patronage Levels (DPI).
Table 10.11 Red CAT Patronage, 2004 and 2012
Red CAT 2004 2012(14%)
2012(36%)
Daily (weekly average) based on 25% growth each 4 years* 14,525 18,156 22,695Lunch peak (weekly average) based on 25% growth each 4 years * 3,705 4,631 5,789
* Source: Perth’s CAT and FTZ patronage levels (DPI Document)
10.2.4 Patronage Estimate
The total daily weekday patronage on the light rail system can be estimated as the sum of the residential and employee use, plus the QEIIMC/UWA specific growth and the lunch peak Red CAT patronage, as detailed in Table 10.12.
Table 10.12 Patronage Estimate
Time of Day
Patronage
Peak(40% of Daily)
Off peak (60% of Daily) Daily
Residential 4,164 6,246 10,409
Employees 6,957 10,436 17,393
QEIIMC 1,528 2,292 3,820
UWA 3,273 4,909 8,182CAT (lunch) n/a n/a 5,789
Grand Total 15,921 23,882 45,593
Perth Light Rail Study T:\78105106 - Perth Light Rail\00\doc\reports\Final Report\Perth Light Rail Study Report_13Aug07_Final.doc Revision 0 13 August 2007 Page 94

11.0 Concept Design and Engineering Assessment This section describes the treatment that will be required to incorporate the light rail infrastructure into the existing road reservation and street environment, whilst maintaining pedestrian amenity and accessibility, and providing for adequate vehicle mobility.
The variety of light rail stop designs appropriate for the alignment and the reasoning behind the stop design criteria are included in the discussion. Snapshots of the concept design are provided at key locations where dimensions, rail placement and lane configurations are both typical and atypical.
11.1 Street Environment Criteria The design of the route has trade-off implications for efficient light rail operations and ease of traffic circulation. Five criteria developed by the project team and agreed with DPI guide the treatment of the light rail corridor and the management of traffic volumes that underpin the design of the street environment. These criteria represent a sensible, safe and realistic response to the study brief:
1) To ensure the safe and timely operation of light rail vehicles within a confined road reservation – The light rail system must receive as high a proportion of priority running as possible along the
length of the alignment, particularly in the central sections, and always at signalised intersections. This must primarily be in the form of dedicated carriageway space within the road reservation and supported by priority at traffic signals by way of predictive traffic loops
2) Local traffic circulation patterns must be maintained, but not at the expense of light rail operations, pedestrian amenity or good urban design – Allow for the greatest amount of pedestrian circulation space within the road reservation – Permit the retention or relocation of trees – Permit the use of the footpath / verge for al fresco dining – Permit the retention of some on-street parking – Maintain Hay Street in the City of Subiaco as a through route – Maintain Murray Street in the City of Perth as a through route – Maintain good access to the Mitchell Freeway
3) Vehicular access points to properties must be maintained 4) On-street service bays and emergency access points must be accommodated 5) Major roads to retain their capacity requirements
11.2 Streetscape and Stop Design 11.2.1 Streetscape Design
The route alignment has been divided into a series of sections each of which has a customised cross section design. These designs outline the position of the light rail tracks in the road reservation and the location and width of the footpaths and vehicle carriageways. These designs are a demonstration of how the physical and social requirements of the streetscape can potentially be feasibly incorporated into each section of the light rail alignment; however they do not represent a preferred or final design outcome. Further detailed consultation will be required with local authorities and urban design specialists before a final design is agreed.
In this section there are eight cross section design examples. Table 11.1 provides details on where a dedicated corridor has been provided and what level of provision has been made for general traffic.
Perth Light Rail Study T:\78105106 - Perth Light Rail\00\doc\reports\Final Report\Perth Light Rail Study Report_13Aug07_Final.doc Revision 0 13 August 2007 Page 95

Table 11.1 Cross Sections
Cross Section Light Rail Priority Position of Light Rail Traffic Flow 1 Shared with pedestrians Transit Mall None 2 Shared with traffic Central Two-way 3 Shared with traffic Central Two-way with median 4 Dedicated corridor Segregated in existing
median, 40 metre reserve Two-way
5 Dedicated corridor Segregated alongside median
Two-way
6 Dedicated corridor Segregated no median One-way, single lane WB 7 Dedicated corridor Segregated no median One-way, single lane EB 8 Dedicated corridor Segregated no median, 20
metre reserve Two-way
These designs have been applied to the alignment length as shown in Figure 11.1.
Figure 11.1 Cross Section Design along Alignment Length
The use of the verges throughout most of the alignment length can be flexible to suit the requirements of each responsible authority.
A variety of surfaces can be used around the light rail track to differentiate it from the rest of the carriageway, or to use it as an opportunity to break up the impact of a wide road:
� Concrete or asphalt, with or without colouring – great for higher speed locations, and colours great for mixed traffic environments
� Paving – good for pedestrian friendly areas and lower speeds
21
3 4
5 6
87
Perth Light Rail Study T:\78105106 - Perth Light Rail\00\doc\reports\Final Report\Perth Light Rail Study Report_13Aug07_Final.doc Revision 0 13 August 2007 Page 96

� Low-growing vegetation (native grass or other drought-hardy, low-maintenance vegetation) – ideal in medians and alongside parks
Native grasses require less water than exotic species and require mowing only 2-3 times per year. There is also a selection of non-grass, drought-tolerant ground cover plants that have been specifically bred to thrive under hot and sunny conditions. Such plants would not require mowing and would need limited other maintenance.
Main Roads WA standard treatments will be used when designing vehicular and pedestrian access across the light rail tracks. The light rail tracks will be lowered to carriageway height to provide an at-grade environment for vehicles accessing and egressing particular side streets, and at pedestrian crossings. Additional pedestrian crossings will be provided at light rail stops which will ensure the safety of light rail patrons and can also benefit motorists attempting to turn into or out of the road. Light rail vehicles will be limited by the assigned road speed limits.
11.2.2 Stop Design
A variety of light rail stops have been designed to suit the various environments created by the 8 cross sections. There are design criteria regarding the dimensions and placement of each stop, most of which has been based on Maunsell guidelines provided to the Department of Infrastructure (Victoria)“Design Requirements for Accessible Tram Stops” (July, 2006). These guidelines comply fully with the Disability Discrimination Act 1992, the Disability Standards for Accessible Public Transport (2002), and the relevant Australian Standards. Each stop allows for sufficient room for wheelchairs to manoeuvre and provides ramped access to the stop from the kerb. Three stop types have been designed:
1) Central Platforms There are three variations of this scenario:
A) One platform provided in a median between the light rail tracks, providing a stop for each direction. The track alignment remains straight. B) Two platforms provided in a median between the light rail tracks, providing a stop for each direction. The track alignment remains straight. C) Two platforms are provided on the outside of the light rail tracks. The track alignment remains straight.
In all three situations, access between the kerb and the platform requires pedestrians to cross the traffic lanes and also the light rail tracks if crossing to the opposing kerb. One set of pedestrian crossing signals will be provided for each stop to create a safe and controlled crossing environment.
Figure 11.2 Central Platform A
Perth Light Rail Study T:\78105106 - Perth Light Rail\00\doc\reports\Final Report\Perth Light Rail Study Report_13Aug07_Final.doc Revision 0 13 August 2007 Page 97

Figure 11.3 Central Platform B
Figure 11.4 Central Platform C
2) Kerbside Extension Platform The kerb is extended to the edge of the light rail track to form a platform. Access to the stop
would be from either end by way of a ramp or a few short steps. The back edge of the platform would be raised off the footpath and a wire fence would prevent waiting passengers from stepping off the edge.
Figure 11.5 Kerbside Extension Platform
3) Island Platform Partnered with a Kerbside Extension Platform, the Island Platform is designed for use where the light rail tracks are not in the centre of the road and a through-traffic lane is operational. The platform is placed between the centre-most track and the traffic lane. The same safety design specifications apply to the Island Platform as to the Kerbside Extension Platform. Access to the Island Platform requires pedestrians to cross either a single lane of traffic, or two light rail tracks.
Perth Light Rail Study T:\78105106 - Perth Light Rail\00\doc\reports\Final Report\Perth Light Rail Study Report_13Aug07_Final.doc Revision 0 13 August 2007 Page 98

Figure 11.6 Island Platform
11.3 Streetscape Cross Sections The eight designs detailed in Table 11.1 are discussed in greater detail in the following sections.
11.3.1 Cross Section Design 1 – The Transit Mall
This design converts the street environment into a transit mall. Other motorised vehicles will not be permitted to access this area, aside from service vehicles arriving and departing outside of the hours of light rail operation. The foci of this design are the following four criteria:
1) Allow for the greatest amount of pedestrian circulation space within the road reservation 2) Permit the retention or relocation of trees 3) Permit the use of the footpath for al fresco dining 4) Ensure the safe and timely operation of light rail vehicles within a confined road reservation
Figure 11.7 illustrates the layout of the street with the light rail tracks set in concrete in centralised carriageways flush with the pedestrian walkways. Tactile surface indicators would be placed along the edge of the pedestrian path to highlight the distinction between the pedestrian–only zone and the shared use area with light rail vehicles. Light rail vehicles will be required to travel at a 10km/h speed limit through the transit mall; pedestrians and cyclists would be expected to exert caution and avoid crossing in front of moving vehicles.
Figure 11.7 Cross Section Design 1 – The Transit Mall
Perth Light Rail Study T:\78105106 - Perth Light Rail\00\doc\reports\Final Report\Perth Light Rail Study Report_13Aug07_Final.doc Revision 0 13 August 2007 Page 99

This alignment allows for the creation of a high amenity environment for individuals enjoying the experience of Rokeby Road and Murray Street Mall. This cross section will also be applied outside Central TAFE where there is currently no road reservation.
Alternative track treatments could be incorporated into the proposed transit mall locations detailed in Table 11.2.
Table 11.2 Track Types in Possible Transit Mall Locations
Location Track Type QEII Medical Centre Concrete Murray Street Mall Paving Rokeby Road Paving Central TAFE Central Campus (Fielder Street) Ground cover planting Jolimont Depot Area Concrete
The stop arrangement for transit mall environments is illustrated in Figure 11.8 and characterised by raised areas within the mall accessible via a few short steps or a ramp. The kerb height at the stop will be 260mm and therefore there will be a drop off 160mm at the back of the stop to the verge.
Figure 11.8 Stop Arrangement for Design 1
11.3.2 Cross Section Design 2 – Mixed Traffic Environment
This design permits the use of the light rail corridor by other motorised vehicles, although in a restricted manner. One lane is provided in each direction and a speed limit of 40km/h will apply to all vehicles including light rail. General traffic accessing these sections of the route alignment will be required to have a destination that provides off street parking. Through traffic will not be permitted and will be restricted by the placement of light rail stops mid block. Non light rail vehicles will not be permitted to pass through the stops. The foci of this design are the following three criteria: 1) To ensure the safe and timely operation of light rail vehicles within a confined road reservation 2) To maintain the provision of vehicular access to existing properties and car parks 3) To provide the widest amount of verge to maintain an attractive pedestrian environment and
facilitate pedestrian movements
Figure 11.9 illustrates the layout of the street with the light rail tracks set in concrete in centralised carriageways shared with general traffic, with a 100mm high kerb at the verge and six metres of vergeeach side. There are short sections along the alignment where the road reservation becomes
Perth Light Rail Study T:\78105106 - Perth Light Rail\00\doc\reports\Final Report\Perth Light Rail Study Report_13Aug07_Final.doc Revision 0 13 August 2007 Page 100

narrower than the standard 20.7metres. Where this is associated with Cross Section Design 2, the verge width is reduced to between four and five metres on each side.
Figure 11.9 Cross Section Design 2 – Mixed Traffic Environment
The stop arrangement for mixed traffic environments is illustrated in Figure 11.10 and characterised by extended kerbs to the carriageway edge. The kerb height at the stop will be 260mm and therefore there will be a drop of 160mm at the back of the stop to the verge.
Figure 11.10 Stop Arrangement for Design 2
11.3.3 Cross Section Design 3 – Mixed Traffic Environment with Median
This design adopts the same philosophy regarding the shared use environment as Cross Section Design 2, however where the grassed median currently exists it shall be retained and also utilised for the placement of centralised island stops. The foci of this design are the following three criteria:
1) To ensure the safe and timely operation of light rail vehicles within a confined road reservation 2) To maintain the provision of vehicular access to existing properties and car parks 3) To maintain the amenity of the location and retain existing green spaces
Figure 11.11 illustrates the layout of the street with the light rail tracks set in the existing carriageways shared with general traffic, with a 100mm height kerb at the kerbside verge retaining the existing verge width, and a 150mm height kerb at the median, retaining the existing grassed median. There are short sections along the alignment where the road reservation becomes narrower than the standard 20.7metres. Where this is associated with Cross Section Design 3, the median width will be reduced or removed as appropriate.
Perth Light Rail Study T:\78105106 - Perth Light Rail\00\doc\reports\Final Report\Perth Light Rail Study Report_13Aug07_Final.doc Revision 0 13 August 2007 Page 101

Figure 11.11 Cross Section Design 3 – Mixed Traffic Environment with Median
The stop arrangement for mixed traffic environments is illustrated in Figure 11.12 and characterised by use of the median as central platform stop. The kerb height in the median at the stop will be 260mm.
Figure 11.12 Stop Arrangement for Design 3
11.3.4 Cross Section Design 4 – Utilising Median in a 40-metre Reserve
This design makes best use of the existing median strip, segregating the light rail from the vehicle carriageways without removing any carriageway capacity. Some widening of the carriageway width within the current road reserve will be required along Hay Street to accommodate this design. The foci of this design are the following three criteria:
1) To ensure the safe and timely operation of light rail vehicles 2) To retain the existing carriageway capacity in order to plan for future vehicles flows 3) To provide a centralised light rail alignment that will allow for maximum flexibility for the future use
of the road reservation
Figure 11.13 illustrates the layout of the street with the light rail tracks in centralised carriageways.
Perth Light Rail Study T:\78105106 - Perth Light Rail\00\doc\reports\Final Report\Perth Light Rail Study Report_13Aug07_Final.doc Revision 0 13 August 2007 Page 102

Figure 11.13 Cross Section Design 4 – Utilising Median in a 40-metre Reserve
The stop arrangement for the 40-metre road reservation is illustrated in Figure 11.14 and is characterised by provision of two central platforms. The kerb height at each platform will be 260mm.
Figure 11.14 Stop Arrangement for Design 4
11.3.5 Cross Section Design 5 – Utilising Road Space in a 40-metre Reserve
This design avoids the placement of the alignment along the attractive, vegetated median strip in the centre of Thomas Street and instead utilises the inner north and south-bound carriageways for segregated light rail vehicle use. Small segments of the median strip will be used to locate light rail stops. Some widening of the Thomas Street carriageway width within the current MRS reservation will be required north of Kings Park Road to ensure the existing traffic capacity is retained and existing level of service for vehicles is maintained at the Roberts Road, Hay Street and Kings Park Road intersections. The foci of this design are the following three criteria:
1) To ensure the safe and timely operation of light rail vehicles 2) To retain the existing carriageway capacity in order to plan for future vehicles flows 3) To provide a centralised light rail alignment that will allow for maximum flexibility for the future use
of the road reservation
Figure 11.15 illustrates the layout of the street with the light rail tracks set in a vegetated track in centralised carriageways. The vegetated treatment has been chosen as it will soften the overall appearance of the road and replace the vegetated median that currently exists. It will not be necessary to use the entire median for the light rail corridor, particularly for areas towards the west of this section. Speed of light rail operations will be restricted to the posted speed limit.
Figure 11.15 Cross Section Design 5 – Utilising Road Space in a 40-metre Reserve
Perth Light Rail Study T:\78105106 - Perth Light Rail\00\doc\reports\Final Report\Perth Light Rail Study Report_13Aug07_Final.doc Revision 0 13 August 2007 Page 103

The stop arrangement for a 40-metre road reservation with an 8-metre median is illustrated in Figure 11.16 and characterised by extended kerbs to the carriageway edge. The kerb height of the median at the stop will be 260mm.
Figure 11.16 Stop Arrangement for Design 5
11.3.6 Cross Section Design 6 – One-way Westbound Traffic
This design retains the one-way traffic function of Hay Street through West Perth and into Subiaco. The light rail tracks have been positioned just north of centre to allow for the provision of a single westbound carriageway for general traffic. The light rail vehicles will be provided with a segregated environment along the whole of this section although speeds will be restricted to the posted speed limit. The foci of this design are the following four criteria:
1) To ensure the safe and timely operation of light rail vehicles within a confined road reservation 2) To maintain Hay Street as a through route 3) To permit the retention of trees 4) To permit the retention of some on-street parking
Figures 11.17 and 11.18 illustrate the layout of the street with the light rail tracks set in concrete in just-off-centre carriageways with a 100mm high kerb at the verge providing a verge width of around 4 metres on the northern side and 5.5 metres on the southern side. The latter can be designed on a flexible basis for either on-street car parking provision, loading bays, al fresco dining, including a continuous footpath. The responsible authority may choose to include a continuous cycle lane instead of car parking.
Figure 11.17 Cross Section Design 6 – One-way Westbound Traffic with Al Fresco Dining
Perth Light Rail Study T:\78105106 - Perth Light Rail\00\doc\reports\Final Report\Perth Light Rail Study Report_13Aug07_Final.doc Revision 0 13 August 2007 Page 104

Figure 11.18 Cross Section Design 6 – One-way Westbound Traffic with Loading/Parking Bay
Vehicle access and egress from selected side roads will be permitted. Speed of light rail operations will be restricted to the posted speed limit.
The stop arrangement for one-way traffic environments is illustrated in Figure 11.19 and characterised by an extended kerbs for eastbound services and the installation of an island platform to serve westbound services. The kerb height at the platform edge will be 260mm; there will be drop of 160mm at the back of the kerbside extension stop to the verge.
Figure 11.19 Stop Arrangement for Design 6
11.3.7 Cross Section Design 7 – One-way Eastbound Traffic
This design retains the one-way traffic function of Murray Street through West Perth and into Perth CBD. The light rail tracks have been positioned just south of centre to allow for the provision of a single eastbound carriageway for general traffic. The light rail vehicles will be provided with a segregated environment along the whole of this section although speeds will be restricted to the posted speed limit. The foci of this design are the following three criteria:
1) To provide the best balance between light rail operational requirements, service demand, and existing traffic circulation patterns
2) To maintain Murray Street as a through route and regional road 3) To maintain access to the Mitchell Freeway
Perth Light Rail Study T:\78105106 - Perth Light Rail\00\doc\reports\Final Report\Perth Light Rail Study Report_13Aug07_Final.doc Revision 0 13 August 2007 Page 105

There will be a requirement to prioritise light rail movements between the intersections with Coolgardie Street and Elder Street to ensure that where Murray Street splits to provide access to the Mitchell Freeway, general traffic and light rail vehicle movements do not conflict.
Figure 11.20 illustrates the layout of the street with the light rail tracks set in concrete in just-off-centre carriageways with a 100mm high kerb at the verge providing a verge width of around 5.5 metres on the northern side and 4 metres on the southern side. The former can be designed on a flexible basis for either on-street car parking provision, loading bays, al fresco dining, including a continuous footpath. The responsible authority may choose to include a continuous cycle lane instead of car parking.
Figure 11.20 Cross Section Design 7 – One-way Eastbound Traffic
Vehicle access and egress from selected side roads will be permitted. Speed of light rail operations will be restricted to the posted speed limit.
The stop arrangement for one-way traffic environments is illustrated in Figure 11.21 and characterised by an extended kerbs for westbound services and the installation of an island platform to serve eastbound services. The kerb height at the platform edge will be 260mm; there will be drop of 160mm at the back of the kerbside extension stop to the verge.
Figure 11.21 Stop Arrangement for Design 7
Perth Light Rail Study T:\78105106 - Perth Light Rail\00\doc\reports\Final Report\Perth Light Rail Study Report_13Aug07_Final.doc Revision 0 13 August 2007 Page 106

11.3.8 Cross Section Design 8 – Two-way Traffic in a 20-metre Reserve
This design provides for a segregated light rail environment while retaining the existing traffic capacity. It also allows for the retention of existing trees along the verge edge. The foci of this design are the following three criteria:
1) To ensure the safe and timely operation of light rail vehicles within a confined road reservation 2) To permit the retention or relocation of trees 3) To retain the existing traffic capacity of the road
Figure 11.22 illustrates the layout of the street with the light rail tracks set in concrete in centralised carriageways with a general traffic carriageway lane on each side of the light rail alignment. A 100mm high kerb at the verge provides a verge width of three metres on both sides.
Figure 11.22 Cross Section Design 8 – Two-way Traffic in a 20-metre Reserve
Vehicle access and egress from selected side roads will be permitted. Light rail vehicles will be required to travel at the posted speed limit.
The stop arrangement for two-way traffic in a 20-metre road reserve is illustrated in Figure 11.23 and 11.24 and characterised by the location of a single central platform and signal control of through traffic movements. The kerb height at the stop will be 260mm.
Figure 11.23 Stop Arrangement for Design 8
Through traffic will be required to stop at a red signal when the light rail priority system detects an on-coming light rail vehicle. The light rail vehicle will then be able to safely manoeuvre into the single lane
Perth Light Rail Study T:\78105106 - Perth Light Rail\00\doc\reports\Final Report\Perth Light Rail Study Report_13Aug07_Final.doc Revision 0 13 August 2007 Page 107

to pick up and drop off passengers at the central platform. Pedestrians will need to cross only the one carriageway to access the stop from the verge. Once the light rail vehicle departs from the stop the through traffic will be given a green signal to proceed. Delays to through traffic are likely to be no more than 40 seconds.
Figure 11.24 Stop Arrangement for Design 8 – Plan
Perth Light Rail Study T:\78105106 - Perth Light Rail\00\doc\reports\Final Report\Perth Light Rail Study Report_13Aug07_Final.doc Revision 0 13 August 2007 Page 108

11.4 Light Rail Alignment Concept Design The concept design for the light rail alignment incorporates the street environment design with engineering standards for traffic lane configuration, intersection design and light rail operations. Table 11.3 lists the relevant design criteria used and where these standards originate from.
Table 11.3 Engineering Design Specifications
Design Element Design Detail Additional Information Traffic Specifications All design specifications for general traffic movements comply with
Main Roads WA specifications, which as a minimum comply with Austroads Guide to Engineering Practice
Through traffic lanes 3.2m (minimum) Turning lanes 3.0m (minimum) Signals for right-turning traffic at
intersections with light rail Parking lanes 2.8 metres Horizontal curve To fit unarticulated single unit Kerb height 100mm Light Rail Specifications All design specifications for light rail movements have been adopted
from Yarra Trams and the Victorian State Government Department of Infrastructure
Two-way, parallel running 7.314m In centre or set to one side in one-way traffic
Track gauge 1.435m Track Gradient 6.5% maximum over 300m Platform length 26m Total stop length 40-50m Stop length relative to stop type,
position and grade of road Platform Width CentralIslandKerbside
4.0m minimum 3.0m minimum 2.4m minimum
Platform height 260mm To be confirmed based on design height of light rail vehicles
Gradient at stop 3% Based on light rail operations and DDA requirements
Curve radii Desirable 25m Absolute minimum 18m
Other Light Rail Design Specifications Light rail priority at intersections along the route Light rail alignment segregated from general traffic as far as possible Majority of stops to be mid-block Street Environment Verge width 3.0m minimum on each side
(but strive for wider verges in general)
Width variable dependent on kerbside uses
Perth Light Rail Study T:\78105106 - Perth Light Rail\00\doc\reports\Final Report\Perth Light Rail Study Report_13Aug07_Final.doc Revision 0 13 August 2007 Page 109

A series of plans have been produced along the alignment, which provide snapshots of both typical and atypical locations, which are detailed in Table 11.4 and shown on the following pages in Figures 11.24 through 11.40. The image at the top of each page shows the light rail alignment in the existing street environment and the lower image illustrates the changes proposed to kerblines, access arrangements and general rights of way.
Table 11.4 Concept Design Plans
Plan No / Figure
Location Description
1Fig 11.24
Broadway / Princess Road
Light rail terminus at Princess Road. Separate carriageways for light rail and vehicles, two-way vehicular traffic. Through traffic is signal controlled at stops when light trail vehicle is present.
2Fig 11.25
Broadway / Stirling Highway / Hampden Road
Two-way vehicular traffic, light rail carriageway separated at the intersection on both sides of Stirling Highway. No right turn from Broadway into Stirling Highway.
3Fig 11.26
Hampden Road / Monash Avenue
Mixed traffic and light rail through Hampden Road with flexible arrangement for the use of each verge. Roundabout replaced with signalised T intersection with light rail access only into the QEIIMC site. Clearance between light rail overhead power supply lines and high voltage power line requires further investigation.
4Fig 11.27
Thomas Street / Aberdare Road
Light rail operates in priority lane either side of the median along Thomas Street with stops located in the median. A new intersection will be required to provide an additional access into the QEIIMC site.
5Fig 11.28
Rokeby Road / Thomas Street
Rokeby Road intersection with Thomas Street is signalised. Two-way traffic operation on Rokeby Road with light rail operating in separate carriageways.
6Fig 11.29
Rokeby Road / Hay Street
Rokeby Road intersection with Hay Street is signalised. Rokeby Road between Hay Street and Bagot Road proposed to be a transit mall.
7Fig 11.30
Hay Street / Hamilton Street
One-way westbound traffic operations and two-way light rail operations in separate carriageways. Access to side roads maintained. Flexible south side verge allows for provision on varying kerbside and verge uses.
8Fig 11.31
Hay Street / Thomas Street
One-way westbound traffic operations and two-way light rail operations in separate carriageways. Access to side roads maintained. Light rail priority signal, no major changes to Thomas Street approaches.
9Fig 11.32
Havelock Street Havelock Street intersections with Hay Street and Murray Street both signalised and also synchronised to allow light rail to pass through both in one movement. Traffic access maintained one lane in both directions.
10Fig 11.33
Hay Street, West Perth
One-way westbound traffic operations and two-way light rail operations in separate carriageways. Access to side roads maintained. Flexible south side verge allows for provision on varying kerbside and verge uses.
11Fig 11.34
Murray Street Mall Light rail stop positioned close to William Street Station exit (under construction). No traffic permitted, 10km/h light rail vehicle speed limit.
12Fig 11.35
Barrack Street Barrack Street intersections with Hay Street and Murray Street remain signalised and light rail priority signal is synchronised. Land will be required on the southwest corner of Murray Street and northeast corner of Hay Street, where existing properties will need to be redeveloped.
13 Hay Street, Mixed traffic and light rail environment, however through traffic is not
Perth Light Rail Study T:\78105106 - Perth Light Rail\00\doc\reports\Final Report\Perth Light Rail Study Report_13Aug07_Final.doc Revision 0 13 August 2007 Page 110

Fig 11.36 Mercedes College permitted. Vehicles accessing Hay Street mid-block must have an off-street destination. Traffic will not be permitted to pass through the light rail stop environment. Flexible verge on both sides allows for provision on varying kerbside and verge uses.
14Fig 11.37
Hay Street / Hill Street
Mixed traffic and light rail environment. Hill Street approach reduced to one lane at stop line. Traffic entering Hay Street will not be permitted to pass through the light rail stop environment.
15Fig 11.38
Hill Street / Wellington Street
Hill Street one-way southbound with a second / left turn lane developed at the stop line. Wellington street unaffected before and after intersection.
16Fig 11.39
Hill Street / Wittenoom Street / Royal Street
Major street changes required with intersection of Hill Street / Wittenoom Street changed to a simplified four-way signalised intersection.
17Fig 11.40
Claisebrook Depot Main maintenance depot with access off Hill Street. Hill Street is a mixed traffic and light rail environment.
Perth Light Rail Study T:\78105106 - Perth Light Rail\00\doc\reports\Final Report\Perth Light Rail Study Report_13Aug07_Final.doc Revision 0 13 August 2007 Page 111

Mau
nsel
l Aus
tral
ia P
ty L
tdLe
vel 1
, 629
New
cast
le S
treet
PO
Box
81,
Lee
derv
ille 6
902
Wes
tern
Aus
tralia
Tel +
61 8
928
1 61
00Fa
x +6
1 8
9281
629
9pe
rth@
mau
nsel
l.com
AB
N 2
0 09
3 84
6 92
5

Mau
nsel
l Aus
tral
ia P
ty L
tdLe
vel 1
, 629
New
cast
le S
treet
PO
Box
81,
Lee
derv
ille 6
902
Wes
tern
Aus
tralia
Tel +
61 8
928
1 61
00Fa
x +6
1 8
9281
629
9pe
rth@
mau
nsel
l.com
AB
N 2
0 09
3 84
6 92
5

Mau
nsel
l Aus
tral
ia P
ty L
tdLe
vel 1
, 629
New
cast
le S
treet
PO
Box
81,
Lee
derv
ille 6
902
Wes
tern
Aus
tralia
Tel +
61 8
928
1 61
00Fa
x +6
1 8
9281
629
9pe
rth@
mau
nsel
l.com
AB
N 2
0 09
3 84
6 92
5

Mau
nsel
l Aus
tral
ia P
ty L
tdLe
vel 1
, 629
New
cast
le S
treet
PO
Box
81,
Lee
derv
ille 6
902
Wes
tern
Aus
tralia
Tel +
61 8
928
1 61
00Fa
x +6
1 8
9281
629
9pe
rth@
mau
nsel
l.com
AB
N 2
0 09
3 84
6 92
5

Mau
nsel
l Aus
tral
ia P
ty L
tdLe
vel 1
, 629
New
cast
le S
treet
PO
Box
81,
Lee
derv
ille 6
902
Wes
tern
Aus
tralia
Tel +
61 8
928
1 61
00Fa
x +6
1 8
9281
629
9pe
rth@
mau
nsel
l.com
AB
N 2
0 09
3 84
6 92
5

Mau
nsel
l Aus
tral
ia P
ty L
tdLe
vel 1
, 629
New
cast
le S
treet
PO
Box
81,
Lee
derv
ille 6
902
Wes
tern
Aus
tralia
Tel +
61 8
928
1 61
00Fa
x +6
1 8
9281
629
9pe
rth@
mau
nsel
l.com
AB
N 2
0 09
3 84
6 92
5

Mau
nsel
l Aus
tral
ia P
ty L
tdLe
vel 1
, 629
New
cast
le S
treet
PO
Box
81,
Lee
derv
ille 6
902
Wes
tern
Aus
tralia
Tel +
61 8
928
1 61
00Fa
x +6
1 8
9281
629
9pe
rth@
mau
nsel
l.com
AB
N 2
0 09
3 84
6 92
5

Mau
nsel
l Aus
tral
ia P
ty L
tdLe
vel 1
, 629
New
cast
le S
treet
PO
Box
81,
Lee
derv
ille 6
902
Wes
tern
Aus
tralia
Tel +
61 8
928
1 61
00Fa
x +6
1 8
9281
629
9pe
rth@
mau
nsel
l.com
AB
N 2
0 09
3 84
6 92
5

Mau
nsel
l Aus
tral
ia P
ty L
tdLe
vel 1
, 629
New
cast
le S
treet
PO
Box
81,
Lee
derv
ille 6
902
Wes
tern
Aus
tralia
Tel +
61 8
928
1 61
00Fa
x +6
1 8
9281
629
9pe
rth@
mau
nsel
l.com
AB
N 2
0 09
3 84
6 92
5

Mau
nsel
l Aus
tral
ia P
ty L
tdLe
vel 1
, 629
New
cast
le S
treet
PO
Box
81,
Lee
derv
ille 6
902
Wes
tern
Aus
tralia
Tel +
61 8
928
1 61
00Fa
x +6
1 8
9281
629
9pe
rth@
mau
nsel
l.com
AB
N 2
0 09
3 84
6 92
5

Mau
nsel
l Aus
tral
ia P
ty L
tdLe
vel 1
, 629
New
cast
le S
treet
PO
Box
81,
Lee
derv
ille 6
902
Wes
tern
Aus
tralia
Tel +
61 8
928
1 61
00Fa
x +6
1 8
9281
629
9pe
rth@
mau
nsel
l.com
AB
N 2
0 09
3 84
6 92
5

Mau
nsel
l Aus
tral
ia P
ty L
tdLe
vel 1
, 629
New
cast
le S
treet
PO
Box
81,
Lee
derv
ille 6
902
Wes
tern
Aus
tralia
Tel +
61 8
928
1 61
00Fa
x +6
1 8
9281
629
9pe
rth@
mau
nsel
l.com
AB
N 2
0 09
3 84
6 92
5

Mau
nsel
l Aus
tral
ia P
ty L
tdLe
vel 1
, 629
New
cast
le S
treet
PO
Box
81,
Lee
derv
ille 6
902
Wes
tern
Aus
tralia
Tel +
61 8
928
1 61
00Fa
x +6
1 8
9281
629
9pe
rth@
mau
nsel
l.com
AB
N 2
0 09
3 84
6 92
5

Mau
nsel
l Aus
tral
ia P
ty L
tdLe
vel 1
, 629
New
cast
le S
treet
PO
Box
81,
Lee
derv
ille 6
902
Wes
tern
Aus
tralia
Tel +
61 8
928
1 61
00Fa
x +6
1 8
9281
629
9pe
rth@
mau
nsel
l.com
AB
N 2
0 09
3 84
6 92
5

Mau
nsel
l Aus
tral
ia P
ty L
tdLe
vel 1
, 629
New
cast
le S
treet
PO
Box
81,
Lee
derv
ille 6
902
Wes
tern
Aus
tralia
Tel +
61 8
928
1 61
00Fa
x +6
1 8
9281
629
9pe
rth@
mau
nsel
l.com
AB
N 2
0 09
3 84
6 92
5

Mau
nsel
l Aus
tral
ia P
ty L
tdLe
vel 1
, 629
New
cast
le S
treet
PO
Box
81,
Lee
derv
ille 6
902
Wes
tern
Aus
tralia
Tel +
61 8
928
1 61
00Fa
x +6
1 8
9281
629
9pe
rth@
mau
nsel
l.com
AB
N 2
0 09
3 84
6 92
5

Mau
nsel
l Aus
tral
ia P
ty L
tdLe
vel 1
, 629
New
cast
le S
treet
PO
Box
81,
Lee
derv
ille 6
902
Wes
tern
Aus
tralia
Tel +
61 8
928
1 61
00Fa
x +6
1 8
9281
629
9pe
rth@
mau
nsel
l.com
AB
N 2
0 09
3 84
6 92
5

11.5 Hay Street Engineering Option Assessment A number of route options were investigated and detailed in Section 7. No route was initially considered through the Hay Street Mall, which was viewed as unsuitable by the City of Perth. This Section briefly looks at the potential impacts that would have to be dealt with should, in the future, a decision be made to have a light rail alignment along the entire Hay Street as an alternative to the presently proposed combination of Hay Street and Murray Street.
11.5.1 Bridge Assessment
The Hay Street bridge across the Freeway currently load rates at approximately 34 percent T44 (Austroads 1996 Standard Highway Loading) based on the current four-lane configuration. The bridge is therefore well below capacity for standard loading. MRWA previously investigated ways of strengthening (and raising) the Hay Street bridge. The latest investigation was concluded in April 2004. The proposed strengthening was intended to increase the load rating to full 100 percent T44 with the bridge in its current configuration.
To assess the likely impact of light rail across the Hay Street bridge, a comparison was undertaken using a Siemens light rail vehicle (Combino Budapest NF12B) to T44 loading using a simple line beam analysis. The Siemens' vehicle was 54m long, but assuming the light rail vehicles to be used in Perth are more likely to be in the order of 30m long, a configuration of essentially half that of the Siemens vehicle was used (approximately 27.2m long). It was also assumed that there would be either one or two light rail vehicles in the same lane (whichever gave the worst effect). Where two vehicles were in the same lane, it was assumed they were a minimum of 15m apart (if they were any closer, the speed would be less and so too the dynamic impact). The direction of travel had negligible impact.
This line beam analysis indicated that the light rail vehicle resulted in load effects that were approximately 75 percent of T44 loading. Therefore, the bridge would not be able to carry light rail vehicles in its current state, but if strengthened as proposed, it would be able to carry the light rail vehicle without any further strengthening.
One further complication would be that the light rail vehicle will require an additional concrete/asphalt thickness of approximately 150mm (assuming total required thickness of 210mm and existing asphalt thickness of 60mm). One of the strengthening options MRWA previously proposed was to place a 150mm thick concrete overlay on the bridge. If light rail was proposed for the bridge, then the strengthening slab should make allowance for the light rail. Otherwise, the road level would need to be raised again with the resulting implications of reduced load carrying capacity and tie-in at the approaches.
11.5.2 Freeway Ramp Traffic Impacts
Hay Street currently has four lanes across the Freeway bridge (between Elder Street and George Street), two of which will be used to accommodate the proposed light rail. It can be accepted that a general redistribution of traffic will result, which will primarily see a portion of Hay Street traffic moving to St Georges Terrace and Milligan Street and to a lesser extent Wellington Street.
Light rail operating under priority, would reduce the amount of green time available at traffic signals for non-priority (side road) movements, i.e. Elder Street, George Street and the northbound Freeway off-ramp. It can therefore be expected that side streets approaching light rail priority intersections will experience some increased delays and queuing. However, the introduction of light rail along Hay Street and in particular across the Freeway, is not expected to have a significant (unmanageable) traffic impact.
In order to minimise the overall traffic impact, lane configuration at intersections would need to be enhanced or at least maintained as far as possible. Typically the two left turn lanes from the northbound Freeway off-ramp into Hay Street can be maintained after the introduction of the light rail by providing an additional left slip lane along the southern edge of Hay Street to tie into the existing left slip lane from Hay Street into Harvest Terrace.
Perth Light Rail Study T:\78105106 - Perth Light Rail\00\doc\reports\Final Report\Perth Light Rail Study Report_13Aug07_Final.doc Revision 0 13 August 2007 Page 129

Should a light rail route along Hay Street be identified, it is recommended that detailed micro-simulation sub-area modelling (e.g. Paramics) be undertaken to more accurately assess the likely traffic impact and to test potential improvement measures.
11.6 Cost Estimate 11.6.1 Infrastructure Costs
A general description of the construction requirements for the preferred light rail route has been described in preceding sections. The full cost estimate calculations are attached at Appendix B.
In order to generate an indicative infrastructure cost for the project, unit rates have been applied to quantities based on Maunsell’s experience in other projects including recent investigations in Adelaide. The light rail network has been broken into a series of segments as shown in Table 11.5. The costing has been applied to the entire network.
Items of infrastructure, and their assumed general design criteria, are listed below:
� Light rail stops have been costed using accessible design criteria and include passenger information systems and shelter.
� Track – concrete encased rails in the road surface applies to most of the route. The option exists to improve aesthetics by using vegetation infill but at a substantially higher cost.
� Turnouts and crossovers – a sufficient number have been provided at terminating stops to allow approaching light rail to use either one of two available platforms. Crossovers have been provided in Hay Street near Rokeby Road and Hill Street to facilitate the turnback of the shuttle light rail operation (refer Section 11.6.2 for more detail). All facing turnouts are assumed to be automated for in cab operation.
� General consideration has been given to intersections in two categories; firstly, whether the layout of the intersection requires alteration, secondly, whether it may be necessary to install new traffic signals, and finally if the traffic light sequences will require modification to incorporate light rail priority. Cost rates applied are indicative and do not reflect the specific works required at the location.
� Power supply to the network and light rail has been costed as being provided from overhead sources however other options may be available (such as underground) at considerably higher cost. It has be assumed that two substations will be needed to feed the network and that these will be located appropriately without land acquisition costs.
� Two light rail depots have been provided, one north of Royal Street to service Line 1, and one off Selby Street to service Line 2. Given the availability of land and the opportunity to avoid duplicating expensive maintenance infrastructure, the Royal Street Depot has been costed as the main maintenance depot (overhaul, paint shop, lift shop) as well as storage tracks whilst the Selby Street Depot provides only storage tracks and a running repair facility.
Perth Light Rail Study T:\78105106 - Perth Light Rail\00\doc\reports\Final Report\Perth Light Rail Study Report_13Aug07_Final.doc Revision 0 13 August 2007 Page 130

Table 11.5 provides indicative infrastructure costs for the project of around $252M. Costs are broken up by track section for the entire light rail network based on the above methodology.
Table 11.5 Indicative Infrastructure Costs
Sub
Tota
l for
Seg
men
t
Rou
te L
engt
h (k
m)
Num
ber o
f Sto
ps
Num
ber o
f Sub
stat
ions
Num
ber o
f Dep
ots
Primary Depot, Line 2 (off Selby Street) $52,300,000 0.3 0 0 1Line 2, Hay St / Selby St (east) to Hay St / Rokeby Rd (east) $19,200,000 1.8 3 0 0Line 1, Broadway / Princess St (north) to Broadway / Monash Ave (north) $17,900,000 1.7 3 0 0Line 1, Monash Ave (north) to Winthrop Street (west) through Hospital $12,000,000 0.9 2 1 0Line 1, Winthrop Ave/ Aberdare Rd (south) to Thomas St / Rokeby Rd (north) $11,400,000 1.5 2 0 0Line 1a Rokeby Rd / Thomas St (north) to Rokeby Rd / Bagot Rd (north) $10,000,000 0.9 1 0 0Line 1a Rokeby Rd / Bagot Road (north) to Hay Street (east) $3,600,000 0.4 1 0 0Line 1a&2, Hay St / Rokeby Road (east) to Hay St / Thomas Street (east) $12,800,000 1.2 3 0 0Line 1&2, Hat St / Thomas St (east) to Havelock St / Murray St (east) $9,200,000 0.9 1 0 0Line 1&2, Havelock St / Murray St (east) to Murray St / William St (west) $12,800,000 1.2 3 0 0Line 1&2, Murray St / William St (west) to Murray St / Barrack St (west) $3,600,000 0.3 1 0 0Line 1&2, Murray St / Barrack St (west) to Hay St / Hill Street (west) $14,800,000 1.0 2 1 0Line 2, Hay St / Hill Street (west) to Riverside $14,400,000 1.3 2 0 0Line 1, Hay St / Hill Street (west) to Royal St (north) in park $9,100,000 0.7 1 0 0Secondary Depot, Line 1, (north of Royal St) $26,000,000 0.3 0 0 110% Urban Design / Streetscape Enhancement / Place-making Budget $22,900,000
$252,000,000 14.3 25 2 2
Route Segment
EXP. COSTS STATISTICS
The infrastructure cost estimate includes indicative costs for land acquisition of the two depot sites and a 10 percent provision for urban design and place-making initiatives to ensure the successful integration of the light rail infrastructure into the surrounding streetscape.
11.6.2 Operating Assumptions
In order to determine light rail fleet requirements and operating costs, both of which are related to operating time and distance, it was necessary to define the expected operation on the network.
Operation of the network will be related to the patronage demand that is to be satisfied therefore it can best be described as a service frequency plan. There are three components to this plan:
� Line 1 service frequency requirement � Line 2 service frequency requirement � Service requirement in the inner city area
The service frequency in the inner city will be the sum of the combined service levels for both Line 1 and Line 2. Where this may be insufficient to match the inner city service requirement these services will need to be complemented with a shuttle service operating within the city centre area in a similar roll to the current Yellow CAT bus service. For the light rail shuttle service it has been assumed that it will operate between Rokeby Street in the west to Hill Street in the east.
Perth Light Rail Study T:\78105106 - Perth Light Rail\00\doc\reports\Final Report\Perth Light Rail Study Report_13Aug07_Final.doc Revision 0 13 August 2007 Page 131

Table 11.6 provides a statement as to the service frequencies assumed in order to calculate light rail fleet size and network operating costs.
Table 11.6 Service Frequency Assumptions
11.6.3 Rollingstock Costs
Table 11.7 Anticipated Light rail Fleet Requirements
Peak Off
Peak Base Depot Line 1 route service 16 6 Line 1 Depot (north of Royal St) Line 2 route service 13 5 Line 2 Depot (off Selby St) Shuttle service 0 4 Line 2 Depot (off Selby St) 29 Maintenance @7% 2 TOTAL 31
Based on the preferred light rail vehicle identified earlier in the report, it is expected that the purchase cost will be in the vicinity of $4.5M per unit. Based on a need of 31 units, this provides a total capital cost requirement of around $140M.
11.6.4 Operating Costs
In order to calculate operating costs a full day of operation has been scheduled and statistics, such as operating duration and distance, have been derived based on the route characteristics (length and running time).
The following unit rates11 have been applied to derive the network operating costs: � On-vehicle crew costs $60 per light rail operating hour � Vehicle (direct operating) costs $1.50 per light rail km � Infrastructure maintenance costs $65,000 per track km pa � Overhead (operating) costs 17.5% on total operating costs
11 Source: National Guidelines for Transport System Management – Australian Transport Commission, 2006
Perth Light Rail Study T:\78105106 - Perth Light Rail\00\doc\reports\Final Report\Perth Light Rail Study Report_13Aug07_Final.doc Revision 0 13 August 2007 Page 132

� Profit margin 4.0% on total operating costs plus overheads Based on the above data, network operating costs have been calculated and are shown in Table 11.8.
Table 11.8 Annual Network Operating Costs
Crewing Cost $4,900,000 Light rail Operating Cost $2,200,000 Infrastructure Maintenance Cost $1,300,000Sub-Total Cost $8,400,000 With Overheads $9,900,000With Profit Margin $10,200,000
If the network is to be operated as a Government facility the bold figure in the above table is the applicable cost. If the network is to be franchised to a private operator then a likely profit margin would be added as shown.
11.6.5 Cost Summary
The preceding sections provided indicative costs for the various subcomponents that have to be taken into account for the planning, design and construction, acquisition of rolling stock and annual operating costs for a proposed light rail system. Table 11.9 provides a summation of the three aforementioned costs as well as a forward projection of these costs to 2010 and 2015.
Table 11.9 Cost Summary
Cost ElementEstimated Current 2007 Costs ($M)
Projected 2010 Costs (+3 years) ($M)
Projected 2015 Costs (+8 years) ($M)
Infrastructure 252 292 431Rolling Stock 140 162 239Total: Infrastructure + Rolling Stock 392 454 670
Annual Operating Cost 10 12 17
Note: Average annual escalation based on 5 percent per year to cater for volatile construction market.
Perth Light Rail Study T:\78105106 - Perth Light Rail\00\doc\reports\Final Report\Perth Light Rail Study Report_13Aug07_Final.doc Revision 0 13 August 2007 Page 133

12.0 Light Rail and Local Economic Development This section provides a high level economic review of the study area as new light rail public transport infrastructure could stimulate local economic gain. This section also presents a discussion on the potential for re-zoning and redevelopment to provide a reliable patronage base over time. A greater level of detailed economic research and analysis will be required as part of a business case for the light rail alignment should the project progress to implementation.
12.1 Economic Impacts of Light Rail – Capturing Value It has been demonstrated in a large number of cases worldwide that the development of a rail system, (whether, light, medium or heavy rail) brings with it an injection of economic activity into a given area. This is due primarily to the function of rail as a mass mobiliser of people, income and employment.
To effectively maximise economic benefits associated with a new transit system, a holistic local economic development strategy is required that utilises the transit benefits and combines them with the land use and zoning mix, density controls and urban design so as to enhance a given urban centre or community.
Strategic economic planning at the local level creates self-sustaining development that serves to also deliver the other tenets of sustainability such as social advancement and positive environmental outcomes.
A substantial body of research has found a strong relationship between transport investment and increasing land value. The particular qualities of light rail; reliability, legibility, permanence and simplicity of service, have a profound effect on the attraction of higher value real estate development. Appropriate local government levies such as progressive taxes based on land value, can be then re-directed back into place-making and community development programs.
Research on light rail transport carried out by Edge (2003)12 has demonstrated that an increase of between 5-10 percent on residential land values and some 10-30 percent on commercial properties is achievable within a light rail transport corridor without any additional economic maximisation strategies.
Moreover, data from the City of Dallas, Texas, Dallas Area Rapid Transit (DART) shows that a medium light rail station yielded a 32 percent increase in median residential land values (compared to 19.5 percent in a control group area)13. This median increase was evidenced in the commercial real estate sector with an increase of some 25 percent in the prices of property in close proximity to the DART as compared to 11.5 percent for commercial properties not in close proximity to the DART.
Similarly, in examining the UK context for both heavy and light rail, Gibbins and Machins’s (2003) work considered the links between house prices and transport, assessing valuation models in the London area between 1997 and 2001. The study yielded the following results:
12 Edge, J 2003, “The impact of transport schemes of land values: what is the evidence?” Self-financing Transport Projects Through Land Value Gains: Too Good to be True? Conference, London
13 Weinstein and Clower, 2002, An assessment of the DART LRT on taxable property valuation and transit oriented development, Dallas
Perth Light Rail Study T:\78105106 - Perth Light Rail\00\doc\reports\Final Report\Perth Light Rail Study Report_13Aug07_Final.doc Revision 0 13 August 2007 Page 134

� Places that were located closer to stations as a result of line extensions, experienced dwelling price rises of at least 1.5 percent for each 1km reduction in station distance.
� For a given minimum (within walkable threshold) station distance, dwellings with a number of alternative stations at that distance attract a higher premium than those with just one close station.
� A policy that improves service frequencies at a given station by 10 percent is valued at around 0.4 percent of property prices in the immediate vicinity of the area.
However, increases in property prices are not uniform and depend largely on the context of development i.e. there will be differing rates of price change for single dwellings versus medium-high density clusters depending on the character of the existing area. Therefore, it needs to be cautioned that there is not a simple linear causal relationship between transport infrastructure and property prices. There is a need to move beyond land value and to consider the economic benefits achieved for the community.
12.2 Land Use Change and Densification Although significant in enhancing urban regeneration and place-making, the implementation of a light rail system may not in itself be sufficient to achieve these aims. Community development, including its social, political, cultural and environmental dimensions will also need to be taken into account within a local context (Edge 2004).
Land use mix can provide the economic attractor to generate economic activity within a community. The retention of economic activity will depend on the diversity of land uses in the immediate locality and the corresponding diversity of businesses to create production and employment.
The greater the availability and provision of services from business opportunities the greater the propensity for increases in economic activity, generally stimulated by the expenditure of new customers and employees in the immediate community served by a light rail station.
Light rail stops act as magnets for urban development seeking a dependable transit service which enhances the appeal and liveability of the area14. Evidence elsewhere suggests a minimum residential density would be required to support the efficient operation of a light rail system, usually in the order of 35 dwellings per hectare or higher (R35 density coding in Western Australia) within approximately a 600-800 metre walk distance from each stop.
12.3 Strategies to Ensure the Capture of Light Rail Economic Benefits Based on the key themes and ideas of the research above, the following strategies are recommended for the capture of economic benefits for the proposed Perth light rail system. These strategies have been developed with an entire light rail network in mind for Perth, and therefore some may not be directly relevant or suitable for the alignment proposed in this report:
1. Mixed Use Development needs to be encouraged at street-level and designed to ensure walk-on patronage access to the nearest station (as opposed to park ‘n’ ride). This sets the precursor for a seamless almost door-to-door transition from the urban fabric into the transport node.
14 Newman P. & Kenworthy, J. R. 1999, Sustainability and Cities: overcoming automobile dependence, Island Press, Washington DC
Perth Light Rail Study T:\78105106 - Perth Light Rail\00\doc\reports\Final Report\Perth Light Rail Study Report_13Aug07_Final.doc Revision 0 13 August 2007 Page 135

2. Adopt Flexible Zoning to encourage a mixture of diverse land uses in the walkable catchment area up to a nominal 800m. Land use policies should not only focus on shops and offices but also on other “softer” infrastructure such as schools, community centres, parks and other major attractors for example. This diversity can be further reinforced by allowing vertical land use mixes where businesses can occupy ground floor premises with residential uses in upper floors. Such policies ensure a 24 hour economy as well as providing a safe and secure environment which encourages public transport ridership.
3. Maintain a “Centres Approach” where the densest developments are zoned within a nominal walkable catchment. For example:(i) Allow a range of medium to the highest density e.g. a minimum of R80 to R160 within a
nominal 400m walkable catchment. (ii) Allow a range of medium density development such as R30 and higher in the 400m to 800m
walkable catchment.
4. Density Bonuses and/or Development Variations need to be provided to potential developers who can provide high quality, well-designed, universally accessible public space with legibility and good connectivity to light rail stations. Variations to development standards might be considered, for example density, plot ratio, height, setbacks or other planning controls, in order to support a high quality public realm that maximises the value of light rail infrastructure.
5. Minimum Parking Requirements need to be reviewed and in some cases removed where developments are close to light rail stations. In such cases, density bonuses and/or development variations should be provided where businesses substantially reduce off-site parking for employees and customers – thereby encouraging light rail usage. In place of large car parks, higher order commercial uses can be established that have a better economic return for both developers and local government through levies.
6. Main Street design needs to be adopted, which may include the light rail track within the traditional road space at the exclusion of on-street parking and / or additional traffic lanes. Parking can be planned in adjacent streets so as not to take up road space and thereby encourage a freely walkable centre with the possibility of more economic interactions.
7. Non-Motorised Transport design e.g. principal shared paths (PSP’s) should be integrated into the urban fabric, the main street and into the light rail stations (Superstops). This ensures the priority of this infrastructure over conventional road-based approach and encourages more local economic interaction.
8. Frequent Services are shown to encourage the desirability of travel, the quality of the light rail stations and therefore the urban environment. Frequency needs to be managed to reflect the user demand in both the peak and non-peak periods.
Ownership of the above strategies will have to rest with the public authorities with planning or development control powers situated along the light rail route. The permanence associated with light rail and the positive place-making characteristics would be lost if the necessary long term commitment to light rail is not entrenched in the overall planning of land uses within the wider light rail corridor, to capture the economic benefit associated with a light rail system.
There is therefore a need to integrate light rail into city planning schemes so as to not lose any opportunities to systematically guide the urban streetscape and abutting economic development towards the implementation of the light rail system.
Perth Light Rail Study T:\78105106 - Perth Light Rail\00\doc\reports\Final Report\Perth Light Rail Study Report_13Aug07_Final.doc Revision 0 13 August 2007 Page 136

13.0 Light Rail in a Future Central Perth 13.1 A Strategic Context - Network City Priority Strategies for the Future The following strategies are specific priorities for the Perth and Peel area as detailed in the WAPC Network City document. The light rail alignment can satisfy the initiative of the following four priority strategies:
� Priority Strategy 21: Integrate local and longer-distance transport needs to support the Network City with a view to decreasing car dependency
� Priority Strategy 22: Ensure that transport within activity corridors complements and links activity centres and supports the corridor concept
� Priority Strategy 23: Enhance the safety and efficiency of the “transport corridors” � Priority Strategy 24: Improve the viability of the public transport system by encouraging balanced
ridership between activity centres, to reduce the extent of unused system capacity
A light rail link between Subiaco and East Perth could potentially be the centre of a new light rail network for central Perth, which in future could branch out across the inner metropolitan Perth area, thereby further satisfying the objectives of the State Government priority strategies for transport. The alignment choices for this initial light rail route therefore have been made in the context of what role it will have in a future network and how a future network may grow.
13.2 Future Light Rail Network A central route through the Perth CBD and Subiaco Activity Centre would be a suitable choice for the core of an extended system as these locations will always have a steady demand for transport due to their popularity as employment and residential locations as well as recreation and entertainment precincts.
There are other key trip generators external to the core route that could act as anchors for new termini in the inner metropolitan area, including:
� Perth Airport � Curtin University � North-eastern inner suburbs (Mt Lawley to Embleton) � North-western inner suburbs (Northbridge to Yokine) � South-eastern inner suburbs (Victoria Park to Waterford) � Challenge Stadium
There may also be significant demand for an orbital route connecting the inner suburbs, from Claremont to South Perth via Mount Claremont, Floreat, Wembley, Leederville, North Perth, Inglewood, Maylands, Belmont, Riverdale, Lathlain, Victoria Park and Kensington. This orbital route would provide interchange opportunities with the radial routes, and could also share the alignment linking the Perth Airport with Perth CBD, which would increase service frequencies on that line.
Figure 13.1 is a schematic diagram that illustrates the inner, outer and orbital sub-networks that could form an efficient, useful and integrated light rail system for the inner metropolitan Perth area.
Perth Light Rail Study T:\78105106 - Perth Light Rail\00\doc\reports\Final Report\Perth Light Rail Study Report_13Aug07_Final.doc Revision 0 13 August 2007 Page 137

Figure 13.1 Schematic Diagram of the Future Light Rail Network
Examples of potential future light rail lines have been given a photographic context in Figure 13.2where the core route developed by this study is shown as a solid red line in the centre.
Figure 13.2 Future Light Rail Network
Sou
rce
of a
eria
l im
ager
y: w
ww
.map
s.go
ogle
.com
.au
Morley Yokine
Airport
Curtin University
University of Western Australia
ChallengeStadium
Perth CBD and the Esplanade
Morley CAD
PerthAirport
Yokine
CAD
CurtinUniversity
Challenge Stadium
Perth Foreshore
PerthCBD
Claremont
Leederville MountLawley
VictoriaPark
Belmont
UWA
Perth Light Rail Study T:\78105106 - Perth Light Rail\00\doc\reports\Final Report\Perth Light Rail Study Report_13Aug07_Final.doc Revision 0 13 August 2007 Page 138

The capacity of the track system in the core area would need to be capable of carrying multiple routes serving northern and southern destinations as well as those planned as part of this study to the west and east.
Detailed feasibility investigations would be required into any of the extensions suggested in Figures 13.1 and 13.2, particularly to confirm the suitability of light rail as a transit mode for these destinations, demand for services, and provide more detail on physical route viability.
13.3 Issues for Resolution The successful implementation and ultimate expansion of a light rail system in Perth will be governed by the ability to implement the proposed core route and to resolve a number of major construction issues, including the following:
1) Crossing of the Mitchell Freeway and commuter rail reserve in the Leederville area – Considering that Loftus Street / Thomas Street is heavily congested the possibility of a dedicated bridge structure for light rail might be required.
2) Crossing of the Mitchell Freeway and commuter rail reserve in the East Perth area – The wide freeway and rail reservation in this area will make it very difficult to provide a new / dedicated bridge for light rail. Barrack Street / Beaufort Street (across the Graham Farmer tunnel might be the only viable option as the Lord Street and Plain Street approaches to the Freeway are too steep.
3) Crossing the Swan River in East Perth – Extending the light rail east to the Perth Airport and south to Curtin University and potentially beyond will necessitate crossing the Swan River via the Causeway, potentially utilising the existing bus lanes, but interaction between bus services and a light rail system as well as space constraints at the bus interchange will have to be resolved.
The preparation of a business case for light rail will also need to ensure the use of the most up to date population and demographics data to support accurate patronage calculation assumptions.
Perth Light Rail Study T:\78105106 - Perth Light Rail\00\doc\reports\Final Report\Perth Light Rail Study Report_13Aug07_Final.doc Revision 0 13 August 2007 Page 139

14.0 ConclusionsThe purpose of this study has been to assess the feasibility of a light rail service that could link Subiaco with East Perth, and to investigate the physical dimensions of a light rail system that could be suitable for Perth, including:
� A detailed review of technological options � An assessment of the impact of a light rail system on:
– Existing public transport services and patronage – Traffic circulation patterns – Public on-street facilities – The development potential of adjacent land – Other planning issues
The study scope also included the development of a concept design and a preliminary costing of the infrastructure, discounting the cost associated with the redevelopment of two inner city buildings on Barrack Street.
14.1 Findings The main findings of the study have been split into the following short summaries that conclude key issues contained within the project scope and investigated during the course of this study:
� The Role of Light Rail in the Study Area � Light Rail Technology and Options for Perth � Route Alignment Selection and Design � Traffic Modelling � Patronage Assumptions � Preliminary Construction and Maintenance Costs � A Future Light Rail Network
14.1.1 The Role of Light Rail in the Study Area
The need to provide improved public transport capacity from the QEIIMC and UWA Crawley campus to the Perth CBD was confirmed as another key feature of the study scope and was added to the original concept of generally linking Subiaco Activity Centre to the redeveloped East Perth riverside site study area.
There are two roles that a prospective light rail system could perform that would fulfil one or other aspect of the study scope:
� Light rail as a mass transit system, or� Light rail as a place-making, urban regeneration catalyst
Perth Light Rail Study T:\78105106 - Perth Light Rail\00\doc\reports\Final Report\Perth Light Rail Study Report_13Aug07_Final.doc Revision 0 13 August 2007 Page 140

14.1.2 Light Rail Technology and Options for Perth
A detailed appraisal of technology options has been undertaken, sourcing information from overseas and from within Australia. The following technical, transport management and land use criteria were agreed to be appropriate for the Perth system:
Table 14.1 Technological Design Criteria
Design Element Design Detail Additional Information Traffic SpecificationsThrough traffic lanes 3.2m (minimum) Turning lanes 3.0m (minimum) Signals for right-turning traffic at
major intersections with light rail Parking lanes 2.8 metres Horizontal curve To fit unarticulated single unit Kerb height 100mm Light Rail SpecificationsTwo-way, parallel running 7.314m In centre or set to one side in one-
way traffic Track gauge 1.435m Track Gradient 6.5% maximum over 300m Platform length 26m Total stop length 40-50m Stop length relative to stop type,
position and grade of road Platform Width Central – 4.0m minimum
Island – 3.0m minimum Kerbside – 2.4m minimum
Platform height 260mm To be confirmed based on design height of light rail vehicles
Gradient at stop 3% Based on light rail operations and DDA requirements
Curve radii Desirable 25m Absolute minimum 18m Vehicle Capacity 150 – 300 passengers Operations 5am – 12am Vehicle type Low-floor double-ended, electric Power supply Overhead power supply using
light weight span wires Ground-level pickup may be possible as technology advances
Track surface Brick, block-paved or concrete track for street sections Vegetated track adjacent to parklands and residential areas or in medians
Other Light Rail Design Specifications Depot Two facilities required – one
with heavy maintenance Primary depot (inclusive of heavy maintenance) in East Perth Secondary depot in Jolimont
Light rail priority at intersections along the route Light rail alignment segregated from general traffic as far as possible Majority of stops to be mid-block
Perth Light Rail Study T:\78105106 - Perth Light Rail\00\doc\reports\Final Report\Perth Light Rail Study Report_13Aug07_Final.doc Revision 0 13 August 2007 Page 141

Street Environment Verge width 3.0m minimum on each side
(but strive for wider verges in general)
Width variable dependent on kerbside uses
14.1.3 Route Alignment Selection and Design
Five potential light rail route alignment options were mapped and then assessed through a comparison of benefits and disbenefits with direct relevance to the criteria stipulated within the brief. A single base route was selected for further refinement which included 2 sub route options through Subiaco. The preferred sub route option was confirmed as Rokeby Road, based on it having greater potential for increasing the growth of local area development.
The following issues regarding existing public transport services and future modal integration are relevant to the selected alignment:
� The Red CAT route would be discontinued upon introduction of the light rail � The Free Transit Zone would be maintained. Light rail passengers destined for Subiaco and
Western Suburbs from inside the Free Transit Zone would pay a Zone 1 fare. Any cross-boundary trips between the Cities of Perth and Subiaco would generate at least a Zone 1 fare
� Interchange between heavy and light rail would be possible with Subiaco, Perth Central, William Street and Claisebrook railway stations
� New interchange opportunities would arise between light rail and bus at the Jolimont depot site, Stirling Highway at UWA, and QEIIMC. A revised web of local feeder bus services and cross town regional services will intersect with the light rail at these interchange points providing efficiencies for the public transport network and greater route choice and variety of destinations for public transport users
The following details summarise the width of road reservation required for various entities appropriate for inclusion in a vibrant street environment.
Perth Road Reservations Width (m) Inner City Maximum 20.1 Inner City Minimum 15.9 Outer City Maximum 40 Desirable Road Reserve Activities Ave space required (m) Traffic Lanes 6.4Dedicated light rail lanes 7.5
5.62.8
Easy access light rail stops orOn Street Car Parking orService vehicle bays
2.8
Pedestrian circulation space 61.5 * 1.5 *
Al Fresco Dining Space andTrees orStreet furniture
1 *
Minimum road width with dedicated light rail, street vitality & pedestrian access 28.5m
Perth Light Rail Study T:\78105106 - Perth Light Rail\00\doc\reports\Final Report\Perth Light Rail Study Report_13Aug07_Final.doc Revision 0 13 August 2007 Page 142

The following table details the kerbside uses that will displaced from the streets of the City of Perth, City of Nedlands and City of Subiaco to which the light rail has been assigned.
Displacement of kerbside uses associated with preferred alignment Local Authority Area Perth Nedlands Subiaco Total On-Street Car Parking Bays 447 121 469 1,037 On-Street Motorcycle Parking Bays 13 0 4 17 Bus Zones 23 12 36 71 Loading Zones 19 0 3 22 Taxi Zones 3 1 0 4
The graph below indicates the proportion of the total amount of displaced uses that would occur in each municipality.
0%
20%
40%
60%
80%
100%
On Street Car Parking On Street Motorcycle Parking Bus Zone Loading Zone Taxi Zone
Nedlands Subiaco Perth
The displacement of on street car parking and motorcycle parking spaces will be a significant issue for these Councils. It is expected that further discussions regarding the design of the street environment will need to be undertaken with each Council to ensure that the changes imposed by introducing a large new piece of public transport infrastructure can occur in an acceptable manner. These municipalities will gain the great benefit of hosting the light rail system and reaping the local economic, social and environmental rewards of reduced dependency on car travel and the anticipated injection into local area business and vitality. The convenience of car parking associated with current travel behaviour could potentially be outweighed by the greater convenience of clean, fast and efficient light rail transit.
14.1.4 Traffic Modelling
Transport modelling undertaken using SATURN and aaSIDRA can be viewed as conservative because no allowance has been made for a potential reduction in traffic volumes, which will most likely occur as a result of a mode shift towards public transport or the redistribution of vehicle trips away from the light rail route.
Perth Light Rail Study T:\78105106 - Perth Light Rail\00\doc\reports\Final Report\Perth Light Rail Study Report_13Aug07_Final.doc Revision 0 13 August 2007 Page 143
In general the results of the SATURN Modelling show no fatal flaws along the proposed light rail route, although some intersections may be subject to long delays. Results from the assessment of isolated intersections conclude that some increased congestion will occur at particularly the intersections of Rokeby Road / Bagot Road and Stirling Highway / Broadway / Hampden Road. Anticipated negative impacts that could result from the implementation of a light rail route could be addressed through the reintroduction of two-way traffic along a number of current one-way routes such as William Street and Barrack Street in a north-south axis and Murray Street and Roberts Road in an east-west axis.
14.1.5 Patronage
The light rail system would be used by people living and/or working within reasonable walking distance from a light rail stop and people who currently use the Red CAT. A large number of people are expected to use the system to and from UWA, QEIIMC and within Perth CBD particularly during the AM, lunch and PM peak periods. The total daily weekday patronage on the light rail system can be estimated as the sum of the residential and employee use, plus the QEIIMC/UWA specific growth and the lunch peak Red CAT patronage. A conservative estimate equates to around 45,600 trips each day.
14.1.6 Feasibility and Costs
A concept design was drawn up for the preferred alignment inclusive of the design parameters agreed regarding technological options and street environment. It was found that the alignment is physically possible to implement, and it is probable that increased economic activity would occur alongside the light rail corridor, however there are a number of issues that would require further consideration and investigation, such as the:
� Position of the light rail within a one-way vehicular environment � Detailed position of light rail stops to fulfil DDA requirements and permit access to minor roads � General issue regarding the provision of numerous property access points through the central
area� Economic impact of light rail on local centres � Net impact on local business due to the removal of on-street car parking on the route through
activity centres and corridors
The concept design attempted to ensure that the light rail corridor was separate from the vehicle carriageways for as much of the route as physically possible without causing detriment to the pedestrian environment and general street amenity; however there are a few locations where mixed traffic and light rail corridors have been proposed. A traffic management plan would need to accompany the detailed design for each of these sections of the alignment.
It is estimated that the following key costs for light rail will be:
� Infrastructure costs at $252 million � Rolling stock costs at $140 million � Annual operating costs at $10 million
The infrastructure cost estimate includes indicative costs for land acquisition of the two depot sites and a 10 percent provision for urban design and place-making initiatives.
Perth Light Rail Study T:\78105106 - Perth Light Rail\00\doc\reports\Final Report\Perth Light Rail Study Report_13Aug07_Final.doc Revision 0 13 August 2007 Page 144

14.1.7 Future Light Rail Network
A light rail link between Subiaco and East Perth could potentially be the core of a new light rail network for central Perth, which in future could branch out across the inner metropolitan Perth area, thereby further satisfying the objectives of the WA State Government priority strategies for transport and urban development.
A central route through the Perth CBD and Subiaco Activity Centre would be a suitable choice for the core of an extended system. Other key trip generators external to the core route that could act as anchors for new termini in the inner metropolitan area would include:
� Perth Airport � Curtin University � North-eastern inner suburbs (Mt Lawley to Embleton) � North-western inner suburbs (Northbridge to Yokine) � South-eastern inner suburbs (Victoria Park to Waterford) � Challenge Stadium
There may also be significant demand to connect Claremont to South Perth via an orbital route connecting the following inner suburbs: � Claremont, Wembley, Leederville, North Perth, Inglewood, Maylands, Belmont, Victoria Park,
South Perth This orbital route would provide interchange opportunities with the radial routes, and could also share the alignment linking the Perth Airport with Perth CBD, which would increase service frequencies on that line.
The successful implementation and ultimate expansion of a light rail system in Perth will be governed by the ability to implement the proposed core route and in reaching resolution of the following physical constraints:
1) Crossing of the Mitchell Freeway and commuter rail reserve in the Leederville area 2) Crossing of the Mitchell Freeway and commuter rail reserve in the East Perth area 3) Crossing the Swan River via the Causeway in East Perth
14.2 Issues for Resolution Progression of this study’s findings towards project implementation will require a greater level of confidence in a number of analysis areas; these have been listed in Sections 14.2.1 – 3. Crucially, the project will need a champion who will be willing to manage all of the following tasks and to motivate the necessary public, private and government participation in what needs to be a fully integrated project: socially, politically, environmentally, economically and spatially.
14.2.1 Detailed Micro-Simulation Modelling
A reliable and more accurate assessment of transport impacts using a micro-simulation model for the entire study area is seen as critical. There are a number of micro-simulation modelling applications available that can be investigated, including VISIM / VISUM and Paramics. Whichever modelling application is decided on, cooperation will be required between DPI, MRWA, City of Perth and City of Subiaco in making available information and potentially sharing the costs associated with such a comprehensive model.
Perth Light Rail Study T:\78105106 - Perth Light Rail\00\doc\reports\Final Report\Perth Light Rail Study Report_13Aug07_Final.doc Revision 0 13 August 2007 Page 145

14.2.2 Planning and Consultation
A street-by-street design / land use / traffic study will be required to gain a complete understanding of the full impact of the light rail construction and implementation process on traffic patterns, land uses, business functions and associated kerbside amenity, and other street functions. The process would initially involve land owners and key stakeholders, and potentially open up to include a full public consultation.
A greater understanding of the land required for the light rail project, and the planning approvals required to progress the implementation process would also be investigated at this stage.
14.2.3 Patronage Forecasting and Economic Analysis
The scope of this study did not extend to include a full patronage and economic analysis. Should the implementation of a light rail system be progressed and a Business Case be developed then a detailed Patronage Forecasting Study, using the core assumptions adopted in this study, will have to be undertaken. A full economic analysis will also be required including determining the potential benefit-cost ratio of the proposed system.
Perth Light Rail Study T:\78105106 - Perth Light Rail\00\doc\reports\Final Report\Perth Light Rail Study Report_13Aug07_Final.doc Revision 0 13 August 2007 Page 146

15.0 ReferencesAustroads (1996) Standard Highway Loading
Australian Bureau of Statistics (2001) Census Data
Australian Bureau of Statistics (1996) Estimated Stocks of Dwellings Western Australia
City of Perth (2007) Five Year Works Plan
Clower, Weinstein. (2002) An Assessment of the DART LRT on Taxable Property Valuation and Transit Oriented Development in Dallas
Department for Planning and Infrastructure (2004) Network City
Department of Infrastructure (2006) Design Requirements for Accessible Tram Stops
Disability Discrimination Act (1992)
Disability Standards for Accessible Public Transport (2002)
Edge, J. (2003) The Impact of Transport Schemes of Land Values: What is the Evidence?
Gibbons, S. Machin, S. (2003) Rail Access and House Prices: An Evaluation of TransportImprovement Benefits
Halpern Glick Maunsell (2002) Inner City Transport Study
Ministry of Planning (1995) Metropolitan Land Use Forecasting Systems 1991 - 2026
Newman, P. Kenworthy, J. R. (1999) Sustainability and Cities: Overcoming Automobile Dependence
Parsons Brinkerhoff (no date) Gold Coast Light rail Feasibility Study, Stage C Option Assessment
Public Transport Authority (2004) A Report on the CAT Buss Passenger Count
Public Transport Authority (2004) A Report on the Free Transit Zone Passenger Count
Public Transport Authority (2006) Existing Perth CAT Bus Network
Sinclair Knight Merz (2004) Travel Survey Results, Royal Perth Hospital
Sinclair Knight Merz (2005) Streetcar Inner City Transport System for Perth
Sinclair Knight Merz (2005) Streetcar Inner City Transport System for Perth – Pre-Feasibility Study in Relation to the Subiaco Area
Sinclair Knight Merz (2007) Draft Report – University of Western Australia / Queen Elizabeth II Medical Centre / Hollywood Private Hospital Public Transport Masterplan
South East Wisconsin Regional Planning Commission (1998) Feasibility Study
Transit Australia (2005) LRT Signage Images, Melbourne
University of Western Australia (2005) Strategic Directions
Western Australia Planning Commission (2005) WA Tomorrow
WebsitesAerial Imagery www.maps.google.com.auBarcelona Images www.tramvia.orgLibertin Light Rail Thematic Network Report (2005) http://www.libertin.infoSan Francisco Images http://en.wikipedia.org.wiki.Muni_MetroSiemens Images www.transportation.siemens.comYarra Trams Images www.vicroads.vic.giv.au
All other photo images in Chapter Five – Faber Maunsell UK – Photo Library Collection
Perth Light Rail Study T:\78105106 - Perth Light Rail\00\doc\reports\Final Report\Perth Light Rail Study Report_13Aug07_Final.doc Revision 0 13 August 2007 Page 147

Appendices
Please refer to Volume 2 for Appendices.
Perth Light Rail Study T:\78105106 - Perth Light Rail\00\doc\reports\Final Report\Perth Light Rail Study Report_13Aug07_Final.doc Revision 0 13 August 2007 Page 148