perspectives on intensive, marine shrimp production using ... are okay to use 10-2-18/2018 ksu...
TRANSCRIPT

Perspectives on intensive, marine shrimp production using minimal-exchange indoor systems
Douglas H. Ernst, Ph.D.CTO, Planet Shrimp Inc., Ontario, Canada
▪ Opportunity and state of industry▪ Production planning▪ Culture tank and RAS design▪ Biofloc technology▪ Clear-water technology
Indoor Shrimp Farming WorkshopKentucky State University, Sept 14-15, 2018
© Douglas H. Ernst (2018)
© DH Ernst (2018)
Pacific white shrimp ( Penaeus vannamei )
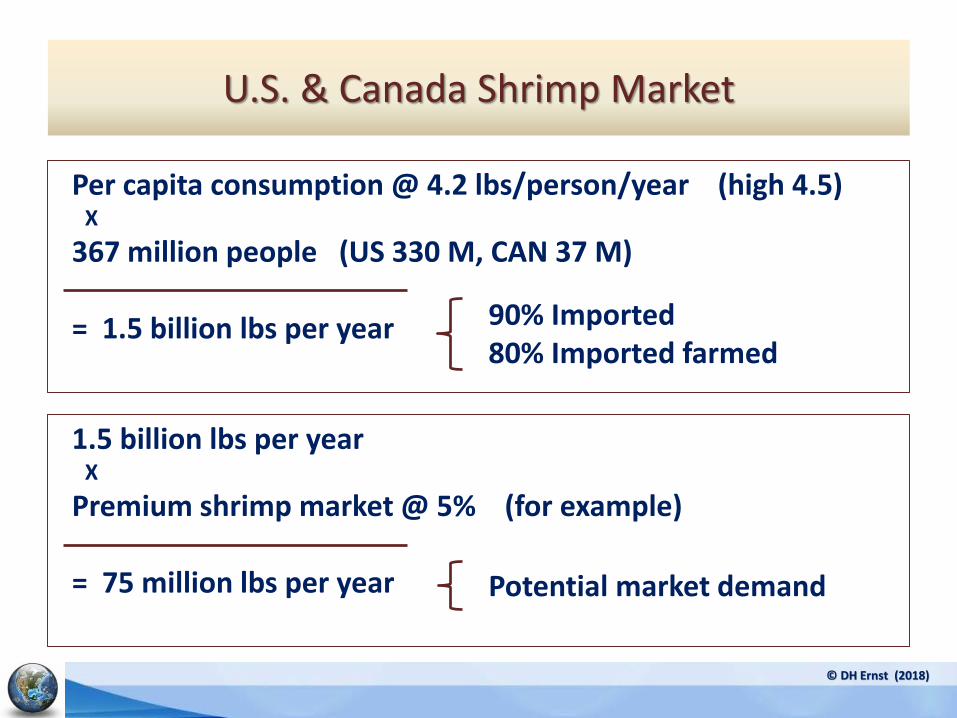
U.S. & Canada Shrimp Market
Per capita consumption @ 4.2 lbs/person/year (high 4.5) X
367 million people (US 330 M, CAN 37 M)
= 1.5 billion lbs per year 90% Imported80% Imported farmed
1.5 billion lbs per yearX
Premium shrimp market @ 5% (for example)
= 75 million lbs per year Potential market demand
© DH Ernst (2018)
0
2
4
6
8
10
12
14
Mill
ion
P
ou
nd
s
Year
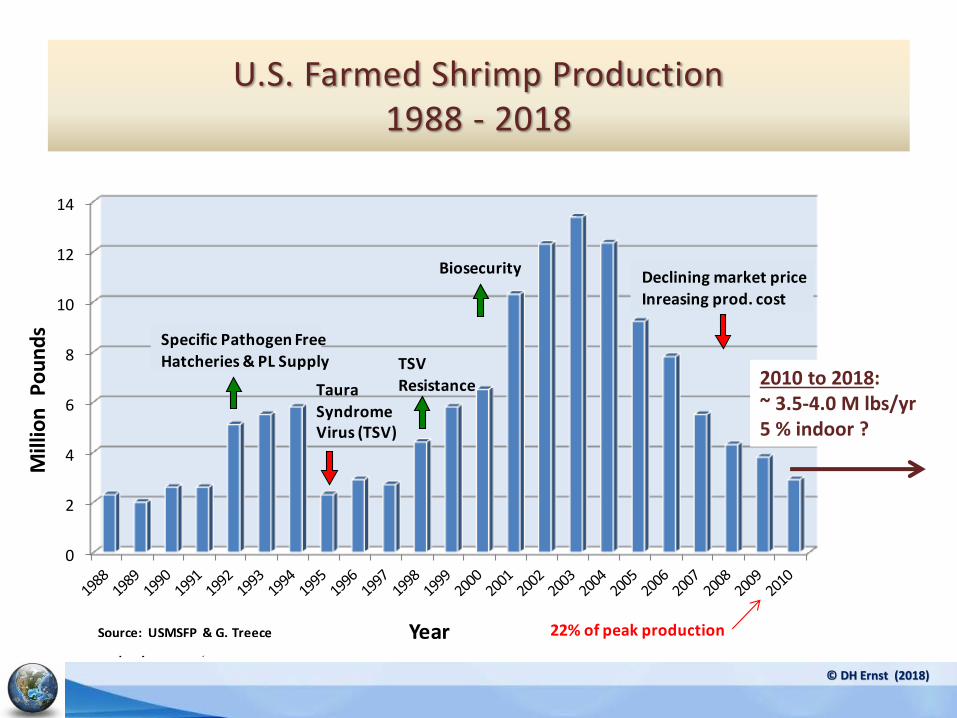
U.S. Farmed Shrimp Production 1988 - 2010
Source: USMSFP & G. TreecePrep. by DH Ernst, 2010
Specific Pathogen Free
Hatcheries & PL Supply
TauraSyndromeVirus (TSV)
TSVResistance
BiosecurityDeclining market priceInreasing prod. cost
22% of peak production
2010 to 2018: ~ 3.5-4.0 M lbs/yr5 % indoor ?
© DH Ernst (2018)
U.S. Farmed Shrimp Production1988 - 2018
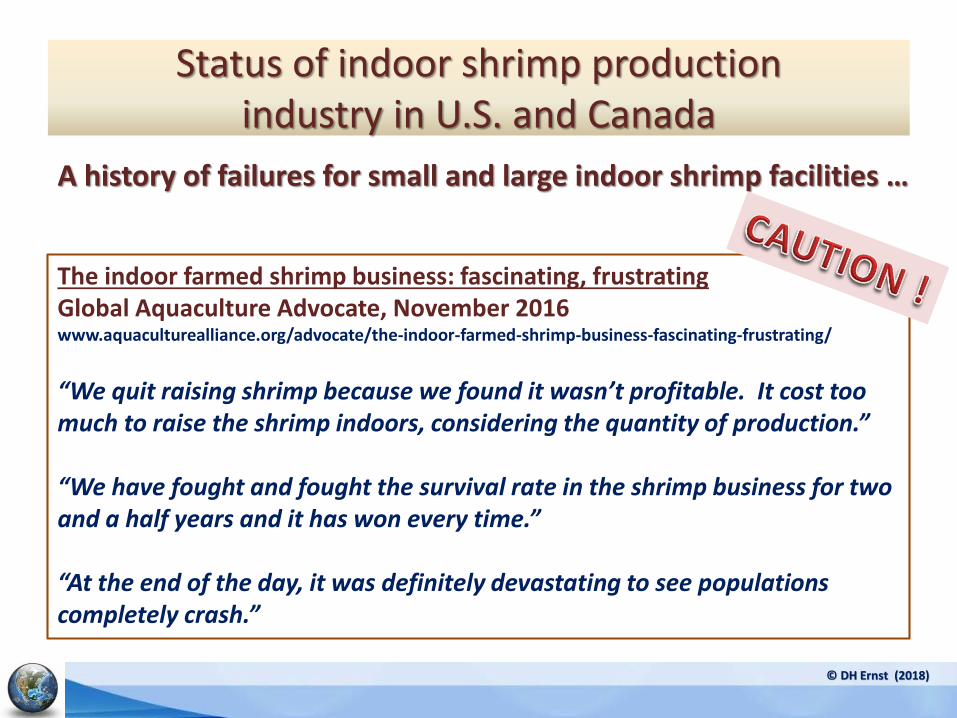
Status of indoor shrimp production industry in U.S. and Canada
The indoor farmed shrimp business: fascinating, frustratingGlobal Aquaculture Advocate, November 2016www.aquaculturealliance.org/advocate/the-indoor-farmed-shrimp-business-fascinating-frustrating/
“We quit raising shrimp because we found it wasn’t profitable. It cost too much to raise the shrimp indoors, considering the quantity of production.”
“We have fought and fought the survival rate in the shrimp business for two and a half years and it has won every time.”
“At the end of the day, it was definitely devastating to see populations completely crash.”
A history of failures for small and large indoor shrimp facilities …
© DH Ernst (2018)

Design stage Objectives
Production plan
Production intensity
Target shrimp production (kg/week)
Target harvest density (kg/m3)
Stocking and harvest cycles, culture periods
Production staging: PL nursery --> Growout
Facility size
Water reuse intensity
RAS design
Culture volumes for biomass & density levels
System water exchange (%/day)
System type & required water treatment
Biofloc, hybrid, and clear water RAS
Infrastructure design
Enterprise budgets
Infrastructure, buildings, utilities, personnel
Net costs & revenues
Shrimp Farm Design Procedure
© DH Ernst (2018)
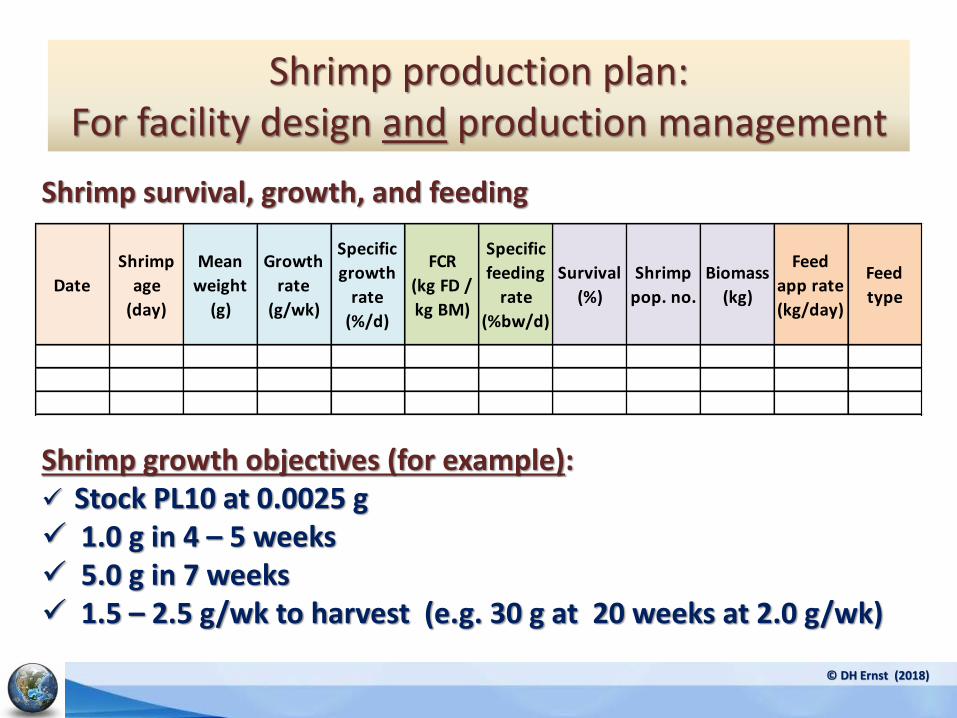
Shrimp production plan: For facility design and production management
© DH Ernst (2018)
Shrimp growth objectives (for example): ✓ Stock PL10 at 0.0025 g ✓ 1.0 g in 4 – 5 weeks✓ 5.0 g in 7 weeks✓ 1.5 – 2.5 g/wk to harvest (e.g. 30 g at 20 weeks at 2.0 g/wk)
Date
Shrimp
age
(day)
Mean
weight
(g)
Growth
rate
(g/wk)
Specific
growth
rate
(%/d)
FCR
(kg FD /
kg BM)
Specific
feeding
rate
(%bw/d)
Survival
(%)
Shrimp
pop. no.
Biomass
(kg)
Feed
app rate
(kg/day)
Feed
type
Shrimp survival, growth, and feeding
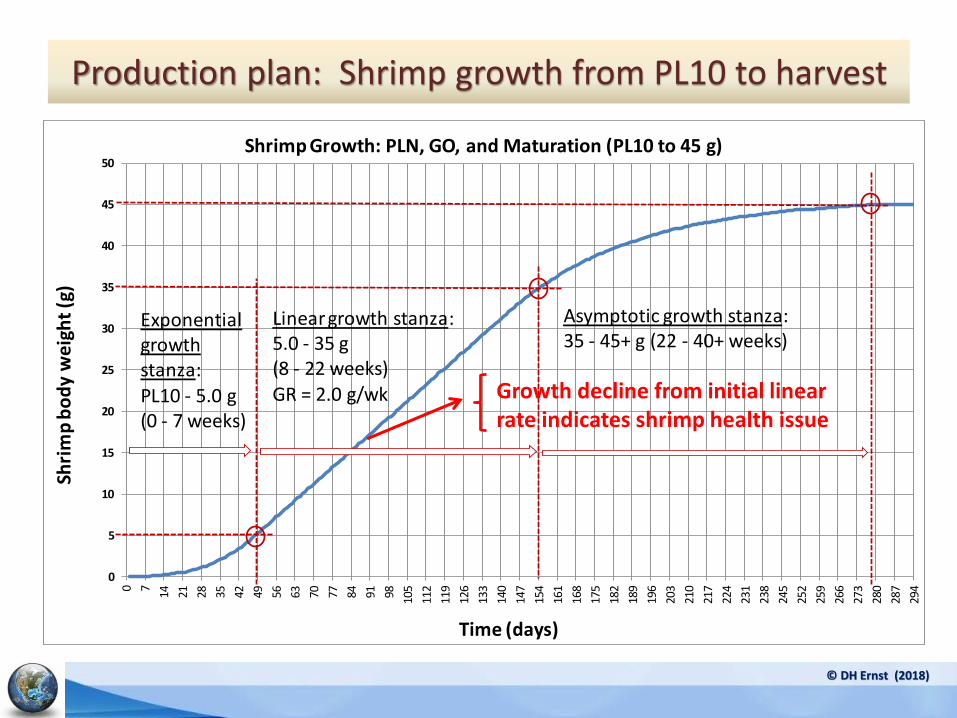
Production plan: Shrimp growth from PL10 to harvest
© DH Ernst (2018)
Decline in growth from initial linear slope indicates shrimp health issues
0
5
10
15
20
25
30
35
40
45
50
0 7
14 21 28 35 42 49 56 63 70 77 84 91 98 105
112
119
126
133
140
147
154
161
168
175
182
189
196
203
210
217
224
231
238
245
252
259
266
273
280
287
294
Shri
mp
bo
dy
we
igh
t (g
)
Time (days)
Shrimp Growth: PLN, GO, and Maturation (PL10 to 45 g)
Linear growth stanza: 5.0 - 35 g (8 - 22 weeks)GR = 2.0 g/wk
Asymptotic growth stanza: 35 - 45+ g (22 - 40+ weeks)
Exponentialgrowthstanza: PL10 - 5.0 g (0 - 7 weeks)
Growth decline from initial linear rate indicates shrimp health issue
Feed loading and metabolism: Oxygen consumption & Metabolite excretion
© DH Ernst (2018)
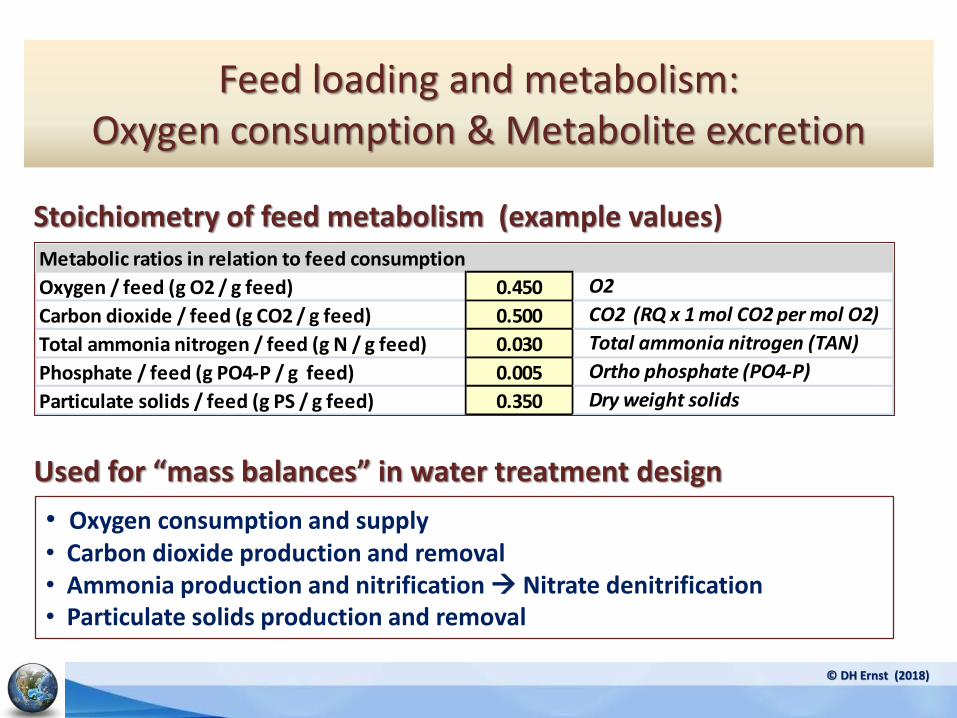
Stoichiometry of feed metabolism (example values)
• Oxygen consumption and supply• Carbon dioxide production and removal• Ammonia production and nitrification → Nitrate denitrification• Particulate solids production and removal
Oxygen / feed (g O2 / g feed) 0.450
Carbon dioxide / feed (g CO2 / g feed) 0.500
Total ammonia nitrogen / feed (g N / g feed) 0.030
Phosphate / feed (g PO4-P / g feed) 0.005
Particulate solids / feed (g PS / g feed) 0.350
Metabolic ratios in relation to feed consumption
O2
CO2 (RQ x 1 mol CO2 per mol O2)
Total ammonia nitrogen (TAN)
Ortho phosphate (PO4-P)
Dry weight solids
Used for “mass balances” in water treatment design
Feed loading and metabolism: Example application to Nitrogen cycle
© DH Ernst (2018)
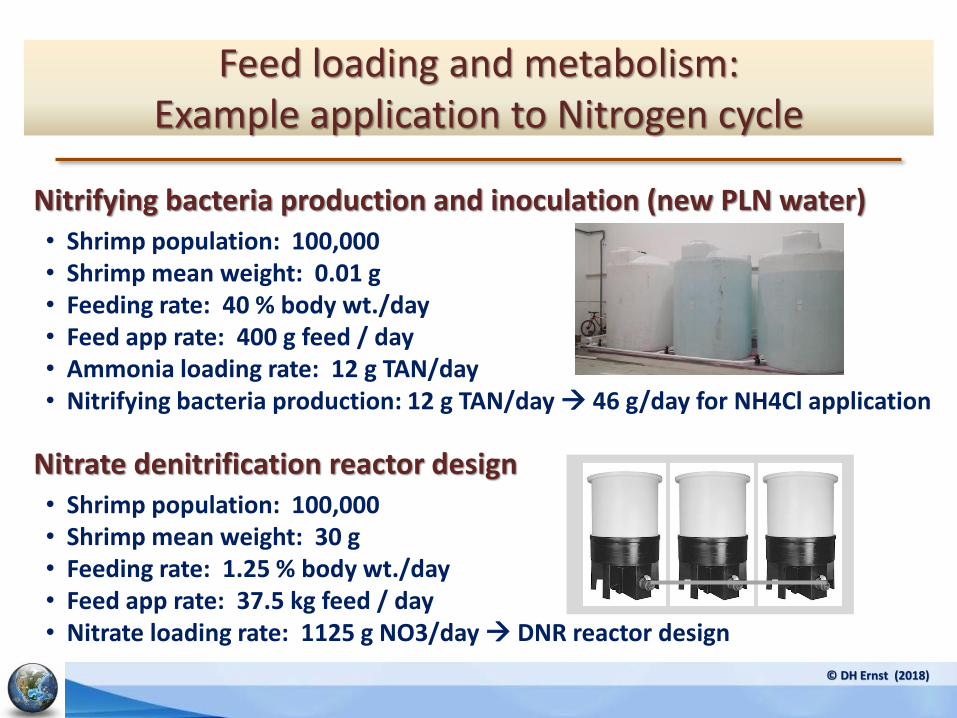
• Shrimp population: 100,000• Shrimp mean weight: 0.01 g• Feeding rate: 40 % body wt./day • Feed app rate: 400 g feed / day • Ammonia loading rate: 12 g TAN/day • Nitrifying bacteria production: 12 g TAN/day → 46 g/day for NH4Cl application
Nitrifying bacteria production and inoculation (new PLN water)
• Shrimp population: 100,000• Shrimp mean weight: 30 g• Feeding rate: 1.25 % body wt./day • Feed app rate: 37.5 kg feed / day • Nitrate loading rate: 1125 g NO3/day → DNR reactor design
Nitrate denitrification reactor design
System type: Biofloc & Clear-Water Technologies
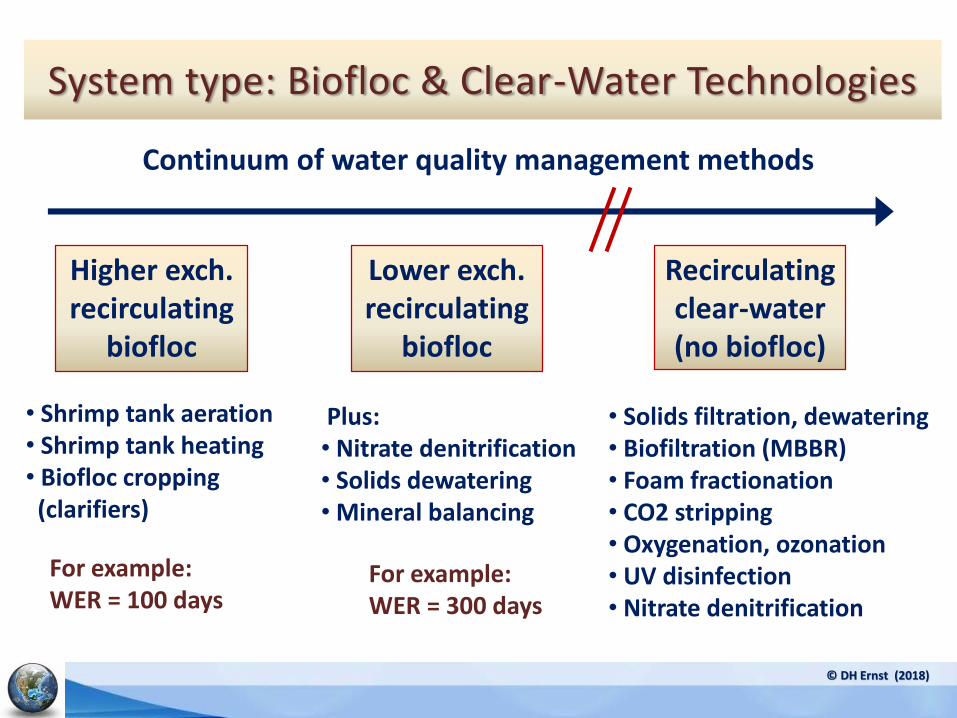
Higher exch.recirculating
biofloc
Lower exch. recirculating
biofloc
Recirculating clear-water(no biofloc)
Continuum of water quality management methods
© DH Ernst (2018)
• Shrimp tank aeration• Shrimp tank heating• Biofloc cropping (clarifiers)
Plus: • Nitrate denitrification• Solids dewatering• Mineral balancing
• Solids filtration, dewatering• Biofiltration (MBBR)• Foam fractionation• CO2 stripping• Oxygenation, ozonation• UV disinfection• Nitrate denitrification
For example:WER = 100 days
For example:WER = 300 days
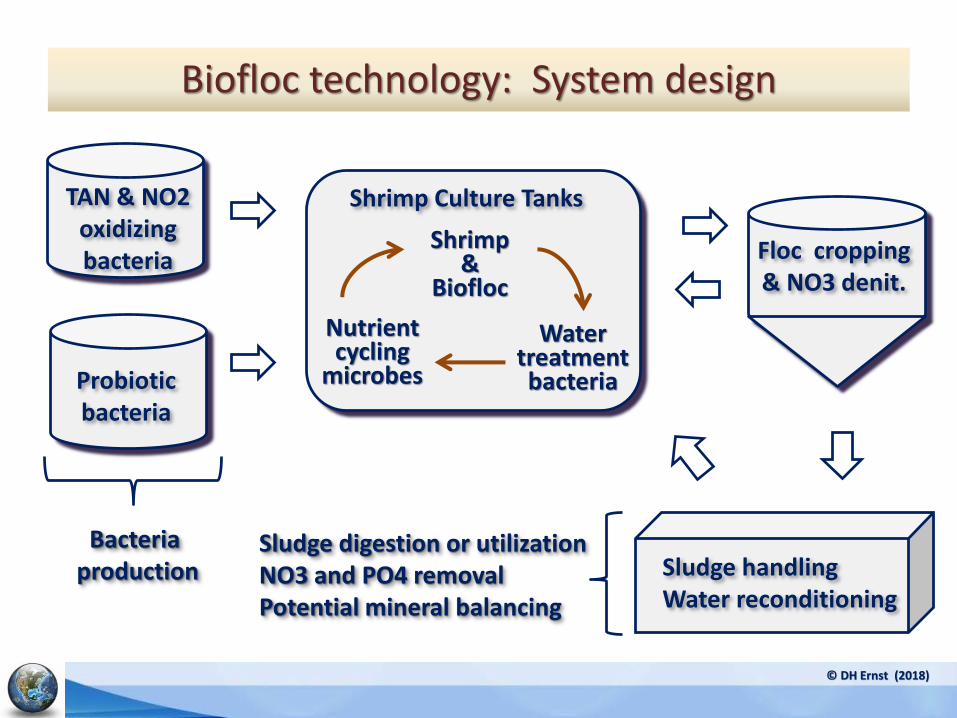
Shrimp Culture TanksTAN & NO2oxidizing bacteria
Probiotic bacteria
Floc cropping& NO3 denit.
Shrimp&
Biofloc
Water treatment bacteria
Nutrient cycling
microbes
Bacteriaproduction Sludge handling
Water reconditioning
Sludge digestion or utilization NO3 and PO4 removalPotential mineral balancing
Biofloc technology: System design
© DH Ernst (2018)
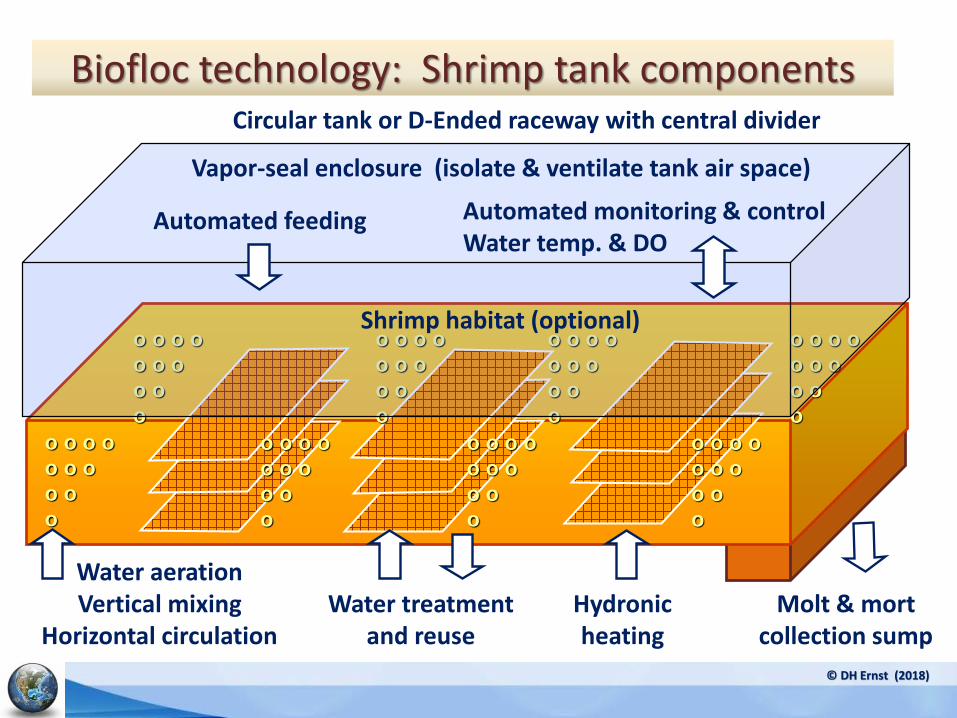
Biofloc technology: Shrimp tank components
© DH Ernst (2018)
o o o o
o o o
o o
o
o o o o
o o o
o o
o
o o o o
o o o
o o
o
o o o o
o o o
o o
o
Water aeration Vertical mixing
Horizontal circulationHydronic heating
o o o o
o o o
o o
o
o o o o
o o o
o o
o
o o o o
o o o
o o
o
o o o o
o o o
o o
o
Water treatmentand reuse
Automated feeding
Shrimp habitat (optional)
Automated monitoring & control Water temp. & DO
Vapor-seal enclosure (isolate & ventilate tank air space)
Molt & mort collection sump
Circular tank or D-Ended raceway with central divider

Biofloc Aeration: Diffusers vs. Nozzles
© DH Ernst (2018)
Nozzle advantages:▪ No maintenance▪ Biofloc particle shear▪ Horizontal water circulation ▪ Small bubble size → High surface area▪ High air/water ratio → CO2 degas
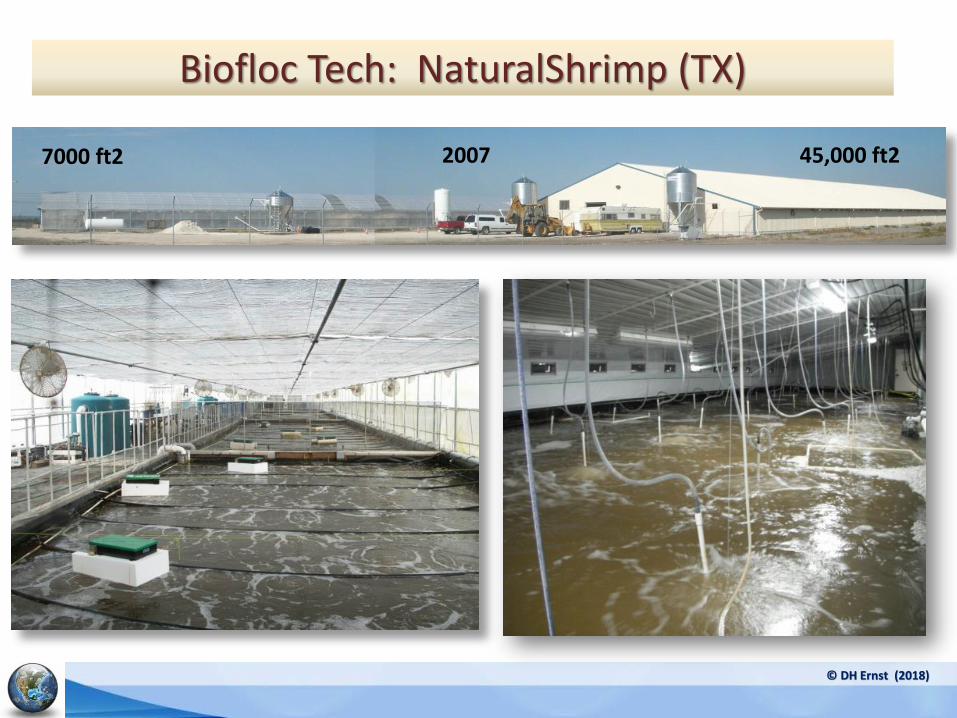
Biofloc Tech: NaturalShrimp (TX)
© DH Ernst (2018)
45,000 ft27000 ft2 2007
Biofloc Tech: NaturalShrimp (TX)
© DH Ernst (2018)
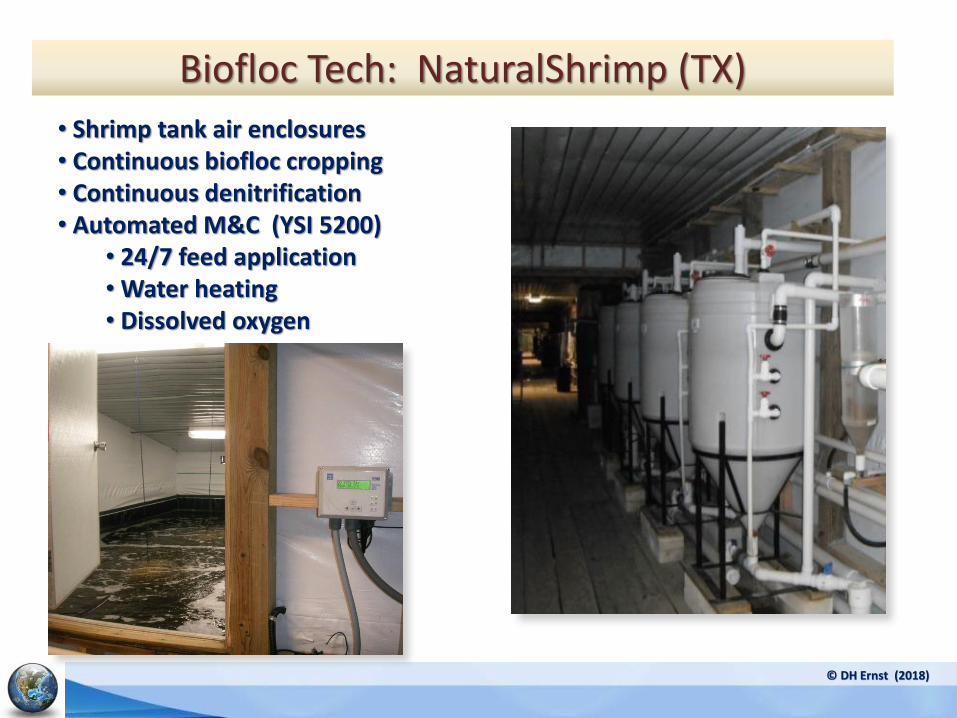
• Shrimp tank air enclosures• Continuous biofloc cropping• Continuous denitrification• Automated M&C (YSI 5200)
• 24/7 feed application• Water heating• Dissolved oxygen

Biofloc Tech: NaturalShrimp (TX)
© DH Ernst (2018)
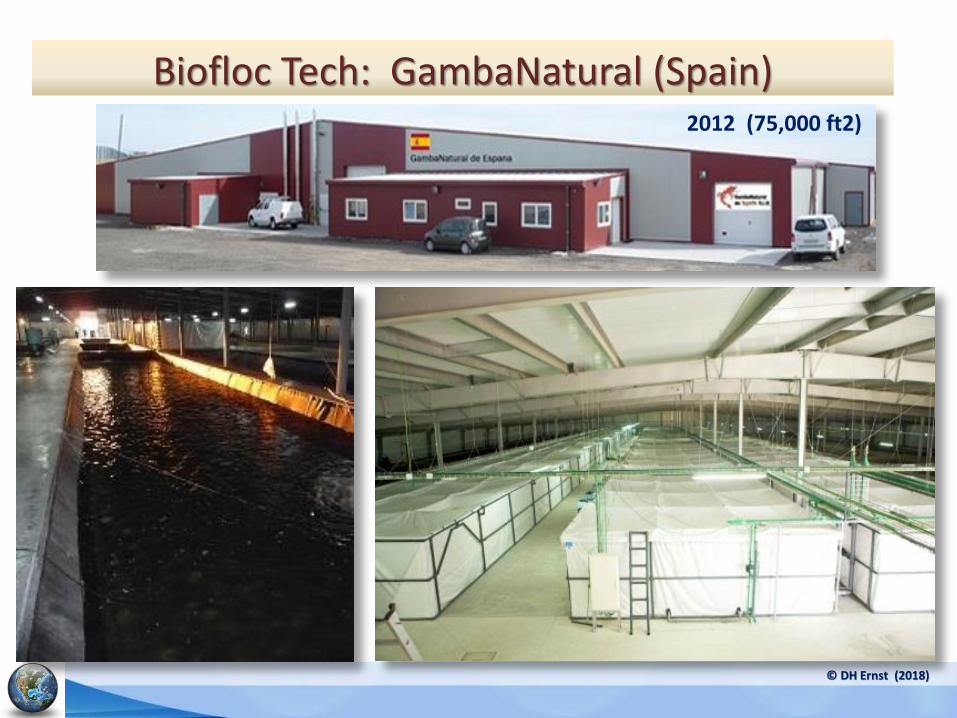
2012 (75,000 ft2)
Biofloc Tech: GambaNatural (Spain)
© DH Ernst (2018)
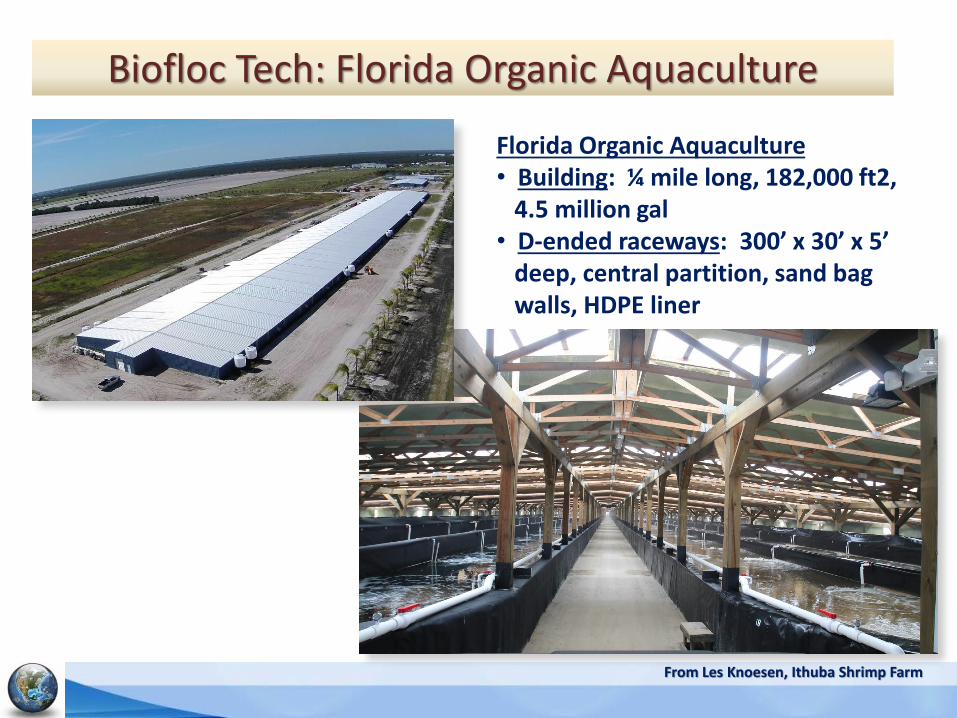
Biofloc Tech: Florida Organic Aquaculture
From Les Knoesen, Ithuba Shrimp Farm
Florida Organic Aquaculture• Building: ¼ mile long, 182,000 ft2,
4.5 million gal• D-ended raceways: 300’ x 30’ x 5’
deep, central partition, sand bagwalls, HDPE liner

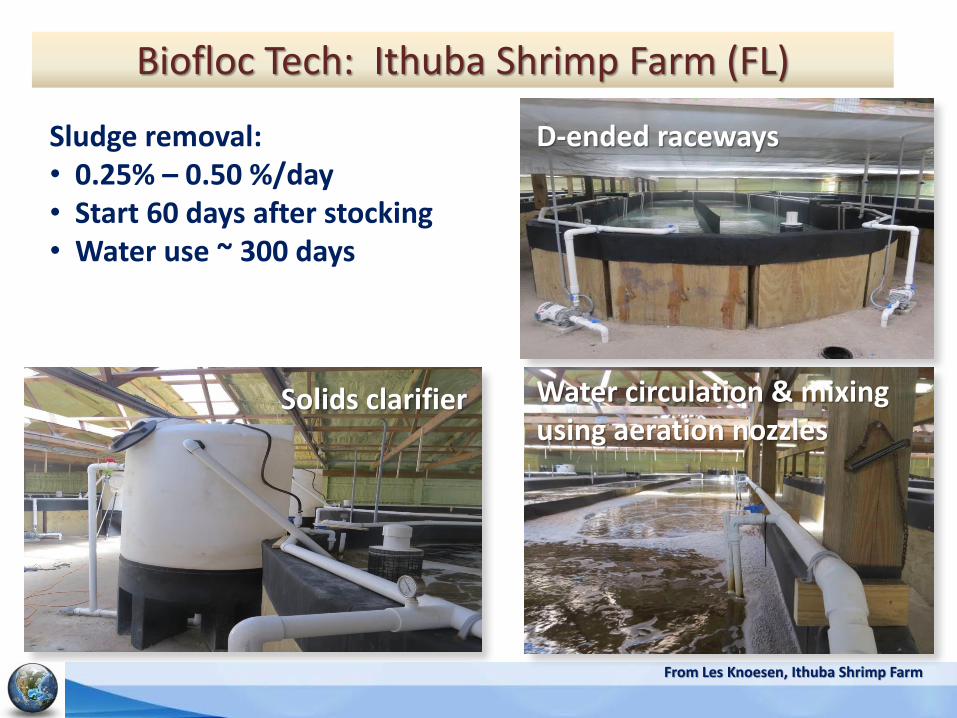
Biofloc Tech: Ithuba Shrimp Farm (FL)
Barn: 160’x 90’ – 14 000 sq. ft. D-ended raceways: 8 RWs, 64’x16’x4’ deep, 25,000 gal, central partition, wood and sand bag walls, HDPE liner Production: 2500 lbs/months
Ithuba Shrimp Farm (Fellsmere, Florida)Les Knoesen ([email protected], +1-561-319-1817, ithubashrimp.com)
From Les Knoesen, Ithuba Shrimp Farm
Biofloc Tech: Ithuba Shrimp Farm (FL)
Sludge removal:• 0.25% – 0.50 %/day• Start 60 days after stocking• Water use ~ 300 days
D-ended raceways
Water circulation & mixing using aeration nozzles
Solids clarifier
From Les Knoesen, Ithuba Shrimp Farm

Back to My Experience: Biofloc + Shrimp = Vibrio
© DH Ernst (2018)
1. Build farm, grow shrimp (2005 – 2007, NaturalShrimp, TX). Studied the literature, built a farm, commenced production at target harvest 10 kg/m3. Achieved good results.
2. Declining performance. At about 12 - 18 months of continuous production, started to see (1) declining shrimp growth and survival and (2) periodic, sudden, catastrophic mortality events (e.g. 10 %/day for 10 days)
3. Seeking causes and solutions. Completed histopathology and PCR. Tissue damage consistent with Vibriosis. Vibrio parahaemolyticus isolated and identified. Vibrio considered to be an opportunistic pathogen. Look for primary stressor.
My Experience: Biofloc + Shrimp = Vibrio
© DH Ernst (2018)
4. Confusion. Primary stressors not found. Multiple shrimp biofloc presentations at aquaculture conferences, but nobody discussing Vibrio bacteria and related production issues.
5. Enlightenment. Published studies are non-continuous production. Therefore, effectively disinfecting between production runs. Lack of reporting for failed studies. Production issues by others in commercial industry also due to Vibrio bacteria?
6. Conclusions. High shrimp density by itself is a trigger for Vibrio virulence. Need to use lower shrimp densities. Or better shrimp genetics? Also use rotational disinfection of water and biofilms to control internal development of virulent Vibrio strains.
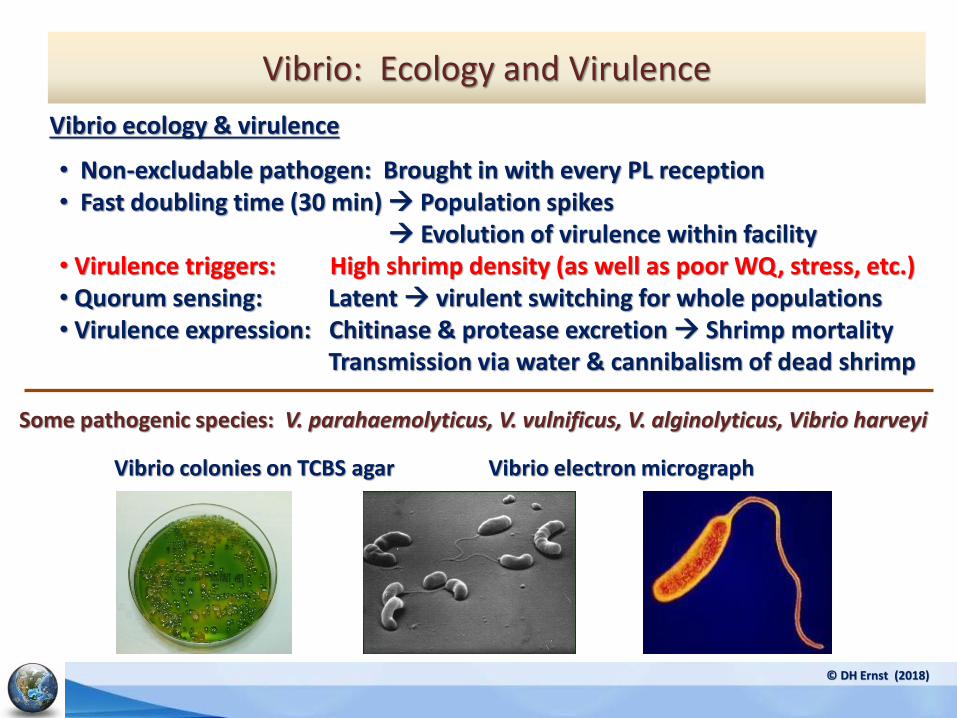
Vibrio electron micrographVibrio colonies on TCBS agar
Vibrio ecology & virulence
• Non-excludable pathogen: Brought in with every PL reception • Fast doubling time (30 min) → Population spikes
→ Evolution of virulence within facility• Virulence triggers: High shrimp density (as well as poor WQ, stress, etc.) • Quorum sensing: Latent → virulent switching for whole populations• Virulence expression: Chitinase & protease excretion → Shrimp mortality
Transmission via water & cannibalism of dead shrimp
Vibrio: Ecology and Virulence
© DH Ernst (2018)
Some pathogenic species: V. parahaemolyticus, V. vulnificus, V. alginolyticus, Vibrio harveyi
Biofloc Technology: Three Key Considerations
© DH Ernst (2018)
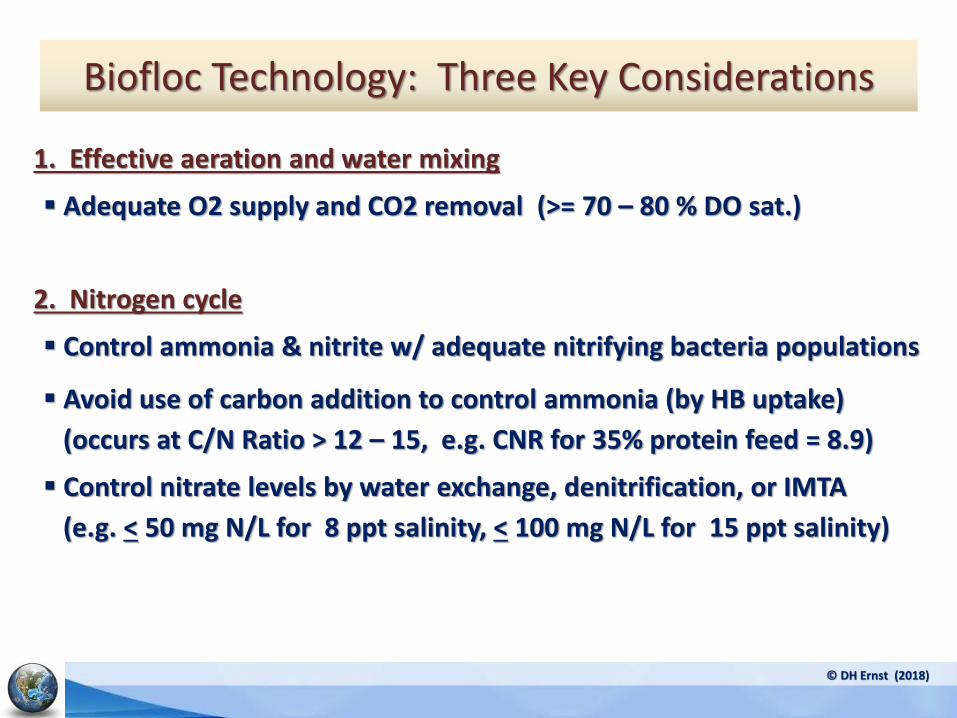
1. Effective aeration and water mixing
▪ Adequate O2 supply and CO2 removal (>= 70 – 80 % DO sat.)
2. Nitrogen cycle
▪ Control ammonia & nitrite w/ adequate nitrifying bacteria populations
▪ Avoid use of carbon addition to control ammonia (by HB uptake)
(occurs at C/N Ratio > 12 – 15, e.g. CNR for 35% protein feed = 8.9)
▪ Control nitrate levels by water exchange, denitrification, or IMTA
(e.g. < 50 mg N/L for 8 ppt salinity, < 100 mg N/L for 15 ppt salinity)
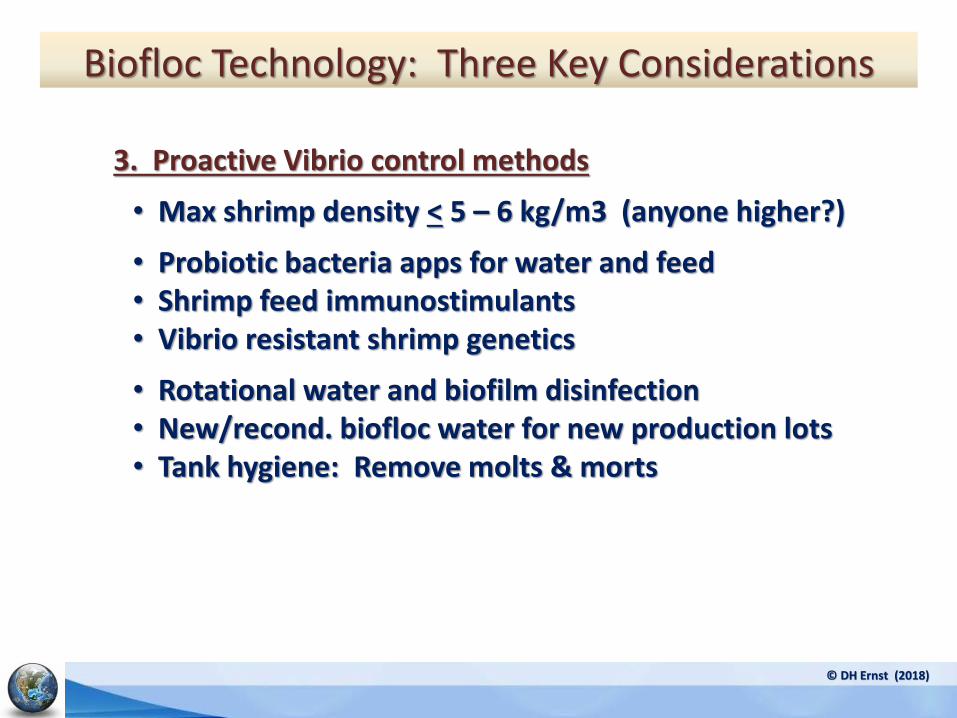
3. Proactive Vibrio control methods
• Max shrimp density < 5 – 6 kg/m3 (anyone higher?)
• Probiotic bacteria apps for water and feed• Shrimp feed immunostimulants• Vibrio resistant shrimp genetics
• Rotational water and biofilm disinfection• New/recond. biofloc water for new production lots• Tank hygiene: Remove molts & morts
Biofloc Technology: Three Key Considerations
© DH Ernst (2018)
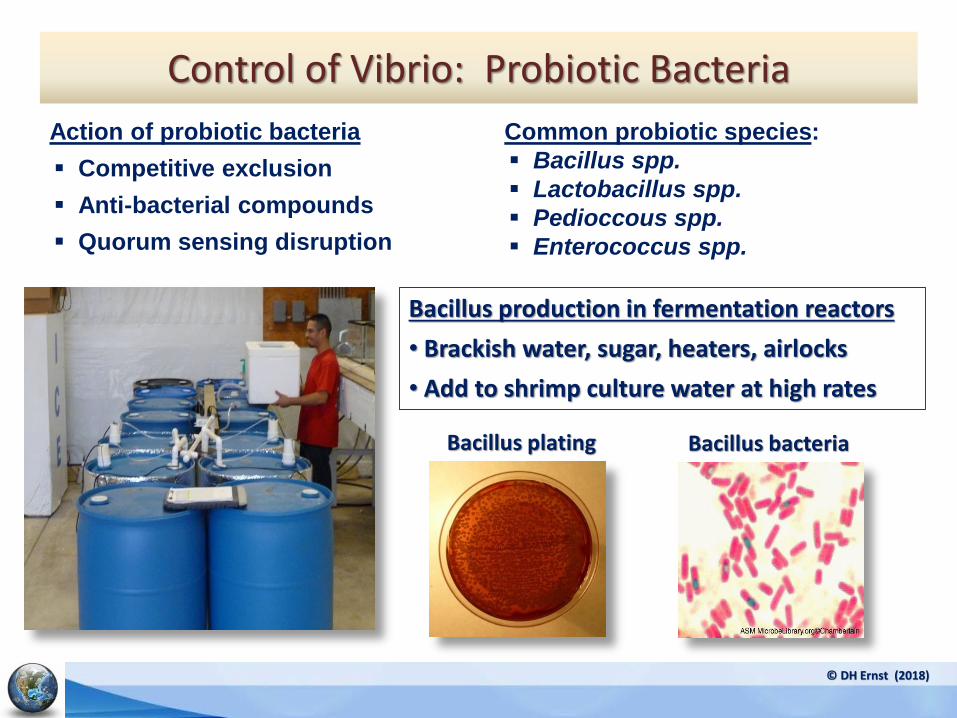
Common probiotic species:
▪ Bacillus spp.
▪ Lactobacillus spp.
▪ Pedioccous spp.
▪ Enterococcus spp.
Action of probiotic bacteria
▪ Competitive exclusion
▪ Anti-bacterial compounds
▪ Quorum sensing disruption
Control of Vibrio: Probiotic Bacteria
© DH Ernst (2018)
Bacillus plating Bacillus bacteria
Bacillus production in fermentation reactors
• Brackish water, sugar, heaters, airlocks
• Add to shrimp culture water at high rates
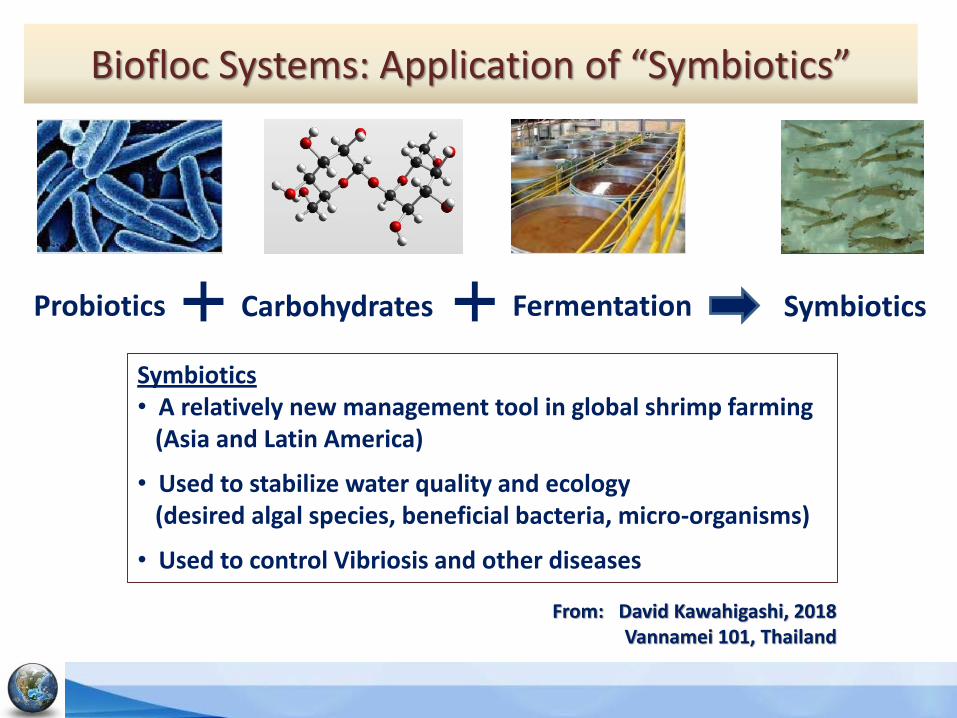
Biofloc Systems: Application of “Symbiotics”
Probiotics Carbohydrates Fermentation Symbiotics
From: David Kawahigashi, 2018Vannamei 101, Thailand
Symbiotics • A relatively new management tool in global shrimp farming
(Asia and Latin America)
• Used to stabilize water quality and ecology(desired algal species, beneficial bacteria, micro-organisms)
• Used to control Vibriosis and other diseases
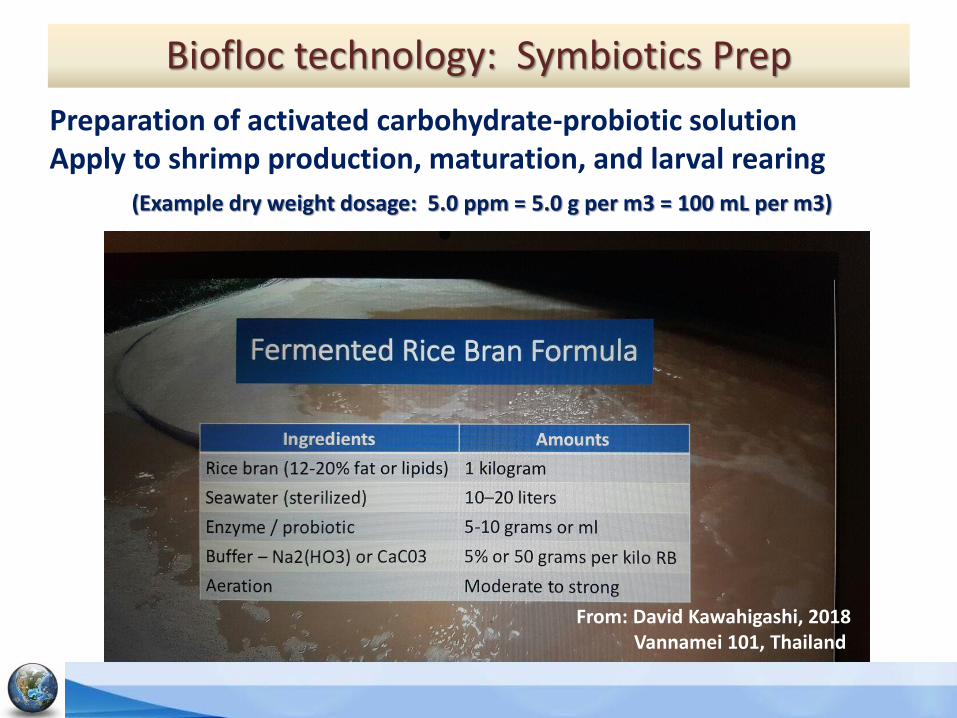
Biofloc technology: Symbiotics Prep
Preparation of activated carbohydrate-probiotic solutionApply to shrimp production, maturation, and larval rearing
From: David Kawahigashi, 2018Vannamei 101, Thailand
(Example dry weight dosage: 5.0 ppm = 5.0 g per m3 = 100 mL per m3)

Biofloc Technology: Application of Symbiotics
Countries using symbiotics: Countries using
symbiotics
Level of
use (%)
Brazil 60%
Ecuador 20%
Belize 100%
Mexico 30%
Korea
(indoor farms)
70%
Thailand 20%
Vietnam 5%
Indonesia 5%
Philippines 1%
China 1%
India 70%
Malaysia 5%© DH Ernst (2018)
From: David Kawahigashi, 2018Vannamei 101, Thailand
Worldwide, see variable use of:
• Aerobic or fermentative production of particulate carbon + probiotic solution
• Carbon sources: Rice bran, soy, sweet potato, cassava, etc.
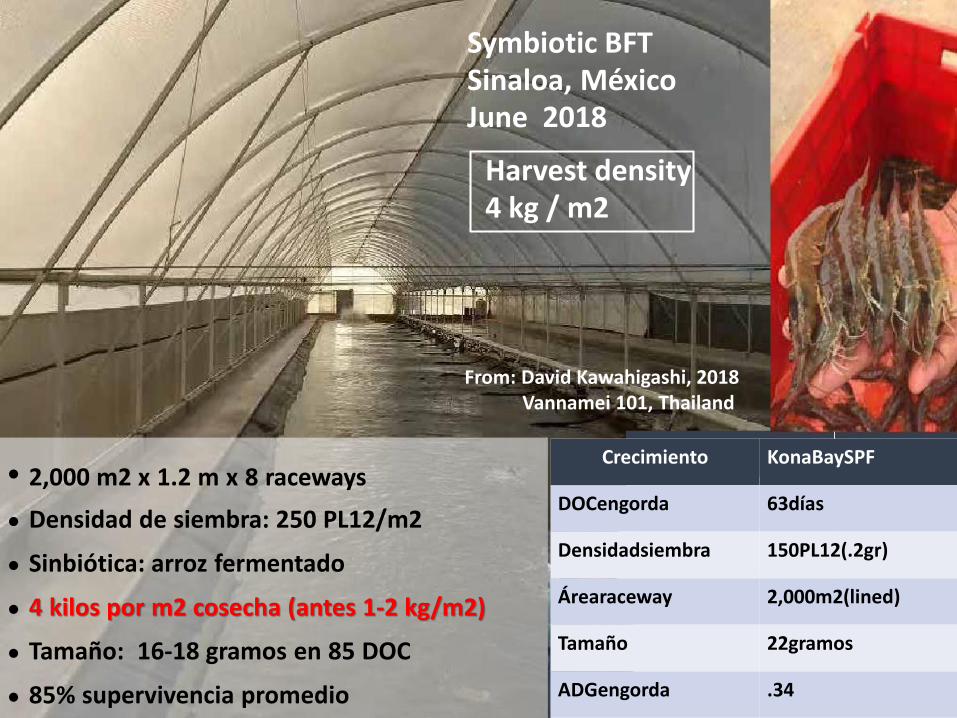
Crecimiento KonaBaySPF
DOCengorda 63días
Densidadsiembra 150PL12(.2gr)
Árearaceway 2,000m2(lined)
Tamaño 22gramos
ADGengorda .34
•
•
•
•
•
•
2,000 m2 x 1.2 m x 8 raceways
Densidad de siembra: 250 PL12/m2
Sinbiótica: arroz fermentado
4 kilos por m2 cosecha (antes 1-2 kg/m2)
Tamaño: 16-18 gramos en 85 DOC
85% supervivencia promedio
Symbiotic BFTSinaloa, MéxicoJune 2018
From: David Kawahigashi, 2018Vannamei 101, Thailand
Harvest density4 kg / m2

Symbiotic Biofloc Technology: South Korea
Camarón vivo => $30-40/kilo2 ciclos al año; pre-cría 30 doc600 m2 raceways x 3 por granja4-6 kilos/m2 por cicloCasi cero recambio / simbióticas
Isla Ganghwa
Isla JejuLenguado avannamei
IndoorRaceway AntesFRB DespuésFRB
Supervivencia 45% 71%
Densidadsiembra 220/m2 300/m2
Pesocosecha 19gramos 20gramos
Kilos/m2 1.8kilos 4.2kilos
Biomasatotal 3,300kilos 7,600kg
Díasdecultivo 167días 118días
FCR 1.6 1.4
From: David Kawahigashi, 2018Vannamei 101, Thailand
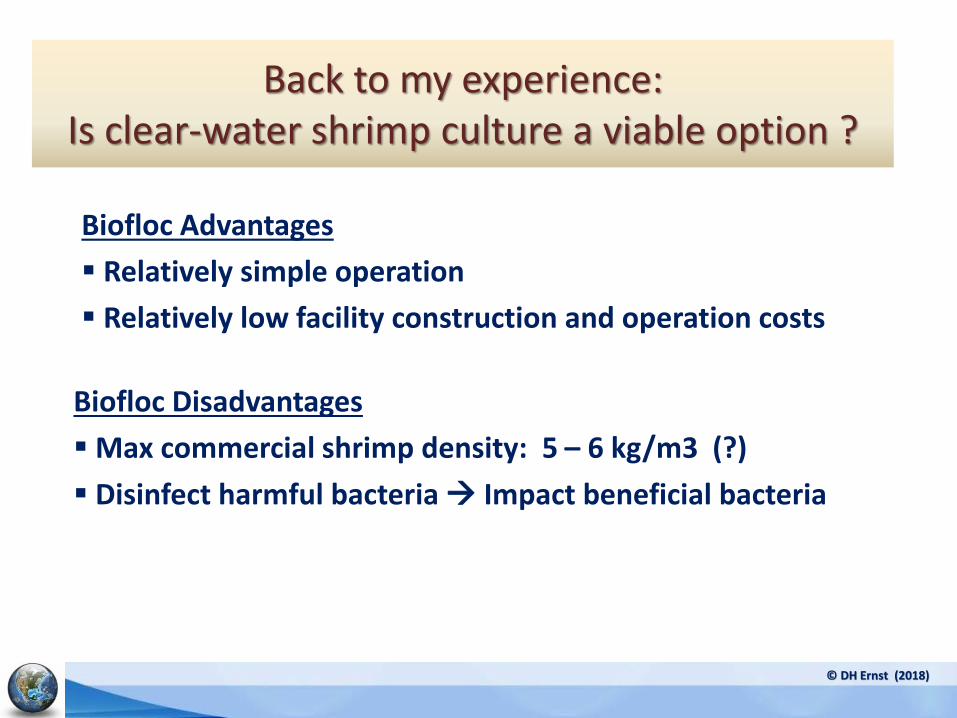
Back to my experience: Is clear-water shrimp culture a viable option ?
© DH Ernst (2018)
Biofloc Advantages
▪ Relatively simple operation
▪ Relatively low facility construction and operation costs
Biofloc Disadvantages
▪ Max commercial shrimp density: 5 – 6 kg/m3 (?)
▪ Disinfect harmful bacteria → Impact beneficial bacteria
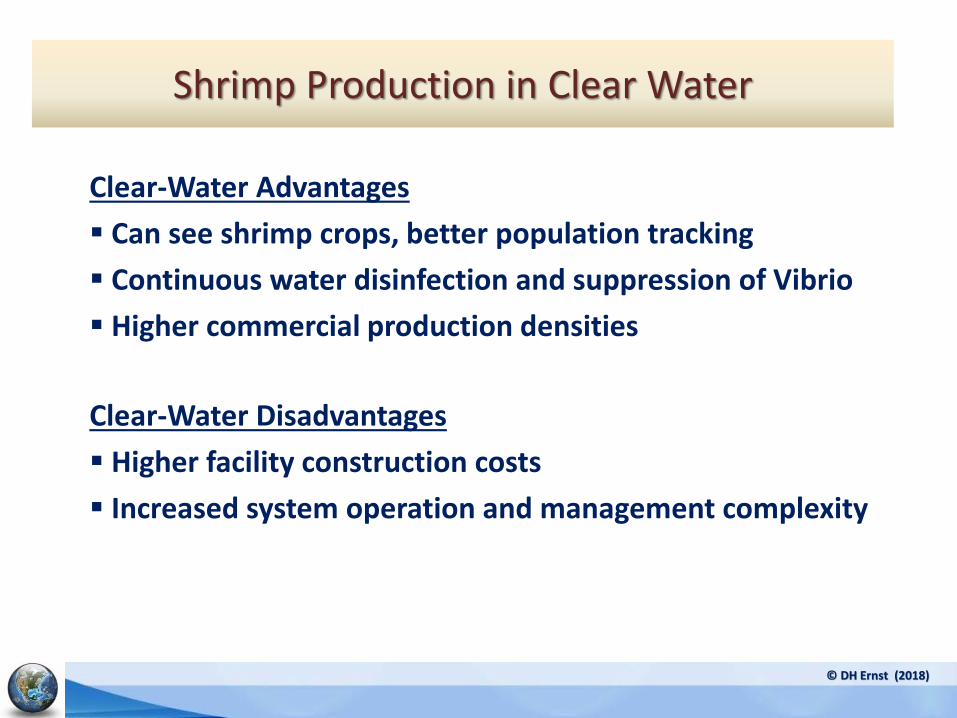
Shrimp Production in Clear Water
© DH Ernst (2018)
Clear-Water Advantages
▪ Can see shrimp crops, better population tracking
▪ Continuous water disinfection and suppression of Vibrio
▪ Higher commercial production densities
Clear-Water Disadvantages
▪ Higher facility construction costs
▪ Increased system operation and management complexity
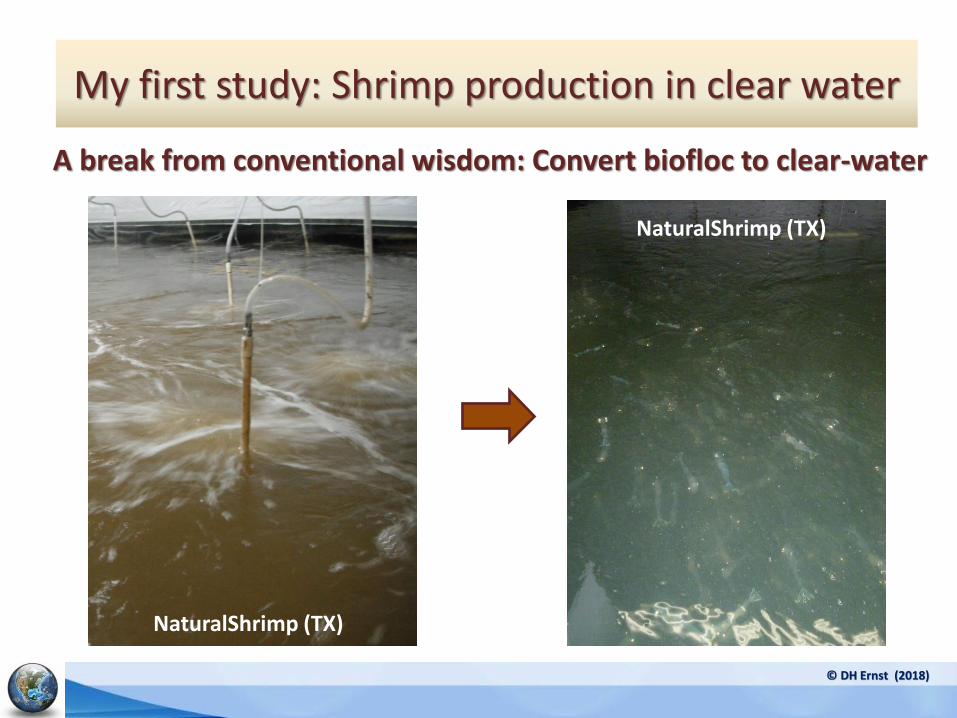
My first study: Shrimp production in clear water
© DH Ernst (2018)
A break from conventional wisdom: Convert biofloc to clear-water
NaturalShrimp (TX)
NaturalShrimp (TX)
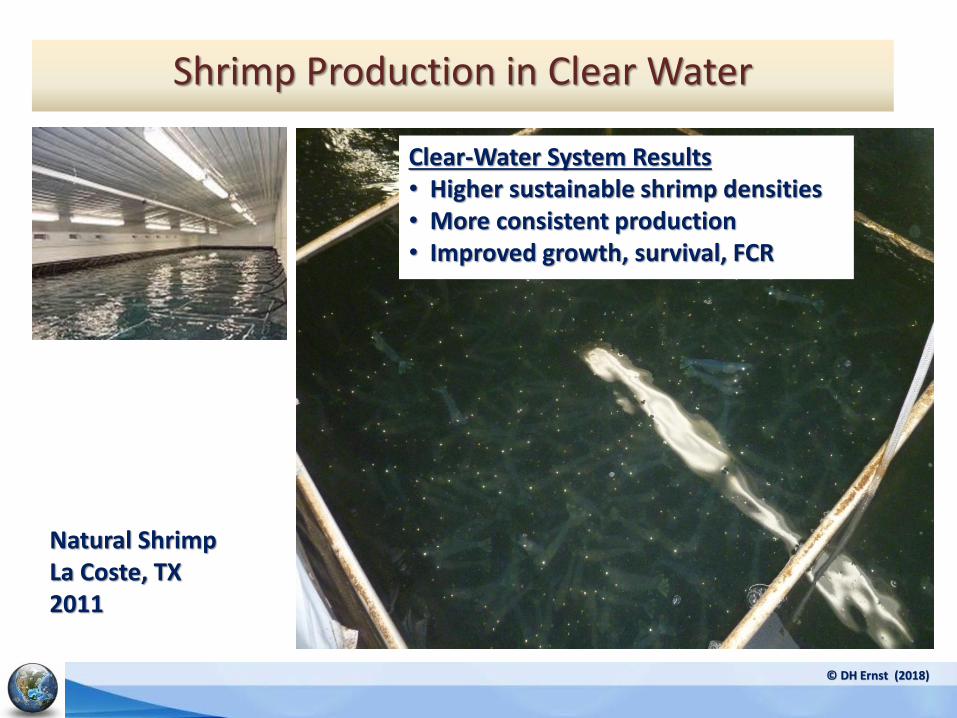
Clear-Water System Results• Higher sustainable shrimp densities• More consistent production• Improved growth, survival, FCR
Shrimp Production in Clear Water
© DH Ernst (2018)
Natural ShrimpLa Coste, TX2011
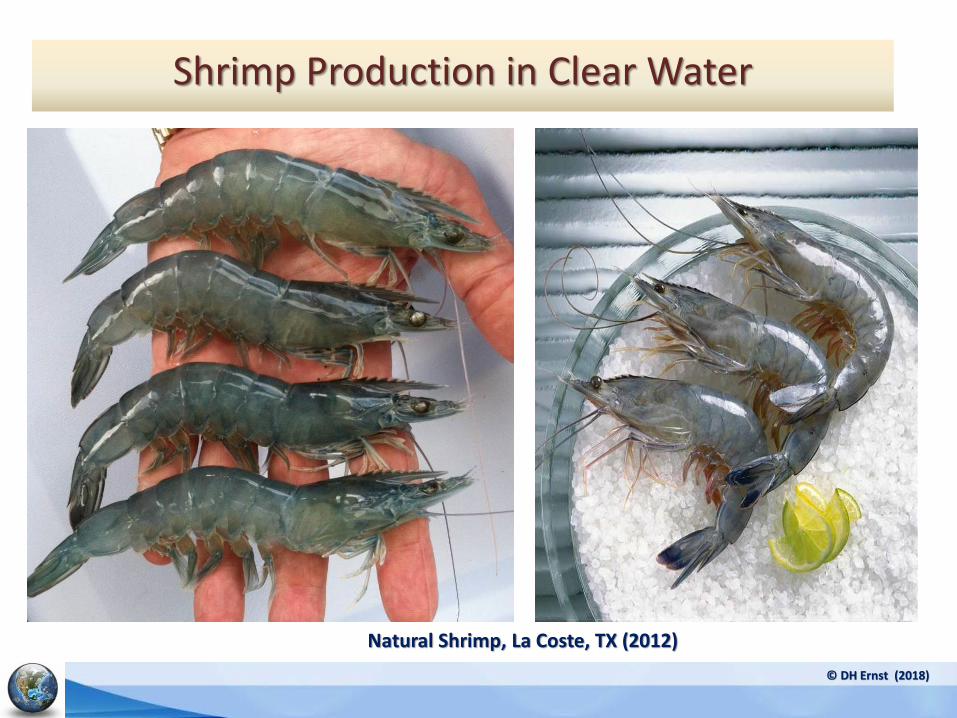
Shrimp Production in Clear Water
© DH Ernst (2018)
Natural Shrimp, La Coste, TX (2012)
© DH Ernst (2018)
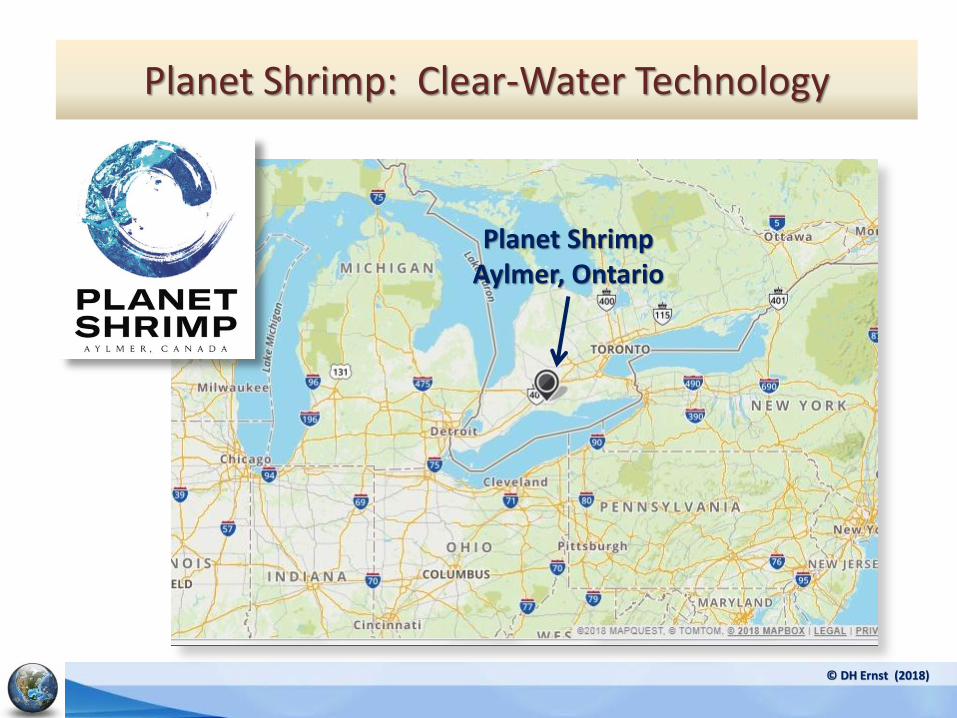
Planet Shrimp: Clear-Water Technology
Planet ShrimpAylmer, Ontario
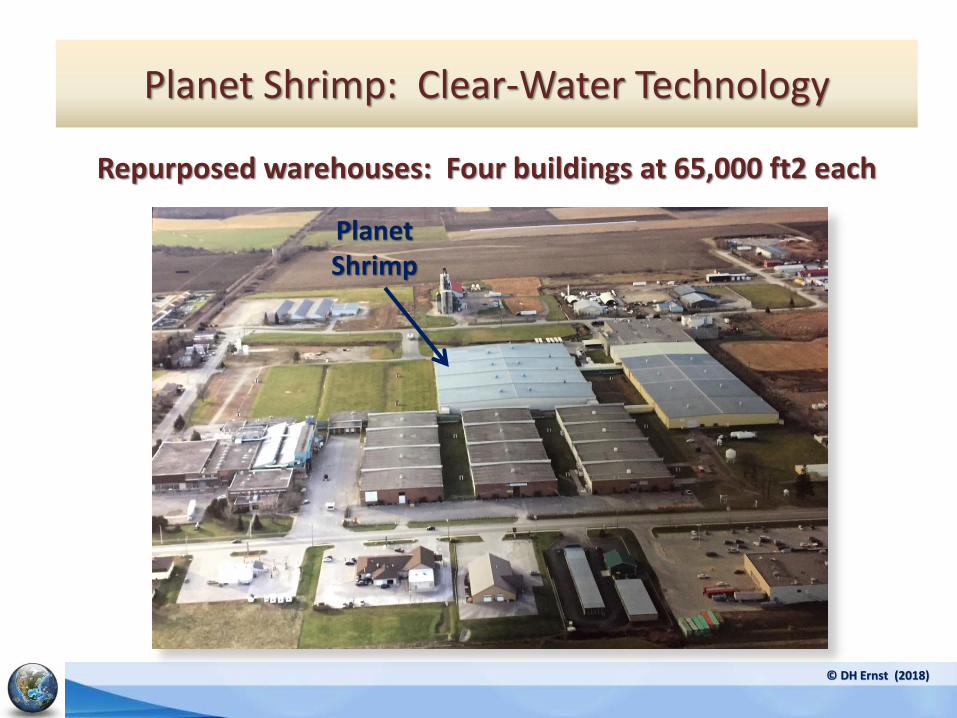
Repurposed warehouses: Four buildings at 65,000 ft2 each
© DH Ernst (2018)
Planet Shrimp: Clear-Water Technology
PlanetShrimp
Water
treatment
and recirc
Shrimp tank
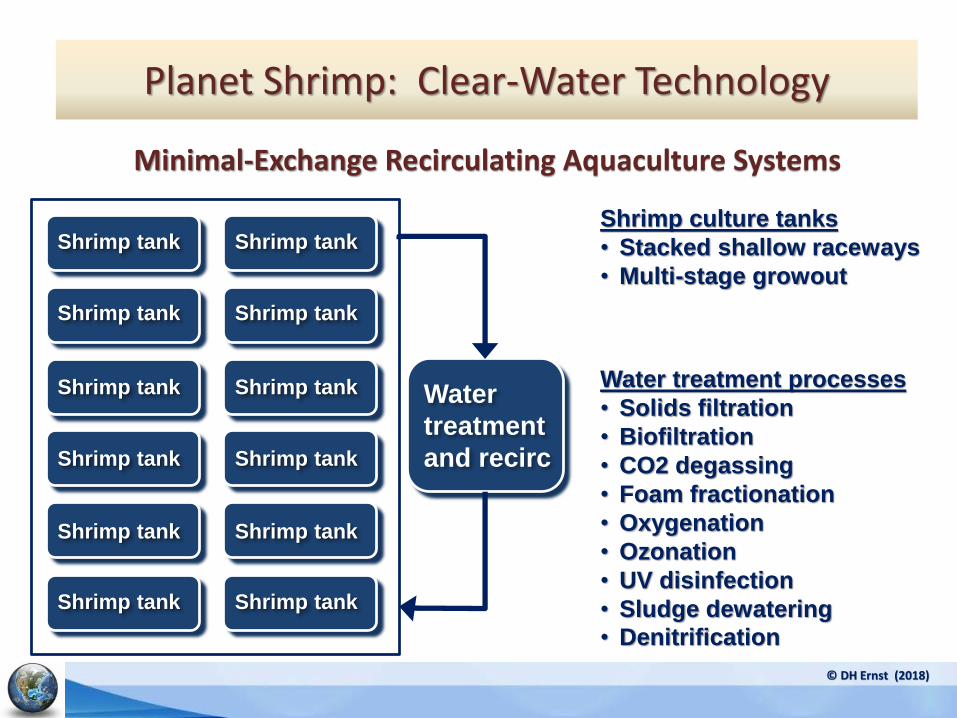
Minimal-Exchange Recirculating Aquaculture Systems
Shrimp tank
Shrimp tank
Shrimp tank
Shrimp tank
Shrimp tank
Water treatment processes
• Solids filtration
• Biofiltration
• CO2 degassing
• Foam fractionation
• Oxygenation
• Ozonation
• UV disinfection
• Sludge dewatering
• Denitrification
Planet Shrimp: Clear-Water Technology
Shrimp tank
Shrimp tank
Shrimp tank
Shrimp tank
Shrimp tank
Shrimp tankShrimp culture tanks
• Stacked shallow raceways
• Multi-stage growout
© DH Ernst (2018)
© DH Ernst (2018)
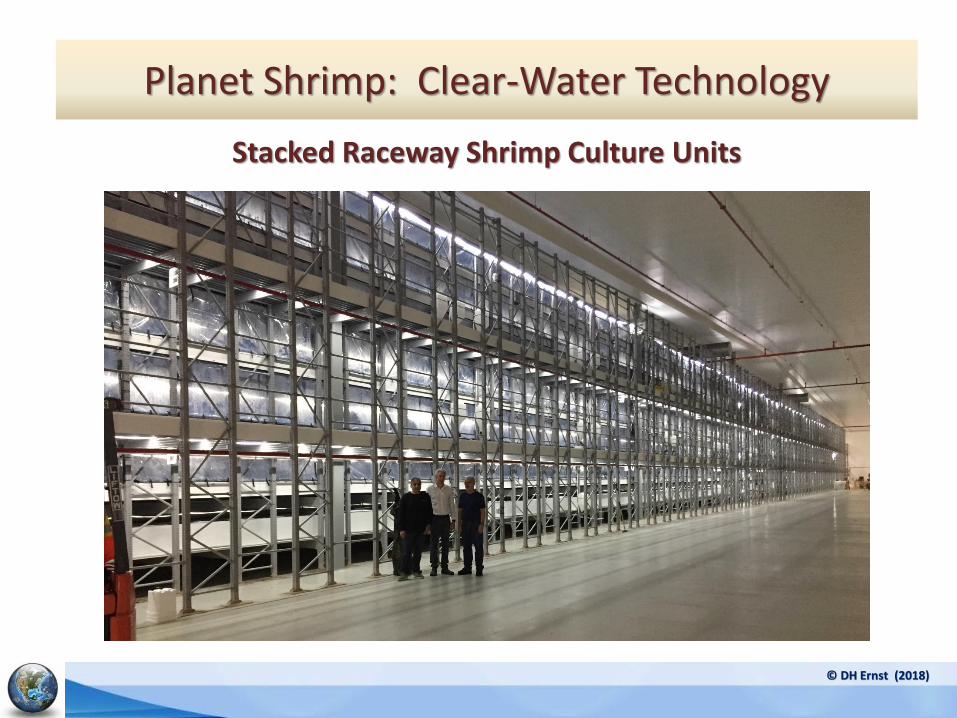
Planet Shrimp: Clear-Water Technology
Stacked Raceway Shrimp Culture Units
© DH Ernst (2018)
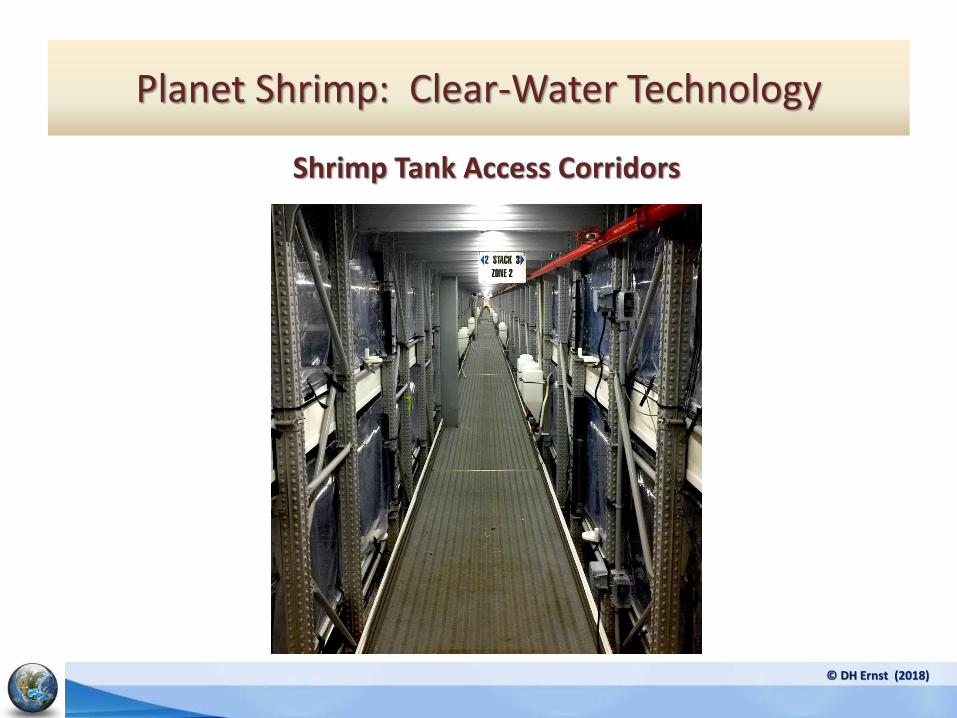
Planet Shrimp: Clear-Water Technology
Shrimp Tank Access Corridors
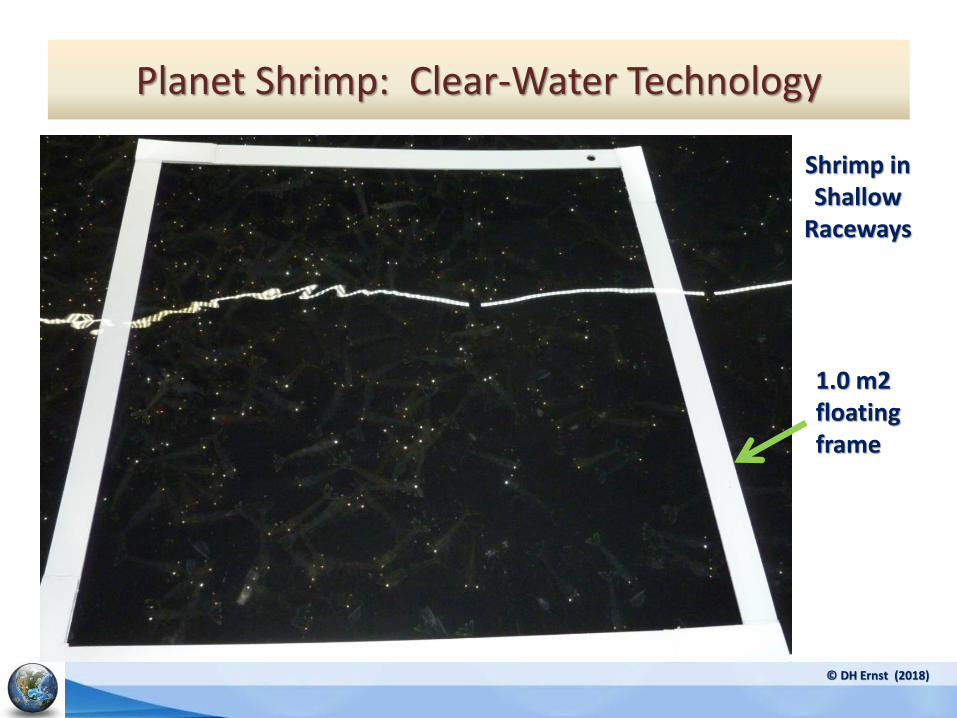
Planet Shrimp: Clear-Water Technology
© DH Ernst (2018)
Shrimp in Shallow
Raceways
1.0 m2 floating frame
© DH Ernst (2018)
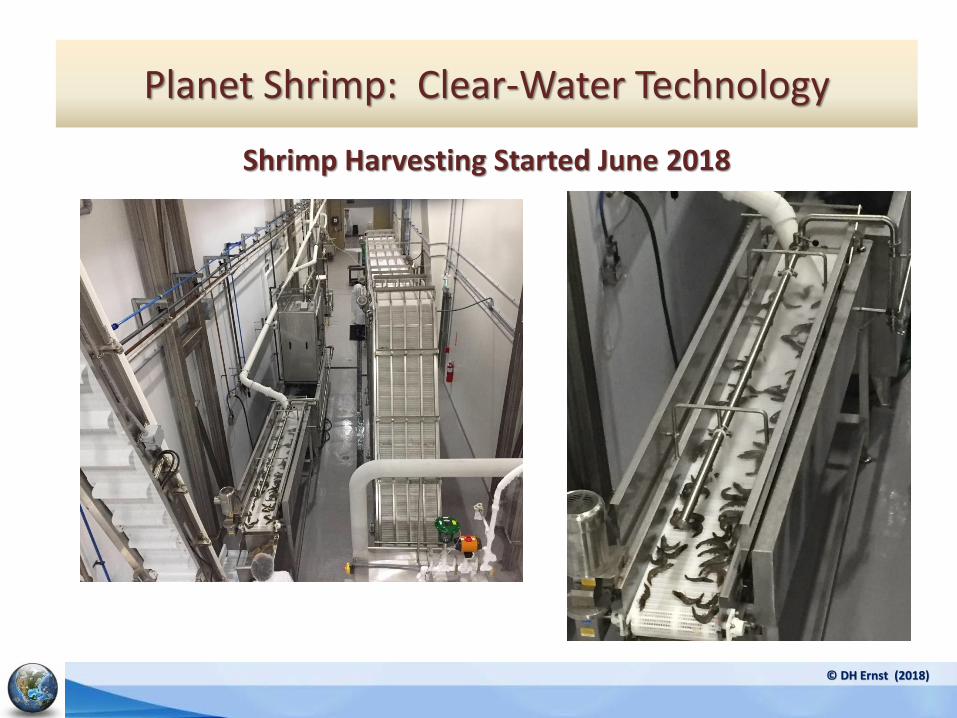
Planet Shrimp: Clear-Water Technology
Shrimp Harvesting Started June 2018