personalized alternate assessment portfolio mecas … · chapter 1—overview 1 2015–16 mecas...
TRANSCRIPT

Personalized Alternate Assessment Portfolio MeCAS Part II
2015–16 TECHNICAL REPORT
100 EDUCATION WAY, DOVER, NH 03820 (800) 431-8901 WWW.MEASUREDPROGRESS.ORG


TABLE OF CONTENTS CHAPTER 1 OVERVIEW ............................................................................................................................1
1.1 PURPOSE OF THIS REPORT ..................................................................................................................1
1.2 ORGANIZATION OF THIS REPORT ..........................................................................................................1
CHAPTER 2 CURRENT YEAR UPDATES .................................................................................................2
CHAPTER 3 THE STATE ASSESSMENT SYSTEM ..................................................................................3
3.1 INTRODUCTION ....................................................................................................................................3
3.2 ALTERNATE ASSESSMENT BASED ON ALTERNATE ACHIEVEMENT STANDARDS ........................................4
3.3 THE ALTERNATE ASSESSMENT SYSTEM ...............................................................................................4
3.4 PURPOSES OF THE ALTERNATE ASSESSMENT SYSTEM ..........................................................................4
3.5 GENERAL FORMAT AND BACKGROUND..................................................................................................5
CHAPTER 4 THE STUDENTS ....................................................................................................................8
4.1 PARTICIPATION DECISION PROCESS .....................................................................................................8
4.2 SUMMARY OF PARTICIPATION RATES ....................................................................................................9
CHAPTER 5 TEST CONTENT ................................................................................................................. 10
5.1 ALTERNATE GRADE LEVEL EXPECTATIONS (AGLES) ......................................................................... 10
5.1.1 Levels of Complexity (LoC) ..................................................................................................... 10 5.1.2 Format of the AGLEs for the PAAP ........................................................................................ 10
5.2 ACCESS TO THE GENERAL CURRICULUM............................................................................................ 12
5.3 ASSESSMENT DESIGN ....................................................................................................................... 12
5.4 ASSESSMENT DIMENSIONS ............................................................................................................... 15
CHAPTER 6 TEST DEVELOPMENT ....................................................................................................... 19
6.1 GENERAL PHILOSOPHY ..................................................................................................................... 19
6.2 ROLE OF COMMITTEES IN TEST DEVELOPMENT .................................................................................. 20
CHAPTER 7 ALIGNMENT ....................................................................................................................... 21
7.1 DESCRIPTION OF LINKAGES TO DIFFERENT CONTENT AREAS ACROSS GRADES................................... 21
CHAPTER 8 PAAP ADMINISTRATION TRAINING ................................................................................ 22
8.1 STEPS FOR ADMINISTRATIONS .......................................................................................................... 22
8.2 STEPS IN CONSTRUCTING THE PORTFOLIO ........................................................................................ 23
CHAPTER 9 SCORING............................................................................................................................ 28
9.1 TABLE LEADER AND SCORER RECRUITMENT AND QUALIFICATIONS ..................................................... 28
9.2 TABLE LEADER AND SCORER TRAINING ............................................................................................. 28
9.3 SCORING PROCESS .......................................................................................................................... 29
9.4 FLOW OF MATERIALS ........................................................................................................................ 31
9.5 SECURITY ........................................................................................................................................ 32
9.6 SCORING RUBRIC ............................................................................................................................. 32
9.7 CALCULATION OF REPORTED SCORES ............................................................................................... 35
CHAPTER 10 CLASSICAL ITEM ANALYSIS ............................................................................................ 36
Table of Contents i 2015–16 MeCAS Technical Report Part II

10.1 DIFFICULTY AND DISCRIMINATION ...................................................................................................... 36
10.2 STRUCTURAL RELATIONSHIP ............................................................................................................. 38
10.3 BIAS/FAIRNESS ................................................................................................................................ 39
CHAPTER 11 CHARACTERIZING ERRORS ASSOCIATED WITH TEST SCORES............................... 40
11.1 RELIABILITY ...................................................................................................................................... 40
11.2 SUBGROUP RELIABILITY .................................................................................................................... 41
11.3 DECISION ACCURACY AND CONSISTENCY .......................................................................................... 42
11.4 INTERRATER CONSISTENCY .............................................................................................................. 44
CHAPTER 12 COMPARABILITY (SCALING AND EQUATING) ............................................................... 45
12.1 COMPARABILITY OF SCORES ACROSS YEARS .................................................................................... 45
12.1.1 Reported Scores ..................................................................................................................... 45 12.1.2 Standard Setting ..................................................................................................................... 45
12.2 LINKAGES ACROSS GRADES ............................................................................................................. 46
CHAPTER 13 VALIDITY ............................................................................................................................ 48
13.1 EVIDENCE BASED ON TEST DEVELOPMENT AND STRUCTURE .............................................................. 48
13.2 OTHER EVIDENCE ............................................................................................................................. 49
13.3 FUTURE DIRECTIONS ........................................................................................................................ 49
REFERENCES .................................................................................................................................................. 50
APPENDICES ................................................................................................................................................... 51
APPENDIX A 2016 ALTERNATE GRADE LEVEL EXPECTATIONS
APPENDIX B PROCESS FOR DETERMINING THE APPROPRIATE AVENUE FOR PARTICIPATION
APPENDIX C 2016 SCORING INSTRUCTIONS
APPENDIX D ITEM-LEVEL CLASSICAL STATISTICS
APPENDIX E ITEM-LEVEL SCORE DISTRIBUTIONS
APPENDIX F SUBGROUP RELIABILITY
APPENDIX G DECISION ACCURACY AND CONSISTENCY RESULTS
APPENDIX H INTERRATER CONSISTENCY
APPENDIX I SCORE OF RECORD
APPENDIX J CUMULATIVE SCORE DISTRIBUTIONS
APPENDIX K ACHIEVEMENT-LEVEL DISTRIBUTIONS
APPENDIX L ANALYSIS AND REPORTING DECISION RULES
Table of Contents ii 2015–16 MeCAS Technical Report Part II

CHAPTER 1 OVERVIEW
This technical report provides an overview of Maine’s alternate science assessment, the Maine
Educational Assessments (MEA) Alternate Science - Personalized Alternate Assessment Portfolio (PAAP),
which is administered to students with significant cognitive disabilities who cannot participate in the MEA
Science. Descriptions of the purpose of the PAAP, the processes utilized to develop and implement the PAAP
program, and stakeholder involvement in those processes are included in this report. By comparing the intent
of the PAAP with its process and design, the assessment’s validity can be evaluated. Stakeholder groups such
as the PAAP Advisory Committee, item/task review committees, and content committees helped guide the
development and implementation process. Teacher input in the development of the overall PAAP process is
described, from the Alternate Grade Level Expectations (AGLE) design through blueprint/test design, content
alignment, task development, task tryout/field-testing, teacher trainings, test administration, scoring, and
standard setting.
1.1 PURPOSE OF THIS REPORT
The purpose of this report is to document the technical aspects of the 2015–16 PAAP operational
implementation. Science was assessed at grades 5, 8, and 3rd year high school.
Several technical aspects of the PAAP are described in an effort to contribute to evidence supporting
the validity of PAAP score interpretations. Because the interpretations of the test scores are evaluated for
validity, not the test itself, this report presents documentation to substantiate intended interpretations (AERA
et al., 2014). Each chapter contributes important information to the validity argument by addressing one or
more of the following aspects of the PAAP: task development, alignment, administration, scoring, reliability,
standard setting, achievement levels, and reporting.
Standards for Educational and Psychological Testing (AERA et al., 2014) provide a framework for
describing sources of evidence that should be considered when constructing an argument for assessment
validity. These sources include evidence in five general areas: test content, response processes, internal
structure, relationship to other variables, and consequences of testing. Although each of these sources may
speak to a different aspect of validity, they are not distinct types of validity. Instead, each contributes to a
body of evidence about the comprehensive validity of score interpretations.
1.2 ORGANIZATION OF THIS REPORT
This report is organized based on the conceptual flow of the PAAP’s year-long process, which
includes blueprint design/development, task development, administration, scoring, reporting of scores,
technical characteristics, and validity. The appendices contain supporting documentation.
Chapter 1—Overview 1 2015–16 MeCAS Technical Report Part II

CHAPTER 2 CURRENT YEAR UPDATES
There were no changes from previous administrations to the assessment of science through the PAAP
for the 2015–16 assessment year. Formal reporting was removed from this contract and is handled by Maine
DOE’s reporting vendor. Measured Progress delivers final data files to Maine DOE for this assessment.
Chapter 2—Current Year Updates 2 2015–16 MeCAS Technical ReportPart II

CHAPTER 3 THE STATE ASSESSMENT SYSTEM
The Maine Comprehensive Assessment System (MeCAS) is a statewide instructionally supportive
assessment system that complies with the federal requirements of the No Child Left Behind (NCLB) Act and the
Individuals with Disabilities Education Improvement Act of 2004, as amended (IDEA). These acts, along with
state regulations, require that all students, including those with disabilities, participate in state-mandated
assessments in grades 3–8 and 3rd year high school, and they are intended to hold schools accountable for the
academic performance of students. Those assessments include:
The MEA Mathematics and English Language Arts/Literacy, which assesses mathematics and
ELA/literacy, at grades 3–8 and 3rd year high school.
The MEA Science, which assesses science at grades 5, 8, and 3rd year high school.
MEA Science Alternate (PAAP), which alternately assesses MEA Science, for a small number
of students with the most significant cognitive disabilities who are unable to take part in the
general science assessment.
MEA Alternate Mathematics and English Language Arts/Literacy which assess students with
the most significant cognitive disabilities who are unable to take part in the mathematics and
ELA/literacy assessment successfully.
All students participate in statewide assessment in one of three ways: general assessment, general
assessment with accommodations, or alternate assessment, as outlined in the following sections.
3.1 INTRODUCTION
The PAAP, like the MEA Science, is designed to provide a snapshot in time of an individual student’s
performance. A broader picture will emerge as the student results on the PAAP are reviewed along with results
on other formative and summative assessments.
PAAP tasks are provided in the PAAP Task Bank for the science content standard levels of complexity
(LoC) as described in the PAAP Alternate Grade Level Expectations (AGLEs) document (Appendix A). Tasks
selected for use in an individual student’s PAAP should match the instructional level at which the student is
working and be designated within the PAAP AGLEs/Indicators as appropriate for his or her grade level.
The AGLE/Indicators include LoC descriptors that have been reduced in complexity to ensure access to
instruction and assessment for all students.
All tasks submitted in a PAAP are corrected (by item) resulting in an overall percentage score for the
task. The evidence (student work) included in a 2015–16 PAAP for science must have been generated during the
PAAP test administration window: December 1, 2015–April 30, 2016.
Chapter 3—The State Assessment System 3 2015–16 MeCAS Technical Report Part II

3.2 ALTERNATE ASSESSMENT BASED ON ALTERNATE ACHIEVEMENT STANDARDS
Up to 1% of Maine students in grades tested may show academic achievement through administration of
an alternate assessment based on alternate achievement standards. The PAAP is designed for those students with
such significant cognitive disabilities that they are unable to participate in the general MEA even with the best
instruction and appropriate accommodations.
As previously described, the PAAP is designed under the guiding philosophy that alternate achievement
standards are built on measurable, targeted skills linked to Maine’s 2007 Learning Results for science, and
represent student performance at a lower level of breadth, depth, and complexity than that found in the general
assessment.
3.3 THE ALTERNATE ASSESSMENT SYSTEM
Given the legislative context within which the entire statewide assessment system sits, the PAAP is, as a
part of the overall MeCAS, governed by the same laws and rules that govern general assessment. Federal
legislation, including the Individuals with Disabilities Education Improvement Act of 2004 (IDEA) and the No
Child Left Behind (NCLB) Act, requires that students with disabilities have access to the general curriculum,
with appropriate accommodations where necessary, and that they be assessed on the same general curriculum
standards as all other students. For the small number of students who cannot participate in the general large-scale
assessment due to their significant cognitive disabilities, the law also allows—and Maine provides—a statewide
alternate assessment based on the AGLEs. Alternate achievement standards are reduced in breadth, depth, and
complexity, while maintaining linkage to the same general curriculum standards taught to all children.
3.4 PURPOSES OF THE ALTERNATE ASSESSMENT SYSTEM
The PAAP is designed to provide instruction and a meaningful academic assessment experience, based
on the AGLEs, for those Maine students with the most significant cognitive disabilities.
The portfolio approach captures student progress in academic content over the course of a five-month
window, enabling teachers and others to see evidence of this progress within the context of the instructional
program they are providing. The PAAP is also intended to provide feedback to teachers on student performance,
which they can use to improve instruction.
As part of this purpose, the PAAP signals to Maine special education teachers the need to maintain high
academic expectations for their students and high standards in the delivery of their instructional programs.
Students receive greater learning opportunities throughout their academic careers because of tight test blueprints
and teacher trainings that encourage educators to move PAAP students to higher levels of complexity.
Chapter 3—The State Assessment System 4 2015–16 MeCAS Technical Report Part II

The PAAP ensures that all Maine students are appropriately included in state and federal assessment
requirements and provides instructional improvement that reveals what students know and are able to do. This
system aims to meet the highest technical standards possible while best serving the students participating in
the assessment.
3.5 GENERAL FORMAT AND BACKGROUND
AGLE Entries submitted in a PAAP must be composed of four components:
an Entry Slip that serves as the organizer for all student work related to a single content standard
the required number of Task Descriptions designed to help the user understand the expectations of an individual task, how the task was administered, the prior knowledge required to perform the task, and the alignment to the specific standard and performance indicator being measured
the required quantity of student work to serve as evidence of student performance (see Appendix A)
a Task Summary page summarizing the Level of Accuracy and Level of Assistance
Forms for the Entry Slips and Task Descriptions have been common since 2003. From 2002 to 2004,
only teacher-developed tasks were used in PAAPs. Teacher training on the PAAP process included tools to
ensure alignment to the rubrics, sufficiency of evidence, and clarity for scorers. During the 2003 and 2004
scoring sessions, scorers were asked to identify tasks they saw as “exemplary”—those tasks that, clearly
aligned, provided evidence of a pattern of performance and could be reliably scored. Those exemplar tasks
were then reviewed by a group of teachers brought together in the summer of 2004. Members of that group
made suggestions for revisions as necessary and eliminated tasks that did not meet the criteria outlined for the
review process. The tasks approved by that group served as the basis for the early development of tasks to be
included in an online PAAP Task Bank. A small number of tasks, based on the exemplars and finalized in
form by Maine Department of Education (DOE) staff, were posted online for optional use in 2004. The
number of Task Bank items was expanded in 2004–05 to allow teachers to create an entire 2005 PAAP,
including reading, mathematics, and science, without using teacher-developed tasks. The use of teacher-
developed tasks was still permitted, however. At each stage of this development evolution, final tasks were
reviewed by members of the PAAP Work Collaborative or the PAAP Advisory Group.
The use of teacher-developed tasks was no longer permitted for the 2006–07 school year. Due to the
teacher time involved and the variations in the skill levels among teachers for developing tasks, the Maine
DOE contracted with Measured Progress to collaborate on the development of new tasks. The first set of tasks
produced by Measured Progress was developed during 2004–05 for use in 2005–06. A second set of tasks was
developed in 2005–06 for use in 2006–07. The purpose of this development was to populate an expanded
version of the PAAP Task Bank for reading and mathematics.
Chapter 3—The State Assessment System 5 2015–16 MeCAS Technical Report Part II

Teachers completed a Specific Task Feedback Form to provide Measured Progress and the Maine
DOE with guidance to inform further development and quality assurance of the tasks. Based on the feedback
from teachers, all of the first-round PAAP tryout tasks were revised by Measured Progress and the Maine
DOE. A second round of development was completed in the summer of 2006 that focused on reading, writing,
and science tasks.
In 2007–08, the Task Bank became password protected and was provided solely for the use of Maine
teachers developing PAAPs for their students. Because the PAAP is for students with the most significant
cognitive disabilities within the Maine school population, the PAAP rubrics were revised to contain only
rubric levels 1 and 2.
The 2009–10 assessment program began to move toward a required test blueprint by grade and
content area. In developing the blueprint for the PAAP, care was taken to make the progression of tasks
parallel to the progression of the general NECAP assessment in all content areas. Teachers were no longer
allowed to freely select which AGLEs to assess. Because the Task Bank was not fully populated, teachers
were asked to familiarize themselves with the test blueprints for all content areas, but to implement the test
blueprint for reading only, as reading was the only content area fully populated in the Task Bank. Teachers
were not penalized if they did not follow the test blueprint for reading during that assessment year.
Beginning in 2010–11 and continuing through 2013–14, the program provided a fully populated Task
Bank for all content areas and enforced the required grade-level test blueprint provided to teachers in 2009–
10. Teachers were no longer allowed to select AGLEs for assessment outside of the grade-level blueprint.
Instead, the teachers were required to administer the AGLE entry requirements for each content area. The
2015–16 PAAP program required teachers to administer the science AGLES only, as shown below and in
Table 3-1.
Table 3-1. 2015–16 PAAP: Content Blueprint PAAP Science Blueprint
Required AGLE/Indicators by Grade Level Grade Science
3 4 5 D1, D2, E2 6 7 8 D4, E3, E4
3rd Year High School D3, E1, E5
As stated in the Chapter 1 Overview, the 2015–16 PAAP was the alternate to the 2015–16 MEA
Science. The science portion of the Alternate MEA (PAAP) assesses two AGLEs: D, the physical setting
(D1–D4), and E, the living environment (E1–E5). AGLE D, the physical setting, contains indicators that
Chapter 3—The State Assessment System 6 2015–16 MeCAS Technical Report Part II

encompass the subject matter conventionally referred to as physical, earth, and space science, while E, the
living environment, contains indicators related to life science.
Indicators from both the physical setting and the living environment are assessed each year in grades
5, 8, and 3rd year high school. The focus at the elementary level is on concepts that the student can directly
observe, such as the Sun, the Moon, rocks, plants, and animals. Force and motion provide concrete
observations at the middle school level for the more abstract concepts of matter and energy that will be
addressed in high school. Likewise, cells and heredity/reproduction provide foundations for the more abstract
concepts of biodiversity and evolution taught in high school, while the level of abstraction increases for the
concepts of matter and energy. These are all high school concepts that are more abstract than the concepts
covered in the elementary and middle school levels.
In the living environment, the progression from grade 5 to high school is from an understanding of
individual organisms and populations to an understanding of how organisms change over time. In the physical
setting, the progression is from an understanding of the macroscopic universe, solar system, and Earth to an
understanding of forces and motion in the everyday environment, and progressing in high school to an
understanding of matter and energy at the macroscopic and atomic levels. Each successive grade-level
assessment connects to and builds on the science concepts introduced at a lower level.
Chapter 3—The State Assessment System 7 2015–16 MeCAS Technical Report Part II

CHAPTER 4 THE STUDENTS
In effective learning environments, instruction and assessment should always be linked. High-quality
assessment practices provide information upon which to base ongoing development of instruction that is
responsive to student needs. In alternate assessment, models of learning and subsequently the linkages
between curriculum, instruction, and assessment are deeply impacted by the characteristics of the students
themselves. Knowing who these students are and how they learn is critical to the design and development of
effective instruction and assessment. In Maine, each PAAP is individualized so that each student’s learning
needs can be met with instruction that effectively promotes academic growth. The carefully designed common
structure underlying the development of every PAAP provides a basis for comparison of performance patterns
across students. The structure of the PAAP assessment illustrates both student performance and the student
program. In effect, this assessment prioritizes observation of the dynamic links between models of student
learning, curriculum, and instruction, and relates them to actual student outcomes. The design of the portfolio
is based on the belief that those particular assessment events will allow students to demonstrate their
understanding in a given domain, given a particular view of learning that takes into account important
individual student differences.
4.1 PARTICIPATION DECISION PROCESS
Students eligible for the 2015–16 alternate assessment included students with a significant cognitive
disability. These students need assessments that are individualized and flexible as well as integrated with
daily instruction, resulting in student work that provides evidence of what these students are capable of doing.
The PAAP was developed as the mode of participation in state assessments for these students. A participation
flow chart is provided in the PAAP Handbook and is shown in Appendix B.
During the 2015–16 school year, participation in the PAAP was required for those needing an
alternate to the MEA Science in grades 5, 8, and 3rd year high school. Students in a non-graded program were
to be assigned a specific grade through Infinite Campus State Edition for the purposes of assessment.
All students considered for alternate assessment were reviewed individually by the Individualized
Education Program (IEP) team prior to the time of assessment to determine the appropriate avenue of
participation, allowing sufficient time for administration of the alternate assessment. This team was to
include at least one of the student’s teachers, the school’s principal or other administrator, the
parent(s)/guardian(s), related service personnel, and the student, whenever possible. If it was not possible
for the parent and student to attend the meeting, they were consulted regarding the committee’s
recommendations. The materials suggested for use at the meeting included (1) the Process for
Determining the Appropriate Avenue of Participation in the MEA Science (a copy of which is included in
Appendix B), (2) the student profile, (3) the approved state assessment accommodations list for the
Chapter 4—The Students 8 2015–16 MeCAS Technical Report Part II

general MEA Science, (4) samples of the student’s work, and (5) MEA Science released items to which
the samples of the student’s work could be compared. The recommendation for a student to take an
alternate assessment must be documented in the student’s IEP.
4.2 SUMMARY OF PARTICIPATION RATES
Table 4-1 shows a summary of participation in the 2015–16 Maine PAAP by demographic category
for Science.
Table 4-1. 2015–16 PAAP: Summary of Participation by Demographic Category—Science
Description Tested
Number Percent All Students 464 100.00 Male 299 64.44 Female 165 35.56 Gender Not Reported 0 0.00 Hispanic or Latino 6 1.29 American Indian or Alaskan Native 4 0.86 Asian 6 1.29 Black or African American 21 4.53 Native Hawaiian or Pacific Islander 1 0.22 White (Non-Hispanic) 417 89.87 Two or More Races 9 1.94 No Primary Race/Ethnicity Reported 0 0.00 Currently Receiving LEP1 services 14 3.02 Former LEP1 Student—Monitoring Year 1 0 0.00 Former LEP1 Student—Monitoring Year 2 0 0.00 LEP1: All Other Students 450 96.98 Students with an IEP2 464 100.00 IEP2: All Other Students 0 0.00 Economically Disadvantaged Students 305 65.73 SES3: All Other Students 159 34.27 Migrant Students 1 0.22 Migrant: All Other Students 463 99.78 Students Receiving Title 1 Services 12 2.59 Title 1: All Other Students 452 97.41 Plan 504 2 0.43 Plan 504: All Other Students 462 99.57 1 LEP = Limited English Proficient 2 IEP = Individualized Education Plan 3 SES = Socio-Economic Status
Chapter 4—The Students 9 2015–16 MeCAS Technical Report Part II

CHAPTER 5 TEST CONTENT
Designed specifically for students with significant cognitive disabilities, the PAAP is a portfolio-
based test that is aligned with Maine’s AGLEs. The content of this assessment has been reduced in depth and
breadth but remains focused on the AGLEs, which have been linked down from the MEA (2007 Learning
Results) science standards.
5.1 ALTERNATE GRADE LEVEL EXPECTATIONS (AGLES)
The student work included in the PAAP is based on Maine’s AGLEs, which are designed for planning
and implementing Maine’s alternate assessments. The PAAP measures progress toward the defined AGLEs
by allowing students to produce evidence of their knowledge and skills at a specific point in time. It also
assesses students at the same grade levels as the MEA science assessment. The administration window for the
PAAP runs for much of the academic year—from the first week of December through the last week of April.
This extended administration window provides opportunities for instruction and assessment to be embedded
in the student’s daily work throughout the school year and then be assessed using PAAP tasks from an online
Task Bank.
5.1.1 Levels of Complexity (LoC)
Maine’s AGLEs provide a common basis for the planning and assessment of standards-based
instruction and assessment in a system that allows students to work on the AGLE/Indicators, LoC descriptors,
and tasks best suited to their individual needs. All tasks submitted in a student’s PAAP must be selected and
downloaded from the secure, online Task Bank (https://profile.measuredprogress.org/paap/login.aspx). To
establish consistency, teachers may not develop their own tasks.
All tasks within the Task Bank are aligned with Maine’s AGLE/Indicator LoCs 1–8. Students
working above the LoCs should participate in the standard Maine state assessment at their grade-level
placement with appropriate accommodations.
5.1.2 Format of the AGLEs for the PAAP
Maine’s AGLEs were formatted by content area, AGLE/Indicators, and LoC descriptors. The Task
Bank was made fully operational for the 2012–13 school year. However, because of the implementation of the
required grade-level test blueprint, not all LoCs within each AGLE were required for assessment purposes.
Those LoCs that were not required for assessment purposes had the content taken out of the LoC in
the AGLE document and were placed in a supplemental document called the Extended Learning AGLEs for
teachers to access for instructional purposes.
Chapter 5—Test Content 10 2015–16 MeCAS Technical Report Part II

Figure 5-1 is an example of the science AGLE/Indicator D1.
Figure 5-1. 2015–16 PAAP: Sample Science AGLE/Indicator—D1
The header at the top of the sample AGLE page in Figure 5-1 identifies the AGLE as Maine’s
Accountability Standards, Chapter 131, Maine’s 2007 Learning Results to which this material is aligned.
Directly opposite this, on the right side of the field, the corresponding PAAP identifier is situated: Science
AGLE/Indicator —D1.
The student expectations for each AGLE—that is, what is being expected of the student in order to
demonstrate proficiency as defined in Maine’s 2007 Learning Results for science—are presented in italics
below Maine’s Accountability Standards, Chapter 131 AGLE. For example, using Figure 5-1 above, the
expectations of the student are that he or she “…understands the universal nature of matter, energy, force, and
motion, and identifies how these relationships are exhibited in Earth Systems, in the solar system, and
throughout the universe . . .”
Exactly how the student demonstrates understanding of the universal nature of matter, energy, force,
and motion, and identifies how these relationships are exhibited in Earth Systems, in the solar system, and
throughout the universe, is detailed in the LoC descriptor table immediately following the student
Chapter 5—Test Content 11 2015–16 MeCAS Technical Report Part II

expectations. For example, referencing Figure 5-1 on the previous page, the student demonstrates
understanding of the universal nature of matter, energy, force, and motion by:
Level of Complexity 1: identifying night and day.
Level of Complexity 2: identifying pictures of night and day, and identifying the Sun and Earth’s Moon.
Level of Complexity 3: identifying the position of the Sun at different times by drawing or otherwise describing the movement of the Sun across the sky.
And so on, up to and including LoC 8.
LoCs are ranged 1–8, and each LoC is accompanied by the grade levels for which participation at that
LoC is appropriate.
5.2 ACCESS TO THE GENERAL CURRICULUM
In an effort to document the extent to which students are being exposed to the general curriculum, as
required by the Individuals with Disabilities Education Improvement Act of 2004 (IDEA), the achievement
standards take into account student access to the general curriculum. The targeted skills taught are connected
to the general curriculum standards but are presented in activities that reflect a reduced level of breadth,
depth, or complexity. Examples of these targeted skills are found in the online Task Bank by AGLE/Indicator
and LoC. Standards-based activities are those learning activities that have outcomes connected to achieving a
curriculum framework standard. Activities are evaluated by linkage to grade-level activities. For example, if
students in the general education classroom are learning about the solar system and the universe, then the
alternately assessed students might be working on activities involving identifying the time of day or the
phases of the moon. This activity would be linked to the science standard. Evidence would show application
across multiple activities illustrating this skill.
5.3 ASSESSMENT DESIGN
Maine’s AGLE document was designed to be a bridge to the general curriculum for all students with
significant cognitive disabilities who are unable to participate in the general assessment. The IEP team
determines if the student’s achievement level on daily work indicates that he or she can participate in the
MEA Science through standard administration or administration with accommodation. If the student cannot,
the IEP team plans and implements the MEA Alternate, or PAAP, for which the student’s skills match the
PAAP AGLE/Indicators for his or her grade level.
The 2015–16 PAAP Grade-Level Blueprint outlines the grades and content area assessed through the
PAAP. Figure 5-2 demonstrates this outline.
Chapter 5—Test Content 12 2015–16 MeCAS Technical Report Part II

Figure 5-2. 2015–16 PAAP: Grade-Level Blueprint
Grade Level
Assessment for which
PAAP is the alternate
3 N/A
4 N/A
5 MEA Science
6 N/A
7 N/A
8 MEA Science
10 N/A
Third Year High School MEA Science
The PAAP requires four basic components to each AGLE Entry that is assessed: the AGLE Entry
Slip, Task Description pages, student work template pages, and Task Summary pages. Science requires three
AGLE Entries, each containing two tasks.
The visual guide in Figure 5-3 outlines the PAAP requirements as explained above for the 2015–16
PAAP.
Figure 5-3. 2015–16 PAAP: Visual Guide to PAAP Requirements
Chapter 5—Test Content 13 2015–16 MeCAS Technical Report Part II

Maine moved to a mandatory PAAP Blueprint for 2013–14 (Figure 5-4) that requires certain
AGLE/Indicators to be assessed at specific grade levels, ensuring that all students have the opportunity to
develop an understanding of concepts included in each AGLE/Indicator at the same time as their general
assessment peers. As the blueprint was developed, the design team focused on each content area to ensure that
the progression of tasks would parallel the progression in the general assessment. The final blueprint (Figure
5-4) was reviewed by personnel at the Maine DOE, content specialists at Measured Progress, Maine
stakeholders, the PAAP Advisory Committee, and the Technical Advisory Committee.
Teachers were asked to familiarize themselves with a new PAAP Blueprint during 2009–10 and to
begin implementation for assessment in 2011–12 for all content areas. The new PAAP Blueprint was fully
operational for the 2012–13 PAAP administration, and made mandatory for 2013–14. In the 2014–15
assessment the PAAP Blueprint was reduced to the single content area of science as outlined in Figure 5-5.
This blueprint remained consistent through the 2015-16 PAAP administration.
Figure 5-4. 2013–14 PAAP: Blueprint
Chapter 5—Test Content 14 2015–16 MeCAS Technical Report Part II

Figure 5-5. 2015–16 PAAP: PAAP Blueprint
PAAP Blueprint Required AGLE/Indicators by Content Area
Grade Level Science
3
4
5 D1, D2, E2
6
7
8 D4, E3, E4
High School D3, E1, E5
5.4 ASSESSMENT DIMENSIONS
There are three dimensions on which the PAAP is scored:
Level of Complexity (LoC)
Level of Accuracy
Level of Assistance
Once the AGLE/Indicator for which the student will submit a PAAP has been determined, the teacher
determines the LoC that is appropriate for inclusion in the student’s instructional program. The teacher’s role
is to consider the student’s current level of performance and the possibilities for increasing that level through
instruction. Teachers may choose a specific LoC and assess the student after instruction has been given. If the
student completes that LoC independently with a high percentage of accuracy, the teacher is trained to instruct
and assess the student at the next higher LoC. The teacher would then submit the higher LoC to be scored.
The same can be done if the teacher assesses at a higher LoC and the student performs below the teacher’s
expectations (at a very low Level of Accuracy, zero is acceptable) and the student requires the maximum
Level of Assistance. The teacher may then back down the instruction to a lower LoC, reassess, and submit the
lower LoC to be scored.
The Level of Accuracy on the student work pages is corrected by the teacher item by item on the
student work template page, and then the correct/incorrect scores are transferred to the Task Summary page.
Each Level of Accuracy box contains the number of items within the task, “Correct/Incorrect” designation
Chapter 5—Test Content 15 2015–16 MeCAS Technical Report Part II

with predetermined point values, and the percent correct data key and box. Figure 5-6 is one example of the
Level of Accuracy box on the Task Summary page.
Figure 5-6. 2015–16 PAAP: Level of Accuracy
Students who participate in the state assessments through the PAAP may need varying degrees of
support to complete the required academic tasks. There are three types of support permissible when
administering a PAAP:
1. Accommodations selected from the approved list of standard support mechanisms used for general state assessments
2. Flexibility in the method of presentation and student response included within the PAAP directions for task administration
3. PAAP Levels of Assistance
Accommodations do not alter what the test measures or the comparability of results. When used
properly, appropriate test accommodations remove barriers to participation in the assessment and provide
students with diverse learning needs an equitable opportunity to demonstrate their knowledge and skills.
Accommodations are changes to the standard timing, setting, presentation, or response. An example
of an accommodation would be the teacher reading a science task aloud to a student who has a reading
disability. The teacher is not altering what is being measured; instead, the student is given the opportunity to
demonstrate what he or she knows and can do by eliminating the roadblock his or her disability might
otherwise present to the accurate measurement of science knowledge and skills. Students participating in the
PAAP may use any of the accommodations that have been approved for use in state assessments by the Maine
DOE.
MEA Science
The Operational Procedures document can be found on the MEA Science
website: http://www.maine.gov/doe/mea/administration/index.html.
Chapter 5—Test Content 16 2015–16 MeCAS Technical Report Part II

The Directions for Task Administration section within each PAAP Task Description includes
additional supports not listed among the approved general assessment accommodations. Because of the
modified nature of the PAAP and the population for whom the PAAP is intended, some flexibility in the
method of presentation is necessary and appropriate. It is important to remember that the use of these support
mechanisms does not affect the PAAP scoring formula. They do not change what is being measured in the
task.
If a student needs supports beyond those provided through approved accommodations or the
flexibility that is part of every PAAP Task Description, the opportunity to use individualized Levels of
Assistance is provided. Supports classified as Levels of Assistance are teacher-developed support
mechanisms that, while not modifying the content being measured, assist a student in completing the task or
retrieving the answer to a particular question without actually providing that answer to the student.
Levels of Assistance are determined on a three-point scale of 1–3, with each point affecting the
overall score of a PAAP task. Note that as the teacher support decreases, the point score increases. These
point values do not affect the student’s preliminary score for the task (the percent correct). Rather, the points
awarded for Levels of Assistance make up one part of the final scoring matrix, along with Level of Accuracy
and LoC. The following are the Levels of Assistance by score point:
Level of Assistance Score of 1
o Modeling
o Demonstrating a response similar to that desired (e.g., Teacher says, “When I put the water in the freezer, it gets cold, hard, and turns white.” What happens when you put water in the freezer? Student response: “It freezes.” or “It becomes ice.”). Note that this is not a question in the task bank as we would not use “freezer” in the question when the answer is “it freezes.”
Level of Assistance Score of 2
o Use of Option 2 (provided at LoC 1 when appropriate) to use fewer of the item sets multiple times in order to match the student’s knowledge.
o Limiting a student’s response (except at LoC 1) by removing one response option (e.g., multiple-choice items/problems) and reducing the response options from 3 to 2.
o Asking clarifying questions to stimulate student thought without providing clues to specific answers (e.g., “Which happened first? Show me on your board.”).
Level of Assistance Score of 3
o Independent
o Providing encouragement
o Completing task by using augmentative/alternative means of communication
o Repeating directions
o Reacting to student
Chapter 5—Test Content 17 2015–16 MeCAS Technical Report Part II

o Rereading a passage
o Reminding a student to stay focused
A special field is provided on each Task Summary page where detailed information regarding the
Level of Assistance for that particular task is recorded (as shown in Figure 5-7). The teacher administering the
task must first check the appropriate box indicating the Level of Assistance needed by the student (1–3). Once
a box has been marked, details regarding how the assistance was given must be circled on the provided list.
Figure 5-7. 2015–16 PAAP: Level of Assistance
It is vital that information regarding the Level of Assistance be recorded on each Task Summary page
by the teacher administering the task, as this information is essential to the scoring of the PAAP. If such
information is not provided, the task may be judged as Unscorable.
Levels of Assistance not permissible are the use of “hand-over-hand” (where the teacher prompts the
student by placing his or her hand over the student’s hand) or any alterations to the task. Altering a task
jeopardizes the integrity of the task and its alignment to the AGLEs.
In 2015–16, the Task Summary pages were available to fill in online from the Task Bank. Teachers
entered the information in the online forms, printed them, and then submitted the paper copy of the Task
Summary forms with the appropriate Task Description page and student work in the student’s paper portfolio.
Chapter 5—Test Content 18 2015–16 MeCAS Technical Report Part II

CHAPTER 6 TEST DEVELOPMENT
The PAAP is intended to provide students who have significant cognitive disabilities the opportunity
to participate in a statewide assessment that is both meaningful and academically challenging. Given the wide
diversity of this student population, great emphasis is placed on ensuring that the PAAP is appropriate and
accessible to all students. The assessment design allows students to progress through eight Levels of
Complexity (LoC). LoC 1, the lowest LoC, represents the lowest level of knowledge and entry level skills and
therefore provides students with the most access while still maintaining an academic foundation aligned to
grade-level content.
6.1 GENERAL PHILOSOPHY
The development of writing, mathematics, and science for the PAAP began with face-to-face
meetings over the course of three days (September 1–3, 2009) at Measured Progress. Each meeting consisted
of Maine DOE staff, Measured Progress Special Education Project Management staff, and Measured Progress
Curriculum and Assessment staff. The purpose of the meetings was to collaborate on plans for the
development of tasks to finish populating the PAAP Task Bank in writing, mathematics, and science. (Note:
The Task Bank was fully populated for reading in 2009–10.)
The notes from the above-mentioned planning meetings were frequently referenced by the
Curriculum and Assessment test developers, Special Education Specialist, and Maine DOE staff as items were
drafted and reviewed. In addition to the Measured Progress review process, staff from the Maine DOE and
small groups of stakeholders evaluated all tasks through a task tryout process. This multistage development
and review process provided ample opportunities to evaluate items for their alignment, accessibility,
appropriateness, and adherence to the principles of universal design. In this way, accessibility emerged as a
primary area of consideration throughout the item development process. This was critical in developing an
assessment that allows for the widest range of student participation as educators seek to provide access to the
general education curriculum and to foster high expectations for students with significant cognitive
disabilities.
Table 6-1 indicates the full development of science tasks by LoC for the Maine PAAP Task Bank.
This was completed in 2010–11.
Table 6-1. 2010–2011 PAAP: Task Development—Science LoCs AGLE1/Indicator Number of Tasks Total Tasks 1–2 D2 2 tasks per LoC2 4 1–8 D3, E1, E5 2 tasks per LoC2 48 3–4 D2 2 tasks per LoC2 4 5–6 D4 2 tasks per LoC2 4
continued
Chapter 6—Test Development 19 2015–16 MeCAS Technical Report Part II

LoCs AGLE1/Indicator Number of Tasks Total Tasks 4 E2 2 tasks per LoC2 2 6 E3 2 tasks per LoC2 2
4 & 6 E4 2 tasks per LoC2 4 Overall Science task revision total 68 1 AGLE = Alternate Grade Level Expectation 2 LoC = Level of Complexity as described in the AGLEs
6.2 ROLE OF COMMITTEES IN TEST DEVELOPMENT
The Advisory Committee comprised teachers, education administrators, representatives from higher
education, and other agencies who advised the Maine DOE on defining the parameters of the alternate
assessment. The committee was asked to review the issues related to the creation of the AGLEs, PAAP
Blueprint, PAAP tasks, and the achievement-level descriptors for students who are unable to participate in
statewide assessments even with accommodations. Members responded to written samples and
recommendations from internal groups at Measured Progress and the Maine DOE regarding these areas to
ensure accountability for students taking the PAAP. They also worked with the Maine DOE to determine the
structures that serve as the basis for today’s PAAP.
Chapter 6—Test Development 20 2015–16 MeCAS Technical Report Part II

CHAPTER 7 ALIGNMENT
7.1 DESCRIPTION OF LINKAGES TO DIFFERENT CONTENT AREAS ACROSS GRADES
The Maine DOE contracted two external alignment studies to be completed by Amy S. Burkam,
Lothlorien Consulting, LLC: one in March 2010 and one in June 2012. The March 2010 study was conducted
in two phases. The results of the first study are documented in the 2010–11 technical report. The 2012 study
was discussed in the 2011–12 technical report.
Chapter 7—Alignment 21 2015–16 MeCAS Technical Report Part II

CHAPTER 8 PAAP ADMINISTRATION TRAINING
In November 2015, the Maine DOE, in collaboration with program management at Measured
Progress, trained teachers from across the state via webinar in the process of constructing a PAAP.
Introductory PAAP trainings, titled “Introduction to PAAP,” were designed and presented to teachers and
administrators who had not administered a PAAP previously. This training provided test administrators with
the steps for administration of the PAAP process (see Section 8.1), a thorough review of the Alternate Grade
Level Expectations (AGLEs) document, and other changes in procedures that had been made since the prior
year. Beginning in June 2012, teachers’ scores submitted electronically on the Task Summary page in the
Task Bank were used as the first score. The second score was provided by Measured Progress’s trained
scorers. This use of the Task Bank was integrated into the PAAP update presentations.
One webinar was held for teachers throughout the state. Table 8-1 outlines the number of participants
in that webinar.
Table 8-1. 2015–16 PAAP: Webinar Attendance Count Workshop Webinar
Introduction to PAAP 51
A webinar that was originally conducted in 2012 on the PAAP was used in 2015. The webinar
provided teachers with guidance on how to submit a PAAP for scoring. The purpose was to remind teachers
of the process required to electronically submit the Task Summary pages (where teachers recorded the
students’ scores) via the ProFile Task Bank before the administration window closed on April 30, 2016. A
power point entitled “2015–16 Introduction to the PAAP” was also posted on Maine’s DOE website
(http://www.maine.gov/doe/paap/training/index.html).
8.1 STEPS FOR ADMINISTRATIONS
A detailed handbook was developed by the Maine DOE in collaboration with Measured Progress as a
training tool to instruct teachers on how to design and implement a PAAP. Minimal changes to the handbook
occurred between the 2014–15 and 2015–16 administrations. The 2015–16 PAAP Administration Handbook,
which includes the AGLEs, was available to download from the Maine DOE’s website
(http://www.maine.gov/doe/paap/).
The administration process, clearly outlined in the PAAP Administration Handbook, is broken into
steps that guide the teacher from the point of determining student eligibility to the actual submission of the
PAAP. The handbook provides detailed information to the reader on what evidence to collect and how to
design a PAAP appropriate for an individual student.
Chapter 8—PAAP Administration Training 22 2015–16 MeCAS Technical Report Part II
The main PAAP Administration Handbook sections are as follows:
Vital Information At-a-Glance
Introduction
Determining the Appropriate Avenue for Student Participation in State Assessments
Alternate Grade Level Expectations (AGLEs)
The Task Bank
Types of Supports
Administering a PAAP
Scoring a PAAP
Reporting
Code of Conduct
Supplemental Materials
Announcements of the upcoming trainings and registration information were posted on the PAAP
website and e-mailed to Special Education Directors. Workshop registration was submitted through Measured
Progress’s online registration application.
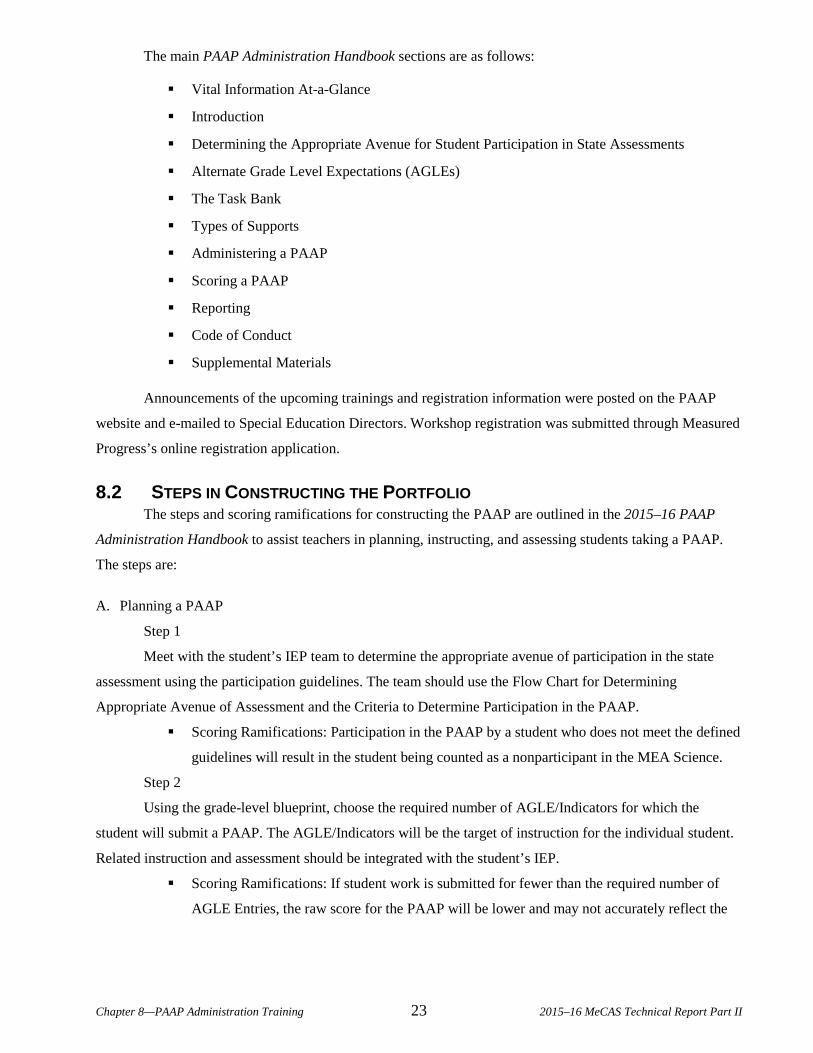
8.2 STEPS IN CONSTRUCTING THE PORTFOLIO The steps and scoring ramifications for constructing the PAAP are outlined in the 2015–16 PAAP
Administration Handbook to assist teachers in planning, instructing, and assessing students taking a PAAP.
The steps are:
A. Planning a PAAP
Step 1
Meet with the student’s IEP team to determine the appropriate avenue of participation in the state
assessment using the participation guidelines. The team should use the Flow Chart for Determining
Appropriate Avenue of Assessment and the Criteria to Determine Participation in the PAAP.
Scoring Ramifications: Participation in the PAAP by a student who does not meet the defined
guidelines will result in the student being counted as a nonparticipant in the MEA Science.
Step 2
Using the grade-level blueprint, choose the required number of AGLE/Indicators for which the
student will submit a PAAP. The AGLE/Indicators will be the target of instruction for the individual student.
Related instruction and assessment should be integrated with the student’s IEP.
Scoring Ramifications: If student work is submitted for fewer than the required number of
AGLE Entries, the raw score for the PAAP will be lower and may not accurately reflect the
Chapter 8—PAAP Administration Training 23 2015–16 MeCAS Technical Report Part II

student’s level of knowledge and skills. AGLE Entries submitted beyond the number required
will not be scored.
Step 3
For each AGLE/Indicator required, use the PAAP AGLEs to identify the LoC descriptors that are
appropriate for inclusion in the student’s instructional program. Consider the student’s current level of
performance and the possibilities for increasing that level through instruction as you read the PAAP LoC
descriptors. The LoC should challenge the student and allow the opportunity for the student to demonstrate
proficiency.
B. Registering a Student for PAAP
Step 4
Create a user account within the PAAP Task Bank. This can be done by using the registration button
on the top of the Task Bank homepage. The Task Bank can be accessed by going
to http://www.maine.gov/doe/paap/administration/index.html and clicking on the “Task Bank” button. More
detailed instructions on creating your account can be found in the Task Bank Manual located on the
homepage of the Task Bank.
Step 5
Add students to your list by entering the student ID (MEDMS #) and then verifying the student name
and grade upon pressing the “OK” button.
Step 6
Verify that the student information is accurate. Then use the “Add to Student List” button to register
the student.
If the student information is not accurate, contact the person responsible for entering and uploading
MEDMS data to the state site from your school (this may be your building secretary or other designee). If the
student record is not found in the Task Bank once the student is enrolled in Infinite Campus State Edition
(ICSE) correctly, contact the Maine DOE to make changes in the Task Bank.
C. Implementing a PAAP
Step 7
Using tasks from the Task Bank, collect student work for the required AGLE/Indicators throughout
the testing window. Students may have been assessed on a task multiple times during the testing window.
Submit only the required number of completed tasks for an Entry.
When the teacher records the answer on the student work template, the teacher must indicate the
student response (e.g., “student pointed” on the answer line is not sufficient; you must write “student pointed
to the cup”).
Scoring Ramifications: Fewer than the required number of tasks submitted for an AGLE
Entry will result in the task being “Unscorable.” Extra student work submitted will not be
Chapter 8—PAAP Administration Training 24 2015–16 MeCAS Technical Report Part II
scored and may result in scorer confusion and negatively affect the scoring process for the
PAAP. If there is no student response listed, the task may be “Unscorable.”
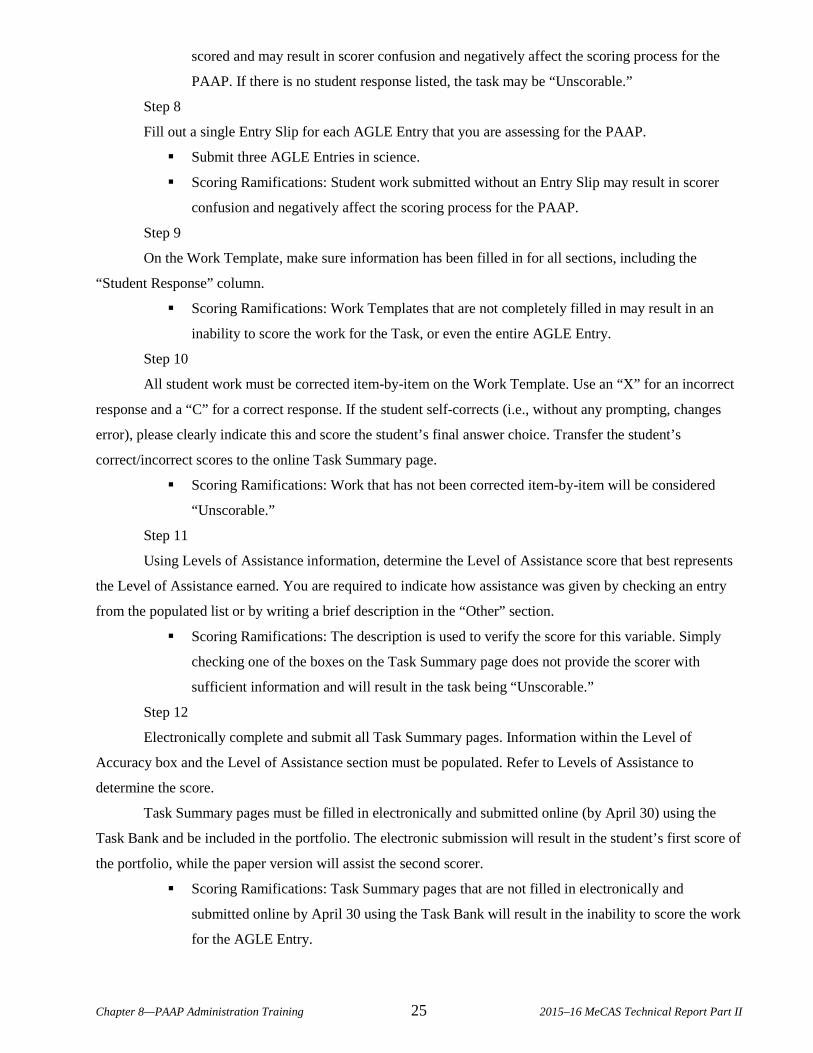
Step 8
Fill out a single Entry Slip for each AGLE Entry that you are assessing for the PAAP.
Submit three AGLE Entries in science.
Scoring Ramifications: Student work submitted without an Entry Slip may result in scorer
confusion and negatively affect the scoring process for the PAAP.
Step 9
On the Work Template, make sure information has been filled in for all sections, including the
“Student Response” column.
Scoring Ramifications: Work Templates that are not completely filled in may result in an
inability to score the work for the Task, or even the entire AGLE Entry.
Step 10
All student work must be corrected item-by-item on the Work Template. Use an “X” for an incorrect
response and a “C” for a correct response. If the student self-corrects (i.e., without any prompting, changes
error), please clearly indicate this and score the student’s final answer choice. Transfer the student’s
correct/incorrect scores to the online Task Summary page.
Scoring Ramifications: Work that has not been corrected item-by-item will be considered
“Unscorable.”
Step 11
Using Levels of Assistance information, determine the Level of Assistance score that best represents
the Level of Assistance earned. You are required to indicate how assistance was given by checking an entry
from the populated list or by writing a brief description in the “Other” section.
Scoring Ramifications: The description is used to verify the score for this variable. Simply
checking one of the boxes on the Task Summary page does not provide the scorer with
sufficient information and will result in the task being “Unscorable.”
Step 12
Electronically complete and submit all Task Summary pages. Information within the Level of
Accuracy box and the Level of Assistance section must be populated. Refer to Levels of Assistance to
determine the score.
Task Summary pages must be filled in electronically and submitted online (by April 30) using the
Task Bank and be included in the portfolio. The electronic submission will result in the student’s first score of
the portfolio, while the paper version will assist the second scorer.
Scoring Ramifications: Task Summary pages that are not filled in electronically and
submitted online by April 30 using the Task Bank will result in the inability to score the work
for the AGLE Entry.
Chapter 8—PAAP Administration Training 25 2015–16 MeCAS Technical Report Part II

D. Organizing a PAAP
Step 13
Assemble each AGLE Entry by attaching the required number of Task Descriptions with
accompanying student work and Task Summary pages. Do not attach the following:
More than the required number of Task Descriptions.
More than the required amount of student work and Task Summary pages.
Description cards, and/or cutout graphics used for the tasks. If you would like to save these
items, place them in a separate section at the end of the PAAP.
Scoring Ramifications: Student work submitted without an Entry Slip and/or without the
required number of Task Descriptions may result in scorer confusion and negatively affect
the scoring process for the PAAP. Student work submitted without the required number of
Work Templates and/or the required number of Task Summary pages will result in the entry
being “Unscorable.” Extra Task Descriptions and/or student work submitted will not be
scored and may result in scorer confusion and negatively affect the scoring process for your
student’s PAAP.
Step 14
Arrange each AGLE Entry in alphabetical order by AGLE and then in numerical order by Indicator.
Refer to the grade-level blueprint for more details.
Scoring Ramifications: Lack of organization may result in scorer confusion and negatively
affect the scoring process.
Step 15
Print the Table of Contents (available through the Task Bank or on the PAAP website) and check that
all white sections of the Entry Slips (Name and Grade), Student Work (Name and Date), and Task Summary
page (Name, Date, Level of Accuracy, and Level of Assistance) have been filled in.
Scoring Ramifications: Incomplete documentation and lack of organization can result in an
inability to score the PAAP.
E. Submitting a PAAP
Step 16
Prepare the PAAP for mailing according to the directions received from Measured Progress in the
return materials shipment that will be sent in April. Measured Progress has arranged for a one-day UPS
pickup of all PAAPs during the first week of May from every school with PAAP students. UPS will deliver
the PAAPs to Measured Progress. PAAPs will be returned to schools at the start of the new school year.
Scoring Ramifications: Any PAAPs received later than one week from the pickup date will
not be scored, and students for whom late PAAPs have been submitted will be counted as
nonparticipants in the MEA Science.
Chapter 8—PAAP Administration Training 26 2015–16 MeCAS Technical Report Part II

IMPORTANT: Sending schools are responsible for verifying that students who are tuitioned to
Special Purpose Private Schools, or who are attending out-of-district programs, are being assessed.
Chapter 8—PAAP Administration Training 27 2015–16 MeCAS Technical Report Part II
CHAPTER 9 SCORING
One 2015–16 scoring session was held at Measured Progress in Dover, New Hampshire. Eight
professionally trained scorers and three table leaders participated in the scoring session. The Measured
Progress scorers were interviewed, hired (based on MEA/PAAP-established scorer criteria), and trained for
PAAP scoring. The 10 participants scored a total of 465 PAAPs.
9.1 TABLE LEADER AND SCORER RECRUITMENT AND QUALIFICATIONS
Table leaders and scorers were handpicked by Measured Progress staff from a pool of experienced
table leaders and scorers and were required to pass a qualifying set of sample portfolio entries. Scorers and
table leaders were required to sign nondisclosure agreements and agree to maintain the security of PAAP
materials at all times. The scorer code of conduct, which details the importance of confidentiality and bias-
free scoring, was also reviewed with the scorers.
9.2 TABLE LEADER AND SCORER TRAINING
Measured Progress table leaders and scorers attended a training session at Measured Progress on June
6, 2016. The first half of the training session was held specifically for table leaders. They were trained on
their responsibilities as table leaders, which included the online scoring application, the flow of materials at
their tables, and monitoring third reads. Scorers joined the table leaders for the second half of the training
session for an in-depth review of the materials.
The training included a PowerPoint presentation showing the steps required in the scoring process,
from checking the student name to entering scores in the online application developed for PAAP scoring.
Staff then conducted a hands-on training in the use of the online ProFile scoring application. A sample
portfolio for Terry Flynn, a fictitious student, contained entries and was used to illustrate the scoring process.
These sample entries, including potential scoring issues, were reviewed and discussed. Next, table leaders and
scorers practiced using sample sets before taking online qualifying sets. All prospective table leaders and
scorers qualified by earning the required scores on these sets. Prior to any scoring, table leader guidelines
were reviewed to assure consistency in their understanding of the expectations. In addition, a table leader
debrief occurred at the end of each scoring day to review procedures and address issues that came up during
scoring.
Personnel from Measured Progress and the Maine DOE were available to answer questions that arose
during both the training and the actual scoring sessions. This was essential as clarifications to any scoring
irregularities/rules or Alternate Grade Level Expectations (AGLEs)/Indicators arose, as well as some initial
Chapter 9—Scoring 28 2015–16 MeCAS Technical Report Part II

assistance with the online scoring application. Scorers were provided with the 2015–16 AGLEs (see
Appendix A), 2016 scoring instructions, 2015–16 task scoring rubric, and 2016 scoring rules.
9.3 SCORING PROCESS
PAAP scoring was conducted using the online ProFile scoring application, which was developed for
this contract. The ProFile application allowed teachers’ scores and scoring staff scores to be submitted online.
Teachers’ scores were used for the first score of record, and the scoring staff provided the second score.
Teachers were required to complete Task Summary pages electronically for their students through the ProFile
Task Bank, while Measured Progress’s scoring staff submitted their scores on a similar Task Summary page
in the scoring application. Each PAAP was read and scored at least once by a Measured Progress scorer, with
some of the PAAPs being scored a third time in a double-blind fashion. (See Section 11.4 for interrater
consistency.) A PAAP was scored a third time if scorers 1 (teacher) and 2 (scoring staff) did not have exact
agreement for Level of Complexity (LoC), Level of Accuracy, or Level of Assistance on any content standard
entry. The third score was the final score of record for each dimension that was discrepant. The third scores
were done by Maine DOE, Measured Progress program management personnel, and senior scoring staff.
The scoring process was explained in detail to both the table leaders and the scorers. The following
steps were required of all table leaders and scorers.
Step 1. Prescreen the PAAP. Scorers were to ensure that
the student was not known to the scorer, and
the PAAP was organized correctly.
Step 2. Log in to the scoring application using the assigned scorer number and password. The scorer ID was attached to the PAAP, thereby identifying scorer 2.
Step 3. Verify that the student information on the portfolio matches that in the ProFile scoring application. Scorers were instructed to verify that the portfolio demographic information provided on the Verify Demographics screen (student MEDMS number, name, grade, and district and school names) matches the information on the portfolio. If they are the same, then the scorer continued to the next step. If there were any differences, the scorer alerted senior staff to resolve the issue.
Step 4. Verify that all the required components are present. Scorers used the ProFile Verify Entries screens to determine if the portfolio contained all the requisite pieces and if the grade requirements had been met. If an AGLE/Indicator was incorrect or any portfolio pieces were identified as missing, then the scorer would indicate the problem by assigning the associated comment code (refer to Step 6, Provide comment codes) and finalize that entry.
Step 5. Score each content area entry. If an entry was determined to be scorable, the scorer then read the individual tasks that met the requirements for an entry and scored them in ProFile on three dimensions—LoC, Level of Accuracy, and Level of Assistance.
Chapter 9—Scoring 29 2015–16 MeCAS Technical Report Part II

Step 6. Provide comment codes. Scorers also received instruction on how to complete comment codes, which provide teachers with valuable feedback on the entry scores. At least one comment code must be selected in ProFile for each entry (maximum of two). Based on the totality of the entry and the information provided on the comment code sheet, the second scorer selected one or two comment codes for the entry. Refer to Figure 9-1, 2015–16 PAAP: PAAP Comment Codes.
In the quality-control area, ProFile provided a real-time list of unscored and discrepant portfolios that
were then located and distributed appropriately for scoring. As an added measure, Measured Progress
personnel tracked the portfolios to ensure that all had been scored and accounted for at the end of the scoring
session.
Refer to Appendix C for additional documents that were used during scoring. The PAAP Scoring
Instructions 2016 describes the scoring process in greater detail than noted above. The 2016 Task Scoring
Rubric provides an overview of the scores related to each dimension—LoC, Level of Accuracy, and Level of
Assistance.
Chapter 9—Scoring 30 2015–16 MeCAS Technical Report Part II

Figure 9-1. 2015–16 PAAP: PAAP Comment Codes
9.4 FLOW OF MATERIALS
The scoring teams used the following instructions for the flow of materials in the day-to-day scoring
of the PAAPs.
Scorers Request a PAAP from the table leader.
Verify that the student information on the portfolio matches that in the ProFile scoring application.
Verify that all required contents of the PAAP are inside the binder.
Chapter 9—Scoring 31 2015–16 MeCAS Technical Report Part II

Score according to 2016 Scoring Instructions sheet (Appendix C).
Enter scores accurately in ProFile.
Return scored PAAP to the table leader.
Repeat this process with each PAAP.
Table Leaders Make sure that at least one box of unscored PAAP binders is available.
Distribute unscored PAAPs to scorers.
Perform a read-behind of each scorer’s first PAAP and any scorer evaluated by a table leader as having difficulty with the process; review random PAAPs throughout the day to validate the scoring.
Meet with the scorer immediately if any problems with scoring are noticed. If problems persist, notify personnel from the Maine DOE or Measured Progress.
Place the PAAP in its original envelope.
Place the envelope in the box from which it came.
Score additional PAAPs as outlined in the scorer instructions above.
9.5 SECURITY
During scoring workdays, all PAAPs remained in sight of Measured Progress and Maine DOE
personnel at all times. During the day, PAAPs were methodically delivered back and forth from the quality-
control room to the scoring room. At the end of each day, PAAPs were stored in a locked room.
Measured Progress’s distribution personnel delivered the PAAPs directly to the Measured Progress
scoring site. After all scoring was completed, the PAAPs were returned to the Measured Progress warehouse,
where they were stored until September 8, 2016, when they were shipped back to their point of origin.
9.6 SCORING RUBRIC
During PAAP scoring, the 2016 PAAP task scoring rubric was used to determine the official scores
of record for LoC, Level of Accuracy, and Level of Assistance.
Level of Accuracy was scored on a Likert scale of 1–4 based on the overall task percent correct score
(e.g., a task percent correct score of 67% would receive an overall Level of Accuracy score of 3). Figure 9-2
demonstrates how a score of 1, 2, 3, or 4 was obtained. When scorers marked each item as correct/incorrect,
ProFile automatically calculated the Level of Accuracy scores (1–4) based on the table below.
Chapter 9—Scoring 32 2015–16 MeCAS Technical Report Part II

Figure 9-2. 2015–16 PAAP: Task Score for Level of Accuracy
Level of Assistance was scored on a scale of Unscorable (receiving a score of 0) to 3, based on the
approved accommodations outlined in Figure 9-3. The scorer entered the Level of Assistance and the type of
support provided from the drop-down list below each Level of Assistance.
Figure 9-3. 2015–16 PAAP: Task Score for Level of Assistance
The 2016 PAAP task scoring rubric is shown in Figure 9-4 below.
Chapter 9—Scoring 33 2015–16 MeCAS Technical Report Part II

Figure 9-4. 2015–16 PAAP: Scoring Rubric
2016 PAAP TASK SCORING RUBRIC
Task Score for Level of Complexity Unscorable 1 2 3 4 5 6 7 8
The PAAP Task did not meet all requirements. Reasons for Unscorables: Level of Complexity is not consistent with other Tasks
Level of Complexity is not grade appropriate
Task Score for Level of Accuracy 1 2 3 4
Student work related to the Task was completed with a score of 0 –19%.
Student work related to the Task was completed with a score of 20 – 60%.
Student work related to the Task was completed with a score of 61 – 84%.
Student work related to the Task was completed with a score of 85 – 100%.
Task Score for Level of Assistance Unscorable 1 2 3
Hand-over-hand Altering
items/tasks (Task no longer connects to the AGLE)
Modeling Demonstrating a
response similar to the desired response
Other
Use of Option 2 (LoC 1 only) to use fewer of the item sets multiple times to match student knowledge
Limiting a student’s
response (outside of LoC 1 at Option 2) by removing one response option
Use of clarifying
questions to stimulate student thought to the specific Task without providing clues to specific answers
Other
Independent Providing
encouragement Completing Tasks by
using augmentative/alternate means of communication
Repeating directions Reacting to a student Rereading a passage Reminding a student to
stay focused Other
Chapter 9—Scoring 34 2015–16 MeCAS Technical Report Part II

After each PAAP was scored, a table leader from Measured Progress removed the PAAP from its
envelope to confirm that it corresponded with the student identified on the envelope. The PAAP was then
inserted in its envelope and returned to the box.
Then the box of PAAPs was returned to the quality-control room where it remained unless a PAAP
was identified via the ProFile scoring application as needing a third score. At this time, the PAAP would have
been provided to either a Measured Progress program manager or a member of the Maine DOE for a third
read.
When the person doing the third read entered the PAAP identification number in ProFile for a third
score, the application displayed the scoring dimension(s) in disagreement on the screen. The score resulting
from the third read became the score of record. At this point, the PAAP was considered complete and filed in
its box.
9.7 CALCULATION OF REPORTED SCORES
After the scoring process was completed, students’ scores on each entry were calculated based on a
formula that combines their LoC, Level of Accuracy, and Level of Assistance scores for each of the tasks in
that entry. The formula weights the LoC score more heavily than the other two dimension scores. The overall
score of record is then the sum of the entry scores. Because of the use of the formula, there may be multiple
ways that a student can attain a given total score. Complete details of how reported raw scores are calculated
are provided in Appendix I.
Chapter 9—Scoring 35 2015–16 MeCAS Technical Report Part II

CHAPTER 10 CLASSICAL ITEM ANALYSIS
As noted in Brown (1983), “A test is only as good as the items it contains.” A complete evaluation of
a test’s quality must include an evaluation of each item. Both Standards for Educational and Psychological
Testing (AERA et al., 2014) and Code of Fair Testing Practices in Education (Joint Committee on Testing
Practices, 2004) include standards for identifying quality items. While the specific statistical criteria identified
in these publications were developed primarily for general—not alternate—assessment, the principles and
some of the techniques apply within the alternate assessment framework as well.
Both qualitative and quantitative analyses were conducted to ensure that Maine PAAP items met
these standards. Qualitative analyses are described in earlier sections of this report; this section focuses on the
quantitative evaluations. The statistical evaluations discussed are difficulty indices and discrimination (item-
test correlations), structural relationships (correlations among the dimensions), and bias and fairness. The item
analyses presented here are based on the statewide administration of the 2015–16 PAAP.
10.1 DIFFICULTY AND DISCRIMINATION
For the purpose of calculating item statistics, the two dimension scores on each task (Level of
Accuracy and Level of Assistance) can be considered similar to those for traditional test items. Difficulty was
defined as the average proportion of points achieved on an item and was measured by obtaining the average
score on an item and dividing by the maximum score for the item. Using this definition, all items were
evaluated in terms of item difficulty according to standard classical test theory practices. PAAP tasks are
scored polytomously, such that a student can achieve a score of 1, 2, 3, or 4 for Level of Accuracy and a score
of 1, 2, or 3 for Level of Assistance. By computing the difficulty index as the average proportion of points
achieved, the items are placed on a scale that ranges from 0.0 to 1.0. Although the p-value is traditionally
described as a measure of difficulty (as it is described here), it is properly interpreted as an easiness index,
because larger values indicate easier items.
An index of 0.0 indicates that all students received no credit for the item, and an index of 1.0
indicates that all students received full credit for the item. Items that have either a very high or very low
difficulty index are considered to be potentially problematic, because they are either so difficult that few
students get them right or so easy that nearly all students get them right. In either case, such items should be
reviewed for appropriateness for inclusion on the assessment. If an assessment were composed entirely of
very easy or very hard items, all students would receive nearly the same scores, and the assessment would not
be able to differentiate high-ability students from low-ability students.
It is worth mentioning that using a norm-referenced criterion such as p-values to evaluate test items is
somewhat contradictory to the purpose of a criterion-referenced assessment like the PAAP. Criterion-
referenced assessments are primarily intended to provide evidence on student progress relative to a standard
Chapter 10—Classical Item Analysis 36 2015–16 MeCAS Technical Report Part II

rather than to differentiate among students. Thus, the generally accepted criteria regarding classical item
statistics are only cautiously applicable to the PAAP.
A desirable feature of an item is that the higher-ability students perform better on the item than do
lower-ability students. The correlation between student performance on a single item and total test score is a
commonly used measure of this characteristic of an item. Within classical test theory, this item-test
correlation is referred to as the item’s “discrimination,” because it indicates the extent to which successful
performance on an item discriminates between high and low scores on the test. The discrimination index used
to evaluate PAAP items was the Pearson product-moment correlation. The theoretical range of this statistic is
-1.0–1.0.
Discrimination indices can be thought of as measures of how closely an item assesses the same
knowledge and skills assessed by other items contributing to the criterion total score. That is, the
discrimination index can be thought of as a measure of construct consistency. In light of this interpretation,
the selection of an appropriate criterion total score is crucial to the interpretation of the discrimination index.
For the PAAP, the test total score was used as the criterion score.
A summary of the item difficulty and item discrimination statistics for each grade/content area
combination is presented in Table 10-1. The mean difficulty values shown in the table indicate that, overall,
students performed well on the items on the PAAP. In contrast to alternate assessments, the difficulty values
for assessments designed for the general population tend to be in the 0.4–0.7 range for the majority of items.
Because the nature of alternate assessments is different from that of general assessments, and because very
few guidelines exist as to criteria for interpreting these values for alternate assessments, the values presented
in Table 10-1 should not be interpreted to mean that the students performed better on the PAAP than the
students who took general assessments did on those tests. An additional factor, as mentioned above, is that
item statistics are calculated from students’ Level of Accuracy and Level of Assistance scores. Students’
overall scores, on the other hand, are based on the Level of Accuracy and Level of Assistance scores along
with the Level of Complexity (LoC). A formula that combines the three dimensions, weighting LoC more
heavily, is used to compute the students’ score of record. Looking at the p-values in isolation would suggest
that students’ reported scores would all be very high; however, use of the formula results in reported scores
that show greater spread across the range of obtainable scores than would be expected based on the p-values
alone. See Appendix I for complete details on how the score of record is calculated.
Also shown in Table 10-1 are the mean discrimination values. Because the majority of students
received high scores on the tasks, the discrimination indices are somewhat lower than one might expect. This
is an artifact of how discrimination is calculated: If all of the students get an item correct, there is little
variability in the criterion scores that can be differentiated. As with the item difficulty values, because the
nature and use of the PAAP are different from those of a general assessment, and because very few guidelines
exist as to criteria for interpreting these values for alternate assessments, the statistics presented in Table 10-1
should be interpreted with caution.
Chapter 10—Classical Item Analysis 37 2015–16 MeCAS Technical Report Part II

Table 10-1. 2015–16 PAAP: Summary of Item Difficulty and Discrimination Statistics by Subject and Grade
Subject Grade Number of Items
p-Value
Discrimination
Mean Standard Deviation Mean Standard
Deviation
Science 5 48 0.80 0.12 0.46 0.22 8 72 0.79 0.11 0.46 0.28
HS 96 0.83 0.08 0.50 0.30
In addition to the item difficulty and discrimination summaries presented above, item-level classical
statistics and item-level score distributions were also calculated. Item-level classical statistics are provided in
Appendix D; item difficulty and discrimination values are presented for each item. Item-level score
distributions (i.e., the percentage of students who received each score point) are provided in Appendix E for
each item.
10.2 STRUCTURAL RELATIONSHIP
By design, the achievement-level classification of the PAAP is based on two of the three dimensions
(accuracy and assistance). The third dimension (complexity) is used at the time of administering the
assessment to determine the specific sets of tasks appropriate for the student. As with any assessment, it is
important that these dimensions be carefully examined. This was achieved by exploring the relationships
among student dimension scores with Pearson correlation coefficients. A very low correlation (near 0) would
indicate that the dimensions are not related; a low negative correlation (approaching -1.00), that they are
inversely related (i.e., that a student with a high score on one dimension had a low score on the other); and a
high positive correlation (approaching 1.00), that the information provided by one dimension is similar to that
provided by the other dimension.
The average correlations between Level of Accuracy and Level of Assistance by content area and
grade are shown in Table 10-2.
Table 10-2. 2015–16 PAAP: Average Correlations Between Level of Accuracy and Level of Assistance by Content Area and Grade
Content Area Grade Number
of Items Average
Correlation
Correlation Standard Deviation
Science 5 24 0.35 0.24 8 32 0.41 0.31
HS 46 0.39 0.39
Chapter 10—Classical Item Analysis 38 2015–16 MeCAS Technical Report Part II

10.3 BIAS/FAIRNESS
Code of Fair Testing Practices in Education (Joint Committee on Testing Practices, 2004) explicitly
states that subgroup differences in performance should be examined when sample sizes permit, and actions
should be taken to make certain that differences in performance are due to construct-relevant rather than
construct-irrelevant factors. Standards for Educational and Psychological Testing (AERA et al., 2014)
includes similar guidelines.
When appropriate, the standardization differential item functioning (DIF) procedure (Dorans &
Kulick, 1986) is used to identify items for which subgroups of interest perform differently, beyond the impact
of differences in overall achievement. However, because of the small number of students who take the PAAP,
and because those students take different combinations of tasks, it was not possible to conduct DIF analyses.
This is because conducting DIF analyses using groups of fewer than 200 students would result in inflated type
I error rates.
Although it is not possible to run quantitative analyses of item bias for PAAP, fairness is addressed
through Measured Progress’s standard item development and review procedures, described in detail earlier in
this report. These procedures, which are modeled on the recommendations laid out in Standards for
Educational and Psychological Testing (AERA et al., 2014), are designed to ensure that the test is free of any
insensitive or offensive material. All tasks that are available to teachers in the standardized Task Bank have
been through these comprehensive bias and sensitivity reviews.
Issues of fairness are also addressed in the PAAP scoring procedures. Chapter 9 of this report
describes in detail the scoring rubrics used, selection and training of scorers, and scoring quality-control
procedures. These processes ensure that bias due to differences in how individual scorers award scores is
minimized.
Chapter 10—Classical Item Analysis 39 2015–16 MeCAS Technical Report Part II

CHAPTER 11 CHARACTERIZING ERRORS ASSOCIATED WITH TEST SCORES
The main use of the PAAP scores is for school-, district-, and state-level accountability in the federal
(No Child Left Behind Act) and state accountability systems. The students are classified as Well Below State
Expectations, Below State Expectations, At State Expectations and Above State Expectations, and they are
included in the state’s accountability calculation.
As with the classical item statistics presented in the previous chapter, the two dimension scores on
each task (Level of Accuracy and Level of Assistance) were used as the item scores for purposes of
calculating reliability estimates.
11.1 RELIABILITY
In the previous chapter, individual item characteristics of the 2015–16 Maine PAAP were presented.
Although individual item performance is an important focus for evaluation, a complete evaluation of an
assessment must also address the way in which items function together and complement one another. Any
measurement includes some amount of measurement error. No academic assessment can measure student
performance with perfect accuracy; some students will receive scores that underestimate their true ability, and
other students will receive scores that overestimate their true ability. Items that function well together produce
assessments that have less measurement error (i.e., the error is small on average). Such assessments are
described as “reliable.”
There are a number of ways to estimate an assessment’s reliability. One approach is to split all test
items into two groups and then correlate students’ scores on the two half-tests. This is known as a split-half
estimate of reliability. If the two half-test scores correlate highly, the items on them are likely measuring very
similar knowledge or skills. It suggests that measurement error will be minimal.
The split-half method requires psychometricians to select items that contribute to each half-test score.
This decision may have an impact on the resulting correlation, since each different possible split of the test
halves will result in a different correlation. Another problem with the split-half method of calculating
reliability is that it underestimates reliability, because test length is cut in half. All else being equal, a shorter
test is less reliable than a longer test. Cronbach (1951) provided a statistic, alpha (α), which avoids the
shortcomings of the split-half method by comparing individual item variances to total test variance.
Chapter 11—Characterizing Errors Associated with Test 40 2015–16 MeCAS Technical Report Part II Scores

Cronbach’s α was used to assess the reliability of the 2015–16 Maine PAAP tests. The formula is as follows:
𝛼𝛼 ≡ 𝑛𝑛𝑛𝑛−1
�1 −∑ 𝜎𝜎�𝑌𝑌𝑖𝑖�
2𝑛𝑛𝑖𝑖=1
𝜎𝜎𝑥𝑥2�,
where i indexes the item, n is the number of items,
𝜎𝜎(𝑌𝑌𝑖𝑖)2 represents individual item variance, and
𝜎𝜎𝑥𝑥2 represents the total test variance.
Table 11-1 presents raw score descriptive statistics (maximum possible score, average, and standard
deviation), Cronbach's α coefficient, and raw score standard error of measurement (SEM) for each content
area and grade.
Table 11-1. 2015–16 PAAP: Raw Score Descriptive Statistics, Cronbach’s Alpha, and SEM by Subject and Grade
Subject Grade Number ofStudents
Raw Score Alpha SEM
Maximum Mean StandardDeviation
Science 5 151 69 46.20 14.36 0.72 7.60 8 154 99 61.01 25.32 0.86 9.47
HS 159 129 79.92 35.30 0.89 11.71
An alpha coefficient toward the high end is taken to mean that the items are likely measuring very
similar knowledge or skills (i.e., they complement one another and suggest a reliable assessment).
11.2 SUBGROUP RELIABILITY
The reliability coefficients discussed in the previous section were based on the overall population of
students who took the 2015–16 PAAP. Subgroup Cronbach’s α’s were calculated using the formula defined
above with only the members of the subgroup in question included in the computations. These statistics are
reported in Appendix F. Note that statistics are only reported for subgroups with at least 10 students.
For several reasons, the results of this section should be interpreted with caution. First, inherent
differences between grades and content areas preclude making valid inferences about the quality of a test
based on statistical comparisons with other tests. Second, reliabilities are dependent not only on the
measurement properties of a test but also on the statistical distribution of the studied subgroup. For example,
it can be readily seen in Appendix F that subgroup sample sizes may vary considerably, which results in
natural variation in reliability coefficients. Or α, which is a type of correlation coefficient, may be artificially
depressed for subgroups with little variability (Draper & Smith, 1998). Third, there is no industry standard to
interpret the strength of a reliability coefficient, and this is particularly true when the population of interest is
a single subgroup.
Chapter 11—Characterizing Errors Associated with Test 41 2015–16 MeCAS Technical Report Part II Scores

11.3 DECISION ACCURACY AND CONSISTENCY
While related to reliability, the accuracy and consistency of classifying students into performance
categories are even more important statistics in a standards-based reporting framework (Livingston & Lewis,
1995). Unlike generalizability coefficients, decision accuracy and consistency (DAC) can usually be
computed with the data currently available for most alternate assessments. For every 2015–16 PAAP grade
and content area, each student was classified into one of the following achievement levels: Well Below State
Expectations, Below State Expectations, At State Expectations and Above State Expectations. However,
because of the small testing population for the PAAP, it was not possible to calculate DAC based on
classification into the four achievement levels; instead, the categories were collapsed into Proficient or Not
Proficient. Because the Proficient cut is what is used for state and federal accountability purposes, results of
DAC are most critical for these two categories. This section of the report explains the methodologies used to
assess the reliability of classification decisions and presents the results.
Accuracy refers to the extent to which decisions based on test scores match decisions that would have
been made if the scores did not contain any measurement error. Accuracy must be estimated, because
errorless test scores do not exist. Consistency measures the extent to which classification decisions based on
test scores match the decisions based on scores from a second, parallel form of the same test. Consistency can
be evaluated directly from actual responses to test items if two complete and parallel forms of the test are
given to the same group of students. In operational test programs, however, such a design is usually
impractical. Instead, techniques have been developed to estimate both the accuracy and consistency of
classification decisions based on a single administration of a test. The Livingston and Lewis (1995) technique
was used for the 2015–16 PAAP because it is easily adaptable to all types of testing formats, including
mixed-format tests.
The accuracy and consistency estimates reported in Appendix G make use of “true scores” in the
classical test theory sense. A true score is the score that would be obtained if a test had no measurement error.
Of course, true scores cannot be observed and so must be estimated. In the Livingston and Lewis (1995)
method, estimated true scores are used to categorize students into their “true” classifications.
For the 2015–16 PAAP, after various technical adjustments (described in Livingston & Lewis, 1995),
a two-by-two contingency table of accuracy was created for each content area and grade, where cell [i, j] represented the estimated proportion of students whose true score fell into classification i (where i = 1 or 2)
and observed score into classification j (where j = 1 or 2). The sum of the diagonal entries (i.e., the proportion
of students whose true and observed classifications matched) signified overall accuracy.
To calculate consistency, true scores were used to estimate the joint distribution of classifications on
two independent, parallel test forms. Following statistical adjustments per Livingston and Lewis (1995), a
new two-by-two contingency table was created for each content area and grade and populated by the
proportion of students who would be categorized into each combination of classifications according to the
Chapter 11—Characterizing Errors Associated with Test 42 2015–16 MeCAS Technical Report Part II Scores

two (hypothetical) parallel test forms. Cell [i, j] of this table represented the estimated proportion of students
whose observed score on the first form would fall into classification i (where i = 1 or 2) and whose observed
score on the second form would fall into classification j (where j = 1 or 2). The sum of the diagonal entries
(i.e., the proportion of students categorized by the two forms into exactly the same classification) signified
overall consistency.
Another way to measure consistency is to use Cohen’s (1960) coefficient κ (kappa), which assesses
the proportion of consistent classifications after removing the proportion of consistent classifications that
would be expected by chance. It is calculated using the following formula:
𝜅𝜅 = (Observed agreement)−(Chance agreement)1−(Chance agreement)
= ∑ 𝐶𝐶𝑖𝑖𝑖𝑖𝑖𝑖 −∑ 𝐶𝐶𝑖𝑖.𝐶𝐶.𝑖𝑖𝑖𝑖1−∑ 𝐶𝐶𝑖𝑖.𝑖𝑖 𝐶𝐶.𝑖𝑖
,
where
𝐶𝐶𝑖𝑖. is the proportion of students whose observed achievement level would be Level i (where i = 1 or 2) on the first hypothetical parallel form of the test;
𝐶𝐶.𝑖𝑖 is the proportion of students whose observed achievement level would be Level i (where i = 1 or 2) on the second hypothetical parallel form of the test; and
𝐶𝐶𝑖𝑖𝑖𝑖 is the proportion of students whose observed achievement level would be Level i (where i = 1 or 2) on both hypothetical parallel forms of the test.
Because κ is corrected for chance, its values are lower than are other consistency estimates.
The accuracy and consistency analyses described here are provided in Table G-1 of Appendix G. The
table includes overall accuracy and consistency indices, including kappa. Accuracy and consistency values
conditional on achievement level are also given. For these calculations, the denominator is the proportion of
students associated with a given achievement level. For example, the conditional accuracy value is 0.78 for
Not Proficient for science grade 5. This figure indicates that among the students whose true scores placed
them in this classification, 78% would be expected to be in this classification when categorized according to
their observed scores. Similarly, a consistency value of 0.74 indicates that 74% of students with observed
scores in the Not Proficient category would be expected to score in this classification again if a second,
parallel test form were used.
For some testing situations, the greatest concern may be decisions around level thresholds. For
example, if a college gave credit to students who achieved an Advanced Placement test score of 4 or 5, but
not to students with scores of 1, 2, or 3, one might be interested in the accuracy of the dichotomous decision
of below-4 versus 4-or-above. For the 2015–16 PAAP, Table G-2 in Appendix G provides accuracy and
consistency estimates for the achievement cutpoint as well as false positive and false negative decision rates.
(A false positive is the proportion of students whose observed scores were above the cut and whose true
scores were below the cut. A false negative is the proportion of students whose observed scores were below
the cut and whose true scores were above the cut.) Note that because DAC analyses were calculated using
only two categories, (1) At/Above State Expectations; and (2) Below/Well Below State Expectations, the
accuracy and consistency values conditional on cutpoint are the same as the overall values.
Chapter 11—Characterizing Errors Associated with Test 43 2015–16 MeCAS Technical Report Part II Scores

The above indices are derived from Livingston and Lewis’s (1995) method of estimating the accuracy
and consistency of classifications. It should be noted that Livingston and Lewis discuss two versions of the
accuracy and consistency tables. A standard version performs calculations for forms parallel to the form
taken. An “adjusted” version adjusts the results of one form to match the observed score distribution obtained
in the data. Table G-1 in Appendix G uses the standard version for two reasons: (1) This “unadjusted” version
can be considered a smoothing of the data, thereby decreasing the variability of the results; and (2) for results
dealing with the consistency of two parallel forms, the unadjusted tables are symmetrical, indicating that the
two parallel forms have the same statistical properties. This second reason is consistent with the notion of
forms that are parallel; that is, it is more intuitive and interpretable for two parallel forms to have the same
statistical distribution.
Note that, as with other methods of evaluating reliability, DAC statistics calculated based on small
groups can be expected to be lower than those calculated based on larger groups. For this reason, the values
presented in Appendix G should be interpreted with caution. In addition, it is important to remember that it is
inappropriate to compare DAC statistics between grades and content areas.
11.4 INTERRATER CONSISTENCY
Chapter 9 of this report describes in detail the processes that were implemented to monitor the quality
of the hand-scoring of student responses for polytomous items. One of these processes was double-blind
scoring of all student responses. Results of the double-blind scoring were used during scoring to identify
scorers who required retraining or other intervention and are presented here as evidence of the reliability of
the PAAP. A summary of the interrater consistency results is presented in Table 11-2. Results in the table are
collapsed across the tasks by subject, grade, and number of score categories (3 for Level of Assistance and 4
for Level of Accuracy). The table shows the number of included scores, the percent exact agreement, the
percent adjacent agreement, the correlation between the first two sets of scores, and the percent of responses
that required a third score. This same information is provided at the item level in Appendix H.
Table 11-2. 2015–16 PAAP: Summary of Interrater Consistency Statistics Collapsed Across Items by Subject and Grade
Subject Grade Number of Items
Number of
Percent Correlation
Percent of Third Scores
Score Categories
Included Scores Exact Adjacent
Science
5 24 3 861 98.26 0.93 0.88 1.97 24 4 861 85.37 7.78 0.79 15.33
8 36 3 860 97.33 1.16 0.92 2.67 36 4 860 91.51 7.09 0.90 8.49
HS 48 3 887 97.52 1.24 0.88 2.48 48 4 887 90.30 8.57 0.86 9.70
Chapter 11—Characterizing Errors Associated with Test 44 2015–16 MeCAS Technical Report Part II Scores

CHAPTER 12 COMPARABILITY (SCALING AND EQUATING)
12.1 COMPARABILITY OF SCORES ACROSS YEARS
In administering the PAAP, teachers select tasks from a standardized Task Bank, following the test
blueprints. Use of the Task Bank and blueprints ensures that the assessment as it is administered is
appropriate for the individual needs of the student being assessed and that the required Alternate Grade Level
Expectations (AGLEs) are covered. The process enables teachers to customize the assessment for individual
students while ensuring comparability across years through the use of the same blueprints, tasks, and scoring
rubrics from year to year. Additionally, comparability is ensured through the scoring process: Scoring occurs
at Measured Progress, using the same scoring rubrics each year in addition to Measured Progress’s standard
scoring quality-control processes, as described in Chapter 9. Additional processes to ensure across-year
comparability include calculation of reported scores and categorization into achievement levels, as described
in the following.
12.1.1 Reported Scores
Students’ entry scores are calculated based on a formula that combines their Level of Complexity
(LoC), Level of Accuracy, and Level of Assistance scores for each of the tasks in a given entry. The formula
weights the LoC score more heavily than the other two dimension scores. The overall score for a content area
is then the sum of the entry scores. Because of the use of the formula, there may be multiple ways that a
student can attain a given total score. Complete details of how reported raw scores are calculated are provided
in Appendix I. Use of this formula ensures that the meaning of the reported raw scores will remain constant
from year to year.
Graphs of the cumulative reported score distributions for 2013, 2014, and 2015 are provided in
Appendix J. Note that the graphs show the proportion of students at or below each score; thus, at any given
score point, the lowest line in a given graph indicates that the proportion of students scoring above that point
is greatest for the year corresponding to that line. For example, in the graph for grade 5 science (top of Figure
J-1), at the score point of 45 (i.e., Cut 2), the curve for 2015–16 is the highest, indicating that the proportion
of students scoring at or above 45 is smallest for 2015–16.
12.1.2 Standard Setting
A complete standard setting was conducted for the PAAP on June 28–30, 2010. Using a rubric-based
process that was supplemented with student work samples (bodies of work), standards were set for science
Chapter 12—Comparability (Scaling and Equating) 45 2015–16 MeCAS Technical Report Part II

(grades 5, 8, and 11). Although teachers are required to follow the test blueprint, they can choose which tasks
to use from the centralized Task Bank. Therefore, different students take different combinations of tasks. For
this reason, a rubric-based method of standard setting was appropriate for the PAAP. Details of the standard-
setting procedures can be found in the standard-setting report, which is posted on the Maine DOE
website: http://www.maine.gov/education/. To ensure continuity of score reporting across years, the cuts that
were established at the standard setting meeting will continue to be used in future years, until it is necessary to
reset standards. The raw score cutpoints for the PAAP as established via standard setting are presented in
Table 12-1.
Table 12-1. 2015–16 PAAP: Cut Scores on the Theta Metric and Reporting Scale by Subject and Grade
Subject Grade Raw Score
Raw Score
Cut 1 Cut 2 Cut 3 Minimum Maximum
Science 5 24 45 66 0 69 8 33 58 93 0 99
HS 50 87 127 0 129
12.2 LINKAGES ACROSS GRADES
In developing the PAAP, a content-based approach for addressing continuity across grades was
implemented. Specifically, issues of continuity were addressed in the following processes: (1) development,
(2) administration, and (3) standard setting.
As described in Chapter 5, the AGLEs describe the content to be included in students’ instructional
programs for each grade level. The AGLEs are based on the standards/grade-level expectations assessed by
Maine’s general assessments (MEA for science) but have been reduced in depth and breadth. The AGLEs are
designed to follow a continuum of skills that increase across grades. The tasks, in turn, have been designed to
map onto the AGLEs by measuring grade-specific content and skills. These tasks, along with blueprints,
which have also been designed to reflect the continuum reflected in the AGLEs, ensure that each portfolio
builds upon the appropriate knowledge and skills, thereby reflecting the desired continuity across grades.
During administration, the blueprint serves as a guide to teachers when selecting tasks that are
appropriate for a given student. As with other aspects of the development and administration of the PAAP,
use of the blueprints and the LoCs ensures that the student is being assessed at a level that is appropriate for
his or her grade level and individual needs and that the tasks to which a student is exposed follow a
continuum from year to year. Thus, linkages across grades are built into the design of the portfolio.
Finally, the continuity of the PAAP across grades was further verified through the standard setting
procedures. The achievement-level descriptors used for standard setting were based on the student
expectations as delineated in the AGLEs. Achievement across grades, therefore, was expected to follow the
continuum established by the AGLEs and thus to reflect a higher level of cognition as the grades increased.
Chapter 12—Comparability (Scaling and Equating) 46 2015–16 MeCAS Technical Report Part II

Following the standard setting meeting, the resulting cutpoints were critically evaluated by experts at
the Maine DOE to ensure that State Expectations reflected the desired increase in cognition across grades. In
addition, the percentages of students scoring at or above State Expectations in each grade were examined for
coherence from one grade to the next.
Chapter 12—Comparability (Scaling and Equating) 47 2015–16 MeCAS Technical Report Part II

CHAPTER 13 VALIDITY
The purpose of this report is to describe several technical aspects of the PAAP in an effort to
contribute to the accumulation of validity evidence to support PAAP score interpretations. Because the
combination of a test and its scores, not just the test itself, is evaluated for validity, this report presents
documentation to substantiate intended interpretations (AERA et al., 2014). Each of the chapters in this report
contributes important information to the validity argument by addressing one or more of the following aspects
of the PAAP: test development, test administration, scoring, item analyses, reliability, achievement levels,
and reporting.
The PAAP assessment is based on, and aligned to, Maine’s content standards and Alternate Grade
Level Expectations (AGLEs) in science. The PAAP results are intended to provide inferences about student
achievement on Maine’s science standards and AGLEs; these achievement inferences are meant to be useful
for program and instructional improvement and as a component of school accountability.
Standards for Educational and Psychological Testing (AERA et al., 2014) provide a framework for
describing sources of evidence that should be considered when constructing a validity argument. These
sources include evidence based on the following five general areas: test content, response processes, internal
structure, relationship to other variables, and consequences of testing. Although each of these sources may
speak to a different aspect of validity, they are not distinct types of validity. Instead, each contributes to a
body of evidence about the comprehensive validity of score interpretations.
13.1 EVIDENCE BASED ON TEST DEVELOPMENT AND STRUCTURE
A measure of test content validity is how well the assessment tasks represent the curriculum and
standards for each content area and grade level. This is informed by the task development process, including
how the AGLEs and test blueprints align to the curriculum and standards. Viewed through this lens provided
by the content standards, evidence based on test content was extensively described in Chapters 5–7. Item
alignment with Maine’s content standards, AGLEs, and Levels of Complexity (LoC), as well as review
processes for item bias, sensitivity, and content appropriateness, are components of validity evidence based on
test content. As discussed earlier, all PAAP tasks are aligned by Maine educators to the Maine Learning
Results Science standards, AGLEs, and LoCs, and all tasks undergo several rounds of review for content
fidelity and appropriateness.
Evidence based on internal structure is presented in the discussions of item analyses and reliability in
Chapters 10 and 11. Technical characteristics of the internal structure of the assessments are presented in
terms of classical item statistics (item difficulty, item-test correlation), correlations between the dimensions
(Level of Accuracy and Level of Assistance), fairness/bias, and reliability, including alpha coefficients,
interrater consistency, and decision accuracy and consistency (DAC).
Chapter 13—Validity 48 2015–16 MeCAS Technical Report Part II

13.2 OTHER EVIDENCE
The training and administration information in Chapter 8 describes the steps taken to train the
teachers/test administrators on procedures for constructing and administering the PAAP. Tests are constructed
and administered according to state-mandated standardized procedures, as described in the 2015–16 PAAP
Administration Handbook. These efforts to provide thorough training opportunities and materials help
maximize consistency among teachers, which enhances the quality of test scores and, in turn, contributes to
validity.
Evidence on scoring the PAAP is provided in Chapter 9. Procedures for training and monitoring
hand-scoring of the PAAP maximize scoring consistency and thus contribute to validity.
Evidence on comparability of scores, both across years and across grades, is provided in Chapter 12.
Information is provided on the calculation of students’ reported scores as well as the establishment of
performance standards that enabled reporting of achievement-level scores. In addition, information about
consistency and meaningfulness of test score information across grade levels is provided. All of these
processes maximize accuracy and clarity of score information that is provided to the public and, in this way,
enhance validity.
13.3 FUTURE DIRECTIONS
To further support the validity argument, additional studies to provide evidence regarding the
relationship of PAAP results to other variables might include an analysis of the extent to which scores from
the PAAP assessments converge with other measures of similar constructs and the extent to which they
diverge from measures of different constructs. Relationships among measures of the same or similar
constructs can sharpen the meaning of scores and appropriate interpretations by refining the definition of the
construct.
The evidence presented in this manual supports inferences related to student achievement on the
content represented on the AGLEs for science for the purposes of program and instructional improvement,
and as a component of school accountability.
Chapter 13—Validity 49 2015–16 MeCAS Technical Report Part II

REFERENCES American Educational Research Association, American Psychological Association, & National Council on
Measurement in Education. (2014). Standards for educational and psychological testing. Washington, DC: American Educational Research Association.
Brown, F. G. (1983). Principles of educational and psychological testing (3rd ed.). Fort Worth: Holt, Rinehart and Winston.
Cohen, J. (1960). A coefficient of agreement for nominal scales. Educational and Psychological Measurement, 20, 37–46.
Cronbach, L. J. (1951). Coefficient alpha and the internal structure of tests. Psychometrika, 16, 297–334.
Dorans, N. J., & Kulick, E. (1986). Demonstrating the utility of the standardization approach to assessing unexpected differential item performance on the Scholastic Aptitude Test. Journal of Educational Measurement, 23, 355–368.
Draper, N. R., & Smith, H. (1998). Applied regression analysis (3rd ed.). New York: John Wiley and Sons, Inc.
Joint Committee on Testing Practices. (2004). Code of fair testing practices in education. Washington, DC: Retrieved from www.apa.org/science/programs/testing/fair-code.aspx.
Livingston, S. A., & Lewis, C. (1995). Estimating the consistency and accuracy of classifications based on test scores. Journal of Educational Measurement, 32, 179–197.
References 50 2015–16 MeCAS Technical Report Part II

APPENDICES
Appendices 51 2015–16 MeCAS Technical Report Part II

APPENDIX A—2016 ALTERNATEGRADE LEVEL EXPECTATIONS
Appendix A—2016 Alternate Grade Level Expectations 1 2015–16 MeCAS Technical Report Part II


©2014 Maine Department of Education. All Rights Reserved.
Alternate Grade Level Expectations For
Based on Maine’s Accountability Standards, Chapter 131
Science Maine’s 2007 Learning Results

©2014 Maine Department of Education. All Rights Reserved.

10/21/2014 1 Alternate Grade Level Expectations
TABLE OF CONTENTS
SECTION PAGE Blueprint of Required AGLE Indicators.............................................................................................................................................. 2
Science AGLE D — The Physical Setting
D1 — Universe and Solar System
Levels of Complexity 1–8........................................................................................................................................................... 3 D2 — Earth
Levels of Complexity 1–8........................................................................................................................................................... 4
D3 — Matter and Energy Levels of Complexity 1–8........................................................................................................................................................... 5
D4 — Force and Motion
Levels of Complexity 1–8........................................................................................................................................................... 6
Science AGLE E — The Living Environment
E1 — Biodiversity Levels of Complexity 1–8........................................................................................................................................................... 7
E2 — Ecosystems Levels of Complexity 1–8........................................................................................................................................................... 8
E3 — Cells Levels of Complexity 1–8........................................................................................................................................................... 9
E4 — Heredity and Reproduction Levels of Complexity 1–8........................................................................................................................................................... 10
E5 — Evolution Levels of Complexity 1–8........................................................................................................................................................... 11

10/21/2014 2 Alternate Grade Level Expectations
The PAAP Blueprint of Required AGLE Indicators
Grade Level Science
3
4
5
D1, D2, E2
6
7
8
D4, E3, E4
3rd Year High School
D3, E1, E5

10/21/2014 3 Alternate Grade Level Expectations
Maine’s Accountability Standards, Chapter 131 The Physical Setting – Universe and Solar System
Science AGLE/Indicator — D1
Student understands the universal nature of matter, energy, force, and motion, and identifies how these relationships are exhibited in Earth Systems, in the solar system, and throughout the universe by:
Level of Complexity 1
Level of Complexity 2 Level of Complexity 3 Level of Complexity 4
describing or otherwise demonstrating understanding of the positions or apparent motions of different objects in our solar system and what these objects look like from Earth by...
doing the following:
• identifying night and day.
doing both of the following:
• identifying pictures of night and day,
AND
• identifying the Sun and Earth’s Moon.
doing the following:
• identifying the position of the Sun at different times by drawing or otherwise describing the movement of the Sun across the sky.
doing both of the following:
• identifying the position of the Sun at different times by drawing or otherwise describing the movement of the Sun across the sky,
AND
• drawing or identifying different phases of the Moon.
Level of Complexity 5
Level of Complexity 6 Level of Complexity 7 Level of Complexity 8
See Extended Learning AGLEs See Extended Learning AGLEs See Extended Learning AGLEs See Extended Learning AGLEs

10/21/2014 4 Alternate Grade Level Expectations
Maine’s Accountability Standards, Chapter 131 The Physical Setting – Earth
Science AGLE/Indicator — D2
Student understands the universal nature of matter, energy, force, and motion, and identifies how these relationships are exhibited in Earth Systems, in the solar system, and throughout the universe by:
Level of Complexity 1
Level of Complexity 2 Level of Complexity 3 Level of Complexity 4
describing the properties of Earth’s surface materials, the processes that change them, and cycles that affect Earth by...
doing the following:
• identifying sunny, rainy, snowy, and/or windy weather through observation.
doing the following:
• matching pictures to the type of weather they depict.
doing the following:
• identifying the different forms that water can take in the weather.
doing one of the following:
• matching weather to the effects it can have on the surface of Earth (erosion or weathering), and/or
• identifying factors that can influence temperature in the environment (day/night cycle, cloud cover, and presence of a star).
Level of Complexity 5
Level of Complexity 6 Level of Complexity 7 Level of Complexity 8
See Extended Learning AGLEs See Extended Learning AGLEs See Extended Learning AGLEs See Extended Learning AGLEs

10/21/2014 5 Alternate Grade Level Expectations
Maine’s Accountability Standards, Chapter 131 The Physical Setting – Matter and Energy
Science AGLE/Indicator — D3
Student understands the universal nature of matter, energy, force, and motion, and identifies how these relationships are exhibited in Earth Systems, in the solar system, and throughout the universe by:
Level of Complexity 1
Level of Complexity 2 Level of Complexity 3 Level of Complexity 4
describing properties of objects and materials before and after they undergo a change or interaction by...
doing the following:
• matching objects based on one physical property.
doing the following:
• identifying which object in a group has a specific physical property.
doing the following:
• sorting objects into groups using one or more physical properties.
doing both of the following:
• describing the physical properties of objects and materials
AND
• using observable characteristics to describe changes in the physical properties of materials when mixed, heated, frozen, or cut.
Level of Complexity 5
Level of Complexity 6 Level of Complexity 7 Level of Complexity 8
describing physical and chemical properties of matter, interactions and changes in matter, and transfer of energy through matter by...
describing the structure, behavior, and interactions of matter at the atomic level and the relationship between matter and energy by...
doing both of the following:
• identifying chemical changes
AND
• identifying physical changes.
doing both of the following:
• comparing the properties of original materials and their properties after undergoing chemical or physical change
AND
• observing and drawing conclusions about how the weight of an object compares to the sum of the weights of its parts.
doing both of the following:
• explaining that all materials are made of small particles
AND
• identifying examples of chemical and physical changes.
doing both of the following:
• explaining that adding heat causes the small particles in matter to move faster
AND
• demonstrating understanding that the properties of a material may change but the total amount of material remains the same.

10/21/2014 6 Alternate Grade Level Expectations
Maine’s Accountability Standards, Chapter 131 The Physical Setting – Force and Motion
Science AGLE/Indicator — D4
Student understands the universal nature of matter, energy, force, and motion, and identifies how these relationships are exhibited in Earth Systems, in the solar system, and throughout the universe by:
Level of Complexity 1
Level of Complexity 2 Level of Complexity 3 Level of Complexity 4
summarizing how various forces affect the motion of objects by...
doing the following:
• identifying or demonstrating one way (e.g., forward, backward, straight, zigzag, up, down, fast, slow) an object can move.
doing the following:
• identifying or demonstrating two ways (e.g., forward, backward, straight, zigzag, up, down, fast, slow) an object can move.
doing both of the following:
• describing or demonstrating three ways (e.g., forward, backward, straight, zigzag, up, down, fast, slow) an object can move
AND
• identifying that the way an object moves can be changed by pushing or pulling it.
doing the following:
• demonstrating understanding of how given objects move.
Level of Complexity 5
Level of Complexity 6 Level of Complexity 7 Level of Complexity 8
describing the force of gravity, the motion of objects, the properties of waves, and the wavelike property of energy in light waves by...
See Extended Learning AGLEs See Extended Learning AGLEs
doing the following:
• identifying or describing wave motions, earthquakes, vibrations, and/or water waves.
doing one or more of the following:
• giving examples of how gravity pulls objects,
• giving examples of how magnets pull and push objects, and/or
• describing similarities in motion of sound vibration and earthquakes, and water waves.

10/21/2014 7 Alternate Grade Level Expectations
Maine’s Accountability Standards, Chapter 131 The Living Environment — Biodiversity
Science AGLE/Indicator — E1
Student understands that cells are the basic unit of life, that all life as we know it has evolved through genetic transfer and natural selection to create a great diversity of organisms, and that these organisms create interdependent webs through which matter and energy flow. Student understands the similarities and differences between humans and other organisms and the interconnections of these interdependent webs by:
Level of Complexity 1
Level of Complexity 2 Level of Complexity 3 Level of Complexity 4
comparing living things based on their behaviors, external features, and environmental needs by...
doing the following:
• identifying pictures or descriptions of given animals or plants.
doing the following:
• identifying given organisms as plants or animals based on external features
doing the following:
• identifying organisms that are similar and different based on external features, behaviors, and/or needs.
doing two of the following:
• describing how plants and/or animals look, and/or
• describing the things that plants and/or animals do, and/or
• describing ways in which the needs of a plant and/or animal are met by its environment.
Level of Complexity 5
Level of Complexity 6 Level of Complexity 7 Level of Complexity 8
differentiating among organisms based on biological characteristics and identifying patterns of similarity by...
describing and analyzing the evidence for relatedness among and within diverse populations of organisms and the importance of biodiversity by...
doing both of the following:
• sorting living things based on external features or behaviors.
doing one or more of the following:
• identifying how external (or internal) features can influence how an animal or plant gets food and/or
• differentiating among living things that make their food, living things that eat their food, and those that do not clearly belong in one group or the other.
doing both of the following:
• describing environments that have many different types of organisms and those that have fewer types of organisms,
AND
• identifying ways that organisms are related using physical evidence, such as presence or absence of a backbone.
doing the following:
• predicting possible changes that could result if the numbers of different types of organisms were to be drastically reduced.

10/21/2014 8 Alternate Grade Level Expectations
Maine’s Accountability Standards, Chapter 131 The Living Environment — Ecosystems
Science AGLE/Indicator — E2
Student understands that cells are the basic unit of life, that all life as we know it has evolved through genetic transfer and natural selection to create a great diversity of organisms, and that these organisms create interdependent webs through which matter and energy flow. Student understands the similarities and differences between humans and other organisms and the interconnections of these interdependent webs by:
Level of Complexity 1
Level of Complexity 2 Level of Complexity 3 Level of Complexity 4
describing ways organisms depend upon, interact within, and change the living and nonliving environment as well as ways the environment affects organisms by...
doing the following:
• identifying pictures or descriptions of given animals or plants.
doing the following:
• identifying animals or plants that live in given environments
doing the following:
• identifying plants, animals, and/or components of their environments in which given animals depend on for food and shelter.
doing one of the following:
• comparing animals and plants that live in different environments to demonstrate understanding of how animals and plants depend on each other and the environments in which they live.
Level of Complexity 5
Level of Complexity 6 Level of Complexity 7 Level of Complexity 8
See Extended Learning AGLEs See Extended Learning AGLEs See Extended Learning AGLEs See Extended Learning AGLEs

10/21/2014 9 Alternate Grade Level Expectations
Maine’s Accountability Standards, Chapter 131 The Living Environment — Cells
Science AGLE/Indicator — E3
Student understands that cells are the basic unit of life, that all life as we know it has evolved through genetic transfer and natural selection to create a great diversity of organisms, and that these organisms create interdependent webs through which matter and energy flow. Student understands the similarities and differences between humans and other organisms and the interconnections of these interdependent webs by:
Level of Complexity 1
Level of Complexity 2 Level of Complexity 3 Level of Complexity 4
describing how living things are made up of one or more cells and the ways cells help organisms meet their basic needs by...
doing the following:
• identifying given parts of the human body.
doing the following:
• matching animals and/or plants to their parts.
doing the following:
• identifying parts that allow living things to meet basic needs.
doing the following:
• identifying structures and/or processes that help given organisms stay alive.
Level of Complexity 5
Level of Complexity 6 Level of Complexity 7 Level of Complexity 8
describing the hierarchy of organization and function in organisms, and the similarities and differences in structure, function, and needs among and
within organisms by...
See Extended Learning AGLEs See Extended Learning AGLEs
doing one of the following:
• identifying that some living things are made of one cell and some living things are made of many cells, and/or
• identifying that all living things (single-celled and multi-celled) must have ways to get food and get rid of wastes.
doing both of the following:
• identifying that some living things are made of one cell and some living things are made of many cells
AND
• identifying that all living things (single-celled and multi-celled) must have ways to get food and get rid of wastes.

10/21/2014 10 Alternate Grade Level Expectations
Maine’s Accountability Standards, Chapter 131 Science AGLE/Indicator — E4 The Living Environment — Hereditary and Reproduction
Student understands that cells are the basic unit of life, that all life as we know it has evolved through genetic transfer and natural selection to create a great diversity of organisms, and that these organisms create interdependent webs through which matter and energy flow. Student understands the similarities and differences between humans and other organisms and the interconnections of these interdependent webs by:
Level of Complexity 1
Level of Complexity 2 Level of Complexity 3 Level of Complexity 4
describing characteristics of organisms and the reason why organisms differ from or are similar to their parents by...
doing the following:
• identifying parents and their offspring by matching pictures of a baby organism to an adult of the same organism.
doing the following:
• identifying things about offspring that are like and not like their parents.
doing the following:
• demonstrating understanding of life cycles by explaining, drawing, or otherwise communicating knowledge of stages in given life cycles.
doing both of the following:
• naming similarities between the adults and offspring of varied organisms
AND
• identifying and describing, drawing, or otherwise communicating knowledge of stages in a life cycle
Level of Complexity 5
Level of Complexity 6 Level of Complexity 7 Level of Complexity 8
describing the general characteristics and mechanisms of reproduction and heredity in organisms, including humans, and ways in which organisms are
affected by their genetic traits by...
See Extended Learning AGLEs See Extended Learning AGLEs
doing one of the following:
• identifying the characteristics of offspring and parents based on similarities and differences.
doing both of the following:
• identifying living things that reproduce by getting all their inherited information from one parent
AND
• identifying living things that reproduce by getting all their inherited information from two parents.
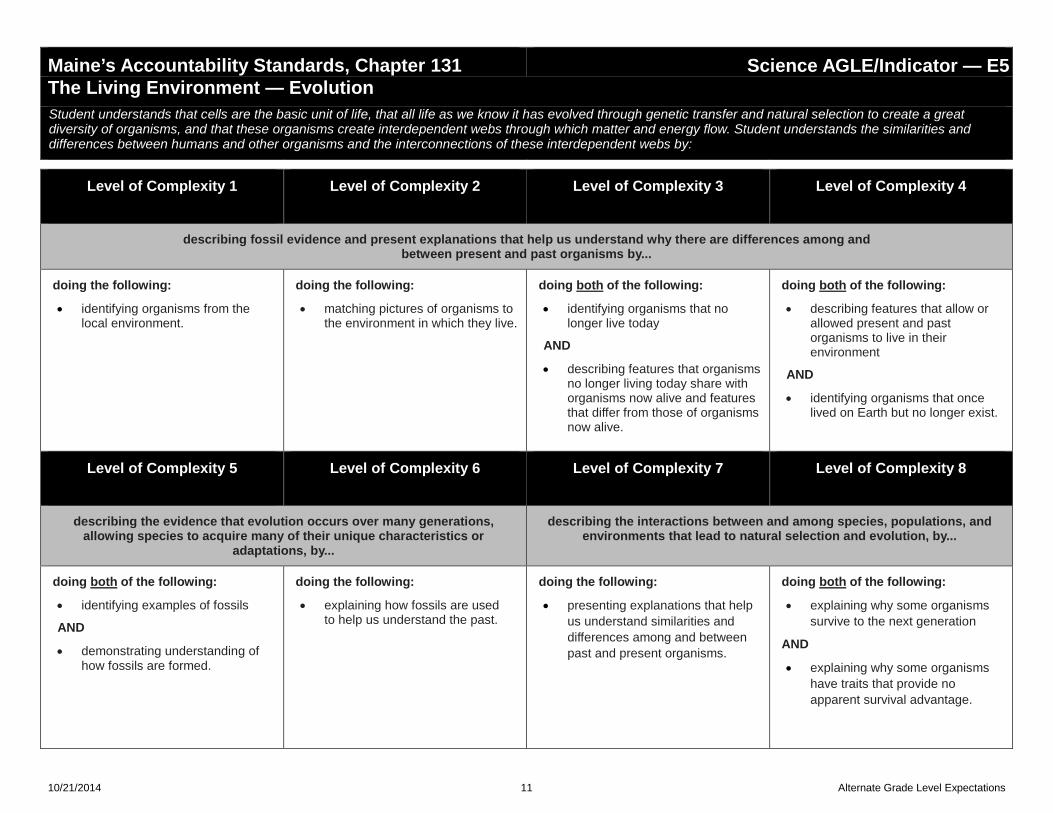
10/21/2014 11 Alternate Grade Level Expectations
Maine’s Accountability Standards, Chapter 131 Science AGLE/Indicator — E5 The Living Environment — Evolution
Student understands that cells are the basic unit of life, that all life as we know it has evolved through genetic transfer and natural selection to create a great diversity of organisms, and that these organisms create interdependent webs through which matter and energy flow. Student understands the similarities and differences between humans and other organisms and the interconnections of these interdependent webs by:
Level of Complexity 1
Level of Complexity 2 Level of Complexity 3 Level of Complexity 4
describing fossil evidence and present explanations that help us understand why there are differences among and between present and past organisms by...
doing the following:
• identifying organisms from the local environment.
doing the following:
• matching pictures of organisms to the environment in which they live.
doing both of the following:
• identifying organisms that no longer live today
AND
• describing features that organisms no longer living today share with organisms now alive and features that differ from those of organisms now alive.
doing both of the following:
• describing features that allow or allowed present and past organisms to live in their environment
AND
• identifying organisms that once lived on Earth but no longer exist.
Level of Complexity 5
Level of Complexity 6 Level of Complexity 7 Level of Complexity 8
describing the evidence that evolution occurs over many generations, allowing species to acquire many of their unique characteristics or
adaptations, by...
describing the interactions between and among species, populations, and environments that lead to natural selection and evolution, by...
doing both of the following:
• identifying examples of fossils
AND
• demonstrating understanding of how fossils are formed.
doing the following:
• explaining how fossils are used to help us understand the past.
doing the following:
• presenting explanations that help us understand similarities and differences among and between past and present organisms.
doing both of the following:
• explaining why some organisms survive to the next generation
AND
• explaining why some organisms have traits that provide no apparent survival advantage.

Appendix B-Process for Determining the Appropriate 1 2015–16 MeCAS Technical Report Part II Avenue for Participation
APPENDIX B— PROCESS FOR DETERMINING THE APPROPRIATE AVENUE FOR
PARTICIPATION


APPENDIX C—2016 SCORING INSTRUCTIONS
Appendix C—Scoring Instructions 1 2015–16 MeCAS Technical Report Part II


2016 PAAP SCORING INSTRUCTIONS USING PROFILE
1
Step 1. Enter Portfolio ID Step 1.a. Enter the 15-digit portfolio identification number (PID) found on the back of the portfolio envelope. This number
begins with 753500000. Step 1.b. Click Continue.
Step 2. Verify Demographics Does the portfolio demographic information provided on the Verify Demographics screen match the login information on the portfolio? Compare the student ID number, name, grade, district name, and school name.
If YES, click Yes and then click on Continue Scoring in the dark blue banner.
If NO, click No notify your Table Leader. Once the Table Leader has approved, click on Continue Scoring in the darkblue banner.
NOTE: Navigate through ProFile by using the links within the application ONLY. Do NOT use the browsers back and forward buttons.

2
Step 3. Verify Entries Step 3.a. Use the Verify Entries screen which lists the required entries and the Entry Slip to verify that the
AGLE/Indicators on the screen match the circled AGLE/Indicator on the bottom of the Entry Slip.
In the example below, the AGLE/Indicators are D4, E3, & E4.
Step 3.b. Select the first Entry by clicking on the yellow diamond. Then a blue arrow will appear to indicate you have selected this Entry. Click the blue arrow to begin scoring the entry.

3
Step 4. Score Entry Step 4.a. Does the content area submitted in the portfolio match what is shown on the screen? If you are not sure, check
with your table leader before continuing.
If YES, click Yes for “Was the Entry Submitted?”, and continue scoring.
If NO, click No for “Was the Entry Submitted?”, and click on Comments to assign comment code 2.e and thenFinalize the Entry (see page 8) before moving on to the next Entry.
Step 4.b Level of Complexity (LoC) The LoCs displayed on the screen are the only ones available for the student’s grade level. Verify that the LoC circled in the middle of the Entry Slip page matches one of the LoCs on the screen. The LoC is also located on the bottom right corner of each page’s footer within an Entry. In the examples below, the LoC is 4. Does the LoC circled on the Entry Slip match one of the LoCs on the screen?
If YES, select the LoC indicated on the Entry Slip or within the pages of the Entry.
If NO, then the Entry is unscorable and does not meet PAAP requirements. Do not enter anything for the LoCsection and continue to Step 4.c.

4
Step 4.c. Does the Entry Meet PAAP Requirements? Verify that the LoC submitted is grade-appropriate. Only the grade-appropriate LoCs should appear on this screen. If you are not sure, check with your table leader before continuing.
If YES, click Yes for “Does the Entry Meet PAAP Requirements?”
If NO, click No for “Does the Entry Meet PAAP Requirements?”, and click Comments in the dark bluebanner. Assign comment code 4.a or 4.b and click Finalize the Entry.
Step 5. Score the Entry/Score Task X Step 5.a. Is the Task Scorable?
Verify that the Task is scorable. Both criteria below must be met.
There is evidence of student work on the work template for each task.
The Level of Assistance was completed on the Task Summary page.o If “Other” was completed by the teacher, flag your table leader to verify that the Level of Assistance was
selected accurately. Some of these issues are noted below.
A Task is unscorable for any one of the following conditions:
3e - Student work was not completed on the work template.
5b - The Level of Assistance was not completed.
2c - Hand-over-hand was used.
2b - An item or items were altered.
3b - A Task or Task Summary page(s) is (are) missing.
4a - The LoC is above the student’s grade level.
Special circumstances to consider:
4b - Two Entries for one AGLE/Indicator with different LoCs are submitted.o Score the Entry containing the latest date.o The other Entry is not scorable.
If YES, click Yes for “Is Task 1 Scorable?”, and continue scoring.
If No, click No for “Is Task 1 Scorable?”, and move to the next task by clicking on Score Task X in the dark bluebanner.

5
Step 5.b. Level of Accuracy Use the Level of Accuracy Grid on the Task Summary page to identify the accuracy of the student work for each item. Refer to the “Responses Expected from Student” key on the Task Description page to score the Task.
Click on C if the response is correct.
Click on X if the response is incorrect.
Verify that the “% Correct” increases when you click on C.
Note: If the percent correct reported by the teacher does not match your percent, do not change your score. Discrepancies will be handled by the third read process.

6
Step 5.c. Level of Assistance Refer to the Task Summary page in the PAAP to complete the Level of Assistance Grid. If Applicable, compare the teacher’s score and details provided under “Other” by the teacher to ensure there are no discrepancies. If you have a question about the “Other,” check with your Table Leader before continuing. Is the Level of Assistance provided correct?
If YES, click the corresponding number 1, 2, or 3 in the Level of Assistance section of the screen.
If NO, flag your table leader to determine the correct Level of Assistance. After the revised Level of Assistance isdetermined, click this number in the Level of Assistance grid.
o If the task is truly determined to be unscorable, return to the question at the top of the page “Is Task XScorable?” and change your answer to “NO”. Do not use the “Unscorable” option under Level ofAssistance.
Step 5.d. Score the remaining Tasks for this Entry by clicking on Score Task X in the dark blue banner.

7
Step 5.e. Comment Codes Comment codes are based on the totality of the Entry. They provide teachers valuable feedback on the Entry scores.
Click on Comments in the dark blue banner.
Select at least one comment code, but no more than two, as you score each Entry.
Step 5.f. When you have scored all the Tasks and selected appropriate comment codes, Finalize Entry will appear in the dark blue banner. If it does not appear, double check that all the Tasks were completed appropriately and comment codes were entered.

8
Click on Finalize Entry and review the data that you entered for this Entry.
If you notice an error, click on Return to Entry to verify that the data is correct for each Task. Do NOT use thebrowsers back button.
Once it is determined that all data is accurate, click Accept and Finalize.
Step 5.g. This Entry is now complete. Continue scoring the remaining Entries starting at Step 3.a. on page 2.
Note: Once you click Accept and Finalize, you
CANNOT CHANGE OR REVIEW ANY DATA.

9
Step 6. Finalize the Portfolio When you have scored all the Entries for the portfolio, ProFile will bring you to the Finalize Portfolio screen.
Verify that all Entries within the portfolio are completed in ProFile. If an Entry has not been completed, a yellow diamond will be displayed. Have all of the Entries been scored/reviewed?
If YES, click Finalize Portfolio in the dark blue banner. You will then be prompted to enter the PID for the nextportfolio to be scored.
If NO, flag your Table Leader.
Step 7. Flow of Materials Once the scoring of the PAAP is complete:
Place the PAAP back in the Tyvek envelope.
Verify that you have indicated your scorer number in the proper place on the scoring label on the envelope.
Return the PAAP to your table leader.

10
Visual Guide to the PAAP
ProFile Website
https://profile.measuredprogress.org/ProfileMEScoring/Login.aspx
Maine PAAP Blueprint
Grade LoC Science
5 1-4 D1, D2, E2
8 1-6 D4, E3, E4
3rd Yr. High School 1-8 D3, E1, E5
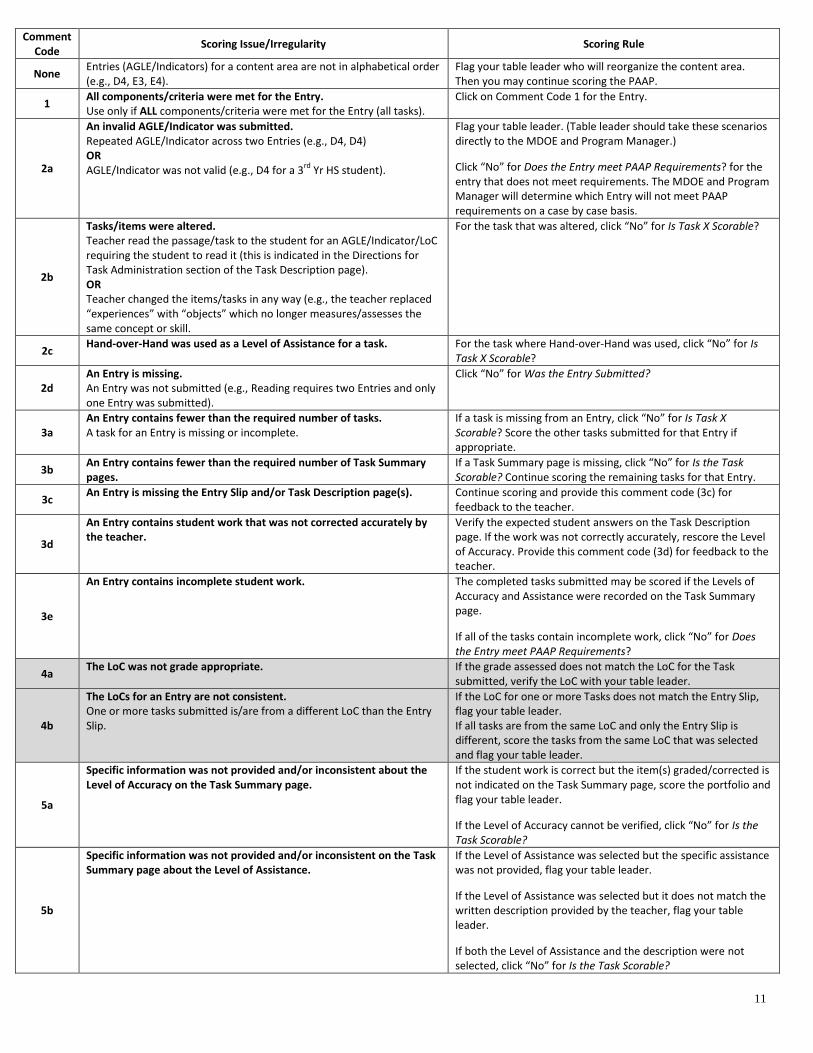
11
Comment Code
Scoring Issue/Irregularity Scoring Rule
None Entries (AGLE/Indicators) for a content area are not in alphabetical order (e.g., D4, E3, E4).
Flag your table leader who will reorganize the content area. Then you may continue scoring the PAAP.
1 All components/criteria were met for the Entry. Use only if ALL components/criteria were met for the Entry (all tasks).
Click on Comment Code 1 for the Entry.
2a
An invalid AGLE/Indicator was submitted. Repeated AGLE/Indicator across two Entries (e.g., D4, D4) OR AGLE/Indicator was not valid (e.g., D4 for a 3
rd Yr HS student).
Flag your table leader. (Table leader should take these scenarios directly to the MDOE and Program Manager.)
Click “No” for Does the Entry meet PAAP Requirements? for the entry that does not meet requirements. The MDOE and Program Manager will determine which Entry will not meet PAAP requirements on a case by case basis.
2b
Tasks/items were altered. Teacher read the passage/task to the student for an AGLE/Indicator/LoC requiring the student to read it (this is indicated in the Directions for Task Administration section of the Task Description page). OR Teacher changed the items/tasks in any way (e.g., the teacher replaced “experiences” with “objects” which no longer measures/assesses the same concept or skill.
For the task that was altered, click “No” for Is Task X Scorable?
2c Hand-over-Hand was used as a Level of Assistance for a task. For the task where Hand-over-Hand was used, click “No” for Is
Task X Scorable?
2d An Entry is missing. An Entry was not submitted (e.g., Reading requires two Entries and only one Entry was submitted).
Click “No” for Was the Entry Submitted?
3a An Entry contains fewer than the required number of tasks. A task for an Entry is missing or incomplete.
If a task is missing from an Entry, click “No” for Is Task X Scorable? Score the other tasks submitted for that Entry if appropriate.
3b An Entry contains fewer than the required number of Task Summary pages.
If a Task Summary page is missing, click “No” for Is the Task Scorable? Continue scoring the remaining tasks for that Entry.
3c An Entry is missing the Entry Slip and/or Task Description page(s). Continue scoring and provide this comment code (3c) for
feedback to the teacher.
3d
An Entry contains student work that was not corrected accurately by the teacher.
Verify the expected student answers on the Task Description page. If the work was not correctly accurately, rescore the Level of Accuracy. Provide this comment code (3d) for feedback to the teacher.
3e
An Entry contains incomplete student work. The completed tasks submitted may be scored if the Levels of Accuracy and Assistance were recorded on the Task Summary page.
If all of the tasks contain incomplete work, click “No” for Does the Entry meet PAAP Requirements?
4a The LoC was not grade appropriate. If the grade assessed does not match the LoC for the Task
submitted, verify the LoC with your table leader.
4b
The LoCs for an Entry are not consistent. One or more tasks submitted is/are from a different LoC than the Entry Slip.
If the LoC for one or more Tasks does not match the Entry Slip, flag your table leader. If all tasks are from the same LoC and only the Entry Slip is different, score the tasks from the same LoC that was selected and flag your table leader.
5a
Specific information was not provided and/or inconsistent about the Level of Accuracy on the Task Summary page.
If the student work is correct but the item(s) graded/corrected is not indicated on the Task Summary page, score the portfolio and flag your table leader.
If the Level of Accuracy cannot be verified, click “No” for Is the Task Scorable?
5b
Specific information was not provided and/or inconsistent on the Task Summary page about the Level of Assistance.
If the Level of Assistance was selected but the specific assistance was not provided, flag your table leader.
If the Level of Assistance was selected but it does not match the written description provided by the teacher, flag your table leader.
If both the Level of Assistance and the description were not selected, click “No” for Is the Task Scorable?

APPENDIX D—ITEM-LEVEL CLASSICAL STATISTICS
Appendix D—Item-Level Classical Statistics 1 2015–16 MeCAS Technical Report Part II


Table D-1. 2015–16 PAAP: Item-Level Classical Test Theory Statistics— Science Grade 5
Item Number Difficulty Discrimination D111LAC 0.51 0.57 D111LAS 0.69 0.73 D112LAC 0.62 0.27 D112LAS 0.71 0.69 D121LAC 0.77 0.41 D121LAS 0.80 0.32 D122LAC 0.94 0.39 D122LAS 0.95 0.47 D131LAC 0.79 0.64 D131LAS 0.81 0.56 D132LAC 0.78 0.61 D132LAS 0.85 0.60 D141LAC 0.70 0.17 D141LAS 0.90 -0.06 D142LAC 0.90 0.26 D142LAS 0.93 0.09 D211LAC 0.53 0.73 D211LAS 0.71 0.88 D212LAC 0.53 0.68 D212LAS 0.69 0.86 D221LAC 0.81 0.54 D221LAS 0.91 0.62 D222LAC 0.83 0.66 D222LAS 0.91 0.62 D231LAC 0.80 0.37
Item Number Difficulty Discrimination D231LAS 0.96 0.47 D232LAC 0.81 0.37 D232LAS 0.98 0.19 D241LAC 0.83 0.34 D241LAS 0.86 0.59 D242LAC 0.74 0.65 D242LAS 0.85 0.51 E211LAC 0.68 0.81 E211LAS 0.71 0.50 E212LAC 0.70 0.70 E212LAS 0.76 0.66 E221LAC 0.87 0.25 E221LAS 0.95 0.24 E222LAC 0.81 0.11 E222LAS 0.91 0.24 E231LAC 0.69 0.34 E231LAS 0.93 0.16 E232LAC 0.69 0.34 E232LAS 0.93 0.20 E241LAC 0.85 0.41 E241LAS 0.85 0.61 E242LAC 0.79 0.24 E242LAS 0.85 0.54
Note: Statistics are presented only for items that were taken by 10 or more students.
Table D-2. 2015–16 PAAP: Item-Level Classical Test Theory Statistics— Science Grade 8
Item Number Difficulty Discrimination D411LAC 0.59 0.72 D411LAS 0.47 0.70 D412LAC 0.57 0.57 D412LAS 0.47 0.70 D421LAC D421LAS D422LAC D422LAS D431LAC 0.74 0.36 D431LAS 0.74 0.31 D432LAC 0.88 0.69 D432LAS 0.82 0.68 D441LAC 0.86 0.61 D441LAS 0.77 0.58 D442LAC 0.90 0.64
Item Number Difficulty Discrimination D442LAS 0.83 0.59 D451LAC 0.87 -0.01 D451LAS 0.83 -0.14 D452LAC 0.88 0.34 D452LAS 0.95 0.19 D461LAC 0.84 -0.17 D461LAS 0.85 0.41 D462LAC 0.86 -0.16 D462LAS 0.83 0.46 E311LAC 0.64 0.77 E311LAS 0.70 0.20 E312LAC 0.51 0.81 E312LAS 0.61 0.57 E321LAC 0.73 0.35 E321LAS 0.73 0.30
continued
Appendix D—Item-Level Classical Statistics 3 2015–16 MeCAS Technical Report Part II

Item Number Difficulty Discrimination E322LAC 0.70 0.39 E322LAS 0.70 0.41 E331LAC 0.81 0.68 E331LAS 0.75 0.76 E332LAC 0.82 0.71 E332LAS 0.76 0.82 E341LAC 0.83 0.45 E341LAS 0.87 0.59 E342LAC 0.83 0.32 E342LAS 0.85 0.47 E351LAC 0.85 0.74 E351LAS 0.89 -0.05 E352LAC 0.79 0.66 E352LAS 0.88 -0.01 E361LAC 0.73 0.56 E361LAS 0.85 0.67 E362LAC 0.72 0.63 E362LAS 0.83 0.68 E411LAC 0.66 0.52 E411LAS 0.76 0.48 E412LAC 0.66 0.61 E412LAS 0.82 0.45
Item Number Difficulty Discrimination E421LAC E421LAS E422LAC E422LAS E431LAC 0.79 0.57 E431LAS 0.81 0.56 E432LAC 0.82 0.57 E432LAS 0.85 0.56 E441LAC 0.91 -0.07 E441LAS 0.88 -0.12 E442LAC 0.95 0.67 E442LAS 0.88 -0.12 E451LAC 0.85 0.23 E451LAS 0.82 0.10 E452LAC 0.83 0.68 E452LAS 0.80 0.45 E461LAC 0.77 0.84 E461LAS 0.90 0.73 E462LAC 0.79 0.63 E462LAS 0.88 0.74
Note: Statistics are presented only for items that were taken by 10 or more students.
Table D-3. 2015–16 PAAP: Item-Level Classical Test Theory Statistics— Science High School
Item Number Difficulty Discrimination D311LAC 0.68 0.44 D311LAS 0.76 0.70 D312LAC 0.70 0.42 D312LAS 0.71 0.81 D321LAC 0.61 0.87 D321LAS 0.71 0.84 D322LAC 0.64 0.82 D322LAS 0.69 0.86 D331LAC 0.79 0.78 D331LAS 0.89 0.71 D332LAC 0.85 0.74 D332LAS 0.89 0.71 D341LAC 0.91 0.19 D341LAS 0.82 0.53 D342LAC 0.96 0.02 D342LAS 0.75 0.59 D351LAC 0.78 0.77 D351LAS 0.80 0.68 D352LAC 0.88 0.76 D352LAS 0.78 0.67 D361LAC 0.95 0.06 D361LAS 0.85 0.02
Item Number Difficulty Discrimination D362LAC 0.77 0.06 D362LAS 0.88 -0.07 D371LAC 0.90 0.26 D371LAS 0.94 0.48 D372LAC 0.94 0.13 D372LAS 0.90 0.45 D381LAC 0.88 0.20 D381LAS 0.90 0.37 D382LAC 0.85 0.06 D382LAS 0.88 0.52 E111LAC 0.71 0.82 E111LAS 0.72 0.76 E112LAC 0.71 0.90 E112LAS 0.72 0.76 E121LAC E121LAS E122LAC E122LAS E131LAC 0.89 0.84 E131LAS 0.86 0.57 E132LAC 0.79 0.69 E132LAS 0.86 0.45
continued
Appendix D—Item-Level Classical Statistics 4 2015–16 MeCAS Technical Report Part II
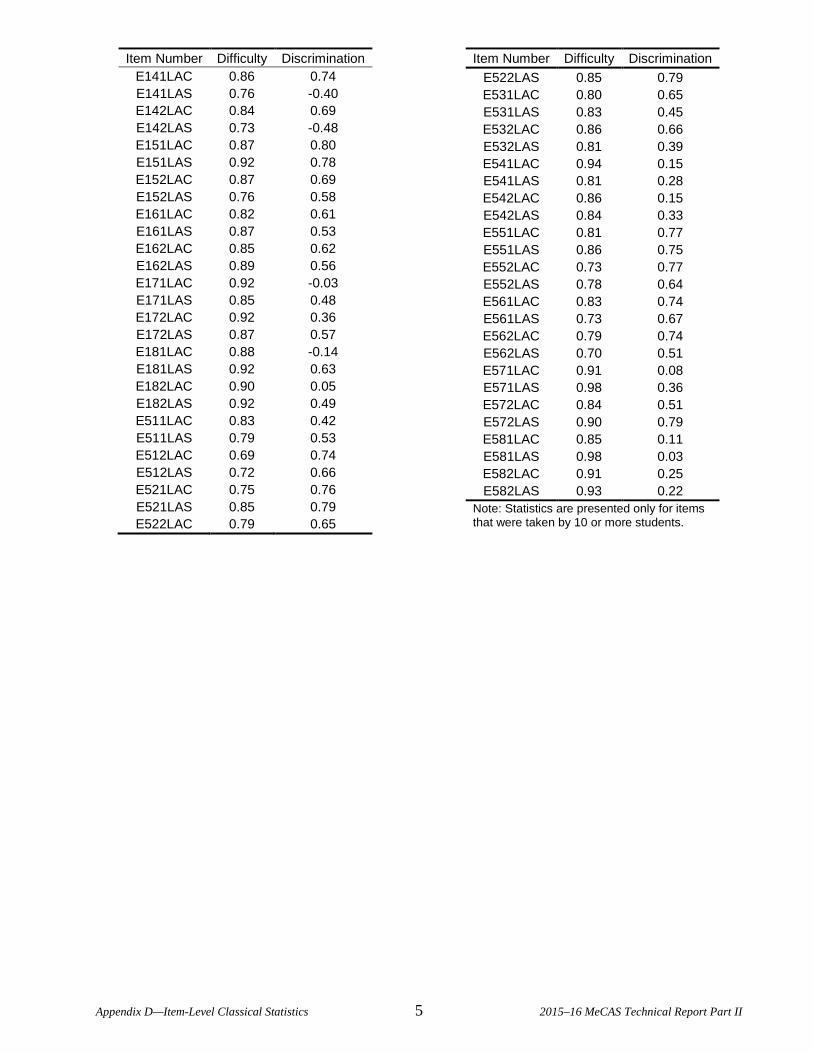
Item Number Difficulty Discrimination E141LAC 0.86 0.74 E141LAS 0.76 -0.40 E142LAC 0.84 0.69 E142LAS 0.73 -0.48 E151LAC 0.87 0.80 E151LAS 0.92 0.78 E152LAC 0.87 0.69 E152LAS 0.76 0.58 E161LAC 0.82 0.61 E161LAS 0.87 0.53 E162LAC 0.85 0.62 E162LAS 0.89 0.56 E171LAC 0.92 -0.03 E171LAS 0.85 0.48 E172LAC 0.92 0.36 E172LAS 0.87 0.57 E181LAC 0.88 -0.14 E181LAS 0.92 0.63 E182LAC 0.90 0.05 E182LAS 0.92 0.49 E511LAC 0.83 0.42 E511LAS 0.79 0.53 E512LAC 0.69 0.74 E512LAS 0.72 0.66 E521LAC 0.75 0.76 E521LAS 0.85 0.79 E522LAC 0.79 0.65
Item Number Difficulty Discrimination E522LAS 0.85 0.79 E531LAC 0.80 0.65 E531LAS 0.83 0.45 E532LAC 0.86 0.66 E532LAS 0.81 0.39 E541LAC 0.94 0.15 E541LAS 0.81 0.28 E542LAC 0.86 0.15 E542LAS 0.84 0.33 E551LAC 0.81 0.77 E551LAS 0.86 0.75 E552LAC 0.73 0.77 E552LAS 0.78 0.64 E561LAC 0.83 0.74 E561LAS 0.73 0.67 E562LAC 0.79 0.74 E562LAS 0.70 0.51 E571LAC 0.91 0.08 E571LAS 0.98 0.36 E572LAC 0.84 0.51 E572LAS 0.90 0.79 E581LAC 0.85 0.11 E581LAS 0.98 0.03 E582LAC 0.91 0.25 E582LAS 0.93 0.22
Note: Statistics are presented only for items that were taken by 10 or more students.
Appendix D—Item-Level Classical Statistics 5 2015–16 MeCAS Technical Report Part II

APPENDIX E—ITEM-LEVEL SCORE DISTRIBUTION
Appendix E—Item-Level Score Distributions 1 2015–16 MeCAS Technical Report Part II


Table E-1. 2015–16 PAAP: Item-Level Score Distributions for Constructed Response Items— Science Grade 5
Item Number
Total Possible Points
Percent of Students at Score Point
0 1 2 3 4
D111LAC 4 5.88 17.65 47.06 23.53 5.88 D111LAS 3 5.88 29.41 17.65 47.06 D112LAC 4 0.00 5.88 47.06 41.18 5.88 D112LAS 3 0.00 29.41 29.41 41.18 D121LAC 4 18.84 0.00 5.80 4.35 71.01 D121LAS 3 18.84 0.00 2.90 78.26 D122LAC 4 1.45 0.00 0.00 18.84 79.71 D122LAS 3 1.45 4.35 1.45 92.75 D131LAC 4 8.00 4.00 4.00 32.00 52.00 D131LAS 3 8.00 4.00 24.00 64.00 D132LAC 4 4.00 8.00 8.00 32.00 48.00 D132LAS 3 4.00 4.00 24.00 68.00 D141LAC 4 2.50 2.50 42.50 17.50 35.00 D141LAS 3 2.50 2.50 17.50 77.50 D142LAC 4 0.00 5.00 2.50 20.00 72.50 D142LAS 3 0.00 5.00 10.00 85.00 D211LAC 4 6.67 13.33 46.67 26.67 6.67 D211LAS 3 6.67 13.33 40.00 40.00 D212LAC 4 6.67 20.00 40.00 20.00 13.33 D212LAS 3 6.67 20.00 33.33 40.00 D221LAC 4 3.23 3.23 12.90 25.81 54.84 D221LAS 3 3.23 6.45 3.23 87.10 D222LAC 4 3.23 6.45 0.00 35.48 54.84 D222LAS 3 3.23 6.45 3.23 87.10
Item Number
Total Possible Points
Percent of Students at Score Point
0 1 2 3 4
D231LAC 4 0.00 2.53 10.13 53.16 34.18 D231LAS 3 0.00 1.27 8.86 89.87 D232LAC 4 0.00 2.53 12.66 44.30 40.51 D232LAS 3 0.00 0.00 6.33 93.67 D241LAC 4 0.00 3.85 15.38 26.92 53.85 D241LAS 3 0.00 3.85 34.62 61.54 D242LAC 4 0.00 11.54 19.23 30.77 38.46 D242LAS 3 0.00 3.85 38.46 57.69 E211LAC 4 4.76 4.76 23.81 47.62 19.05 E211LAS 3 4.76 23.81 23.81 47.62 E212LAC 4 4.76 4.76 28.57 28.57 33.33 E212LAS 3 4.76 19.05 19.05 57.14 E221LAC 4 0.00 0.00 3.70 44.44 51.85 E221LAS 3 0.00 7.41 0.00 92.59 E222LAC 4 3.70 0.00 14.81 33.33 48.15 E222LAS 3 3.70 7.41 0.00 88.89 E231LAC 4 0.00 8.45 43.66 9.86 38.03 E231LAS 3 0.00 1.41 16.90 81.69 E232LAC 4 0.00 7.04 45.07 11.27 36.62 E232LAS 3 0.00 0.00 19.72 80.28 E241LAC 4 0.00 3.13 12.50 25.00 59.38 E241LAS 3 0.00 3.13 37.50 59.38 E242LAC 4 0.00 6.25 18.75 28.13 46.88 E242LAS 3 0.00 3.13 37.50 59.38
Appendix E—Item-Level Score Distributions 3 2015–16 MeCAS Technical Report Part II

Table E-2. 2015–16 PAAP: Item-Level Score Distributions for Constructed Response Items— Science Grade 8
Item Number
Total Possible Points
Percent of Students at Score Point
0 1 2 3 4
D411LAC 4 15.79 10.53 21.05 26.32 26.32 D411LAS 3 15.79 52.63 5.26 26.32 D412LAC 4 15.79 21.05 10.53 26.32 26.32 D412LAS 3 15.79 52.63 5.26 26.32 D421LAC 4 0.00 0.00 14.29 0.00 85.71 D421LAS 3 0.00 14.29 28.57 57.14 D422LAC 4 0.00 0.00 0.00 28.57 71.43 D422LAS 3 0.00 0.00 42.86 57.14 D431LAC 4 13.64 0.00 13.64 22.73 50.00 D431LAS 3 13.64 9.09 18.18 59.09 D432LAC 4 4.55 0.00 4.55 22.73 68.18 D432LAS 3 4.55 13.64 13.64 68.18 D441LAC 4 6.67 1.67 5.00 13.33 73.33 D441LAS 3 6.67 5.00 38.33 50.00 D442LAC 4 3.33 1.67 3.33 13.33 78.33 D442LAS 3 3.33 6.67 28.33 61.67 D451LAC 4 4.76 0.00 0.00 33.33 61.90 D451LAS 3 4.76 0.00 38.10 57.14 D452LAC 4 0.00 0.00 9.52 28.57 61.90 D452LAS 3 0.00 0.00 14.29 85.71 D461LAC 4 0.00 4.17 12.50 25.00 58.33 D461LAS 3 0.00 16.67 12.50 70.83 D462LAC 4 0.00 0.00 12.50 29.17 58.33 D462LAS 3 0.00 16.67 16.67 66.67 E311LAC 4 0.00 16.67 27.78 38.89 16.67 E311LAS 3 0.00 38.89 11.11 50.00 E312LAC 4 5.56 33.33 22.22 27.78 11.11 E312LAS 3 5.56 44.44 11.11 38.89 E321LAC 4 20.00 0.00 10.00 10.00 60.00
Item Number
Total Possible Points
Percent of Students at Score Point
0 1 2 3 4
E321LAS 3 20.00 0.00 20.00 60.00 E322LAC 4 20.00 0.00 10.00 20.00 50.00 E322LAS 3 20.00 10.00 10.00 60.00 E331LAC 4 9.52 4.76 4.76 14.29 66.67 E331LAS 3 9.52 9.52 28.57 52.38 E332LAC 4 9.52 4.76 0.00 19.05 66.67 E332LAS 3 9.52 4.76 33.33 52.38 E341LAC 4 2.04 0.00 4.08 53.06 40.82 E341LAS 3 2.04 4.08 24.49 69.39 E342LAC 4 4.08 0.00 4.08 44.90 46.94 E342LAS 3 4.08 4.08 24.49 67.35 E351LAC 4 0.00 7.14 14.29 10.71 67.86 E351LAS 3 0.00 3.57 25.00 71.43 E352LAC 4 0.00 7.14 17.86 25.00 50.00 E352LAS 3 0.00 3.57 28.57 67.86 E361LAC 4 3.85 3.85 23.08 34.62 34.62 E361LAS 3 3.85 7.69 19.23 69.23 E362LAC 4 3.85 0.00 23.08 50.00 23.08 E362LAS 3 3.85 7.69 23.08 65.38 E411LAC 4 4.17 8.33 33.33 29.17 25.00 E411LAS 3 4.17 20.83 16.67 58.33 E412LAC 4 4.17 8.33 25.00 45.83 16.67 E412LAS 3 4.17 16.67 8.33 70.83 E421LAC 4 0.00 0.00 0.00 50.00 50.00 E421LAS 3 0.00 0.00 50.00 50.00 E422LAC 4 0.00 0.00 33.33 33.33 33.33 E422LAS 3 0.00 0.00 50.00 50.00 E431LAC 4 5.45 1.82 21.82 12.73 58.18 E431LAS 3 5.45 9.09 23.64 61.82
continued
Appendix E—Item-Level Score Distributions 4 2015–16 MeCAS Technical Report Part II

Item Number
Total Possible Points
Percent of Students at Score Point
0 1 2 3 4
E432LAC 4 1.82 3.64 14.55 25.45 54.55 E432LAS 3 1.82 7.27 25.45 65.45 E441LAC 4 0.00 9.09 0.00 9.09 81.82 E441LAS 3 0.00 0.00 36.36 63.64 E442LAC 4 0.00 0.00 0.00 18.18 81.82 E442LAS 3 0.00 0.00 36.36 63.64 E451LAC 4 0.00 3.33 6.67 36.67 53.33
Item Number
Total Possible Points
Percent of Students at Score Point
0 1 2 3 4
E451LAS 3 0.00 10.00 33.33 56.67 E452LAC 4 6.67 0.00 10.00 20.00 63.33 E452LAS 3 6.67 10.00 20.00 63.33 E461LAC 4 3.57 0.00 0.00 78.57 17.86 E461LAS 3 3.57 0.00 17.86 78.57 E462LAC 4 3.57 0.00 7.14 53.57 35.71 E462LAS 3 3.57 0.00 25.00 71.43
Table E-3. 2015–16 PAAP: Item-Level Score Distributions for Constructed Response Items— Science High School
Item Number
Total Possible Points
Percent of Students at Score Point
0 1 2 3 4
D311LAC 4 14.29 0.00 21.43 28.57 35.71 D311LAS 3 14.29 7.14 14.29 64.29 D312LAC 4 14.29 7.14 14.29 14.29 50.00 D312LAS 3 14.29 14.29 14.29 57.14 D321LAC 4 14.29 0.00 35.71 28.57 21.43 D321LAS 3 14.29 14.29 14.29 57.14 D322LAC 4 14.29 0.00 35.71 14.29 35.71 D322LAS 3 14.29 21.43 7.14 57.14 D331LAC 4 8.33 0.00 0.00 50.00 41.67 D331LAS 3 8.33 0.00 8.33 83.33 D332LAC 4 8.33 0.00 8.33 8.33 75.00 D332LAS 3 8.33 0.00 8.33 83.33 D341LAC 4 0.00 5.88 0.00 17.65 76.47 D341LAS 3 0.00 0.00 52.94 47.06 D342LAC 4 0.00 0.00 0.00 17.65 82.35 D342LAS 3 0.00 5.88 64.71 29.41 D351LAC 4 7.69 0.00 5.13 46.15 41.03 D351LAS 3 7.69 2.56 30.77 58.97 D352LAC 4 7.69 0.00 2.56 12.82 76.92
Item Number
Total Possible Points
Percent of Students at Score Point
0 1 2 3 4
D352LAS 3 7.69 2.56 38.46 51.28 D361LAC 4 0.00 0.00 9.09 0.00 90.91 D361LAS 3 0.00 9.09 27.27 63.64 D362LAC 4 0.00 18.18 18.18 0.00 63.64 D362LAS 3 0.00 0.00 36.36 63.64 D371LAC 4 0.00 0.00 0.00 38.10 61.90 D371LAS 3 0.00 0.00 19.05 80.95 D372LAC 4 0.00 0.00 4.76 14.29 80.95 D372LAS 3 0.00 4.76 19.05 76.19 D381LAC 4 0.00 0.00 9.68 29.03 61.29 D381LAS 3 0.00 0.00 29.03 70.97 D382LAC 4 0.00 0.00 19.35 19.35 61.29 D382LAS 3 0.00 3.23 29.03 67.74 E111LAC 4 8.33 8.33 8.33 41.67 33.33 E111LAS 3 8.33 16.67 25.00 50.00 E112LAC 4 8.33 8.33 16.67 25.00 41.67 E112LAS 3 8.33 16.67 25.00 50.00 E121LAC 4 20.00 0.00 0.00 20.00 60.00 E121LAS 3 20.00 20.00 20.00 40.00
continued
Appendix E—Item-Level Score Distributions 5 2015–16 MeCAS Technical Report Part II

Item Number
Total Possible Points
Percent of Students at Score Point
0 1 2 3 4
E122LAC 4 20.00 0.00 20.00 20.00 40.00 E122LAS 3 20.00 20.00 20.00 40.00 E131LAC 4 4.17 0.00 8.33 12.50 75.00 E131LAS 3 4.17 8.33 12.50 75.00 E132LAC 4 4.17 0.00 16.67 33.33 45.83 E132LAS 3 4.17 4.17 20.83 70.83 E141LAC 4 0.00 9.09 9.09 9.09 72.73 E141LAS 3 0.00 0.00 72.73 27.27 E142LAC 4 0.00 18.18 0.00 9.09 72.73 E142LAS 3 0.00 0.00 81.82 18.18 E151LAC 4 4.00 0.00 0.00 36.00 60.00 E151LAS 3 4.00 0.00 12.00 84.00 E152LAC 4 12.00 0.00 0.00 4.00 84.00 E152LAS 3 12.00 0.00 36.00 52.00 E161LAC 4 2.63 0.00 2.63 55.26 39.47 E161LAS 3 2.63 2.63 26.32 68.42 E162LAC 4 2.63 0.00 5.26 39.47 52.63 E162LAS 3 2.63 2.63 18.42 76.32 E171LAC 4 0.00 0.00 0.00 30.77 69.23 E171LAS 3 0.00 0.00 46.15 53.85 E172LAC 4 0.00 0.00 0.00 30.77 69.23 E172LAS 3 0.00 0.00 38.46 61.54 E181LAC 4 0.00 3.33 6.67 23.33 66.67 E181LAS 3 0.00 3.33 16.67 80.00 E182LAC 4 0.00 0.00 6.67 26.67 66.67 E182LAS 3 0.00 3.33 16.67 80.00 E511LAC 4 0.00 7.69 7.69 30.77 53.85 E511LAS 3 0.00 15.38 30.77 53.85 E512LAC 4 7.69 7.69 15.38 38.46 30.77 E512LAS 3 7.69 15.38 30.77 46.15 E521LAC 4 7.69 0.00 15.38 38.46 38.46
Item Number
Total Possible Points
Percent of Students at Score Point
0 1 2 3 4
E521LAS 3 7.69 7.69 7.69 76.92 E522LAC 4 7.69 0.00 7.69 38.46 46.15 E522LAS 3 7.69 7.69 7.69 76.92 E531LAC 4 4.00 0.00 16.00 32.00 48.00 E531LAS 3 4.00 4.00 32.00 60.00 E532LAC 4 4.00 0.00 12.00 16.00 68.00 E532LAS 3 4.00 4.00 36.00 56.00 E541LAC 4 0.00 0.00 4.76 14.29 80.95 E541LAS 3 0.00 0.00 57.14 42.86 E542LAC 4 0.00 4.76 0.00 42.86 52.38 E542LAS 3 0.00 4.76 38.10 57.14 E551LAC 4 8.33 0.00 4.17 33.33 54.17 E551LAS 3 8.33 0.00 16.67 75.00 E552LAC 4 8.33 0.00 25.00 25.00 41.67 E552LAS 3 8.33 4.17 33.33 54.17 E561LAC 4 5.00 5.00 10.00 15.00 65.00 E561LAS 3 5.00 0.00 65.00 30.00 E562LAC 4 5.00 5.00 10.00 30.00 50.00 E562LAS 3 5.00 5.00 65.00 25.00 E571LAC 4 0.00 0.00 6.25 25.00 68.75 E571LAS 3 0.00 0.00 6.25 93.75 E572LAC 4 6.25 0.00 12.50 12.50 68.75 E572LAS 3 6.25 0.00 12.50 81.25 E581LAC 4 0.00 0.00 0.00 59.26 40.74 E581LAS 3 0.00 0.00 7.41 92.59 E582LAC 4 0.00 0.00 0.00 37.04 62.96 E582LAS 3 0.00 0.00 22.22 77.78
Appendix E—Item-Level Score Distributions 6 2015–16 MeCAS Technical Report Part II

APPENDIX F—SUBGROUP RELIABILITY
Appendix F—Subgroup Reliability 1 2015–16 MeCAS Technical Report Part II


Table F-1. 2015–16 PAAP: Subgroup Reliabilities—Science
Grade Group Number of Students
Raw Score Alpha SEM
Maximum Mean Standard Deviation
5
All Students 151 69 46.20 14.36 0.72 7.60 Male 107 69 45.73 15.29 0.74 7.80 Female 44 69 47.34 11.88 0.63 7.23 Gender Not Reported 0 69 Hispanic or Latino 3 69 American Indian or Alaskan Native 0 69 Asian 3 69 Black or African American 8 69 Native Hawaiian or Pacific Islander 1 69 White (non-Hispanic) 133 69 45.37 14.25 0.74 7.27 Two or more races 3 69 No Primary Race/Ethnicity Reported 0 69 Currently receiving LEP services 7 69 Former LEP student – monitoring year 1 0 69 Former LEP student – monitoring year 2 0 69 LEP: All Other Students 144 69 46.60 13.99 0.66 8.16 Students with an IEP 151 69 46.20 14.36 0.72 7.60 IEP: All Other Students 0 69 Economically Disadvantaged Students 100 69 47.73 13.52 0.76 6.62 SES: All Other Students 51 69 43.20 15.58 0.59 9.98 Migrant Students 0 69 Migrant: All Other Students 151 69 46.20 14.36 0.72 7.60 Students receiving Title 1 Services 10 69 43.70 14.28 0.91 4.28 Title 1: All Other Students 141 69 46.38 14.40 0.69 8.02 Plan 504 1 69 Plan 504: All Other Students 150 69 46.11 14.37 0.72 7.60
8 All Students 154 99 61.01 25.32 0.86 9.47 Male 95 99 59.38 26.29 0.85 10.18 Female 59 99 63.63 23.65 0.88 8.19
continued
Appendix F—Subgroup Reliability 3 2015–16 MeCAS Technical Report Part II

Grade Group Number of Students
Raw Score Alpha SEM
Maximum Mean Standard Deviation
8
Gender Not Reported 0 99 Hispanic or Latino 2 99 American Indian or Alaskan Native 1 99 Asian 1 99 Black or African American 11 99 60.45 28.75 0.76 14.08 Native Hawaiian or Pacific Islander 0 99 White (non-Hispanic) 136 99 60.46 24.65 0.85 9.55 Two or more races 3 99 No Primary Race/Ethnicity Reported 0 99 Currently receiving LEP services 3 99 Former LEP student – monitoring year 1 0 99 Former LEP student – monitoring year 2 0 99 LEP: All Other Students 151 99 60.70 25.40 0.86 9.50 Students with an IEP 154 99 61.01 25.32 0.86 9.47 IEP: All Other Students 0 99 Economically Disadvantaged Students 102 99 63.28 24.39 0.83 10.06 SES: All Other Students 52 99 56.54 26.72 0.89 8.86 Migrant Students 1 99 Migrant: All Other Students 153 99 60.86 25.33 0.86 9.48 Students receiving Title 1 Services 2 99 Title 1: All Other Students 152 99 60.79 25.36 0.86 9.49 Plan 504 0 99 Plan 504: All Other Students 154 99 61.01 25.32 0.86 9.47
HS
All Students 159 129 79.92 35.30 0.89 11.71 Male 97 129 78.13 38.30 0.92 10.83 Female 62 129 82.71 30.11 0.69 16.76 Gender Not Reported 0 129 Hispanic or Latino 1 129 American Indian or Alaskan Native 3 129 Asian 2 129 Black or African American 2 129 Native Hawaiian or Pacific Islander 0 129
continued
Appendix F—Subgroup Reliability 4 2015–16 MeCAS Technical Report Part II

Grade Group Number of Students
Raw Score Alpha SEM
Maximum Mean Standard Deviation
HS
White (non-Hispanic) 148 129 80.22 35.39 0.89 11.74 Two or more races 3 129 No Primary Race/Ethnicity Reported 0 129 Currently receiving LEP services 4 129 Former LEP student – monitoring year 1 0 129 Former LEP student – monitoring year 2 0 129 LEP: All Other Students 155 129 80.67 35.23 0.89 11.68 Students with an IEP 159 129 79.92 35.30 0.89 11.71 IEP: All Other Students 0 129 Economically Disadvantaged Students 103 129 83.83 33.39 0.82 14.17 SES: All Other Students 56 129 72.73 37.83 0.93 10.01 Migrant Students 0 129 Migrant: All Other Students 159 129 79.92 35.30 0.89 11.71 Students receiving Title 1 Services 0 129 Title 1: All Other Students 159 129 79.92 35.30 0.89 11.71 Plan 504 1 129 Plan 504: All Other Students 158 129 79.99 35.40 0.89 11.74
Appendix F—Subgroup Reliability 5 2015–16 MeCAS Technical Report Part II

APPENDIX G—DECISION ACCURACY AND CONSISTENCY RESULTS
Appendix G—Decision Accuracy and Consistency Results 1 2015–16 MeCAS Technical Report Part II


Table G-1. 2015–16 PAAP: Summary of Decision Accuracy (and Consistency) Results by Subject and Grade—Overall and Conditional on Performance Level
Subject Grade Overall Kappa Conditional on Level
Not Proficient Proficient
Science 5 0.83 (0.78) 0.62 0.75 (0.70) 0.77 (0.67) 8 0.89 (0.85) 0.72 0.83 (0.80) 0.83 (0.76)
HS 0.90 (0.86) 0.76 0.86 (0.85) 0.76 (0.70)
Table G-2. 2015–16 PAAP: Summary of Decision Accuracy (and Consistency) Results by Subject and Grade—Conditional on Cut Point
Subject Grade
Not Proficient / Proficient
Accuracy (consistency)
False Positive Negative
Science 5 0.83 (0.78) 0.10 0.06 8 0.89 (0.85) 0.07 0.04
HS 0.90 (0.86) 0.07 0.04
Appendix G—Decision Accuracy and Consistency Results 3 2015–16 MeCAS Technical Report Part II

APPENDIX H—INTERRATER CONSISTENCY
Appendix H—Interrater Consistency 1 2015–16 MeCAS Technical Report Part II


Table H-1. 2015–16 PAAP: Item-Level Interrater Consistency Statistics— Science Grade 5
Item Number of
Percent
Correlation Percent of Third Scores
Score Categories
Responses Scored Twice Exact Adjacent
D111LAC 4 16 87.50 6.25 0.75 12.50 D111LAS 3 16 100.00 0.00 1.00 0.00 D112LAC 4 17 94.12 5.88 0.95 5.88 D112LAS 3 17 100.00 0.00 1.00 0.00 D121LAC 4 53 98.11 0.00 0.90 3.77 D121LAS 3 53 98.11 1.89 0.70 1.89 D122LAC 4 64 93.75 6.25 0.81 7.81 D122LAS 3 64 98.44 1.56 0.95 1.56 D131LAC 4 23 100.00 0.00 1.00 0.00 D131LAS 3 23 95.65 4.35 0.93 4.35 D132LAC 4 24 91.67 8.33 0.96 8.33 D132LAS 3 24 95.83 4.17 0.93 4.17 D141LAC 4 38 60.53 26.32 0.69 39.47 D141LAS 3 38 97.37 0.00 0.82 2.63 D142LAC 4 39 100.00 0.00 1.00 0.00 D142LAS 3 39 100.00 0.00 1.00 0.00 D211LAC 4 14 92.86 7.14 0.95 7.14 D211LAS 3 14 100.00 0.00 1.00 0.00 D212LAC 4 14 92.86 7.14 0.96 7.14 D212LAS 3 14 100.00 0.00 1.00 0.00 D221LAC 4 30 86.67 13.33 0.89 16.67 D221LAS 3 30 100.00 0.00 1.00 3.33 D222LAC 4 30 100.00 0.00 1.00 3.33 D222LAS 3 30 96.67 0.00 0.67 6.67 D231LAC 4 77 96.10 3.90 0.96 3.90 D231LAS 3 77 98.70 0.00 0.63 1.30 D232LAC 4 77 97.40 1.30 0.89 2.60 D232LAS 3 77 98.70 0.00 0.57 1.30 D241LAC 4 26 88.46 11.54 0.92 11.54 D241LAS 3 26 100.00 0.00 1.00 0.00 D242LAC 4 26 80.77 19.23 0.92 19.23 D242LAS 3 26 100.00 0.00 1.00 0.00 E211LAC 4 18 94.44 5.56 0.96 5.56 E211LAS 3 18 100.00 0.00 1.00 0.00 E212LAC 4 18 94.44 5.56 0.97 5.56 E212LAS 3 18 100.00 0.00 1.00 0.00 E221LAC 4 26 96.15 3.85 0.94 3.85 E221LAS 3 26 96.15 0.00 0.66 3.85 E222LAC 4 25 100.00 0.00 1.00 0.00 E222LAS 3 25 100.00 0.00 1.00 0.00 E231LAC 4 71 49.30 12.68 0.52 52.11 E231LAS 3 71 98.59 1.41 0.96 1.41 E232LAC 4 71 52.11 15.49 0.54 49.30 E232LAS 3 71 94.37 2.82 0.50 5.63
continued
Appendix H—Interrater Consistency 3 2015–16 MeCAS Technical Report Part II

Item Number of
Percent
Correlation Percent of Third Scores
Score Categories
Responses Scored Twice Exact Adjacent
E241LAC 4 32 90.63 9.38 0.93 9.38 E241LAS 3 32 96.88 3.13 0.97 3.13 E242LAC 4 32 81.25 15.63 0.83 18.75 E242LAS 3 32 100.00 0.00 1.00 0.00
Table H-2. 2015–16 PAAP: Item-Level Interrater Consistency Statistics— Science Grade 8
Item Number of
Percent
Correlation Percent of Third Scores
Score Categories
Responses Scored Twice Exact Adjacent
D411LAC 4 15 93.33 6.67 0.97 6.67 D411LAS 3 15 100.00 0.00 1.00 0.00 D412LAC 4 15 93.33 0.00 0.78 6.67 D412LAS 3 15 93.33 0.00 0.87 6.67 D421LAC 4 6 D421LAS 3 6 D422LAC 4 6 D422LAS 3 6 D431LAC 4 18 83.33 16.67 0.87 16.67 D431LAS 3 18 100.00 0.00 1.00 0.00 D432LAC 4 20 100.00 0.00 1.00 0.00 D432LAS 3 20 100.00 0.00 1.00 0.00 D441LAC 4 54 88.89 9.26 0.83 11.11 D441LAS 3 54 94.44 3.70 0.86 5.56 D442LAC 4 56 91.07 8.93 0.89 8.93 D442LAS 3 56 98.21 0.00 0.92 1.79 D451LAC 4 20 95.00 5.00 0.89 5.00 D451LAS 3 20 100.00 0.00 1.00 0.00 D452LAC 4 21 85.71 9.52 0.77 14.29 D452LAS 3 21 100.00 0.00 1.00 0.00 D461LAC 4 24 87.50 12.50 0.89 12.50 D461LAS 3 24 95.83 0.00 0.87 4.17 D462LAC 4 24 91.67 8.33 0.91 8.33 D462LAS 3 24 100.00 0.00 1.00 0.00 E311LAC 4 17 94.12 5.88 0.97 5.88 E311LAS 3 17 100.00 0.00 1.00 0.00 E312LAC 4 16 87.50 12.50 0.95 12.50 E312LAS 3 16 100.00 0.00 1.00 0.00 E321LAC 4 8 E321LAS 3 8 E322LAC 4 8 E322LAS 3 8 E331LAC 4 19 94.74 5.26 0.96 5.26 E331LAS 3 19 100.00 0.00 1.00 0.00 E332LAC 4 19 94.74 5.26 0.95 5.26 E332LAS 3 19 100.00 0.00 1.00 0.00 E341LAC 4 48 95.83 4.17 0.94 4.17
continued
Appendix H—Interrater Consistency 4 2015–16 MeCAS Technical Report Part II

Item Number of
Percent
Correlation Percent of Third Scores
Score Categories
Responses Scored Twice Exact Adjacent
E341LAS 3 48 97.92 2.08 0.97 2.08 E342LAC 4 47 91.49 8.51 0.88 8.51 E342LAS 3 47 95.74 2.13 0.75 4.26 E351LAC 4 28 92.86 3.57 0.91 7.14 E351LAS 3 28 89.29 3.57 0.70 10.71 E352LAC 4 28 96.43 0.00 0.93 3.57 E352LAS 3 28 92.86 3.57 0.76 7.14 E361LAC 4 25 80.00 20.00 0.87 20.00 E361LAS 3 25 96.00 0.00 0.83 4.00 E362LAC 4 25 84.00 16.00 0.84 16.00 E362LAS 3 25 96.00 0.00 0.83 4.00 E411LAC 4 22 100.00 0.00 1.00 0.00 E411LAS 3 22 100.00 0.00 1.00 0.00 E412LAC 4 21 100.00 0.00 1.00 0.00 E412LAS 3 21 100.00 0.00 1.00 0.00 E421LAC 4 6 E421LAS 3 6 E422LAC 4 6 E422LAS 3 6 E431LAC 4 52 98.08 1.92 0.99 1.92 E431LAS 3 52 96.15 3.85 0.96 3.85 E432LAC 4 54 98.15 1.85 0.99 1.85 E432LAS 3 54 96.30 3.70 0.95 3.70 E441LAC 4 11 72.73 18.18 0.71 27.27 E441LAS 3 11 100.00 0.00 1.00 0.00 E442LAC 4 11 90.91 9.09 0.67 9.09 E442LAS 3 11 100.00 0.00 1.00 0.00 E451LAC 4 29 65.52 24.14 0.33 34.48 E451LAS 3 29 93.10 0.00 0.80 6.90 E452LAC 4 27 74.07 14.81 0.31 25.93 E452LAS 3 27 96.30 0.00 0.86 3.70 E461LAC 4 27 92.59 7.41 0.81 7.41 E461LAS 3 27 100.00 0.00 1.00 0.00 E462LAC 4 27 100.00 0.00 1.00 0.00 E462LAS 3 27 100.00 0.00 1.00 0.00
Table H-3. 2015–16 PAAP: Item-Level Interrater Consistency Statistics— Science High School
Item Number of
Percent
Correlation Percent of Third Scores
Score Categories
Responses Scored Twice Exact Adjacent
D311LAC 4 10 90.00 10.00 0.96 10.00 D311LAS 3 10 100.00 0.00 1.00 0.00 D312LAC 4 11 81.82 9.09 0.83 18.18 D312LAS 3 11 90.91 9.09 0.93 9.09 D321LAC 4 9 D321LAS 3 9
continued
Appendix H—Interrater Consistency 5 2015–16 MeCAS Technical Report Part II
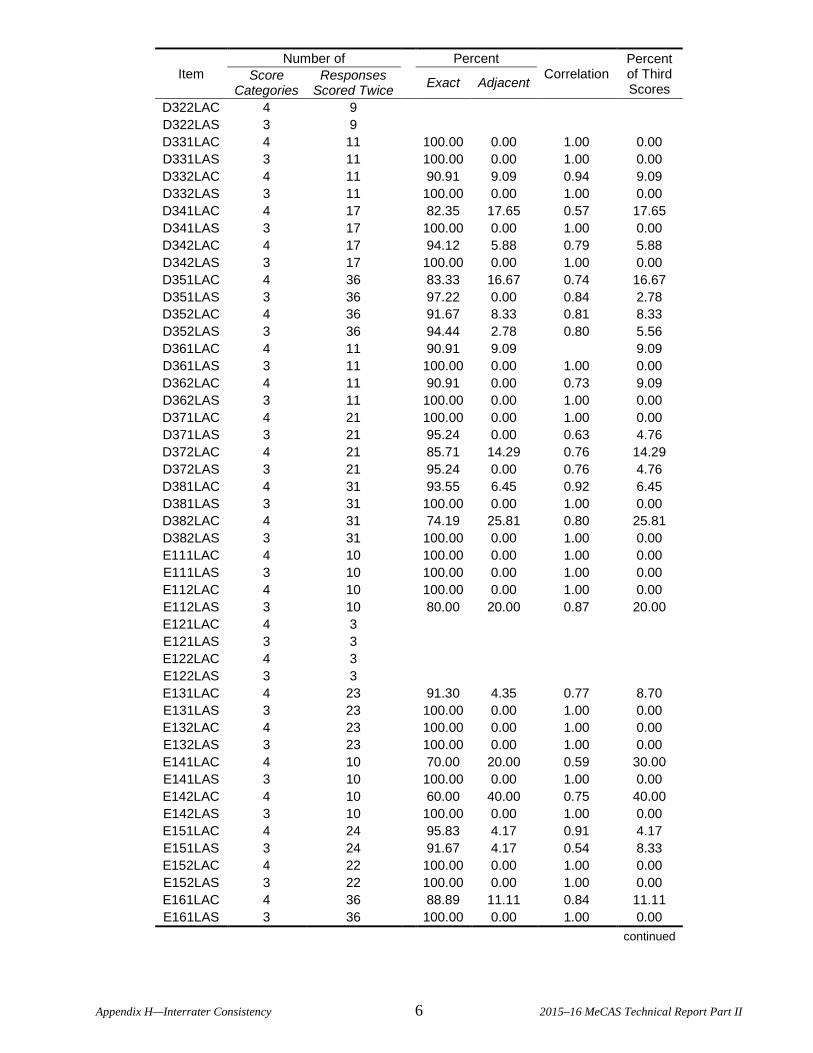
Item Number of
Percent
Correlation Percent of Third Scores
Score Categories
Responses Scored Twice Exact Adjacent
D322LAC 4 9 D322LAS 3 9 D331LAC 4 11 100.00 0.00 1.00 0.00 D331LAS 3 11 100.00 0.00 1.00 0.00 D332LAC 4 11 90.91 9.09 0.94 9.09 D332LAS 3 11 100.00 0.00 1.00 0.00 D341LAC 4 17 82.35 17.65 0.57 17.65 D341LAS 3 17 100.00 0.00 1.00 0.00 D342LAC 4 17 94.12 5.88 0.79 5.88 D342LAS 3 17 100.00 0.00 1.00 0.00 D351LAC 4 36 83.33 16.67 0.74 16.67 D351LAS 3 36 97.22 0.00 0.84 2.78 D352LAC 4 36 91.67 8.33 0.81 8.33 D352LAS 3 36 94.44 2.78 0.80 5.56 D361LAC 4 11 90.91 9.09 9.09 D361LAS 3 11 100.00 0.00 1.00 0.00 D362LAC 4 11 90.91 0.00 0.73 9.09 D362LAS 3 11 100.00 0.00 1.00 0.00 D371LAC 4 21 100.00 0.00 1.00 0.00 D371LAS 3 21 95.24 0.00 0.63 4.76 D372LAC 4 21 85.71 14.29 0.76 14.29 D372LAS 3 21 95.24 0.00 0.76 4.76 D381LAC 4 31 93.55 6.45 0.92 6.45 D381LAS 3 31 100.00 0.00 1.00 0.00 D382LAC 4 31 74.19 25.81 0.80 25.81 D382LAS 3 31 100.00 0.00 1.00 0.00 E111LAC 4 10 100.00 0.00 1.00 0.00 E111LAS 3 10 100.00 0.00 1.00 0.00 E112LAC 4 10 100.00 0.00 1.00 0.00 E112LAS 3 10 80.00 20.00 0.87 20.00 E121LAC 4 3 E121LAS 3 3 E122LAC 4 3 E122LAS 3 3 E131LAC 4 23 91.30 4.35 0.77 8.70 E131LAS 3 23 100.00 0.00 1.00 0.00 E132LAC 4 23 100.00 0.00 1.00 0.00 E132LAS 3 23 100.00 0.00 1.00 0.00 E141LAC 4 10 70.00 20.00 0.59 30.00 E141LAS 3 10 100.00 0.00 1.00 0.00 E142LAC 4 10 60.00 40.00 0.75 40.00 E142LAS 3 10 100.00 0.00 1.00 0.00 E151LAC 4 24 95.83 4.17 0.91 4.17 E151LAS 3 24 91.67 4.17 0.54 8.33 E152LAC 4 22 100.00 0.00 1.00 0.00 E152LAS 3 22 100.00 0.00 1.00 0.00 E161LAC 4 36 88.89 11.11 0.84 11.11 E161LAS 3 36 100.00 0.00 1.00 0.00
continued
Appendix H—Interrater Consistency 6 2015–16 MeCAS Technical Report Part II

Item Number of
Percent
Correlation Percent of Third Scores
Score Categories
Responses Scored Twice Exact Adjacent
E162LAC 4 36 94.44 5.56 0.91 5.56 E162LAS 3 36 97.22 2.78 0.95 2.78 E171LAC 4 13 92.31 7.69 0.82 7.69 E171LAS 3 13 100.00 0.00 1.00 0.00 E172LAC 4 13 100.00 0.00 1.00 0.00 E172LAS 3 13 100.00 0.00 1.00 0.00 E181LAC 4 30 86.67 13.33 0.90 13.33 E181LAS 3 30 100.00 0.00 1.00 0.00 E182LAC 4 30 93.33 6.67 0.91 6.67 E182LAS 3 30 96.67 0.00 0.79 3.33 E511LAC 4 13 92.31 7.69 0.96 7.69 E511LAS 3 13 100.00 0.00 1.00 0.00 E512LAC 4 12 91.67 8.33 0.95 8.33 E512LAS 3 12 100.00 0.00 1.00 0.00 E521LAC 4 10 100.00 0.00 1.00 0.00 E521LAS 3 10 100.00 0.00 1.00 0.00 E522LAC 4 10 100.00 0.00 1.00 0.00 E522LAS 3 10 100.00 0.00 1.00 0.00 E531LAC 4 23 91.30 4.35 0.81 8.70 E531LAS 3 23 100.00 0.00 1.00 0.00 E532LAC 4 23 82.61 17.39 0.85 17.39 E532LAS 3 23 95.65 4.35 0.94 4.35 E541LAC 4 21 100.00 0.00 1.00 0.00 E541LAS 3 21 100.00 0.00 1.00 0.00 E542LAC 4 21 95.24 4.76 0.96 4.76 E542LAS 3 21 95.24 4.76 0.93 4.76 E551LAC 4 22 100.00 0.00 1.00 0.00 E551LAS 3 22 95.45 0.00 0.46 4.55 E552LAC 4 22 86.36 9.09 0.82 13.64 E552LAS 3 22 90.91 4.55 0.57 9.09 E561LAC 4 18 77.78 16.67 0.74 22.22 E561LAS 3 18 94.44 5.56 0.89 5.56 E562LAC 4 18 100.00 0.00 1.00 0.00 E562LAS 3 18 100.00 0.00 1.00 0.00 E571LAC 4 16 93.75 0.00 0.41 6.25 E571LAS 3 16 93.75 0.00 0.26 6.25 E572LAC 4 15 73.33 13.33 0.85 26.67 E572LAS 3 15 100.00 0.00 1.00 0.00 E581LAC 4 27 81.48 18.52 0.69 18.52 E581LAS 3 27 96.30 0.00 0.54 3.70 E582LAC 4 27 85.19 14.81 0.73 14.81 E582LAS 3 27 92.59 3.70 0.63 7.41
Appendix H—Interrater Consistency 7 2015–16 MeCAS Technical Report Part II

APPENDIX I—SCORE OF RECORD
Appendix I—Score of Record 1 2015–16 MeCAS Technical Report Part II


1
Maine Alt (PAAP) 1516 Score of Record
I. PAAP Portfolio-
All entries must be submitted with AGLE/Performance Indicators consistent with those listed in 2015-16_PAAP_Blueprint.pdf. Each entry must
have a unique AGLE/Performance Indictor.
1. Science: 3 entries submitted
Grades 05, 08, 11 (3rd
year HS)
All students must reported in grade 05, 08, or 3rd
year HS to be reported. Discrepancies will be resolved during data processing clean up.
II. Portfolio Data Points
Each portfolio will be scored at least twice. Some data points will require a third score. The scored data points are listed below.
1. PAAP Submitted: PAAP Submitted (Y, N)
2. Entry data points:
a. Entry Submitted (Y, N, blank)
b. AGLE (A, B, C, D, E, blank) (For non blank, see section I for valid values)
c. Performance Indicators (1, 2, 3, 4, 5, blank) (For non blank, see section I for valid values)
d. Level of Complexity (1-8, blank)
i) Table of Valid Values
Grades Level of Complexity
5 1, 2, 3, 4
8 1, 2, 3, 4, 5, 6
11 1, 2, 3, 4, 5, 6, 7, 8
e. Entry Meets PAAP Requirements (Y, N, blank)
3. Task data points
a. Scorable (Y, N, blank)

2
b. Level of Accuracy (1-4, blank)
c. Level of Assistance (1-3, blank)
4. Comment Codes (1, 2, 3, 4, 5, A, B, C, D, E, F)
a. Valid value are 1, 2a, 2b, 2c, 2d,2e, 3a, 3b, 3c, 3d, 3e, 4a, 4b, 5a, 5b
III. Calculation of Final Score of Record for PAAP Submitted and Entry Data Points
1. Calculate Final PAAP Submitted
a. If Scid_3 PAAP Submitted is not blank then Scid_3 PAAP Submitted is the Final PAAP Submitted. Else Scid_1 PAAP Submitted
is the Final PAAP Submitted.
b. If Final PAAP Submitted = ‘N’ then all entry data points are set to blank.
c. If Final PAAP Submitted = ‘Y’ then calculate Final Entry data points and Comment Codes (as outlined below).
2. Calculate Final Entry Submitted, AGLE, Performance Indicator, Level of Complexity and Entry Meets PAAP Requirements
a. If Scid_3 Entry Submitted is not blank then Scid_3 Entry Submitted is the Final Entry Submitted. Else Scid_1 Entry Submitted is
the Final Entry Submitted.
b. If Final Entry Submitted = ‘N’ then the AGLE, Performance Indicator, Level of Complexity, Entry Meets PAAP Requirements
and all tasks data points are set to blank.
c. If Final Entry Submitted = ‘Y’ then
i. If Scid_3 AGLE is not blank then Scid_3 AGLE is the Final AGLE. Else Scid_1 AGLE is the Final AGLE.
ii. If Scid_3 Performance Indicator is not blank then Scid_3 Performance Indicator is the Final Performance Indicator. Else
Scid_1 Performance Indicator is the Final Performance Indicator.
iii. If Scid_3 Level of Complexity is not blank then Scid_3 Level of Complexity is the Final Level of Complexity. Else
Scid_1 Level of Complexity is the Final Level of Complexity.
iv. If Scid_3 Entry Meets PAAP Requirements is not blank then Scid_3 Entry Meets PAAP Requirements is the Final Entry
Meets PAAP Requirements. Else Scid_1 Entry Meets PAAP Requirements is the Final Entry Meets PAAP Requirements.
v. If Final Entry Meets PAAP Requirements = ‘N’ then all task data points are set to blank.
vi. If Final Entry Meets PAAP Requirements = ‘Y’ then for each task calculate Final Scorable.
3. Calculate Final Scorable, Level of Accuracy and Level of Assistance
a. If Scid_3 Scorable is not blank then Scid_3 Scorable is the Final Scorable. Else Scid_1 Scorable is the Final Scorable.
b. If Scorable = ‘N’ then the Level of Accuracy and Level of Assistance data points are set to ‘U’ (unscorable).
c. If Scorable = ‘Y’ then

3
i. If Scid_3 Level of Accuracy is not blank then Scid_3 Level of Accuracy is the Final Level of Accuracy. Else Scid_1
Level of Accuracy is the Final Level of Accuracy.
d. If Scid_3 Level of Assistance is not blank then Scid_3 Level of Assistance is the final Level of Assistance. Else Scid_1 Level of
Assistance is the Final Level of Assistance.
4. Calculate Final Comment Code(s)
a. If Final PAAP Submitted = ‘Y’ then if Scid_3 Comment Code(s) is not blank then Scid_3 Comment Code(s) is/are the Final
Comment code(s). Else Scid_1 Comment code(s) is/are the Final Comment Code.
b. If Final PAAP Submitted = ‘N’ then set the Final Comment Codes to blank.
5. For entries with at least one scorable task, if the unique rule for AGLE/performance indicator described in section “I. PAAP Portfolio” is
violated, then for the entry (entries) with the second (third) occurrence of the duplicate AGLE/performance indicator the final score of
record must be Entry Submitted=Y, AGLE as calculated, Performance Indicator as calculated, Meets PAAP Requirements=N and all task
data points must be blank.
IV. Calculation of Final Overall Achievement Scores based on Final Score of Record for PAAP Submitted and Entry Data Points
1. For when Final PAAP Submitted = Y a student will be assigned an Achievement Based Overall Score and Achievement Level.
2. For when Final PAAP Submitted = N, scores will be reported as No PAAP Submitted.
3. For each entry where Final Entry Submitted = N or Final Entry Meets Requirements = N or all tasks are unscorable then
Final Entry Score = 0 and Final Entry Level of Accuracy (Assistance) = ‘U’.
4. Final Entry Score = (5 * Final Level of Complexity) + Final Entry Level of Accuracy + Final Entry Level of Assistance – 4, where the
following tables are used to calculate the Final Entry Scores for Level of Accuracy and Level of Assistance based on the number of tasks
and total points across all tasks. For example, if an entry has 2 tasks (e.g. math) and the sum of the Level of Accuracy points across all
tasks is 7 then the Final Entry Level of Accuracy score is 4. An unscorable task (‘U’) is assigned a score of 0 for calculation purposes.
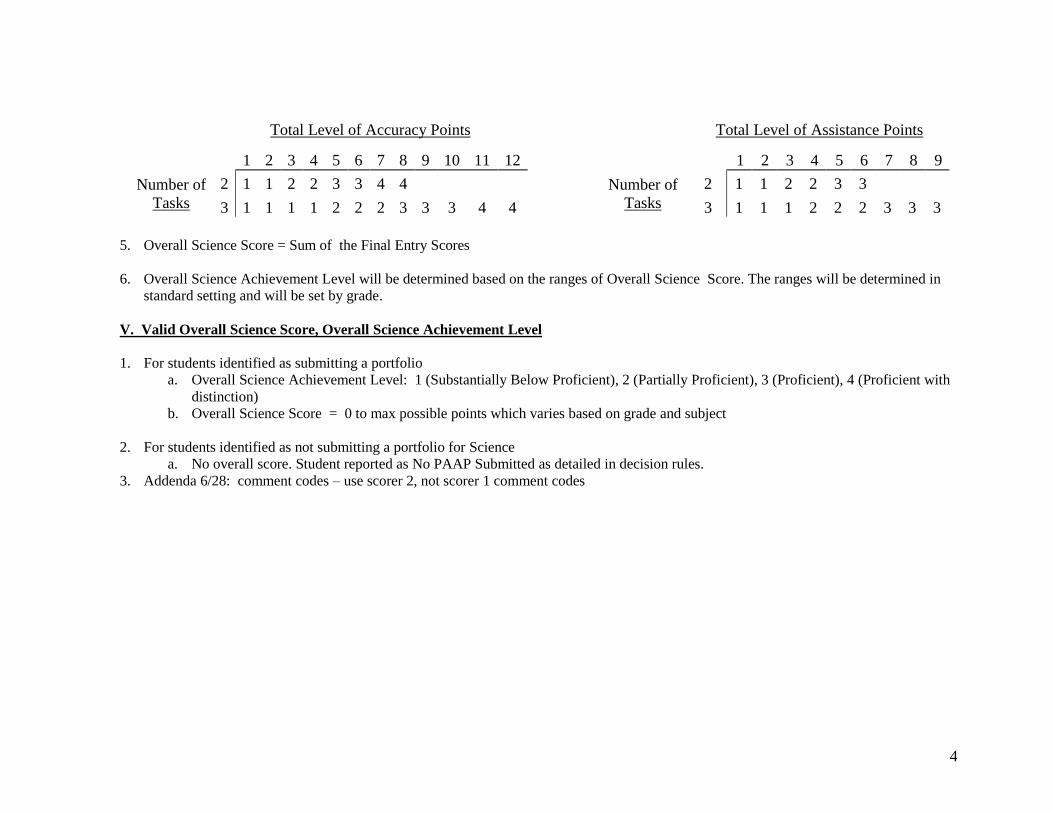
4
5. Overall Science Score = Sum of the Final Entry Scores
6. Overall Science Achievement Level will be determined based on the ranges of Overall Science Score. The ranges will be determined in
standard setting and will be set by grade.
V. Valid Overall Science Score, Overall Science Achievement Level
1. For students identified as submitting a portfolio
a. Overall Science Achievement Level: 1 (Substantially Below Proficient), 2 (Partially Proficient), 3 (Proficient), 4 (Proficient with
distinction)
b. Overall Science Score = 0 to max possible points which varies based on grade and subject
2. For students identified as not submitting a portfolio for Science
a. No overall score. Student reported as No PAAP Submitted as detailed in decision rules.
3. Addenda 6/28: comment codes – use scorer 2, not scorer 1 comment codes
Total Level of Accuracy Points
1 2 3 4 5 6 7 8 9 10 11 12
Number of
Tasks
2 1 1 2 2 3 3 4 4
3 1 1 1 1 2 2 2 3 3 3 4 4
Total Level of Assistance Points
1 2 3 4 5 6 7 8 9
Number of
Tasks
2 1 1 2 2 3 3
3 1 1 1 2 2 2 3 3 3

APPENDIX J—CUMULATIVE SCORE DISTRIBUTIONS
Appendix J—Cumulative Score Distributions 1 2015–16 MeCAS Technical Report Part II

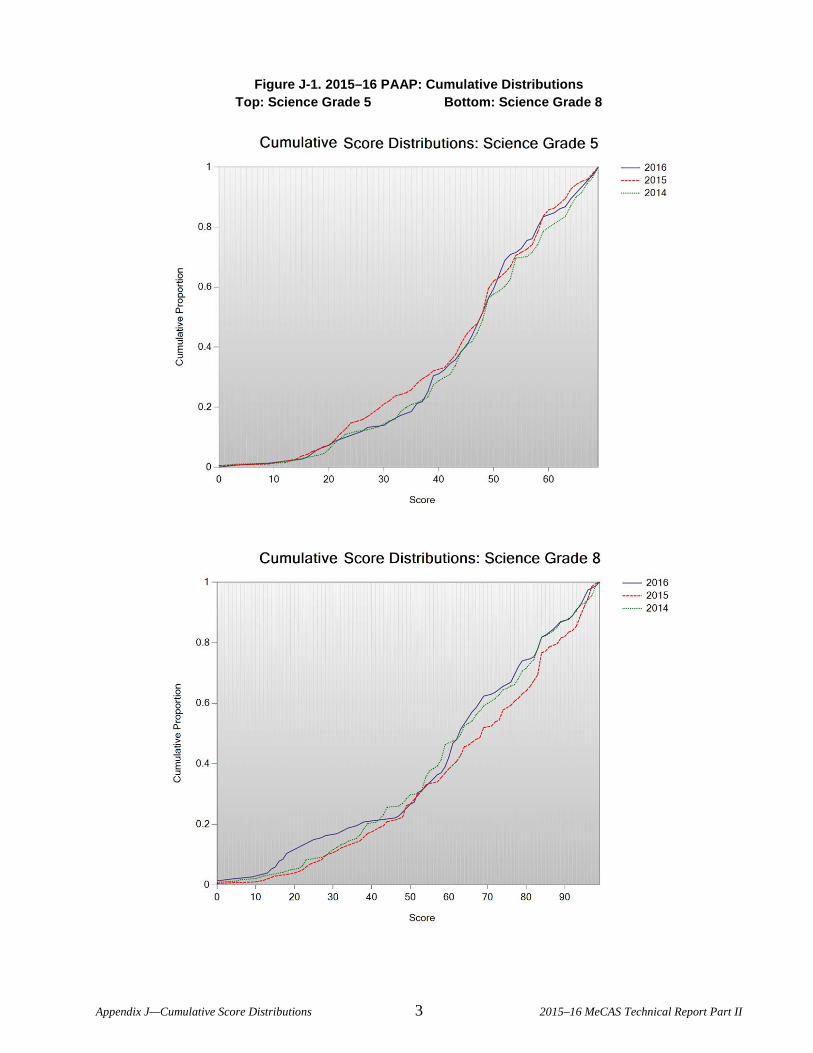
Figure J-1. 2015–16 PAAP: Cumulative Distributions Top: Science Grade 5 Bottom: Science Grade 8
Appendix J—Cumulative Score Distributions 3 2015–16 MeCAS Technical Report Part II

Figure J-2. 2015–16 PAAP: Cumulative Distributions Top: Science High School
Appendix J—Cumulative Score Distributions 4 2015–16 MeCAS Technical Report Part II

APPENDIX K—ACHIEVEMENT-LEVEL DISTRIBUTIONS
Appendix K—Achievement-Level Distributions 1 2015–16 MeCAS Technical Report Part II


Table K-1. 2015–16 PAAP: Achievement-Level Distributions by Subject and Grade
Subject Grade Achievement Level
Percent at Level 2015–16 2014–15 2013–14
Science
5
4 8.61 5.79 9.95 3 52.98 53.16 51.74 2 28.48 28.42 27.36 1 9.93 12.63 10.95
8
4 11.04 16.02 11.16 3 52.6 50 49.59 2 18.83 21.84 26.03 1 17.53 12.14 13.22
HS
4 10.69 4.28 9.9 3 34.59 34.22 28.13 2 34.59 35.29 45.83 1 20.13 26.2 16.15
Appendix K—Achievement-Level Distributions 3 2015–16 MeCAS Technical Report Part II

APPENDIX L—ANALYSIS AND REPORTING DECISION RULES
Appendix L—Analysis and Reporting Decision Rules 1 2015–16 MeCAS Technical Report Part II


1
Analysis and Reporting Decision Rules Maine Alternate Assessment (PAAP) Spring 15-16 Administration
This document details rules for analysis and reporting. The final student level data set used for analysis and reporting is described in the “Data Processing Specifications.” This document is considered a draft until the Maine State Department of Education (DOE) signs off. If there are rules that need to be added or modified after said sign-off, DOE sign off will be obtained for each rule. Details of these additions and modifications will be in the Addendum section.
I. General Information
A. Tests administered:
Subject Grades Test Type
Science 05, 08, 11 (Third Year HS) Portfolio
B. Reports Produced: (Not Applicable 15-16)
1. Individual Student Report (ISR)
- Parent Copy (Print)
- School Copy (Web)
2. Student PAAP Results Label
3. School Analysis report (Roster) for Science
4. Summary Report
- School
- SAU
- State
C. Files Produced:
1. School Level Data (Summary)
2. State Student Overall Data
3. State Student Entry Scores
4. State Level of Complexity Data
5. LCI Data (Not Applicable in 15-16)

2
D. School Type:
SchType Source: ICORE SubTypeID
Description
‘PUB’ 1 Public
‘PSP’ 19
Public Special Purpose
‘PSE’ 15 Public Special Ed
‘BIG’ 6 Private with 60% or more Publicly Funded (Big 11)
‘PSN’ 23 Special Purpose Private
‘CHA’ 11 Public Charter
School Type impact on Data Analysis and Reporting
Level Impact on Analysis Impact on Reporting
Student n/a Report students based on discode and schcode provided in student demographic file.
School Do not exclude any students based on school type using testing school code for aggregations
Generate a report for each school with at least one student enrolled using the tested school aggregate denominator.
SAU data will be blank for BIG and PSN schools.
Always print tested year state data.
SAU For BIG and PSN schools, aggregate using the sending SAU.
If BIG or PSN student does not have a sending SAU, do not include in aggregations.
Generate a report for each SAU with at least one student enrolled using the tested SAU aggregate denominator.
Always report tested year state data.
State Include all students. Always report testing year state data.
E. Stustatus:
StuStatus Description
1 Home Schooled
2 Privately Funded
3 Exchange Student
4 Excluded State
0 Publicly Funded

3
StuStatus impact on Data Analysis and Reporting
Level Impact on Analysis Impact on Reporting
Student n/a
School and SAU data will be blank for students with a StuStatus value of 1.
Always print tested year state data.
For StuStatus values of 1 School name is ‘Home Schooled’ and SAU name is the name of the student’s reported SAU.
School Exclude all students with a StuStatus value of 1 or 2.
n/a
SAU Exclude all students with a StuStatus value of 1 or 2.
n/a
State Exclude all students with a StuStatus value of 1, 2,, 4.
n/a.
F. Other Information
1. Public School districts are districts containing at least one school with a school sub-type-id of 1, 11, 15, or 19.
2. Home Schooled Students(Stustatus = ‘1’)
- Home schooled students only appear on Parent Letter reports.
3. Student Demographic File Linking
- All alternately assessed students link to the Student Demographic File.
- All demographic data of record are pulled from the Student Demographic File for alternately assessed students.
4. Non-Maine Residents (Stustatus = ‘4’)
- Students are included in school and SAU aggregations, but not state aggregations.
- Students will receive an ISR and will be listed on the school analysis report.
5. Third Year HS
- The Student Demographic File Grade is the student’s grade used in reporting. Students identified as Third Year HS (Active = ‘2’) will be treated as Third Year HS regardless of grade.
- Third Year HS students are stored internally as Grade 11.
6. Only students in 5, 8, and Third Year HS are expected to test Science in 15-16. Data processing will provide discrepancy reports for all students submitting a Science PAAP that are not identified as grade 5, 8, or Third Year HS for resolution.

4
7. Only students in 5, 8, and Third Year HS after resolution/clean up with a submitted PAAP are included in the Maine Alt reporting. Students that do not submit a PAAP are reported through Maine Science.
II. Student Participation / Exclusions
A. Test Attempt Rules
1. Attempt PAAP: Participated in PAAP
- All students included in the Data Processing views for PAAP reporting have met the requirements for participation in PAAP Science for 14-15. See the Maine Alt Data Processing Specifications and the MaineAlt15-16ScoreofRecord.pdf for details.
B. Not Tested Reason
1. There are no Not Tested reasons for PAAP Science in 15-16. Not Tested students are handled through Maine Science reporting.
C. Student Participation Status
1. Tested
- Incomplete Portfolio: a required entry was submitted, but at least one required entry was not submitted
- Complete Portfolio: all required entries were submitted
D. Student Participation Summary
Participation Status Part. Flag Raw Score Ach. Level Parent Letter Report
Tested: Alternate Assessment
C

5
III. Calculations
A. Raw scores
Refer to MaineAlt1516ScoreofRecord.pdf
B. Scaling by content area
Achievement levels are assigned using a look-up table based on the student’s raw score and grade.
IV. Report Specific Rules (Not Applicable 15-16)
A. Individual Student Report
1. All students included in the Data Processing view for PAAP reporting receive a Science PAAP Student Report.
2. Print the student’s Student Demographic File school information (DisCode, SchCode)
3. Print the student’s Student Demographic File Grade (StuGrade)
4. Do not print (display) the raw score range text (bar) for students receiving either the highest or the lowest possible score.
5. If an entry was not submitted print “AGLE/Indicator was not submitted “as the AGLE/Indicator. Level of Accuracy, Assistance and Complexity will be left blank.
6. If an entry did not meet the requirements OR all tasks were unscorable, print “Entry submitted did not meet PAAP requirements.” for Level of Accuracy (Assistance).
7. For students identified as testing incomplete in Science print ‘†’ next to the Achievement level.
8. Web pdfs are produced by grade and school; MP naming convention: MaineAltYYYYStudentSchoolGG_[8-digit school code].pdf,
where GG = 05, 08, or 11 (Third Year High School).
B. Student PAAP Results Label
1. All students included in the Data Processing view for PAAP reporting, except Home Schooled Students, receive a Science PAAP Results Label.
C. School Analysis Report (Roster) by content area and grade
1. All students included in the Data Processing view for PAAP reporting are included on their Student Demographic File school roster.
2. “Third Year HS” students are listed on the same grade level roster. For Grade in header print “Third Year High School”. The “Grade” column after student name indicates the individual Student Demographic file grade (StuGrade).

6
3. Students identified as testing incomplete place an ‘*’ next to the achievement level
4. For entries that did not meet requirements, print:
- The AGLE/Indicator, Level of Complexity, Comments code(s),
- ‘–' (en-dash) for Level of Accuracy and Level of Assistance and
- ‘0’ for Entry Score
5. For entries where all tasks are unscorable print:
- The AGLE/Indicator, Level of Complexity, Comments code(s),
- ‘U‘ for Level of Accuracy and Level of Assistance and
- ‘0’ for Entry Score
6. For entries not submitted: AGLE/Indicator, Level of Complexity, Level of Accuracy and Level of Assistance and Entry Score will be left blank. Comments code(s) will be printed.
7. Web pdfs are produced by grade and school; MP naming convention: MaineAltYYYYRosterStudentGG_[8-digit school code].pdf. where GG = 05, 08, or 11 (Third Year High School).
D. Summary Report
1. All “Third Year HS” students are aggregated together. Print Grade as “Third Year High School”.
2. If at least one student exists in a subcategory, but the percentage rounds to 0 as the nearest whole number, it is reported as ‘<1’, not 0.
3. Web pdfs are produced by grade and school, district, and state, MP naming convention: MaineAltYYYYSummaryReportGG_[code].pdf where GG = 05, 08 or 11 (Third Year High School), and Code = 8-digit school code, 4-digit discode, or “ME”.
V. Data File Rules
A. School Level Data File (Summary)
1. State level CSV file containing the number of students tested, and the number and percent of tested students at each achievement level; aggregated to the school level.
2. The file only includes ‘PUB’, ’CHA’, ’PSP’, ‘BIG’ and ‘PSE’ schools.
B. State Student Overall Data
1. State level CSV file containing student demographic data and performance information.

7
2. Only students from ‘PUB’, ‘CHA’, ‘PSP’, and ‘PSE’ schools are included, or if they have a sending SAU.
3. Non-Maine (StuStatus = 4) and Home school (StuStatus = 1) students are excluded.
C. District Student Overall Data (Not Applicable 15-16)
1. District level CSV file containing student demographic data and performance information for each public school district, delivered via the web release.
2. Students from ‘BIG’ and ‘PSN’ schools are included in their sending SAU’s data file, if they have a sending SAU.
3. Home school (StuStatus = 1) students are excluded.
4. 1 file including student names is produced per grade.
D. School Student Overall Data (Not Applicable 15-16)
1. School level CSV file containing student demographic data and performance information for each school, delivered via the Web release.
2. Home school (StuStatus = 1) students are excluded.
3. 1 file including student names is produced per grade.
E. State Student Entry Scores
1. A state level CSV file will contain student entry level scores.
2. Only students from ‘PUB’, ‘CHA’, ‘PSP’, and ‘PSE’ schools are included, or if they have a sending SAU.
3. Non-Maine (StuStatus = 4) and Home school (StuStatus = 1) students are excluded.
F. State Level of Complexity Data
1. An Excel file will contain the number of entries submitted at each level of complexity aggregated by grade and content area.
2. Only Students who submitted a content area PAAP are included.
G. LCI Data – (Not Applicable in 15-16).
1. LCI Student Data
- A CSV will contain student demographic and LCI questionnaire responses
2. LCI Not Submitted Data
3. LCI FreqDis Data
- A CSV will contain, for each LCI question, the number and percent of each response endorsed at the school, district and

8
state level. Aggregation rules as described in section I are applied
4. LCI Percent Data
- A CSV will contain the number and percent of students who did and did not submit LCI questionnaire at the district level.
VI. Data File Table (YYYY indicates year)
File Delivery Layout Naming Convention
School Level Data File (Summary)
State MaineAltYYYYSchoolSummaryLayout.xls MaineAltYYYYSchoolSummaryData.csv
State Student Overall Data
State MaineAltYYYYStateStudentScoredDataLayout.xls (Worksheet: “Overall”)
MaineAltYYYYStateStudentScoredData.csv
District Student Overall Data (not applicable 15-16)
Web MaineAltYYYYStudentResultsLayout.xls MaineAltYYYYDistrictSlice_[SAU Code].CSV
School Student Overall Data (not applicable 15-16)
Web MaineAltYYYYStudentResultsLayout.xls MaineAltYYYYSchoolSlice_[School code].CSV
State Student Entry Scores
State MaineAltYYYYStateStudentScoredDataLayout.xls (Worksheet: “EntryScores”)
MaineAltYYYYStateStudentEntryScoresData.csv
State Level of Complexity Data
State MaineAltYYYYLOCLayout.xls MaineAltYYYYLOCdist.xls
LCI Data (Not Applicable in 15-16)
State MaineAltYYYYLCILayout.xls
MaineAltYYYYFreqDist.csv MaineAltYYYYNotSubmitted.csv MaineAltYYYYStudentData.csv MaineAltYYYYPercent.csv MaineAltYYYYLCILayout.xls
VII. Shipping Information – Printed Reports (Not Applicable 15-16)
A. School Products(ReportFor=1)
1. Parent reports will be individually packed by school.
Report Description Grade Report Type Content Code Subject Quantity
Parent Report – School Copy 00 01 00 Science Variable
Student Results Labels – School copy
00 07 00 Science Variable
Addenda: 6/15/2015 (Not Applicable 15-16)

9
The Summary Report (school, district, state) is confidential. Do not suppress any data due to minimum n requirements moving forward. Addenda: 6/22/2016: Do not exclude students from student level data files based on stustatus or school type