personal office preferences › dfmnet_files › artikler › 668_office... · 2019-08-29 ·...
TRANSCRIPT

Personal Office Preferences
Full Research Report v1.1, August 2019 1
Personal Office Preferences:
Full Report and Detailed Analysis
Sponsored by:
Herman Miller and Workplace Trends
Produced by:
Nigel Oseland PhD CPsychol, Workplace Unlimited
August 2019 v1.1

Personal Office Preferences
Full Research Report v1.1, August 2019 2
Contents
Summary 3
1.0 Introduction 4
1.1 Background 4
1.2 Objectives 5
2.0 Approach 5
2.1 Respondents 5
2.2 Rating scales 5
2.3 Personality types 5
2.4 Analysis 6
3.0 Results 6
3.1 Office preferences and primary workplace 6
3.2 Office preferences and personality 8
3.3 Most important workplace conditions 8
3.4 Office preferences and workplace conditions 10
3.5 Office preferences and socio-demographics 11
3.6 Factor analysis of workplace conditions 13
4.0 Implications for research and design 14
5.0 Conclusion 15
6.0 References 16
Personal Office Preferences
Full Research Report v1.1, August 2019 3
Summary
The debate on open plan versus enclosed offices rages on, but workplace design is not a such a
simple dichotomy. Furthermore, office occupants clearly have different workplace preferences
depending on factors like personality, personalisation, flexibility and sense of belonging etc.
Herman Miller and Workplace Trends sponsored Workplace Unlimited to conduct a short on-line
survey to help unravel some of the more personal factors underlying preferences in the modern
office that are often forgotten or ignored.
Approximately 700 survey responses were received, equivalent to a response rate of
approximately 15%, which whilst appearing low is nevertheless good for an unsolicited survey
of this nature. Approximately two-thirds (68%) of the respondents are based in the UK. One-
half consider their role as management and a further one-quarter as technical, including design.
The participants were asked to rate their preference for a number of office solutions.
Landscaped offices and agile working were more highly preferred than open plan and,
surprisingly, private offices. Home-working was rated fairly high whereas hot-desking is rated
low as a preferred option. Open plan and private offices are not the only design options
available, and least preferred. Landscaped offices and agile working, which are both types of
“open plan”, appear to be more agreeable options.
When considering the current primary workplace of the respondents, those in private offices
prefer private offices, whereas those in open plan prefer open plan. It therefore appears that
those who have not actually experienced open plan are more opposed to it, supporting the often
observed “fear of the unknown”. Similarly, home-workers prefer home-working. Furthermore,
those with allocated desks have a higher preference for private offices and least prefer home-
working, hot-desking and agile working compared to those who already hot-desk.
Preferences were found to differ by personality. Introverts are more in favour of private offices
and least prefer open plan, agile working and hot-desking compared to extroverts.
Interestingly, there is little difference between introverts and extroverts in the preference for
home-working; both groups rate home-working relatively high. There were fewer differences for
those more neurotic and less emotionally stable.
Preferences were found to differ by some socio-demographic factors. Those in the UK rated
open plan and landscaped offices higher than elsewhere. In contrast, Eastern Europeans and
North Americans rated open plan offices low and private offices the highest. No significant
differences in office preferences were found for tenure or age group. So, previously reported
differences in expectations of millennials etc are not supported. However, researchers have a
preference for private offices, which could influence their studies of open plan and resulting
recommendations on office design.
The participants were asked to rate how important they consider 26 different workplace
conditions. For example, flexibility over work hours and place of work, having a social
workplace, being able to personalise the workspace and not being overheard or overlooked by
colleagues. For all the respondents, the most important workplace conditions relate to flexibility.
For those currently accommodated in private offices, concentration and windows are also
considered important. Those who rate private offices as their preferred workplace, consider
personal desk conditions, like personalisation and privacy, to be most important. In contrast,
such personal conditions are negatively correlated with those who have a higher preference for
agile working and desk-sharing. For those who prefer landscaped offices and home working,
flexibility and connectedness are more important. For those who prefer open plan,
connectedness is important and for home-workers flexibility is key. These observed conditions
could be used as motivators in workplace change management programmes.
Personal Office Preferences
Full Research Report v1.1, August 2019 4
1.0 Introduction
1.1 Background
The assault on open plan offices rages on in the press e.g. Guardian (2018), Inc (2018) and
Entrepreneur (2019). Such articles are fuelled by a number of research studies which
supposedly demonstrates that open plan is results in poor interaction, performance and health.
Studies such as that by Danish researcher Pejtersen et al (2011) who found that the average
reported sickness absence of 2,403 Danish workers was higher in open plan working
environments (8.1 days) compared to private single offices (4.9 days). Or that of Australian
researchers Kim and de Dear (2013) who reanalysed U.S. survey of 42,764 respondents and
concluded “our results categorically contradict the industry-accepted wisdom that open-plan
layout enhances communication between colleagues… This study showed that occupants’
satisfaction on the interaction issue was actually higher for occupants of private offices”. More
recently, after studying an organisation who moved to open plan, Bernstein & Turban (2018)
report that “Contrary to common belief, the volume of face-to-face interaction decreased
significantly (approx. 70%) … open architecture appeared to trigger a natural human response
to socially withdraw from office mates”.
However, as pointed out by Oseland (2013, 2018) these studies have several flaws. For
example, the Danish study did not control for variables such as autonomy, job role and seniority
when comparing those in private offices with those in open plan. They also report that noise,
viruses, ventilation, privacy were the key factors, which may be related to some open plan
environments but can occur in other workplaces too. In the Australian study, only 6.7% of the
respondents work in “true open plan” whereas 60% reside in cubicles. The study actually
showed that overall satisfaction, interaction and sound privacy was better in in open plan than
cubicles. They also found that the “amount of space” explained the variation in responses,
indicating that density is a confounding variable when exploring open plan offices. Bernstein &
Turban had their participants wear a sociometric badge which included a microphone, infrared
sensor, accelerometer and location tracker, which most likely affected the behaviour of the
participants and their colleagues. Furthermore, the interaction prior to the move was 5.8 hours
per day prior, or circa 73% of the working day, and post-move was reduced to 1.7 hours per
day, or approximately 22% which seems more practical.
In addition to the above oversights, the most significant common to all studies is that the “open
plan” environment is not fully described. Workplace design is not a simple dichotomy of private
offices versus open plan, there are a range of offices types and open plan designs, some of
which are poor and some of which are very good. In particular, open plan environments vary by
density, with some having a high number of desks in the same space with few facilities, and by
the level of partitions, with some having none at all and others being broken up occasionally by
screens, planting, storage, quiet pods and meeting spaces.
In contrast to the above studies, case studies presented at conferences and occupant feedback
surveys, like the Leesman Index (Leesman, 2019), often highlight the benefits of good open
plan workplaces. These are usually agile or landscaped offices specifically designed for the
occupants with an accompanying change management process. Mixson (2019) highlights how
an open plan office layout can improve collaboration and spark creative thinking as well as
reduce occupancy costs. However, she explains to achieve this the vision needs to be fully
communicated, the culture aligned with, acoustics are considered and a range of spaces
provided. Brem (2019) points out that it is not so much the space but how open plan offices are
managed and used that causes problems.
Nevertheless, the authors personal experience is that whilst most occupants are satisfied with
open plan, some simply do not cope well with it, they object to it at several levels and fear
moving into it. The reasons and rationale for their opinion are not always apparent.

Personal Office Preferences
Full Research Report v1.1, August 2019 5
1.1 Objective
A wide range of modern workplace design solutions are now available such as the landscaped
office and activity-based working. Furthermore, office occupants clearly have different
workplace preferences. The workplace industry needs to understand what drives these
individual preferences. Is it factors like personality, personalisation, flexibility, sense of
belonging or familiarity that affect where people prefer to work?
Herman Miller and Workplace Trends sponsored Workplace Unlimited to conduct a short on-line
survey to help unravel some of the more personal factors underlying preferences in the modern
office. Such factors are often ignored or forgotten in design, research and regular surveys.
2.0 Approach
2.1 Respondents
Invitations to participate in the survey were emailed to 4,900 Herman Miller and Workplace
Trends contacts (possibly with some overlap), in addition the survey was highlighted on the
Workplace Trends social media groups. Some 700 survey responses were received, equivalent
to a response rate of approximately 15%, which whilst appearing low is nevertheless considered
good for an unsolicited survey of this nature.
Approximately two-thirds (67.6%) of the respondents are based in the UK and Ireland with a
further 9.9% from North America, 5.8% from Central/Southern Europe, 5.7% from Northern
Europe and 3.4% based in Eastern Europe.
One-half (49.5%) consider their role as management and a further one-quarter (25.4%) as
technical. The respondents with a technical role included designers, engineers and consultants
in the workplace industry. A further, 14% worked in business, 2.9% in sales and 2.7% in
admin. The respondents also included a small (4.5%) group of researchers.
The sample consisted of a range of ages. The majority (60.9%) were born 1961-80 (Generation
X), but 10.4% were born 1945-60 (Baby Boomers) and 26.0% were born 1981-95 (Millennials).
Tenure, the time with the organisation also varied: 15% have worked <1 year, 25.9% 1-3
years, 31.3% 4-10 years and 27.1% >10 years.
2.2 Rating scales
Various subjective rating scales were used in the survey. For example, participants rated their
preference for various office designs and practices on 7-point semantic differential scales
labelled “not at all preferred” (1) to “very much preferred” (7). The participants were also asked
to rate how important they consider 26 different workplace conditions on a 5-point Likert scale
labelled: “disagree strongly”(1), “disagree a little” (2), “neither agree nor disagree” (3), “agree
a little” (4), “agree strongly” (5).
2.3 Personality types
The respondents completed part of the Big Five Personality Inventory (John, Naumann & Soto,
2008) specifically the Extroversion and Neuroticism scales. Extroverts tend to be more social
animals, thrill-seekers and risk-takers who speak off-the-cuff whereas introverts prefer the
quieter life, are happier spending time on their own, and tend to mull things over and think
before speaking. Neuroticism, the opposite to emotional instability, refers to the tendency to
experience and dwell on negative emotions, and to experience anxiety and apprehension.
The sample was grouped into those scoring higher on introversion and higher on extroversion,
with the remainder classed as ambiverts. The authors full database (Oseland & Paige, 2017)
was used to determine the upper levels of introversion and extroversion based on one standard

Personal Office Preferences
Full Research Report v1.1, August 2019 6
deviation from the mean scores. Similarly, the respondents were grouped into those rated
higher on neuroticism and emotional stability.
2.4 Analysis
The sample size is sufficient to provide statistically robust and significant results. The data was
analysed using SPSS and only the statistically significant results are presented here. The size of
the effect, sometimes referred to as practical significance, was also computed using η2 (η2) for
tests of differences. An η2 of 0.01 is considered a small effect, 0.06 a medium effect and 0.14 a
large effect. For correlations, r2 was used as an indicator of the size of effect, where 0.02 is
considered small, 0.13 medium and 0.26 large. The size of effect was found to be medium in
many statistical tests, and large in a few tests, indicating that the research findings are of
practical relevance.
3.0 Results
3.1 Office preferences and primary workplace
Six office designs were rated by the participants on a 7-point semantic differential scale: open
plan, private office, landscaped office, agile working, hot-desking and home-working. Note that
those in single offices and paired offices were grouped into “private offices”, similarly those in
open plan with 3-12 or 13-30 desks were considered small (3-30 person) open plan, and those
with 31-90 or 90+ desks were classed as large (31+ person) open plan. Furthermore, the
“landscaped office” option was described as “hybrid office (open plan but broken up with semi-
partitions, pods, meeting rooms etc), “agile working” included “agile/flexible/smart/activity-
based working” and “hot-desking” was also referred to as “desk-sharing”.
Figure 1 shows the mean ratings with the standard deviation of the six office designs. The chart
shows that the order of preferences is: landscaped office, agile working, home-working, open
plan, desk-sharing (hot-desking) and private offices. Paired t-tests confirmed that the
differences between the mean ratings of each office type are all statistically significant
(p<0.001), except for the ratings between landscaped office and agile working.
Figure 1 Mean ratings (and standard deviation) of office designs and practices
The mean office preferences were compared with the current primary workspace of the
respondents. Figure 2 shows that those currently in single or paired offices (blue) have a
significantly higher preference for private offices compared to those already located in open
plan (orange and red) or other office types (df=4,576, F=13.49, p<0.001, η2=0.086). In
contrast, those already in single or paired offices have a significantly higher preference for
private offices compared to those in small or large open plan (df=4,576, F=7.64, p<0.001,

Personal Office Preferences
Full Research Report v1.1, August 2019 7
η2=0.050). So, the respondents prefer what they know and have experienced. Furthermore,
those in single or paired offices have the lowest preference for agile working (df=4,576,
F=9.79, p<0.01, η2=0.028) and hot-desking (df=4,576, F=9.43, p<0.001, η2=0.061).
Figure 2 Mean rating of office preferences by current primary workspace
As expected, those who work from home have the highest preference for home-working
(df=4,576, F=9.09, p<0.001, η2=0.059) and those who mostly work “elsewhere”, in and
outside the office, rate agile working and hot-desking higher.
There is little difference between the preferences of those in small or large open plan offices.
Whilst there are statistically significant differences for the preference of landscaped offices
between the current primary workspace, it is less marked than for the other office preferences
(df=4,576, F=8.29, p<0.001, η2=0.054) and is rated high by all groups.
Percentages are often easier to follow than mean ratings. Table 1 shows the percentage of
respondents who rated each office type as 5, 6, or 7 on the preference scale. The percentages
are broken down by the current primary workspace; note a combination of the preferences in
both small and large open plan is also included in the table.
Table 1 Percentage of high office preference by primary workspace
As with the mean ratings shown in Figure 1, the table highlights that a higher percentage of
respondents in private (single or paired) offices prefer private offices, and more of those already
in open plan have a preference for open plan. Whilst private offices may be more preferred than
open plan or vice versa, depending on the current workspace, the proportion rating it a high
preference (5-7 on the response scale) is still less than 50%. In contrast, the table shows high
preferences for landscaped offices (>65%) and agile working environments (>72%); and these
office solutions are also rated highly by those in private offices. There appears to be equal
preference for home-working across the different current workspaces – highly preferred by
around two-thirds of the respondents.
Current primary office
Open
plan
Private
office
Landscaped
office
Agile
working
Hot-
desking
Home-
working
Single or paired office 16.3 45.9 65.6 72.2 21.4 59.1
Small (3-30 person) open plan 41.6 13.4 87.2 79.9 30.6 60.3
Large (31+ person) open plan 43.5 12.6 91.8 79.7 38.2 66.1
All (3+ person) open plan 42.5 12.9 89.4 79.8 34.3 63.2
Home-worker 26.4 18.1 76.3 83.4 45.8 68.8
Elsewhere (in and out of office) 43.8 16.5 75.1 93.8 68.8 66.7

Personal Office Preferences
Full Research Report v1.1, August 2019 8
Nearly two-thirds (61.3%) of the sample have allocated desks with the remainder hot-desking.
Those who hot-desk have a higher preference for agile working (df=2,579, F=20.02, p<0.001,
η2=0.065) and hot-desking (df=2,579, F=56.54, p<0.001, η2=0.163) compared to those with
allocated desks. So, again those who have experienced non-traditional ways of working rate it
higher. In contrast, compared to the hot-deskers those with allocated desks have a higher
preference for private offices (df=2,579, F=14.49, p<0.001, η2=0.048). There are no significant
differences for open plan, landscaped offices or home-working.
3.2 Office preferences and personality
Figure 3 shows a comparison of those scoring high on Extroversion (blue) compared with those
scoring high on Introversion (red); the ambivert mean ratings have been omitted on the chart.
The introverts have a higher preference of private offices compared to extroverts (df=2,573,
F=4.31, p<0.05, η2=0.015). In contrast, introverts rate open plan (df=2,573, F=6.88,
p=0.001, η2=0.023), agile working (df=2,573, F=6.50, p<0.01, η2=0.022) and hot-desking
lower (df=2,573, F=7.39, p=0.001, η2=0.025). Interestingly, there is little difference in the
preference for home-working and landscaped office between introverts and extroverts.
Figure 3 Mean rating of office preferences by extroversion
In terms of percentages of preferences rated 5 and above, a much higher proportion of
extroverts to introverts preferred open plan (42% and 22% respectively), hot desks (46%
versus 25%) and to some extent agile working (86% versus 72%). In contrast, private offices
are preferred by a higher proportion of introverts (22%) to extroverts (12%).
Unexpectedly, there were few differences between office preferences for those more neurotic
(i.e. anxious, apprehensive) compared to the emotionally stable. The only statistically
significant difference found is that the more neurotic respondents have a much lower preference
for hot-desking (df=2,571, F=4.21, p<0.05, η2=0.015).
3.3 Most important workplace conditions
Various workplace conditions ranging from personalising desks to not feeling isolated, were
rated by the participants on a 5-point Likert scale. Table 1 shows the highest and lowest rated
conditions (mean rating and ranking) for all respondents. Cohen’s D was used to test the size of
effect and there is an intermediate effect for mean ratings with a 0.5 or more difference.
The highest rated workplace conditions (shown in green) all relate to flexibility, closely followed
by conducting focussed work. The lowest rated conditions (in red) are technology, status and
regular routine/hours, closely followed by no one else sitting at the respondent’s desk and

Personal Office Preferences
Full Research Report v1.1, August 2019 9
sitting near a manager. Conditions related to noise and distraction are ranked mid-table, as is
personalisation and being near colleagues.
Table 1 Mean rating and ranking of office conditions
Table 2 Mean rating of the top and lowest rankings of office conditions by primary workspace
It is imporant to me that … Rank
Mean
Rating
... I can choose to work from home occasionally 1 4.5
... I have flexibility over my work hours 2 4.4
... I have the flexibility to choose where I work 3 4.2
... I can conduct focused work requiring concentration 4 4.2
... my role involves lots of interaction 5 4.1
... my workplace is sociable 6 4.1
... I do not spend every day in the office 7 4.1
... I am near a window 8 4.0
... my role is not purely desk-based work 9 4.0
... my workplace gives me a sense of belonging 10 4.0
... I do not feel isolated during work hours 11 3.9
... my colleagues are sat nearby 12 3.8
... I do not have to commute at peak hours 13 3.6
... I am not distracted by office noise 14 3.3
... I can sit at the same desk each day 15 3.2
… I like the familiarity/routine of sitting at the same desk 16 3.1
... I can personalise my desk space 17 3.0
... I am not overlooked/overheard by my colleagues 18 3.0
... I am not interrupted by my colleagues 19 3.0
... I have my own private workspace 20 2.9
... I can leave my papers out on the desk (overnight) 21 2.8
... my manager is sat nearby 22 2.6
... no one sits at my desk 23 2.5
... my work involves a regular routine and fixed hours 24 2.4
... my workspace reflects my status 25 2.3
… I am dependent on the technology fixed to my desk 26 2.2
It is imporant to me that …All
Participants
Single/
Paired
Office
Small
3-30 Person
Office
Large
31+ Person
Office
Home
Worker
Elsewhere
Worker
... I have flexibility over my work hours 4.4 (2) 4.2 (2) 4.4 (2) 4.3 (2) 4.7 (3) 4.5 (1)
... I can choose to work from home occasionally 4.5 (1) 4.0 4.5 (1) 4.6 (1) 4.8 (2) 4.4
... I have the flexibility to choose where I work 4.2 (3) 4.0 4.1 4.2 (3) 4.8 (1) 4.5 (1)
... I can conduct focused work requiring concentration 4.2 4.3 (1) 4.2 4.1 4.5 4.5 (3)
... I am near a window 4.0 4.1 (3) 4.1 4.0 4.0 3.8
... my workplace is sociable 4.1 3.9 4.3 (3) 4.2 3.8 4.0
... my manager is sat nearby 2.6 2.3 (24) 2.8 2.6 2.1 2.3
... no one sits at my desk 2.5 3.3 2.7 2.4(24) 2.2 1.6 (26)
... my work involves a regular routine and fixed hours 2.4 (24) 2.6 (26) 2.6(24) 2.5 1.8 (25) 2.0
... my workspace reflects my status 2.3 (25) 2.9 2.3 (25) 2.1 (26) 1.9 (24) 1.8 (26)
… I am dependent on the technology fixed to my desk 2.3 (26) 2.5 (25) 2.3 (26) 2.3 (25) 1.8 (26) 1.8 (25)

Personal Office Preferences
Full Research Report v1.1, August 2019 10
Table 2 shows the three highest (green) and lowest (red) rated workplace conditions by the
current primary workspace of the respondents. Flexibility is considered key for those in most
primary workspaces, but less so for those in private/paired offices. Being able to conduct
focussed work and sitting near a window is more important for those in private/paired offices.
Status, technology and regular routine are considered the least important regardless of the
respondents’ primary workspace.
3.4 Office preferences and workplace conditions
Table 3 overleaf shows the correlations between the most important workplace conditions and
the preferred office spaces. The stronger correlations (positive and negative) and largest size
effect (shown in blue and green) are between the workplace conditions and preferences for
private offices, agile working and hot-desking.
(* = p<0.05, ** = p<0.01, blue = large effect, green = medium effect, orange = small effect)
Table 3 Correlations between office preferences and workplace conditions
Based on the individual correlations, the negative associations (or barriers to overcome) with
agile working and hot-desking are not having a regular allocated desk, not being able to
personalise it and not being able to leave papers out overnight. In contrast, flexibility,
interaction and sociability are the positive associations.
A Stepwise Regression Analysis was conducted to see which five combined workplace conditions
best correlate with the office preferences. Table 4 shows the top five conditions that entered the
regression equation and the resulting variance (an indicator of the strength of the relationship).
The explained variance (r2) is highest for hot-desking (df=5,606, F=82.58, p<0.001, r2=0.405),
private offices (df=5,606, F=48.34, p<0.001, r2=0.298) and agile working (df=5,606, F=47.49,
It is imporant to me that …
Open
plan
Private
office
Landscaped
office
Agile
working
Hot-
desking
Home-
working
... I can personalise my desk space -0.107** 0.341** -0.103** -0.280** -0.458** -0.005
... my workplace gives me a sense of belonging 0.005 0.002 0.120** 0.081* 0.009 -0.073
... I have the flexibility to choose where I work 0.053 -0.194** 0.136** 0.407** 0.383** 0.192**
... I have flexibility over my work hours -0.012 -0.091* 0.139** 0.170** 0.158** 0.180**
... I can choose to work from home occasionally -0.001 -0.098* 0.162** 0.268** 0.225** 0.253**
... I can sit at the same desk each day -0.038 0.343** -0.043 -0.352** -0.502** -0.089*
... my colleagues are sat nearby 0.116** -0.063 0.122** 0.018 -0.041 -0.224**
... I have my own private workspace -0.145** 0.462** -0.138** -0.311** -0.414** 0.103**
... my workspace reflects my status -0.032 0.223** -0.030 -0.190** -0.235** -0.038
... I am not overlooked/overheard by my colleagues -0.157** 0.241** -0.100* -0.090* -0.115** 0.055
... I am not distracted by office noise -0.031 0.085* 0.013 -0.002 -0.055 0.049
... I am not interrupted by my colleagues -0.133** 0.188** -0.012 -0.025 -0.091* 0.090*
... I can leave my papers out on the desk (overnight) -0.064 0.255** -0.097* -0.298** -0.410** -0.052
... I do not have to commute at peak hours -0.090* -0.021 -0.067 0.127** 0.097* 0.169**
... my manager is sat nearby 0.103** -0.006 -0.068 -0.060 -0.093* -0.166**
... no one sits at my desk -0.115** 0.344** -0.127** -0.311** -0.493** -0.042
... I can conduct focused work requiring concentration -0.060 0.037 0.032 0.077 0.065 0.043
... I am near a window -0.069 0.031 0.028 0.037 -0.111** -0.017
... my work involves a regular routine and fixed hours 0.075 0.112** 0.016 -0.214** -0.264** -0.112**
... my role is not purely desk-based work 0.004 -0.096* 0.122** 0.156** 0.133** 0.028
... my role involves lots of interaction 0.277** -0.243** 0.212** 0.229** 0.187** -0.129**
... my workplace is sociable 0.178** -0.166** 0.216** 0.222** 0.157** -0.072
... I do not spend every day in the office 0.014 -0.120** 0.114** 0.270** 0.190** 0.234**
... I do not feel isolated during work hours 0.153** -0.165** 0.188** 0.106** 0.121** -0.084*
… I am dependent on the technology fixed to my desk -0.034 0.202** -0.041 -0.263** -0.214** -0.083*
… I like the familiarity/routine of sitting at the same -0.069 0.310** -0.018 -0.340** -0.535** -0.067

Personal Office Preferences
Full Research Report v1.1, August 2019 11
p<0.001, r2=0.282). In contrast, the variance was lower for landscaped office (df=5,606,
F=13.18, p<0.001, r2=0.098), open plan (df=5,606, F=14.99, p<0.001, r2=0.110) and home-
working (df=5,606, F=22.17, p<0.001, r2=0.155).
(Order variable entered into regression with: = positive correlation, = negative correlation)
Table 4 Regression analysis of office preferences by workplace conditions
The combined conditions entered in the regression equations inform design decisions and
barriers to change. For example, when implementing hot-desking it is most likely that the
flexibility to choose where to work and having a sociable workplace are positive drivers. Further
analysis revealed being near to managers, technology, occasional home-working and status to
also be drivers. In contrast, sitting at the same desk, personalisation of desks and private
workspace are all preferred requirements to be resolved.
Table 4 also shows that having a private workspace and having a role with interaction are good
predictors of all office preferences (but a mix of positive and negative). This result supports
previous findings that balancing interaction with privacy in open plan offices is a key challenge
to designers.
3.5 Office preferences and socio-demographics
No statistically significant differences in office preferences were found for tenure, the time at
the organisation. The sample was evenly split between those with the organisation less than or
at least five years. Perhaps status and expectations of a private office are less of an issue than
in bygone times.
Furthermore, unexpectedly, no significant differences in office preferences were found for age
group. Previously reported differences in expectations of millennials etc are not supported in
this dataset.
There are, however, statistical differences between mean office preferences for different job
roles. For example, unexpectedly, those in management roles (blue) rate private offices the
lowest (df=7,550, F=8.82, p<0.001, η2=0.101), but rate agile working (df=7,550, F=3.88,
p<0.001, η2=0.047) and hot-desking (df=7,550, F=3.17, p<0.01, η2=0.039) higher than other
job roles, but quite similar to technical staff. Those in research roles (yellow) rate the
preference for private offices the highest but rate open plan offices (df=7,550, F=3.63,
p=0.001, η2=0.044), landscaped offices (df=7,550, F=3.44, p=0.001, η2=0.042) and agile
working the lowest. The percentage of researchers in our sample was small (4.5%) but
nevertheless the results are statistically significant. Therefore, it may be possible that
researcher bias for private offices could influence their studies of open plan environments.
It is imporant to me that …
Open
plan
Private
office
Landscaped
office
Agile
working
Hot-
desking
Home-
working
... I have my own private workspace 3 1 4 2 4 5
... my role involves lots of interaction 1 2 1 3 4
... I can choose to work from home occasionally 2 1
… I like the familiarity/routine of sitting at the same desk 3 4 1
... I have the flexibility to choose where I work 1 3
... I am not overlooked/overheard by my colleagues 2 5 5
... my colleagues are sat nearby 2
... I can personalise my desk space 2
... I do not feel isolated during work hours 4 3
... I do not spend every day in the office 5 3
... my workplace is sociable 5 5
... my manager is sat nearby 4
Explained variance (adjusted r2 x 100%) 11.0% 29.8% 9.8% 28.2% 40.5% 15.5%

Personal Office Preferences
Full Research Report v1.1, August 2019 12
Those in business roles (red) rate home-working the highest. Administrators (green) rate open
plan the highest compared to other roles, but also rate private offices high. In contrast, those in
admin roles rate hot-desking and home-working lower than all other roles.
Figure 4 Mean rating of office preferences by job role
Significant differences in mean office preferences were also found for the country (grouped)
where the respondents mostly work. For example, Figure 5 shows that those in the UK (blue)
rated open plan (df=6,558, F=6.21, p<0.001, η2=0.063) and landscaped offices (df=6,558,
F=4.32, p<0.001, η2=0.044) higher than elsewhere. Unexpectedly, the respondents in
Antipodes and the Far East (orange) rated desk-sharing the lowest (df=6,558, F=2.97, p<0.01,
η2=0.031), possibly due to too mixed grouping. Northern Europeans (yellow) rated private
offices (df=6,558, F=2.81, p<0.05, η2=0.029) the lowest and hot-desking the highest. In
contrast, Eastern Europeans (green) rated open plan and landscaped offices the lowest and
private offices the highest. North Americans also rated their preference for fully open plan
offices as low and rated private offices higher. In our sample, there are little differences in the
preference for home-working across countries.
Figure 5 Mean rating of office preferences by grouped country
In terms of travel time to and from the office, there are some significant differences in
preferences for landscaped office and home-working. Strangely, those with the shortest (<15
minutes) and longest (120+ minutes) return travel times had a higher preference for home-
working (df=5,553, F=3.84, p<0.01, η2=0.034). In contrast, those with the shortest travel time
rated landscaped offices the lowest, whereas those with the longest rated them the highest
(df=5,553, F=5.61, p<0.05, η2=0.023).

Personal Office Preferences
Full Research Report v1.1, August 2019 13
3.6 Factor analysis of workplace conditions
Factor Analysis was used to group, find the most related, the workplace conditions. Table 5
shows that the Factor Analysis (actually a Principal Component Analysis with Varimax Rotation)
of all 26 conditions created four clear factors: Desk (I), Flexibility (II), Connected (III) and
Distraction (IV).
Table 5 Factor analysis of workplace conditions
The first two factors are personal; Factor I relates to the desk and personal space and Factor II
relates to flexibility and personal choice. The latter two factors are more inked to the group
experience: Factor III relates to how connected the respondents are to their colleagues and
workplace and Factor IV relates to distraction and interruption from colleagues.
The factor weighting of each workplace condition (shown in the table) were used to calculate
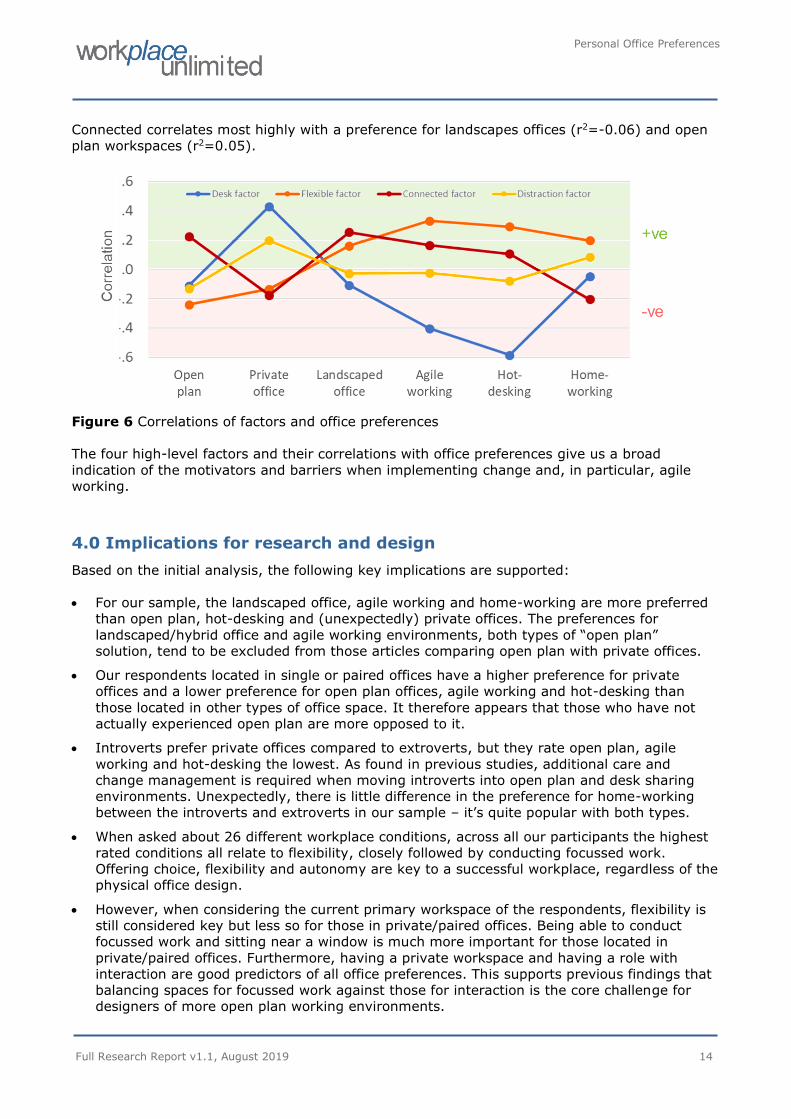
four indices (overall/combined ratings), one for each factor. Figure 6 shows the correlations
(not mean ratings as in the other charts) of the four factors with the ratings of office
preferences. The chart clearly shows that Factor I - Desk (blue) correlates most highly with the
preference for private offices (r2=0.19). However, Factor I is most negatively correlated with
preferences for agile working (r2=-0.16) and hot-desking (r2=-0.34). In contrast, Factor II -
Flexibility correlates highly with agile working (r2=0.11) and hot-desking (r2=0.09). Factor III -
It is imporant to me that …
Factor I
Desk
Factor II
Flexibility
Factor III
Connected
Factor IV
Distraction
... I can sit at the same desk each day 0.786
... no one sits at my desk 0.785
... I can personalise my desk space 0.779
... I can leave my papers out on the desk (overnight) 0.705
… I like the familiarity/routine of sitting at the same desk 0.657
... I have my own private workspace 0.626
... my workspace reflects my status 0.441
… I am dependent on the technology fixed to my desk 0.380
... I am near a window 0.265
... I have flexibility over my work hours 0.636
... I do not spend every day in the office 0.617
... I have the flexibility to choose where I work 0.598
... I can choose to work from home occasionally 0.593
... I do not have to commute at peak hours 0.479
... my work involves a regular routine and fixed hours -0.461
... my role is not purely desk-based work 0.431
... my workplace is sociable 0.641
... my colleagues are sat nearby 0.572
... my role involves lots of interaction 0.524
... I do not feel isolated during work hours 0.507
... my workplace gives me a sense of belonging 0.449
... my manager is sat nearby 0.337
... I am not interrupted by my colleagues 0.664
... I am not distracted by office noise 0.584
... I am not overlooked/overheard by my colleagues 0.534
... I can conduct focused work requiring concentration 0.482
Personal Office Preferences
Full Research Report v1.1, August 2019 14
Connected correlates most highly with a preference for landscapes offices (r2=-0.06) and open
plan workspaces (r2=0.05).
Figure 6 Correlations of factors and office preferences
The four high-level factors and their correlations with office preferences give us a broad
indication of the motivators and barriers when implementing change and, in particular, agile
working.
4.0 Implications for research and design
Based on the initial analysis, the following key implications are supported:
• For our sample, the landscaped office, agile working and home-working are more preferred
than open plan, hot-desking and (unexpectedly) private offices. The preferences for
landscaped/hybrid office and agile working environments, both types of “open plan”
solution, tend to be excluded from those articles comparing open plan with private offices.
• Our respondents located in single or paired offices have a higher preference for private
offices and a lower preference for open plan offices, agile working and hot-desking than
those located in other types of office space. It therefore appears that those who have not
actually experienced open plan are more opposed to it.
• Introverts prefer private offices compared to extroverts, but they rate open plan, agile
working and hot-desking the lowest. As found in previous studies, additional care and
change management is required when moving introverts into open plan and desk sharing
environments. Unexpectedly, there is little difference in the preference for home-working
between the introverts and extroverts in our sample – it’s quite popular with both types.
• When asked about 26 different workplace conditions, across all our participants the highest
rated conditions all relate to flexibility, closely followed by conducting focussed work.
Offering choice, flexibility and autonomy are key to a successful workplace, regardless of the
physical office design.
• However, when considering the current primary workspace of the respondents, flexibility is
still considered key but less so for those in private/paired offices. Being able to conduct
focussed work and sitting near a window is much more important for those located in
private/paired offices. Furthermore, having a private workspace and having a role with
interaction are good predictors of all office preferences. This supports previous findings that
balancing spaces for focussed work against those for interaction is the core challenge for
designers of more open plan working environments.

Personal Office Preferences
Full Research Report v1.1, August 2019 15
• When implementing hot-desking it is most likely that the flexibility to choose where to work,
interaction, a sociable workplace, being near to managers, technology, occasional home-
working and status are positive drivers, In contrast, not being able to sit at the same desk,
non-personalisation of desks, lack of a private workspace, not having a regular/routine and
others sitting at their desk are all barriers that need to be resolved. These drivers and
barriers are for consideration in the change management process.
• Further detailed analysis indicated that personal desk space, flexible working and being
connected at work appear to be bigger concerns than noise and distraction when considering
preferred workplaces. Of course, providing work and workplace flexibility help alleviate noise
and distraction.
• No significant differences in office preferences were found for tenure or age group. So,
previously reported differences in expectations of millennials etc are not supported.
• However, researchers have a preference for private offices, which could influence their
studies of open plan and resulting recommendations on office design.
• Unexpectedly, those in management roles rate private offices the lowest, but rate agile
working and hot-desking higher than other job roles. Administrators rate open plan the
highest, but also rate private offices high. In contrast, they rate hot-desking and home-
working lower than all other roles. These results highlight the difference in requirements for
different job roles.
• Differences for office preferences were also found between countries. For example, those in
the UK rated open plan and landscaped offices higher than elsewhere. In contrast, Eastern
Europeans rated open plan and landscaped offices the lowest and private offices the highest.
North Americans also rated their preference for fully open plan offices as low and rated
private offices higher.
5.0 Conclusion
As found in previous published articles, our respondents had a low preference for “open plan
offices”, however they had a high preference for landscaped office and agile working, the new
variations of open plan. Furthermore, across all our sample the preference for private offices
was rated low. Thus, office design is not a simple dichotomous solution but a range with
appealing variations dependent on personal factors.
The current workplace of our respondents, i.e. what they know, and the workplace conditions
they consider important, affect their office preferences. Furthermore, personal factors such as
their personality, job role and country all affect office preferences. Such variables need to be
considered when designing and moving occupants to new offices. Our identified drivers and
barriers to agile working and hot-desking should also be considered in the change management
process.
Published press and research articles often claim that open plan offices do not work and
negatively affect performance and health. In contrast, case studies and occupant feedback
surveys often highlight the benefits of good open plan workplaces – usually agile or landscaped
offices specifically designed for the occupants with an accompanying change management
process. Our survey highlights the personal factors and different perspectives of office design
(of occupants and researchers) that may explain the differences in research reports.

Personal Office Preferences
Full Research Report v1.1, August 2019 16
6.0 References
Bernstein E. & Turban S> (2018) The impact of the 'open' workspace on human collaboration.
Article 239, Philosophical Transactions of the Royal Society B, Biological Sciences, 73(1753).
Brem A. (2019) The biggest problem with open plan offices is how they are used. Workplace
Insight. https://workplaceinsight.net/the-biggest-problem-with-open-plan-offices-is-how-
they-are-used/.
Burkeman O. (2018) Open-plan office? No, thanks – I’d rather get some work done. The
Guardian, 9 November.
James G. (2018) It's official: Open-plan offices are now the dumbest management fad of all
time. Inc., 16 July.
John O.P., Naumann L.P. & Soto C. J. (2008) Paradigm shift to the integrative big-five trait
taxonomy: History, measurement, and conceptual issues. In Handbook of Personality:
Theory and Research. New York, NY: Guilford, 114–158.
Kim J. & de Dear R. (2013) Workspace satisfaction: The privacy-communication trade-off in
open-plan offices. Journal of Environmental Psychology, 36, 18-26
Leesman (2019) The World’s Best Workplaces 2018: Lessons from the Leaders in Employee
Experience. London: Leesman, March.
Mixson E. (2019) In defence of open plan office design. Workplace Insight.
https://workplaceinsight.net/in-defence-of-open-plan-office-design/.
Oseland N.A. (2013) Will demonising “open plan” lead to its demise? Workplace Unlimited Blog,
19 November. http://workplaceunlimited.blogspot.com/2013/11/will-demonising-open-plan-
lead-to-its.html.
Oseland N.A. (2018) Open plan v private offices déjà vu. Workplace Unlimited Blog, 31 August.
http://workplaceunlimited.blogspot.com/2018/08/open-plan-v-private-offices-deja-vu.html.
Oseland N.A. & Hodsman P. (2017) Psychoacoustics: Resolving noise distractions in the
workplace. Chapter 4 in Ergonomics Design for Healthy and Productive Workplaces.
Abingdon: Taylor & Francis.
Pejtersen J.H., Feveile H., Christensen K.B. & Burr H. (2011) Sickness absence associated with
shared and open-plan offices - A national cross sectional questionnaire survey. Scandinavian
Journal of Work Environmental Health, 37(5), 376-82.
Singh P. (2019) Why Open plan offices are bad news for employees. Entrepreneur, 8 January.

Personal Office Preferences
Full Research Report v1.1, August 2019 17

Personal Office Preferences
Full Research Report v1.1, August 2019 18
Tel: +44 7900 908193
Email: [email protected]
Web: www.workplaceunlimited.com
Twitter: @oseland