personal exposure to fine particulates and polycyclic aromatic hydrocarbons in an office environment
DESCRIPTION
Hongmei Xu, Junji Cao, Meiling Gao, Kin Fai Ho, Xinyi Niu, Teresa L. Coons, Steven Sai Hang Ho, Gehui Wang, Zhuzi Zhao, Zhuzi ZhaoTRANSCRIPT

- 33 -
http://www.ivypub.org/fes/
Frontier of Environmental Science December 2013, Volume 2, Issue 4, PP.33-46
Personal Exposure to Fine Particulates and
Polycyclic Aromatic Hydrocarbons in an Office
Environment in Xi’an, China Hongmei Xu
1,2, Junji Cao
1,3†, Meiling Gao4, Kin Fai Ho
1,5, Xinyi Niu
1, Teresa L. Coons
6, Steven Sai Hang Ho
1,7,
Gehui Wang1, Zhuzi Zhao
1,2
1. Key Lab of Aerosol Science & Technology, SKLLQG, Institute of Earth Environment, Chinese Academy of Sciences, Xi'an,
710075, China
2. University of Chinese Academy of Sciences, Beijing, 100049, China
3. Institute of Global Environmental Change, Xi’an Jiaotong University, Xi'an, 710054, China
4. University of California, Berkeley, USA
5. School of Public Health and Primary Care, The Chinese University of Hong Kong, Hong Kong, China
6. Washington State University, USA
7. Hong Kong Premium Services and Research Laboratory, Lai Chi Kok, Kowloon, Hong Kong, China
†Email: [email protected]
Abstract
This study was conducted to evaluate the relationships between PM2.5 and associated polycyclic aromatic hydrocarbons (PAHs) in
indoor and outdoor environments, identify likely PAH sources, determine personal exposures, and estimate the toxicity and
carcinogenic risks. Monitoring was conducted in Xi’an, China on consecutive weekdays (July 6 to 24, 2009) from 8am to 8 pm. The
average PM2.5 personal exposure mass concentration (66.4 μg m-3) was lower than that outdoors (80.5 μg m-3), but the average total
PAH concentration in the personal exposure samples (179.8 ng m-3) was higher than outdoors (114.9 ng m-3). In addition, two distinct
relationships between personal exposure and outdoor PAH concentrations were observed; these could be explained by the subjects’
time-activity patterns. PAHs toxicity risks were estimated from the BaP-equivalent concentrations in the personal samples and
determined to be 45.8 ng m-3 on average. Applying the unit risk method, an estimated 8 cancer cases (range: 2 to 30) per million office
workers would be expected from the inhalation of PM2.5-bound PAHs.
Keywords: PM2.5; PAH; Personal Exposure; Toxicity Risk; Office Workers
1 INTRODUCTION
Rapid and sustained economic and population growth in China has led to frequent air pollution episodes and increased
incidences of respiratory disease [1,2,3]
. Two sources of fine particulate matter (PM2.5, PM with aerodynamic equivalent
diameters ≤ 2.5 μm) exposure, ambient air pollution and household air pollution, were the fourth and fifth leading death
risks in China, respectively [4]
. Total PM2.5 burden in China–the combination of ambient air pollution, household air
pollution, and second-hand tobacco smoke–is very large [4]
. An estimated 300,000 deaths annually are attributed to urban
air pollution in China alone [5]
.
Much of PM2.5 is produced by anthropogenic activities. PM2.5 has been found to be especially toxic to humans because
these particles are small enough to penetrate deeply into the lungs where they then can be transferred into the

- 34 -
http://www.ivypub.org/fes/
bloodstream [1]
. PM2.5-associated PAHs have also gained attention owing to their toxicity, carcinogenicity and
mutagenicity [6,7]
. Several studies have demonstrated an association between specific PAHs and early genetic damage
associated with breast and lung carcinogenesis [8,9]
. Outdoors, PAHs are generated from various natural sources, such as
forest fires and volcanic eruptions, but they are also produced from anthropogenic sources, mainly motor vehicle exhaust,
the incomplete combustion of fossil fuels for heat or power generation, and fugitive emissions from industries [10,11,12]
.
Indoor PAHs are produced from cooking and from wood and coal burning for heat; they also can be transferred indoors
either from nearby sources or long-range transport [13,14,15]
.
Modern humans spend most of their lives indoors [13,16]
, but few studies have assessed the relationship between ambient
PM2.5 or PAH concentrations and personal exposure. Investigations of exposures in an urban office environment can
provide important insights into the overall exposure to PM2.5 and to PAHs and the health implications of that exposure
for office workers. Hence, the aims of this study were to evaluate the relationships between PM2.5 and associated PAHs
in indoor and outdoor environments, identify likely PAH sources, determine personal exposures, and estimate the
toxicity and carcinogenic risks from the exposure to PAHs.
2 MATERIALS AND METHODS
2.1 Participant Selection
Four participants (identified as AA, BB, CC, and DD) were selected from four different offices in the Institute of Earth
Environment, Chinese Academy of Sciences (IEECAS, 34°13'49.68"N, 108°52'59.05"E). Located in the Hi-Tech Zone
in urban Xi’an, the Institute hosts scientists and graduate students, some of whom both live and work there. The selected
participants (non-smokers, female, ages 24 to 29) spent their time in similar indoor microenvironments and worked in
the same building complex. During the study, the participants maintained activity logs to document the amount of time
spent in different locations and sources of direct exposure, such as cooking or being in an area where people were
smoking.
2.2 Sample Collection
PM2.5 personal exposure filter samples were collected continuously and simultaneously for the four participants on
weekdays (July 6 to 24, 2009) from 8 am to 8 pm local time (total 12 hr). Samples were collected using URG-2000
PM2.5 personal sampling devices (URG Corp., Chapel Hill, USA) each of which consisted of a filter-holder containing a
25-mm quartz filter (QM/A®, Whatman Inc., UK), a mini-PM2.5 cyclone, and a 3 L min
-1 AirLite Sample Pump. Before
sampling, the quartz filters were pre-combusted at 800C for at least 4 hr to remove adsorbed organic vapors. A blank
filter was collected for each batch to account for contamination from handling and the weighing steps. The pumps were
wrapped in sound-deadening material and placed in a waist pack for the participants to wear. The samplers were
connected to the pumps, and the participants kept the sampling inlets within the breathing zone distance (~0.2 m from
the nose and mouth). Flow rates were tested at the beginning and the end of each sampling period. The exposed sample
filters were placed in petri dishes and then stored at -20C before analysis to prevent the volatilization of the PAHs.
Ambient PM2.5 samples were also collected from 8 am to 8 pm local time (in parallel with the personal sampling) with
the use of a URG-3000N ambient sampler that was deployed on the rooftop of IEECAS building complex (~10 m above
the ground and 30 m from road traffic). This ambient sampling device used 37-mm quartz filters (QM/A®, Whatman Inc.,
UK), and operated at a standard flow rate 22 L m-1
. The start and end times were recorded in a sampling log along with
notes on unusual weather or traffic events. After sampling, the ambient aerosol filters were removed, equilibrated,
weighed, and stored using the same methods as those for personal exposure samples. A total of 15 samples were
collected from each of the four participants; this resulted in a total of 60 personal exposure and 15 outdoor samples for
the gravimetric analyses.

- 35 -
http://www.ivypub.org/fes/
2.3 Analyses
All quartz sample filters were weighed before and after sampling to determine the accumulated PM2.5 mass
concentrations. The filters were weighed using a Sartorius ME 5-F electronic microbalance (±1 μg sensitivity, Sartorius,
Gottingen, Germany)[17]
. The equilibration and weighing steps were repeated until a difference of < 5 µg was achieved.
Due to the high PM2.5 mass correlations among the four individuals [18]
, one punch (0.5 cm2) from each personal
exposure filter were combined (total 2.0 cm2) for the PAH analyses of the personal samples. Two punches (each punch
was 0.5 cm2; 1.0 cm
2 in total) were taken from each outdoor sample to provide sufficient mass for the ambient PAHs
analysis.
Solvent extraction (SE) followed by gas chromatography/mass spectrometry (GC/MS) was used to determine the PAH
concentrations. Filter punches were extracted three times, each time with 5 mL of a mixture of dichloromethane/
methanol (2:1, v/v) for 10 min with ultrasonication. After concentration, the extracts were incubated with 50 μL of
N,O-bis-(trimethylsilyl)trifluoroacetamide with 1% trimethylsilyl chloride and 10 μL of pyridine at 70C for 3 hr. The
derivatized extracts were analyzed with a Agilent 4890 5975 gas chromatography/mass selective detector system
(Agilent Technologies, Inc., Santa Clara, CA. USA). The GC/mass spectrometer GC/MS response factors were
determined using authentic standards. Average recoveries of all the standards were ~70%. Detailed information on the
procedures used for PAHs pretreatment and analysis along with QA/QC information has been presented in Wang et al. [19]
. Field blank filters were analyzed using these same procedures. The results of the blank analyses showed no serious
contamination (< 5.0% of the PAH concentrations of samples). The data reported are all corrected for the blanks.
Thirteen PAHs were identified and quantified in this study; these were fluorine (FLO, 3-ring), phenanthrene (PHE,
3-ring), anthracene (ANT, 3-ring), fluoranthene (FLU, 4-ring), pyrene (PYR, 4-ring), benzo[a]anthracene (BaA, 4-ring),
chrysene and triphenylene (CT, 4-ring), benzo[b]fluoranthene (BbF, 5-ring), benzo[k]fluoranthene (BkF, 5-ring),
benzo[a]pyrene (BaP, 5-ring), indeno[1,2,3-cd]pyrene (IcdP, 6-ring), dibenzo[a,h]anthracene (DahA, 5-ring), and
benzo[g,h,i]perylene (BghiP, 6-ring).
2.4 Air Exchange Rate Experiment
An experiment was conducted to determine the rate at which outdoor air was transferred into the office environment
from the air conditioning system and from leaks in doors, windows, etc; this was done to understand the role of the air
exchange in terms of PAH exposure. Carbon dioxide gas (gas cylinder, 5000 ppm CO2) was released into an office with
the windows and doors closed in the building complex. The CO2 source was removed when the concentration reached
5000 ppm in the office. A handheld Q-TRAK air quality real-time instrument (TSI Inc., MN, USA) was used to measure
the CO2 concentrations. Multiple locations in the office were measured to ensure CO2 was well-mixed throughout the
room. The air conditioner was then turned on high until the CO2 concentration fell below the background, indoor level
(700 ppm).
The air exchange rate (AER) was calculated based on the following equation [20,21]
:
C(t) = C(0)e-kt
1)
where C(0) is the initial concentration of CO2, C(t) is the concentration of CO2 after time t, and k is a rate constant (that
is, the AER) in units of reciprocal time.
3 RESULTS AND DISCUSSION
3.1 Exposure to PM2.5
1) Personal-outdoor Associations of PM2.5 Concentrations

- 36 -
http://www.ivypub.org/fes/
The arithmetic mean mass concentrations of the four personal exposure PM2.5 samples ranged from a low of 58.6 μg m-3
(subject CC) to a high of 73.5 (BB) μg m-3
, and these were generally lower than outdoor PM2.5 concentrations, which
averaged 80.5 μg m-3
(Table 1). Ratios of personal exposure to outdoor mass concentrations (P/O) ranged from 0.7 to 0.9.
The P/O ratios less than unity can be interpreted as an indication that the PM2.5 loadings were lower in the offices
compared with the outdoor air, that is, lower exposure indoors compared with outdoors. A scatter-plot of personal versus
outdoor PM2.5 mass concentrations is presented in Fig. 1. Overall, the PM2.5 mass concentrations showed a strong
correlation between the personal exposure and outdoor samples (R = 0.81), with the R values for the four subjects
ranging from 0.79 to 0.87. The slope of the regression (0.6) implies that the filters on the air conditioners removed some
of the PM or that the PM was prevented from entering the offices by some other means. The intercept (24.3) of the
regression might imply that there is a background source for indoor PM.
FIG. 1 RELATIONSHIP BETWEEN PERSONAL EXPOSURE (P) AND OUTDOOR (O) PM2.5 MASS CONCENTRATIONS
TABLE 1 PERSONAL EXPOSURE (P) AND OUTDOOR (O) PM2.5 MASS CONCENTRATIONS IN XI’AN
Type of
Sample Na
PM2.5 concentration (μg m-3)
P/O ratio Rb
Mean Range
Subject AA 15 69.6 25.9 – 181.3 0.9 0.83
Subject BB 15 73.5 30.6 – 186.0 0.9 0.87
Subject CC 15 58.6 28.4 – 123.6 0.7 0.86
Subject DD 15 63.9 26.0 – 114.7 0.8 0.79
Outdoor 15 80.5 32.3 – 236.8 N/Ac N/A
aN is the number of samples
bR is the P/O correlation coefficient
cNA is not applicable
0 50 100 150 200 250 3000
50
100
150
200
0
50
100
150
200
Per
sonal
exposu
re P
M2.5
(ug m
-3)
Outdoor PM2.5
(ug m-3)
Y= 0.6X + 24.3
R=0.81 N=52 P<0.0001
AA
BB
CC
DD
- 37 -
http://www.ivypub.org/fes/
Regulatory standards have not been established in China for either personal exposure or indoor PM2.5 concentrations, and
few studies have focused on personal exposure to PM in office settings. Nevertheless, the results from our study can be
compared with those from other areas. Summer PM2.5 concentrations reported by Sangiorgi et al. [22]
for various office
settings in Milan, Italy were 14.5, 13.3, 20.0, and 23.3 μg m-3
, while the corresponding outdoor PM2.5 concentrations
were 19.5, 20.2, 32.1, and 37.0, respectively. The US EPA also completed the collection phase of the cross-sectional
Building Assessment Survey and Evaluation (BASE) study in 2000 [23]
. The PM2.5 indoor concentrations from that study
ranged from 1.3 to 24.8 μg m-3
in 100 office buildings across the USA, with a geometric mean of 7.2 μg m-3
, and the
outdoor concentrations ranged from 4.5 to 47.4 μg m-3
, with a geometric mean of 14.7 μg m-3
[23]
. A detailed study of
PM2.5 distributions in three non-residential indoor environments (museum, print industry, and office) in Athens, Greece
found mass concentrations of 20.3, 65.0, and 30.7 μg m-3
, respectively [24]
. In comparison, the PM2.5 mass loadings in the
personal exposure samples from our study were much higher than all of those just mentioned.
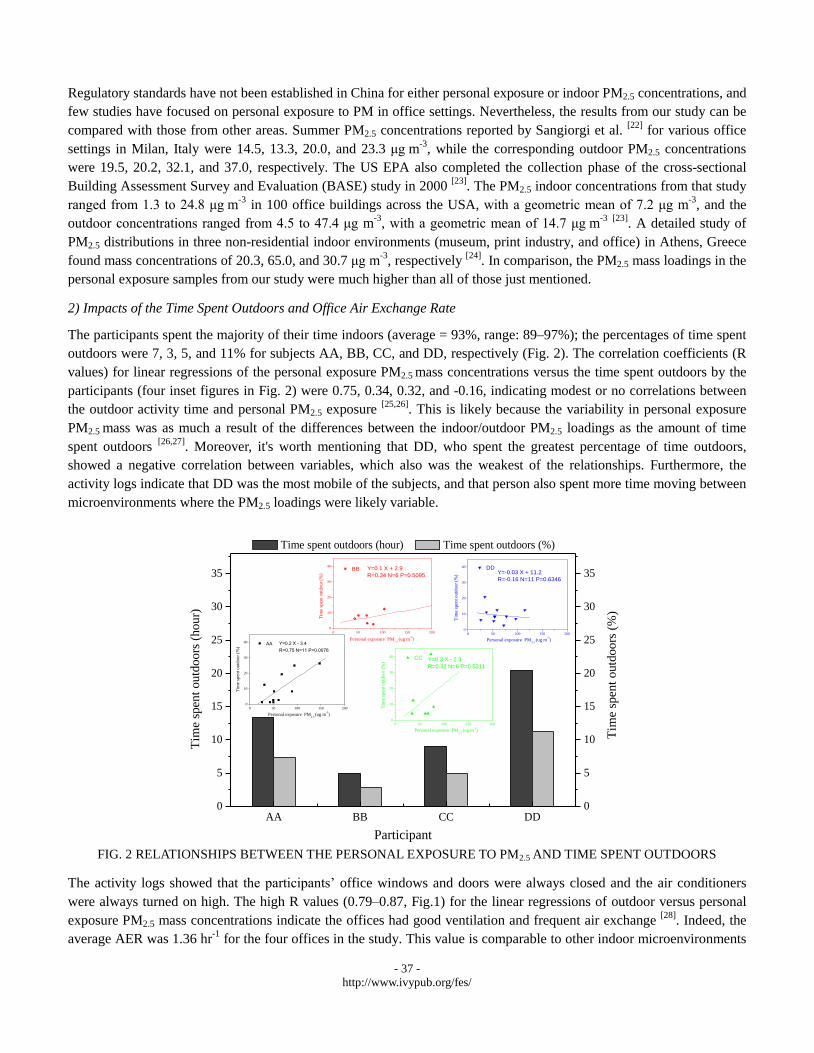
2) Impacts of the Time Spent Outdoors and Office Air Exchange Rate
The participants spent the majority of their time indoors (average = 93%, range: 89–97%); the percentages of time spent
outdoors were 7, 3, 5, and 11% for subjects AA, BB, CC, and DD, respectively (Fig. 2). The correlation coefficients (R
values) for linear regressions of the personal exposure PM2.5 mass concentrations versus the time spent outdoors by the
participants (four inset figures in Fig. 2) were 0.75, 0.34, 0.32, and -0.16, indicating modest or no correlations between
the outdoor activity time and personal PM2.5 exposure [25,26]
. This is likely because the variability in personal exposure
PM2.5 mass was as much a result of the differences between the indoor/outdoor PM2.5 loadings as the amount of time
spent outdoors [26,27]
. Moreover, it's worth mentioning that DD, who spent the greatest percentage of time outdoors,
showed a negative correlation between variables, which also was the weakest of the relationships. Furthermore, the
activity logs indicate that DD was the most mobile of the subjects, and that person also spent more time moving between
microenvironments where the PM2.5 loadings were likely variable.
FIG. 2 RELATIONSHIPS BETWEEN THE PERSONAL EXPOSURE TO PM2.5 AND TIME SPENT OUTDOORS
The activity logs showed that the participants’ office windows and doors were always closed and the air conditioners
were always turned on high. The high R values (0.79–0.87, Fig.1) for the linear regressions of outdoor versus personal
exposure PM2.5 mass concentrations indicate the offices had good ventilation and frequent air exchange [28]
. Indeed, the
average AER was 1.36 hr-1
for the four offices in the study. This value is comparable to other indoor microenvironments
0 50 100 150 2000
10
20
30
40
Y=-0.03 X + 11.2
R=-0.16 N=11 P=0.6346
Personal exposure PM2.5
(ug m-3
)
Tim
e sp
ent
outd
oor
(%)
DD
0 50 100 150 2000
10
20
30
40
Y=0.3 X - 2.3
R=0.32 N=6 P=0.5311
Personal exposure PM2.5
(ug m-3
)
Tim
e sp
ent
outd
oor
(%)
CC
0 50 100 150 2000
10
20
30
40
Personal exposure PM2.5
(ug m-3
)
Y=0.1 X + 2.9
R=0.34 N=6 P=0.5095
Tim
e sp
ent
outd
oor
(%)
BB
0 50 100 150 2000
10
20
30
40 Y=0.2 X - 3.4
R=0.75 N=11 P=0.0076
Personal exposure PM2.5
(ug m-3
)
T
ime
spen
t outd
oor
(%)
AA
AA BB CC DD0
5
10
15
20
25
30
35
0
5
10
15
20
25
30
35
Tim
e sp
ent
outd
oors
(%
)
Tim
e sp
ent
outd
oors
(hour)
Participant
Time spent outdoors (hour) Time spent outdoors (%)
- 38 -
http://www.ivypub.org/fes/
in China where air exchange rates were 1.37 hr-1
in a classroom, 1.91 hr-1
in a reading room, and 1.22 hr-1
in a dormitory
and in an urban area California (USA) where the air-exchange rate in summer was 1.13 hr-1
[21,29]
. If the AER for an
office is low, indoor air pollutants can accumulate to levels that could pose health risks. However, in our study, PM2.5
was typically higher for the outdoor air samples than for the personal samples, and a modest air exchange rate would be
beneficial to the office workers because it would prevent the infiltration of the outdoor air. On the other hand, as
illustrated below, exposure to other pollutants such as PAHs, also are affected by human activities as well as the AER.
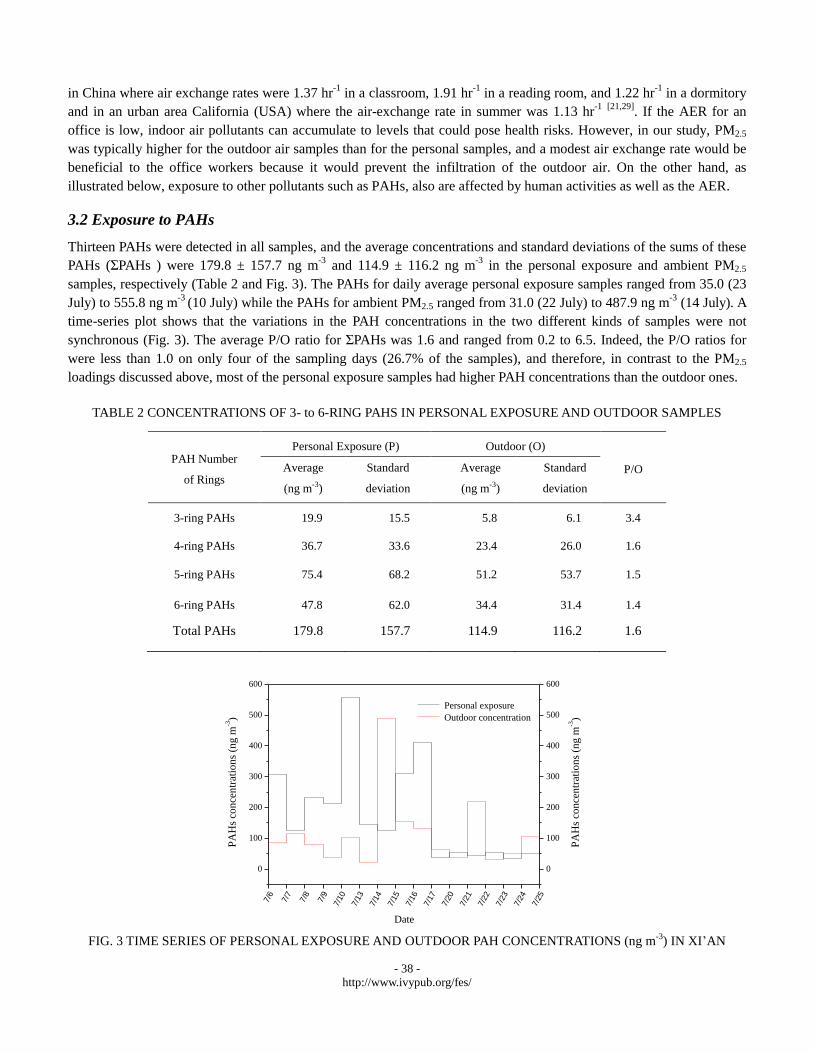
3.2 Exposure to PAHs
Thirteen PAHs were detected in all samples, and the average concentrations and standard deviations of the sums of these
PAHs (ΣPAHs ) were 179.8 ± 157.7 ng m-3
and 114.9 ± 116.2 ng m-3
in the personal exposure and ambient PM2.5
samples, respectively (Table 2 and Fig. 3). The PAHs for daily average personal exposure samples ranged from 35.0 (23
July) to 555.8 ng m-3
(10 July) while the PAHs for ambient PM2.5 ranged from 31.0 (22 July) to 487.9 ng m-3
(14 July). A
time-series plot shows that the variations in the PAH concentrations in the two different kinds of samples were not
synchronous (Fig. 3). The average P/O ratio for ΣPAHs was 1.6 and ranged from 0.2 to 6.5. Indeed, the P/O ratios for
were less than 1.0 on only four of the sampling days (26.7% of the samples), and therefore, in contrast to the PM2.5
loadings discussed above, most of the personal exposure samples had higher PAH concentrations than the outdoor ones.
TABLE 2 CONCENTRATIONS OF 3- to 6-RING PAHS IN PERSONAL EXPOSURE AND OUTDOOR SAMPLES
PAH Number
of Rings
Personal Exposure (P) Outdoor (O)
P/O Average
(ng m-3)
Standard
deviation
Average
(ng m-3)
Standard
deviation
3-ring PAHs 19.9 15.5 5.8 6.1 3.4
4-ring PAHs 36.7 33.6 23.4 26.0 1.6
5-ring PAHs 75.4 68.2 51.2 53.7 1.5
6-ring PAHs 47.8 62.0 34.4 31.4 1.4
Total PAHs 179.8 157.7 114.9 116.2 1.6
FIG. 3 TIME SERIES OF PERSONAL EXPOSURE AND OUTDOOR PAH CONCENTRATIONS (ng m-3
) IN XI’AN
7/6
7/7
7/8
7/9
7/1
0
7/1
3
7/1
4
7/1
5
7/1
6
7/1
7
7/2
0
7/2
1
7/2
2
7/2
3
7/2
4
7/2
5
0
100
200
300
400
500
600
0
100
200
300
400
500
600
PA
Hs
con
cen
trat
ion
s (n
g m
-3)
Personal exposure
Outdoor concentration
PA
Hs
con
cen
trat
ion
s (n
g m
-3)
Date
- 39 -
http://www.ivypub.org/fes/
Based on the activity logs, none of participants cooked, cleaned, or were exposed to tobacco smoke during the collection
of the personal exposure samples. No obvious sources for the PAHs were noted except for the printing and computer
equipment in the office. Participants spent an average of 93% of their time indoors; most of their time outdoors was
spent in environments where the PAH concentrations were likely high (e.g., walking near roadways or riding buses).
This time-activity pattern was reflected in the lower 12-hr average PAH concentrations in ambient PM2.5 samples
compared with the personal exposure samples. Although the time spent outdoors everyday by participants was short
(even zero hours on occasion for two participants who sometimes stayed in the Institute), the time outdoors usually
involved the daily commute. This led to the subjects’ exposure to higher PAH concentrations from motor vehicle
emissions.
To the best of our knowledge, no studies to date have investigated personal exposure to PM2.5-bound PAHs near
roadways in Xi’an. Fortunately, data for traffic police exposed to PAHs during the summer in Tianjin provide a point of
comparison for understanding the ambient PAH concentrations found in our study [30]
. The mean concentration of the
sum of thirteen PAHs collected from roadway intersections in Tianjin was 867.5 ng m−3
, and that was much higher than
the average for samples collected on a school campus which also was in Tianjin (ΣPAHs: 19.5 ng m−3
). In comparison,
the personal PAHs in our study were five orders of magnitude lower than what found in Tianjin roadside samples. This
suggests that personal exposure to PAHs can be strongly affected by outdoor activity patterns, and in particular, the time
spent in specific microenvironments where the pollutants are in high concentrations.
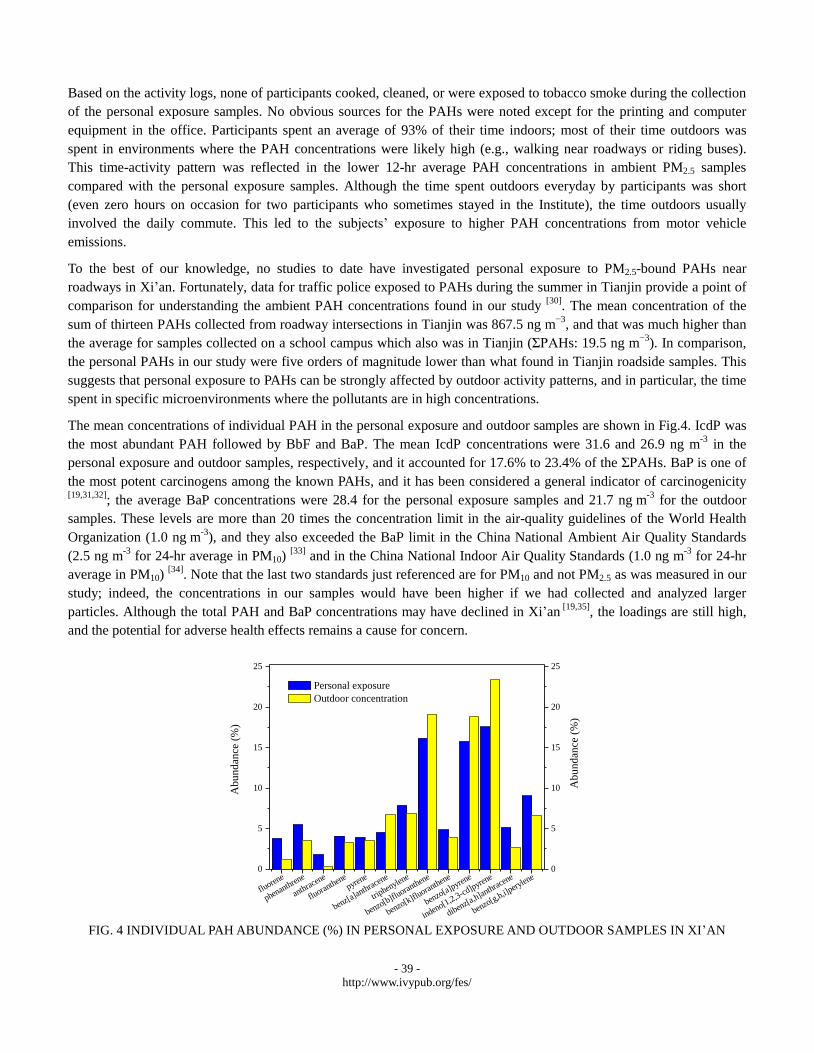
The mean concentrations of individual PAH in the personal exposure and outdoor samples are shown in Fig.4. IcdP was
the most abundant PAH followed by BbF and BaP. The mean IcdP concentrations were 31.6 and 26.9 ng m-3
in the
personal exposure and outdoor samples, respectively, and it accounted for 17.6% to 23.4% of the ΣPAHs. BaP is one of
the most potent carcinogens among the known PAHs, and it has been considered a general indicator of carcinogenicity [19,31,32]
; the average BaP concentrations were 28.4 for the personal exposure samples and 21.7 ng m-3
for the outdoor
samples. These levels are more than 20 times the concentration limit in the air-quality guidelines of the World Health
Organization (1.0 ng m-3
), and they also exceeded the BaP limit in the China National Ambient Air Quality Standards
(2.5 ng m-3
for 24-hr average in PM10) [33]
and in the China National Indoor Air Quality Standards (1.0 ng m-3
for 24-hr
average in PM10) [34]
. Note that the last two standards just referenced are for PM10 and not PM2.5 as was measured in our
study; indeed, the concentrations in our samples would have been higher if we had collected and analyzed larger
particles. Although the total PAH and BaP concentrations may have declined in Xi’an [19,35]
, the loadings are still high,
and the potential for adverse health effects remains a cause for concern.
FIG. 4 INDIVIDUAL PAH ABUNDANCE (%) IN PERSONAL EXPOSURE AND OUTDOOR SAMPLES IN XI’AN
fluoren
e
phenanthrene
anthracene
fluoranthene
pyrene
benz[a]anthracene
triphenylen
e
benzo[b]fluoranthene
benzo[k]fluoranthene
benzo[a]pyrene
indeno[1,2,3-cd]pyrene
dibenz[a,h]anthracene
benzo[g,h,i]pery
lene
0
5
10
15
20
25
0
5
10
15
20
25
Ab
un
dan
ce (
%)
Ab
un
dan
ce (
%)
Personal exposure
Outdoor concentration
- 40 -
http://www.ivypub.org/fes/
Comparisons of the PAH concentrations grouped by ring structure for the personal exposure and outdoor samples are
shown in Table 2. The average contribution of 3-ring PAHs was 11.1% for the personal exposure samples, and that was
much higher than in the outdoor PM2.5 samples (5.1%); in fact, the P/O ratio for 3-ring PAHs was 3.4. In contrast, the
concentration percentages of 4-, 5-, and 6-ring PAHs in personal exposure and outdoor samples were much more similar
(20.4 and 20.3% for 4-ring PAHs, 41.9 and 44.6% for 5-ring PAHs, 26.6 and 30.0% for 6-ring PAHs, respectively). The
average P/O ratios for the 4-, 5- and 6-ring PAHs ranged from 1.6 to 1.4; and they varied inversely with the PAHs’
boiling points; that is, lower P/O ratios were observed for the PAHs with higher boiling points.
This difference in P/O ratios is most likely because the 3- and 4-ring PAHs (molecular weight, MW < 252) typically
exist in both the vapor and particulate phases while the 5- and 6-ring PAHs (MW ≥ 252) are mainly in the particulate
phase [7,32,36]
. According to gas-particle distribution theory, the 5- and 6-ring PAHs should be more stable and less
volatile than the 3-ring PAHs. This means that compared with the higher MW PAHs, the 3-ring PAHs are more likely to
vaporize in the warm summer air and then infiltrate into the offices through the doors and windows. In our study, the
average outdoor temperatures reached 31.1C; this was approximately 7C higher than in the offices (mean 24.4C).
Hence, setting aside the differences in the PAH emission sources and other factors, a larger fraction of the 3-ring PAHs
would condense onto particles in the cooler office air compared with the warmer outdoor environment.
Comparisons with the results of previous studies of personal exposure to PM2.5 and associated PAHs shows that the
exposure in Xi’an is much lower than in Beijing (559.4 ng m-3
in 2007 winter) [37]
but higher than in Guangzhou or
Tianjin, China [13,30]
, Shizuoka, Japan [38]
, Bangkok, Thailand [39]
, and Porto, Portugal [40]
. The level of exposure in Xi’an
is ten to one hundred times higher than what is typical in the USA [41,42]
, and this high level of the personal exposure to
PAHs deserves serious attention in future air pollution and human health studies.
3.3 Implications for PAH Sources
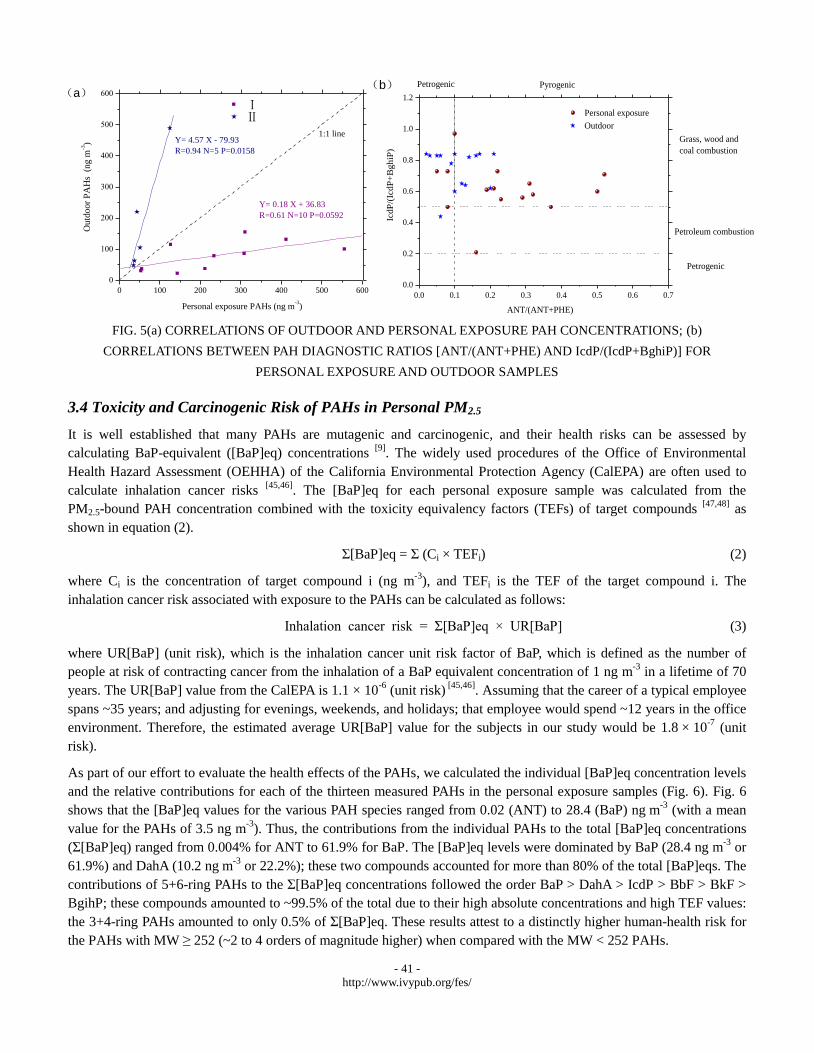
A scatter plot of the total PAH concentration outdoors versus personal exposure (Fig. 5a) shows two different
relationships, one with R = 0.61 (line I) and the other R = 0.94 (line II). The difference in the slopes of lines I and II
(0.18 and 4.57) indicates that there were two types of exposure to PAHs, and these were most likely a function of the
individuals’ time-activity patterns. This finding is important because it illustrates how normal day-to-day activities can
influence one’s exposure to this group of pollutants. For regression line I (below the 1:1 diagonal line), all of the
personal exposure PAH concentrations were much higher than the matching outdoor data. Although our outdoor
monitoring site did not capture the roadside PAH concentrations, the high personal exposure PAHs can best be explained
by the relatively long time (>1 hr) the participants spent outdoors each day; this included time spent commuting in
heavily trafficked areas where PAH concentrations were likely high. Regression line II (above the 1:1 diagonal line)
reflected relatively shorter outdoor exposure times (<1 hr each day on average); this relationship was seen for
participants on days when they did not commute or when they spent the entire day indoors where PAH concentrations
were most likely low.
Diagnostic ratios of atmospheric PAHs with similar MWs have been used for source identification studies [43,44]
. The
personal exposure samples from our study had average values of 0.24 for ANT/(ANT+PHE) and 0.62 for
IcdP/(IcdP+BghiP); in comparison, the corresponding ratios were ~0.11 and 0.75 for the outdoor samples (Fig. 5b). The
bulk of the outdoor data plotted around the vertical line at 0.1 for ANT/(ANT+PHE), and this indicates that the
contributions of petrogenic and pyrogenic sources to the outdoor PAHs were roughly equal. In contrast, most of the
personal exposure samples plotted in the center of Fig. 5b, and this is consistent with a predominant influence from
pyrogenic sources. Almost all of the data points plotted above the upper horizontal line at 0.5 for the IcdP/(IcdP+BghiP)
ratio, indicating that most of the samples had strong influences from grass, wood, and coal combustion although some of
them evidently also were affected by petroleum combustion.
- 41 -
http://www.ivypub.org/fes/
FIG. 5(a) CORRELATIONS OF OUTDOOR AND PERSONAL EXPOSURE PAH CONCENTRATIONS; (b)
CORRELATIONS BETWEEN PAH DIAGNOSTIC RATIOS [ANT/(ANT+PHE) AND IcdP/(IcdP+BghiP)] FOR
PERSONAL EXPOSURE AND OUTDOOR SAMPLES
3.4 Toxicity and Carcinogenic Risk of PAHs in Personal PM2.5
It is well established that many PAHs are mutagenic and carcinogenic, and their health risks can be assessed by
calculating BaP-equivalent ([BaP]eq) concentrations [9]
. The widely used procedures of the Office of Environmental
Health Hazard Assessment (OEHHA) of the California Environmental Protection Agency (CalEPA) are often used to
calculate inhalation cancer risks [45,46]
. The [BaP]eq for each personal exposure sample was calculated from the
PM2.5-bound PAH concentration combined with the toxicity equivalency factors (TEFs) of target compounds [47,48]
as
shown in equation (2).
Σ[BaP]eq = Σ (Ci × TEFi) (2)
where Ci is the concentration of target compound i (ng m-3
), and TEFi is the TEF of the target compound i. The
inhalation cancer risk associated with exposure to the PAHs can be calculated as follows:
Inhalation cancer risk = Σ[BaP]eq × UR[BaP] (3)
where UR[BaP] (unit risk), which is the inhalation cancer unit risk factor of BaP, which is defined as the number of
people at risk of contracting cancer from the inhalation of a BaP equivalent concentration of 1 ng m-3
in a lifetime of 70
years. The UR[BaP] value from the CalEPA is 1.1 × 10⁻⁶
(unit risk) [45,46]
. Assuming that the career of a typical employee
spans ~35 years; and adjusting for evenings, weekends, and holidays; that employee would spend ~12 years in the office
environment. Therefore, the estimated average UR[BaP] value for the subjects in our study would be 1.8 × 10⁻⁷
(unit
risk).
As part of our effort to evaluate the health effects of the PAHs, we calculated the individual [BaP]eq concentration levels
and the relative contributions for each of the thirteen measured PAHs in the personal exposure samples (Fig. 6). Fig. 6
shows that the [BaP]eq values for the various PAH species ranged from 0.02 (ANT) to 28.4 (BaP) ng m-3
(with a mean
value for the PAHs of 3.5 ng m-3
). Thus, the contributions from the individual PAHs to the total [BaP]eq concentrations
(Σ[BaP]eq) ranged from 0.004% for ANT to 61.9% for BaP. The [BaP]eq levels were dominated by BaP (28.4 ng m-3
or
61.9%) and DahA (10.2 ng m-3
or 22.2%); these two compounds accounted for more than 80% of the total [BaP]eqs. The
contributions of 5+6-ring PAHs to the Σ[BaP]eq concentrations followed the order BaP > DahA > IcdP > BbF > BkF >
BgihP; these compounds amounted to ~99.5% of the total due to their high absolute concentrations and high TEF values:
the 3+4-ring PAHs amounted to only 0.5% of Σ[BaP]eq. These results attest to a distinctly higher human-health risk for
the PAHs with MW ≥ 252 (~2 to 4 orders of magnitude higher) when compared with the MW < 252 PAHs.
0 100 200 300 400 500 600
0
100
200
300
400
500
600
Outd
oor
PA
Hs
(ng m
-3)
Personal exposure PAHs (ng m-3)
Y= 0.18 X + 36.83
R=0.61 N=10 P=0.0592
Y= 4.57 X - 79.93
R=0.94 N=5 P=0.0158
1:1 line
ⅡⅠ
(a)
0.0 0.1 0.2 0.3 0.4 0.5 0.6 0.7
0.0
0.2
0.4
0.6
0.8
1.0
1.2
Petrogenic
Petroleum combustion
Grass, wood and
coal combustion
Pyrogenic
IcdP
/(Ic
dP
+B
ghiP
)
ANT/(ANT+PHE)
Personal exposure
Petrogenic
Outdoor
(b)
- 42 -
http://www.ivypub.org/fes/
FIG. 6 PERCENTAGES (%) OF [BaP]eq FOR INDIVIDUAL PAH SPECIES IN PERSONAL EXPOSURE SAMPLES (SEE
TEXT FOR DESCRIPTION OF PAH ABBREVIATIONS)
Furthermore, the mean Σ[BaP]eq for the entire personal exposure sampling period was 45.8 ± 43.0 ng m-3
(range:
8.7–164.6 ng m-3
): the highest value was found on 10 July and the lowest on 23 July. The maximum Σ[BaP]eq value was
more than 3.5 times the average. The excess inhalation cancer risk in the Xi’an urban office environment for a typical
career of 12 years averaged 8.3 × 10⁻⁶
(range: 1.6 × 10⁻⁶
to 3.0 × 10⁻⁵
). The median value of total inhalation risk was
6.9×10⁻⁶
, with 6.0×10⁻⁶
and 1.0×10⁻⁵
for the 5th and 95
th percentiles, respectively. Therefore, an estimated mean of 8
(range: 2 to 30) cases of cancer per million office workers in Xi'an can be expected from the inhalation of PM2.5-bound
PAHs.
The Xi’an Statistical Yearbook [49]
indicates that the total number of persons employed in enterprises, institutions,
agencies and related organizations in Xi’an was approximately 1.35 million at the end of 2009. Therefore, an estimated
11 cancer cases for these working employees can be attributed to the inhalation of PM2.5-bound PAHs. We should note
that this number of cases is most likely an underestimate because the assessment is based on summertime PAH
concentrations, which are lower than that in other seasons [19]
. This extremely high Σ[BaP]eq value and the
corresponding health risks should not to be neglected in Xi’an. Finally, it is important to note that the levels of PAHs and
other contaminants in the offices investigated here are surely much lower than in many other work environments, and
therefore, the investigations of PAH exposures should be expanded to include other workplaces where the impacts are
likely to be greater.
4 CONCLUSIONS
This study on personal exposure to PM2.5 and PAHs in Xi’an, China highlights the importance of understanding and
quantifying PAH sources and in determining how the exposures are affected by personal activity patterns. The personal
exposure PM2.5 mass concentrations for four subjects averaged over 15 days ranged from 58.6 to 73.5 μg m-3
(with the
average of 66.4 μg m-3
), and these were generally lower than the outdoor concentrations, which averaged 80.5 μg m-3
.
Overall, the mass concentrations showed a strong correlation between outdoor and personal exposure (R = 0.81), and the
slope of the regression for these two sets of samples implies that some of the outdoor PM was removed by the air
conditioning system or in other ways prevented from entering the offices.
The averages of the sums of the thirteen PAHs investigated were 179.8 ± 157.7 and 114.9 ± 116.2 ng m-3
in the personal
exposure (P) and outdoor (O) samples, respectively. The PAHs P/O correlations evidently were driven by the
individual’s time-activity patterns. The average P/O ratio for individual PAHs was 1.6 and ranged from 0.2 to 6.5. The
mean Σ[BaP]eq concentration for the ensemble of all personal exposure samples was 45.8 ± 43.0 ng m-3
(range: 8.7 to
164.6 ng m-3
). The PAHs diagnostic ratios indicate that the main sources of PAHs were anthropogenic, especially coal
0.35%
22.18%
6.89%
61.88%
1.9%
6.34%
0.31%0.09%0.02%0.02%0%0.01%0.01%
FLO
PHE
ANT
FLU
PYR
BaA
CT
BbF
BkF
BaP
IcdP
DahA
BghiP
6.3 %
1.9 %
22.2 %
6.9 %
61.9 %
0.8 %
- 43 -
http://www.ivypub.org/fes/
combustion and motor vehicle emissions.
The excess inhalation cancer risk derived from Σ[BaP]eq indicates that 8 persons (range: 2 to 30) per million office
workers in Xi'an would develop cancer due to their exposure to PM2.5-bound PAHs. It is important to note that the PM2.5
and PAH concentrations in the offices in this study are doubtlessly much lower than in many other workplace
environments, and so the cancer risks estimated here are likely toward the lower end of the risk spectrum. The study also
was conducted during the summer when the PAH concentrations were relatively low, so the overall risks are likely
higher. It is also worth emphasizing that this study highlights the potential impacts of PM2.5 and PAHs from mobile
sources; the study participants evidently were exposed during their commute despite the typically short duration of
exposure. Targeted sampling of specific microenvironments and further investigations of time-activity patterns would
benefit future studies and help determine the greatest PAH-related health risks.
ACKNOWLEDGMENTS
This study was supported by National Gongyi Project (201209007), Shaanxi Project (2012KTZB03-01), and the funding
from “US National Science Foundation East Asia Pacific Summer Institutes Program”.
REFERENCES
[1] Dockery, D., and Pope, A. “Epidemiology of acute health effects: Summary of time-series studies” In: Wilson, R., Editor by Spengler,
J.D., Particles in air: Concentration and health effects. University Press, Cambridge, USA, 1996
[2] Chow, J. C., Watson, J. G., Chen, A. L.-W., Ho, S. S. H., Koracin, D., Zielinska, B., Tang, D. L., Perera, F., Cao, J. J., and Lee, S. C.
“Exposure to PM2.5 and PAHs from the Tong Liang, China Epidemiological Study” Journal of Environmental Science and Health Part
A 41(2006): 517-542
[3] Shen, Z. X., Cao, J. J., Arimoto, R., Han, Z. W., Zhang, R. J., Han, Y. M., Liu, S. X., Okuda, T., Nakao, S., and Tanaka, S. “Ionic
Composition of TSP and PM2.5 during dust storms and air pollution episodes at Xi’an, China” Atmospheric Environment 43 (2009):
2911-2918
[4] Yang, G. H., Wang, Y., Zeng, Y. X., Gao, G. F., Liang, X. F., Zhou, M. G., Wan, X., Yu, S. C., Jiang, Y. H., Naghavi, M., Vos, T., Wang,
H. D., Lopez, A. D., Murray, C. J. L. “Rapid health transition in China, 1990–2010: findings from the Global Burden of Disease Study
2010” Lancet 381(2013): 1987-2015
[5] Zhang, J., and Smith, K. R. “Indoor air pollution from household fuel combustion in China: A review” The 10th International
Conference on Indoor Air Quality and Climate 1-26 (2005)
[6] Schauer, C., Niessner, R., and Pöschl, U. “Polycyclic aromatic hydrocarbons in urban air particulate matter: decadal and seasonal
trends, chemical degradation, and sampling artifacts” Environmental Science & Technology 37 (2003): 2861-2868
[7] Ho, K. F., Ho, S. S. H., Lee, S. C., Cheng, Y., Chow, J. C., Watson, J. G., Louie, P. K. K., and Tian, L.W. “Emissions of gas- and
particle-phase polycyclic aromatic hydrocarbons (PAHs) in the Shing Mun Tunnel, Hong Kong” Atmospheric Environment 43 (2009):
6343-6351
[8] Lewtas, J. “Complex mixtures of air pollutants-charaterizing the cancer risk of polycyclic organic matter” Environmental Health
Perspectives 100 (1993): 211-218
[9] Yassaa, N., Meklati, B. Y., Cecinato, A., and Marino, F. “Particulate n-alkanes, n-alkanoic acids and polycyclic aromatic hydrocarbons
in the atmosphere of Algiers City Area” Atmospheric Environment 35 (2001): 1843-1851
[10] Simoneit, B. R. T., Sheng, G. Y., Chen, X., Fu, J. M., Zhang, J., and Xu, Y. “Molecular marker study of extractable organic matter in
aerosols from urban areas of China” Atmospheric Environment 25A (1991): 2111-2129
[11] Schauer, J. J., Rogge, W. F., Hildemann, L. M., Mazurek, M. A., and Cass, G. R. “Source apportionment of airborne particulate matter
using organic compounds as tracers” Atmospheric Environment 22 (1996): 3837-3855
[12] Zhao, X. S., Ding, J., and You, H. “Spatial distribution and temporal trends of polycyclic aromatic hydrocarbons (PAHs) in water and
sediment from Songhua River, China” Environmental Geochemistry and Health (2013). DOI 10.1007/s10653-013-9524-0
[13] Li, C. L., Fu, J. M., Sheng, G. Y., Bi, X. H., Hao, Y. M., Wang, X. M., and Mai, B. X. “Vertical distribution of PAHs in the indoor and

- 44 -
http://www.ivypub.org/fes/
outdoor PM2.5 in Guangzhou, China” Building and Environment 40 (2005): 329-341
[14] Ravindra, K., Sokhi, R., and Grieken, R. V. “Review: Atmospheric polycyclic aromatic hydrocarbons: Source attribution, emission
factors and regulation” Atmospheric Environment 42 (2008): 2895-2921
[15] Peng, H., Yang, Y., Liu, M., and Zhou. J. L. “PAHs in indoor dust samples in Shanghai’s universities: levels, sources and human
exposure” Environmental Geochemistry and Health 34 (2012): 587-596
[16] Weisel, C. P., Zhang, J. F., Turpin, B., Morandi, M. T., Colome, S., Stock, T. H., and Spektor, D. M. “Relationships of indoor, outdoor
and personal air (RIOPA): Part I. Collection methods and descriptive analyses” Boston, Health Effects Institute, 2005
[17] Cao, J. J., Wu, F., Chow, J. C., Lee, S. C., Li, Y., Chen, S. W., An, Z. S., Fung, K. K., Watson, J. G., Zhu, C. S., and Liu, S. X.
“Characterization and source apportionment of atmospheric organic and elemental carbon during fall and winter of 2003 in Xi’an, China”
Atmospheric Chemistry and Physics 5 (2005): 3127-3137
[18] Coons, T. L. “Urban air pollution: personal exposure and spatial variability of fine particulate matter (PM2.5) in Denver, Colorado and
Xi’an, China” B.S. of Washington State University. pp. 45, 2009
[19] Wang, G. H., Kawamura, K., Lee, S. C., Ho, K. F., and Cao, J. J. “Molecular, seasonal, and spatial distributions of organic aerosols from
fourteen Chinese cities” Environment Science and Technology 40 (2006): 4619-4625
[20] Noullett, M., Jackson, P. L., and Brauer, M. “Estimation and characterization of children’s ambient generated exposure to PM2.5 using
sulphate and elemental carbon as tracers” Atmospheric Environment 44 (2010): 4629-4637
[21] You, Y., Niu, C., Zhou, J., Liu, Y. T., Bai, Z. P., Zhang, J. F., He, F., and Zhang, N. “Measurement of air exchange rates in different
indoor environments using continuous CO2 sensors” Journal of Environmental Sciences 24 (2012): 657-664
[22] Sangiorgi, G., Ferrero, L., Ferrini, B. S., Porto, C. Lo, Perrone, M. G., Zangrando, R., Gambaro, A., Lazzati, Z., and Bolzacchini, E.
“Indoor airborne particle sources and semi-volatile partitioning effect of outdoor fine PM in offices” Atmospheric Environment 65
(2013): 205-214
[23] Burton, L. E., Girman, J. G., and Womble, S. E. “Airborne particulate matter within 100 randomly selected office buildings in the
United States (BASE)” Proceedings of Healthy Buildings 1 (2000): 157-162
[24] Saraga, D., Pateraki, S., Papadopoulos, A., Vasilakos, Ch., and Maggos, Th. “Studying the indoor air quality in three non-residential
environments of different use: A museum, a printery industry and an office” Building and Environment 46 (2011): 2333-2341
[25] Dons, E., Panis, L. I., Poppel, M. V., Theunis, J., Willems, H., Torfs, R., and Wets, G. “Impact of time activity patterns on personal
exposure to black carbon” Atmospheric Environment 45 (2011): 3594-3602
[26] Physick, W., Powell, J., Cope, M., Boast, K., and Lee, S. H. “Measurements of personal exposure to NO2 and modelling using ambient
concentrations and activity data” Atmospheric Environment 45 (2011): 2095-2102
[27] Lazenby, V., Hinwood, A., Callan, A., and Franklin, P. “Formaldehyde personal exposure measurements and time weighted exposure
estimates in children” Chemosphere 88 (2012): 966-973
[28] Chao, C. Y., and Wong, K. “Residential indoor PM10 and PM2.5 in Hong Kong and the elemental composition” Atmospheric
Environment 36 (2002): 265-277
[29] Yamamoto, N., Shendell, D. G., Winer, A. M., and Zhang, J. “Short Communication: Residential air exchange rates in three major US
metropolitan areas: results from the relationship among indoor, outdoor, and personal air study 1999-2001” Indoor Air 20 (2010): 85-90
[30] Hu, Y. D., Bai, Z. P., Zhang, L. W., Wang, X., Zhang, L., Yu, Q. C., and Zhu, T. “Health risk assessment for traffic policemen exposed to
polycyclic aromatic hydrocarbons (PAHs) in Tianjin, China” Science of the Total Environment 382 (2007): 240-250
[31] WHO. “WHO guidelines for indoor air quality: selected pollutants” The WHO European Centre for Environment and Health, Bonn
Office, WHO Regional Office for Europe coordinated the development of these WHO guidelines, 2010
[32] Bi, X. H., Sheng, G. Y., Peng, P. A., Chen, Y. J., Zhang, Z. Q., and Fu, J. M. “Distribution of particulate- and vapor-phase n-alkanes and
polycyclic aromatic hydrocarbons in urban atmosphere of Guangzhou, China” Atmospheric Environment 37 (2003): 289-298
[33] GB3095-2012. “National Ambient air quality standards in China” Ministry of Environmental Protection and General Administration of
Quality Supervision, Inspection and Quarantine of the People’s Republic of China, 2012
[34] GB/T18883-2002. “National indoor air quality standards in China” Ministry of Environmental Protection and General Administration of
Quality Supervision, Inspection and Quarantine of the People’s Republic of China, 2002
- 45 -
http://www.ivypub.org/fes/
[35] Okuda, T., Okamoto, K., Tanaka, S., Shen, Z. X., Han, Y. M., and Huo, Z. Q. “Measurement and source identification of polycyclic
aromatic hydrocarbons (PAHs) in the aerosol in Xi'an, China, by using automated column chromatography and applying positive
matrix factorization (PMF)” Science of the Total Environment 408 (2010): 1909-1914
[36] Tan, J. H., Guo, S. J., Ma, Y. L., Duan, J. C., Cheng, Y., He, K. B., and Yang, F. M. “Characteristics of particulate PAHs during a typical
haze episode in Guangzhou, China” Atmospheric Research 102 (2011): 91-98
[37] Wei, Y. J., Han, I.-K., Hu, M., Shao, M., Zhang, J. F. (Jim), and Tang, X. Y. “Personal exposure to particulate PAHs and anthraquinone
and oxidative DNA damages in humans” Chemosphere 81(2010): 1280-1285
[38] Ohura, T., Noda, T., Amagai, T., and Fusaya, M. “Prediction of personal exposure to PM2.5 and carcinogenic polycyclic aromatic
hydrocarbons by their concentrations in residential microenvironments” Environmental Science and Technology 39 (2005): 5592-5599
[39] Ruchirawat, M., Settachan, D., Navasumrit, P., Tuntawiroon, J., and Autrup, H. “Assessment of potential cancer risk in children
exposed to urban air pollution in Bangkok, Thailand” Toxicology Letters 168 (2007): 200-209
[40] Castro, D., Slezakova, K., Delerue-Matos, C., Alvim-Ferraz, M. C., Morais, S., and Pereira, M. C. “Polycyclic aromatic hydrocarbons
in gas and particulate phases of indoor environments influenced by tobacco smoke: levels, phase distribution, and health risks”
Atmospheric Environment 45 (2011): 1799-1808
[41] Adgate, J. L., Ramachandran, G., Pratt, G. C., Waller, L. A., and Sexton, K. “Longitudinal variability in outdoor, indoor, and personal
PM2.5 exposure in healthy non-smoking adults” Atmospheric Environment 37 (2003): 993-1002
[42] Crist, K. C., Liu, B., Kim, M., Deshpande, S. R., and John, K. “Characterization of fine particulate matter in Ohio: indoor, outdoor, and
personal exposures” Environmental Research 106 (2008): 62-71
[43] Yunker, M. B., Macdonald, R. W., Vingarzan, R., Mitchell, R. H., Goyette, D., and Sylvestre, S. “PAHs in the Fraser River basin: a
critical appraisal of PAH ratios as indicators of PAH source and composition” Organic Geochemistry 33 (2002): 489-515
[44] Tobiszewski, M., and Namiesnik, J. “Review: PAH diagnostic ratios for the identification of pollution emission sources”
Environmental Pollution 162 (2012): 110-119
[45] Hickox, W. H. “Air toxics hot spots program risk assessment guidelines: The air toxics hot spots program guidance manual for
preparation of health risk assessments” Secretary for Environmental Protection, California Environmental Protection Agency. Director
by Joan E. Denton, Office of Environmental Health Hazard Assessment, 2003
[46] Yu, Y. J., Guo, H. C., Liu, Y., Huang, K., Wang, Z., and Zhan, X. Y. “Mixed uncertainty analysis of polycyclic aromatic hydrocarbon
inhalation and risk assessment in ambient air of Beijing” Journal of Environmental Sciences 20 (2008): 505-512
[47] Nisbet, I. C. T., and Lagoy, P. K. “Toxic equivalency factors (TEFs) for polycyclic aromatic hydrocarbons (PAHs)” Regulatory
toxicology and pharmacology 13 (1992): 290-300
[48] Petry, T., Schmid, P., and Schlatter, C. “The use of toxic equivalency factors in assessing occupational and environmental health risk
associated with exposure to airborne mixtures of polycyclic aromatic hydrocarbons (PAHs)” Chemosphere 32 (1996): 639-648
[49] Xi’an Statistical Yearbook. Statistics Communique on the 2009 National Economy and Social Development of the City of Xi’an. Xi’an
Municipal Bureau of Statistics and NBS Survey Office in Xi’an. China Statistics Press, 2010
Authors1 Hongmei Xu (1986-), female, Chinese, a
PhD Candidate of Key Lab of Aerosol
Science & Technology, SKLLQG, Institute
of Earth Environment, Chinese Academy of
Sciences and University of Chinese
Academy of Sciences. Her research interests
are inorganic and organic compounds in
aerosol particles, their origins, and the
human health effects; personal exposure and related health risk
assessment and PM2.5 source apportionment.
Email: [email protected]
2† Junji Cao (1971-), male, Chinese, Doctor, professor of Key Lab
of Aerosol Science & Technology, SKLLQG, Institute of Earth
Environment, Chinese Academy of Sciences and part-time
professor of Institute of Global Environmental Change, Xi’an
Jiaotong University. His research interests are PM2.5 and
carbonaceous aerosols, their origins, and effects on climate; and
indoor air pollutants and their effects on historical artifacts.
Email: [email protected]
- 46 -
http://www.ivypub.org/fes/
3 Meiling Gao (1984-), female, USA, a PhD Candidate of
University of California, Berkeley, USA. Her research interests are
air pollutants in indoor and outdoor environments, and the effects
of built environment on disparities in exposures and health in both
China and USA.
4 Kin Fai Ho (1974-), male, Chinese, Doctor, assistant professor
School of Public Health and Primary Care, The Chinese University
of Hong Kong and part-time professor of Key Lab of Aerosol
Science & Technology, SKLLQG, Institute of Earth Environment,
Chinese Academy of Sciences. His research interests are aerosol
chemistry and health, especially the physical and chemical
characteristics of gases and aerosols in the atmosphere from
different sources.
5 Xinyi Niu (1990-), female, Chinese, Master degree of Department
of Civil and Structural Engineering, Hong Kong Polytechnic
University. Her research interests are air pollutants, including
aerosol and gases in indoor environment.
6 Teresa L. Coons (1985-), female, USA, Master degree of science
in Department of Civil, Environmental, and Architectural
Engineering, Washington State University in 2009. Her research
interest is personal exposure and spatial variability of PM2.5 in
Colorado and China.
7 Steven Sai Hang Ho (1975-), male, Chinese, Doctor, Chief
Executive Officer of Hong Kong Premium Services and Research
Co. and part-time professor of Institute of Earth Environment,
Chinese Academy of Sciences. His research experiences are in
environmental sciences and analytical chemistry.
8 Gehui Wang (1968-), male, Chinese, Professor of the Key Lab of
Aerosol Science & Technology, SKLLQG, Institute of Earth
Environment, Chinese Academy of Sciences. His research interests
are atmospheric chemistry, especially the physical and chemical
characteristics of organic aerosols in the atmosphere and their
impacts on climate and human health.
9 Zhuzi Zhao (1985-), female, Chinese, a PhD Candidate of Key
Lab of Aerosol Science & Technology, SKLLQG, Institute of
Earth Environment, Chinese Academy of Sciences and University
of Chinese Academy of Sciences. Her research interest is the
carbonaceous aerosol and its origins in remote regions (e.g., Tibet
and Qinghai Lake).