perkins core indicators 6s1-6s2 nontraditional: overview ... · perkins core indicators 6s1-6s2...
TRANSCRIPT
Perkins Core Indicators 6S1-6S2 Nontraditional: Overview of 5-Step Process for increasing participation/completion
Georgia Department of EducationCareer, Technical and Agricultural DivisionDavid Turner, DirectorVivian Snyder, Career Development [email protected]
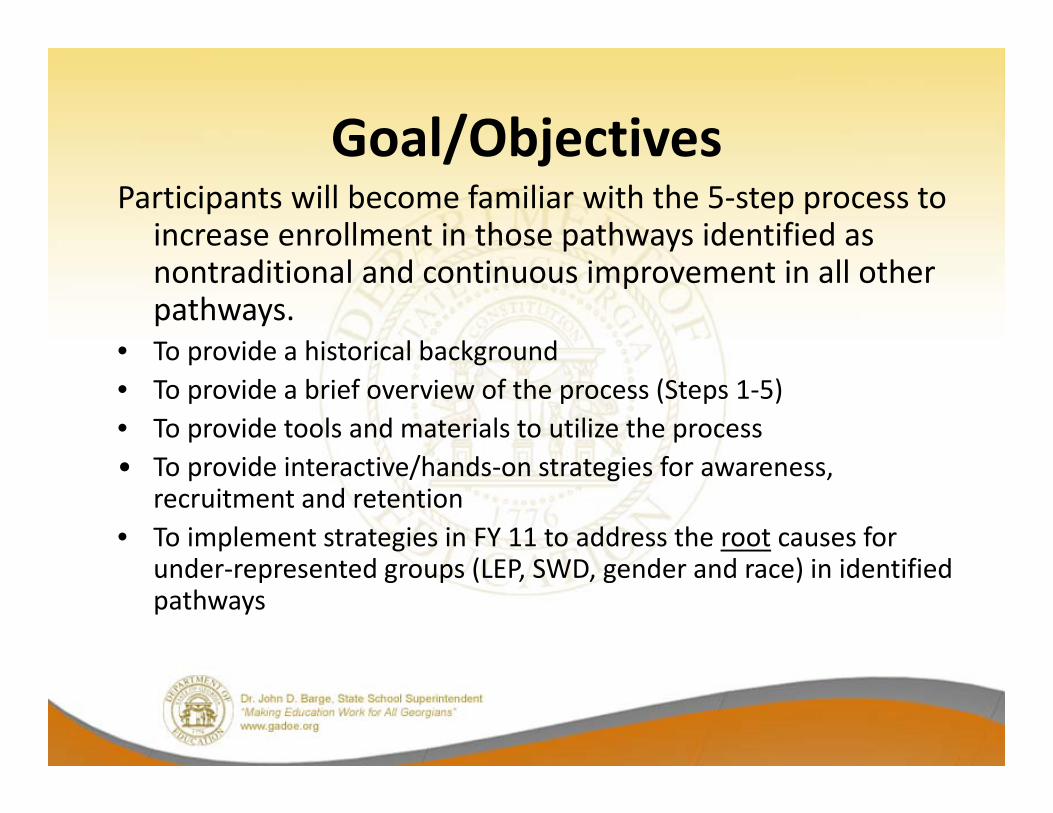
Goal/ObjectivesParticipants will become familiar with the 5‐step process to
increase enrollment in those pathways identified as nontraditional and continuous improvement in all other pathways.
• To provide a historical background• To provide a brief overview of the process (Steps 1‐5)• To provide tools and materials to utilize the process• To provide interactive/hands‐on strategies for awareness,
recruitment and retention• To implement strategies in FY 11 to address the root causes for
under‐represented groups (LEP, SWD, gender and race) in identified pathways
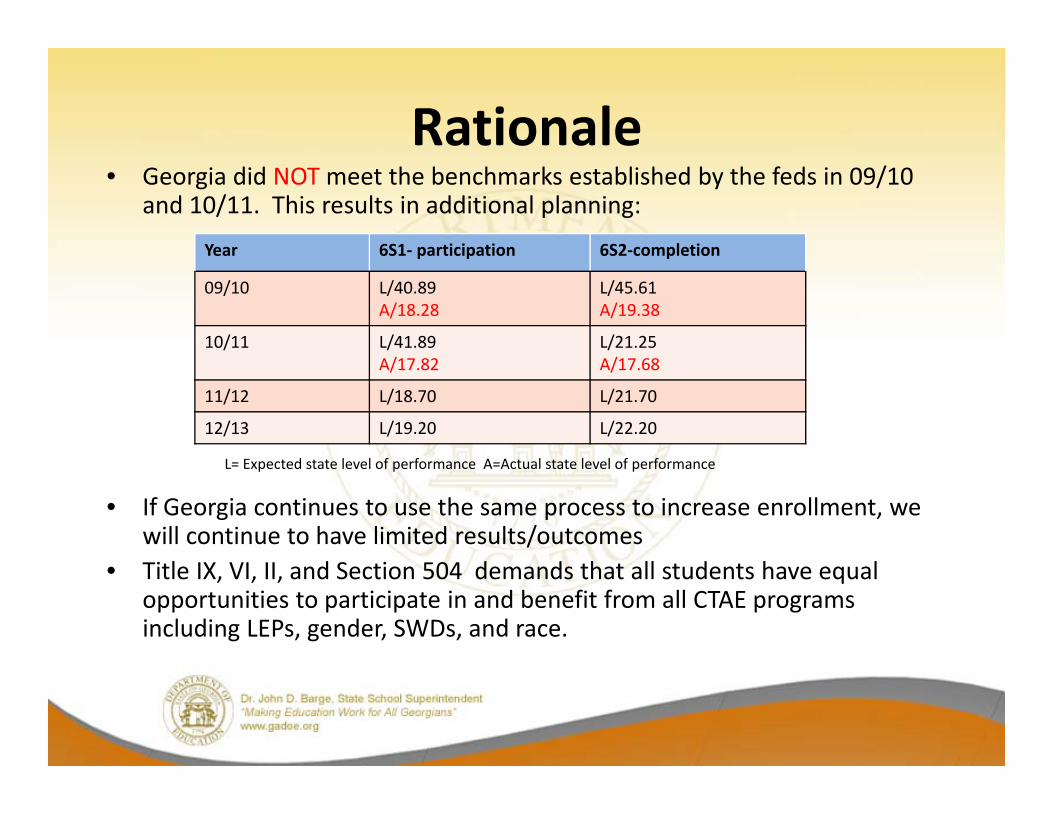
Rationale• Georgia did NOT meet the benchmarks established by the feds in 09/10
and 10/11. This results in additional planning:
• If Georgia continues to use the same process to increase enrollment, we will continue to have limited results/outcomes
• Title IX, VI, II, and Section 504 demands that all students have equal opportunities to participate in and benefit from all CTAE programs including LEPs, gender, SWDs, and race.
Year 6S1‐ participation 6S2‐completion
09/10 L/40.89A/18.28
L/45.61A/19.38
10/11 L/41.89A/17.82
L/21.25A/17.68
11/12 L/18.70 L/21.70
12/13 L/19.20 L/22.20
L= Expected state level of performance A=Actual state level of performance

I. Perkins Legislation IVFunds shall be appropriated for services that prepare individuals for nontraditional fields of employment
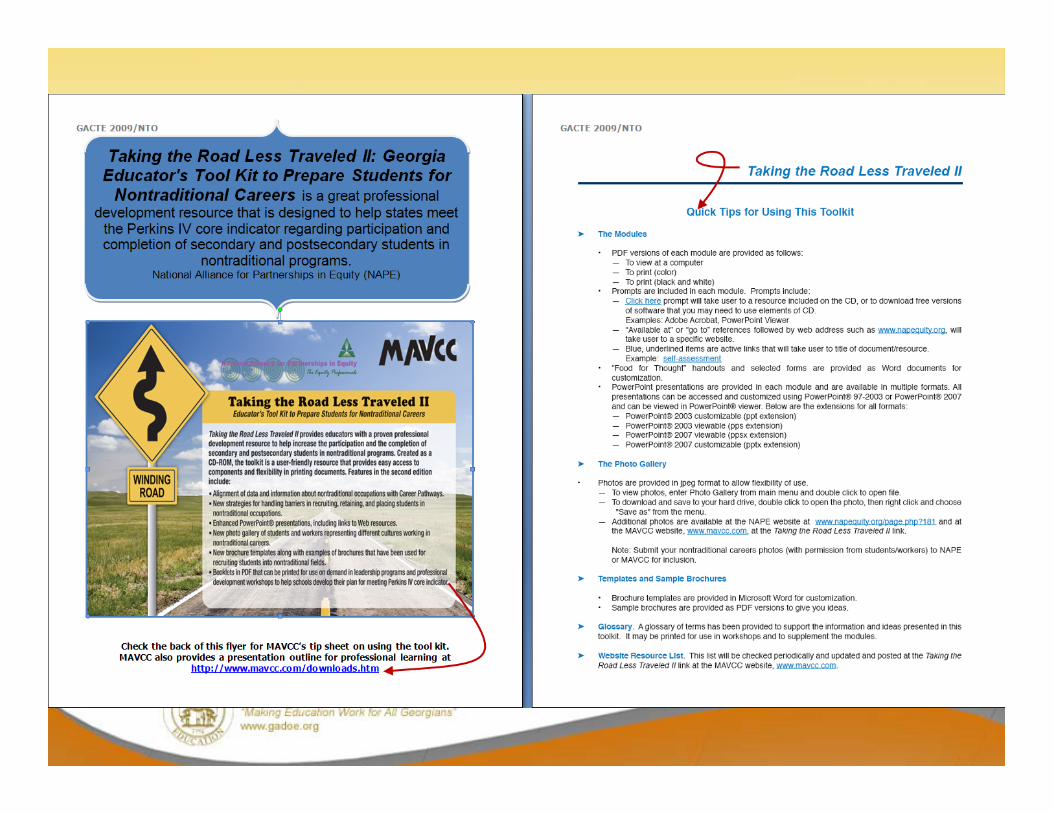
Some of the major events from the state level to promote nontraditional fields of employment:•Coordinator made multiple informational presentations regarding the 5‐Step process for analyzing nontraditional data to increase underrepresented gender numbers•Coordinator made multiple presentations regarding the utilization of state purchased resources: Taking the Road Less Traveled edition I & II and Destination Success for both middle school and high schools•Georgia participated in Federal Technical Assistance Workshop which resulted in a major collaborative effort between secondary and postsecondary schools•Georgia maintains a membership with the National Alliance for Partnerships in Equity (NAPE)•Beginning in 11/12 developed a strong collaborative effort with Science, Technology, Engineering and Mathematics to provide engaging STEM Festivals for grades 7‐12.•Perkins PLUS grant included efforts to increase underrepresented gender numbers.

Local Plan (Grant Application)
• Core Indicator 6S1: Participation in career and technical programs leading to nontraditional employment (Students enrolled in CTAE courses)
– Addressed during local program compliance reviews– Addressed during Office for Civil Rights Compliance Reviews
(Disproportionate enrollment‐usually a counseling issue; however, instructors should be working with counselors to analyze the date, identify root causes and develop
strategies to overcome the issues)

Local Plan (Grant Application)
• Core Indicator 6S2: Completion of career and technical programs leading to nontraditional employment (12th grade students completing a pathway)
– Addressed during local program compliance reviews– Addressed during Office for Civil Rights Compliance Reviews

II. Title IX (1972)• Federal law to prohibit gender discrimination in education—
regulations require that schools take steps to ensure that disproportionate enrollment of students of one gender in a course is not the result of discrimination
Addressed in Civil Rights Compliance Reviews:▪Annual notice of discrimination includes all protected groups including gender (sex)▪Continuous nondiscrimination notice includes all protected groups including gender (sex)▪Student course selection should be based on future career goals not gender (counseling)▪Annual evaluation of course and recruitment materials (system/school; counselors; instructors)
Reality Check
Educators must make certain that young people get the message that career choices are a function of talent, interest and personal desires based on good current career information NOT gender.
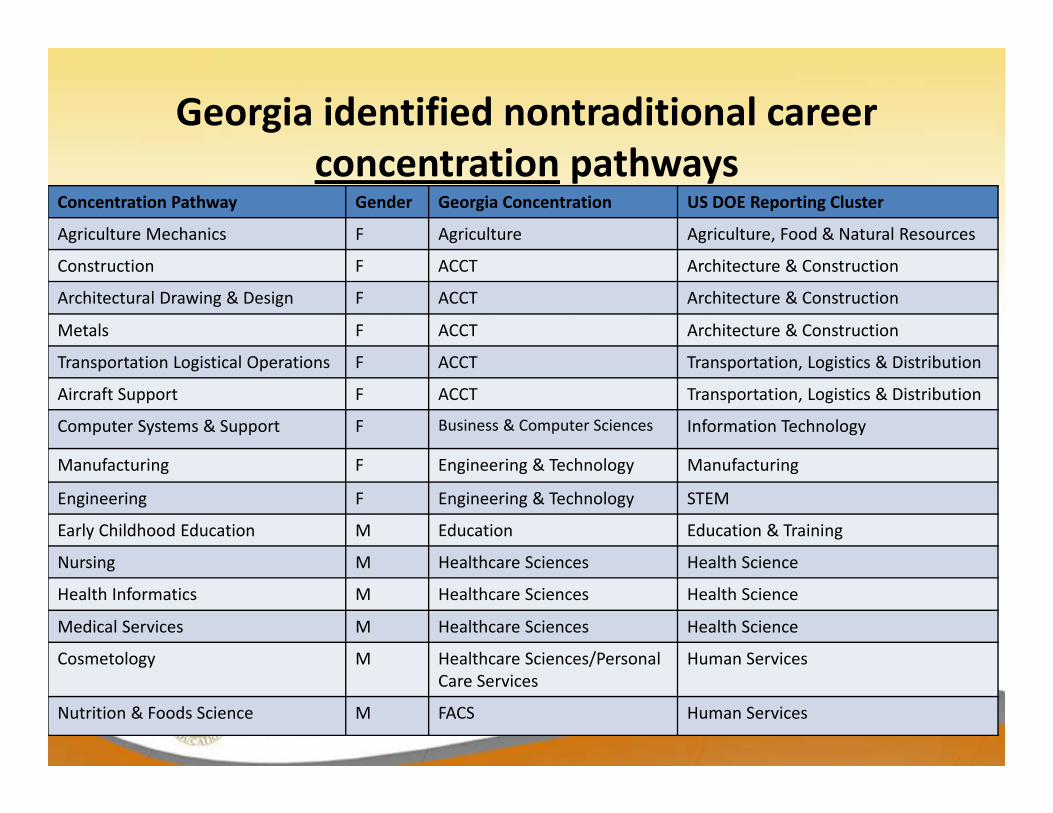
Georgia identified nontraditional career concentration pathways
Concentration Pathway Gender Georgia Concentration US DOE Reporting Cluster
Agriculture Mechanics F Agriculture Agriculture, Food & Natural Resources
Construction F ACCT Architecture & Construction
Architectural Drawing & Design F ACCT Architecture & Construction
Metals F ACCT Architecture & Construction
Transportation Logistical Operations F ACCT Transportation, Logistics & Distribution
Aircraft Support F ACCT Transportation, Logistics & Distribution
Computer Systems & Support F Business & Computer Sciences Information Technology
Manufacturing F Engineering & Technology Manufacturing
Engineering F Engineering & Technology STEM
Early Childhood Education M Education Education & Training
Nursing M Healthcare Sciences Health Science
Health Informatics M Healthcare Sciences Health Science
Medical Services M Healthcare Sciences Health Science
Cosmetology M Healthcare Sciences/Personal Care Services
Human Services
Nutrition & Foods Science M FACS Human Services

5‐Step Process to improvement
Step 1• Gather Performance Results from each pathway (Data)
Step 2• Identify and Confirm Roots Causes (Why + Evidence)
Step 3• Choose Best Solutions address root causes (Strategies)
Step 4• Implementation of Best Solutions (Strategies)
Step 5• Evaluation of Performance Results/Continue the Process

Gather annual data on ALL pathways:Local school performance levels for multiple schoolsSystem/School performance levels State performance levels (see slide 17 for state data)
Identify NTO state identified pathways offered annually for special attention (see slide # 9)
Analyze the data to determine gaps of under‐represented groups (LEP, SWD, race and gender) in CTAE pathways
List your conclusions/discoveries
Local Performance Data
Examples for Step 1The data indicates that the system level
of performance is higher than the local performance level in the Transportation Support pathway (Where are the schools that are doing well? Why?)
The data indicates that school A’s local performance level in Early Childhood Education is much higher than the system level. (What are they doing to enroll males?)

•Identify potential causes within your control based on:Strongest evidence to
supportAddress most critical needProvides the best
opportunity to have high impact on performanceAvailable
resources/support
•Methods for identifying and confirming root causesData results Review the literatureReview program reviewConduct focus groupsBrainstorm InterviewSurveys
Identify Root Causes‐identify conditions or factors that cause or permit gaps to occur

Lack of early exposure and the career guidance materials and practices at the middle school contribute to the 2.1% performance level in Agriculture Mechanics (from brainstorming)
Lack of instructional strategies contributes to the 0 % performance level in Welding at school B (from interviewed with students)
Examples for Step II

Choose the Best Solutions • Review and research potential improvement strategies that will best address your identified and confirmed root causes

Examples for Step III• Provide counselors at the middle school with an update regarding available programs to include publications and other materials to assist in their career development program
• Provide a “DIVA DAY” at the high school prior to school starting at the high school.
• Provide professional learning with instructors regarding awareness and recruitment of students in nontraditional pathways to include instructional strategies.

Annual suggested timeline
Step 1• Gather Performance Results• August ‐October
Step 2
• Identify and Confirm Roots Causes• November ‐February
Step 3
• Choose Best Solutions•March‐May
Step 4
• Implementation of Best Solutions• September ‐May
Step 5
• Evaluation of Performance Results/Continue the Process•May

State Performance Levels
FY 10/11
• Level=41.89%• Actual=17.82%
FY 11/12
• Level=18.70• Actual= not available
FY 12/13
• Level=19.20• Actual=not available
FY 10/11
• Level=21.25• Actual=17.68%
FY 11/12• Level=21.0• Actual= not available
FY 12/13
• Level=22.20• Actual=not available
Performance Levels for 6S1 Performance Levels for 6S2

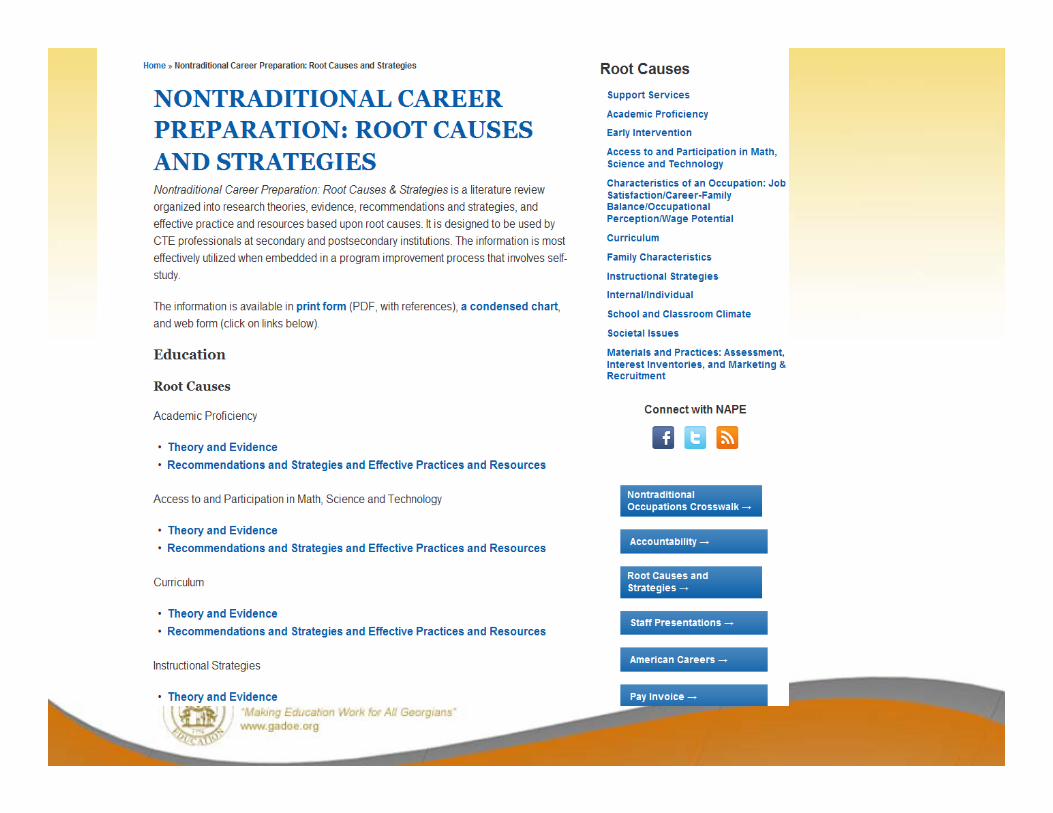
Available Resources:• Taking the Road Less Traveled II• Destination Success http://www.doe.k12.ga.us/Curriculum‐Instruction‐and‐
Assessment/CTAE/Pages/Nontraditional‐Occupations.aspx
Power point – 5‐Step Program Improvement Process Training Perkins IV Core Indicator Guidelines Building CTAE Tables for GA Core Indicators Matrix GaDOE Targeted Nontrad Program Pathways Template for CTAE Nontrad Enrollment – Disaggregated (Local
Data) Root Causes and Strategies Research Literature Review

Root Causes and Strategies Research Literature Review