peripheralisation trends in rural territories: the case of
TRANSCRIPT

122
Studies in Agricultural Economics 116 (2014) 122-130 http://dx.doi.org/10.7896/j.1421
Introduction
In recent years, territorial trends in Europe have led to
clearly distinguishable in the post-socialist Member States
of the European Union (EU) (Lang, 2011). Polarisation is
clearly seen when the capital city and several bigger cities
are rather intensively growing, whereas the territories that
are located outside their economic hinterlands are charac-
terised with constant decline. Tendentiously increasing eco-
nomic and social differences between the regions allow us to
assume that territorial polarisation will increase conditioning
peripheralisation of non-metropolis territories.
The depopulation of rural territories of Lithuania
has already been occurring for more than half a century
et al., 2013). After the resto-
ration of independence in 1990 the depopulation processes
population of Lithuania live in the rural territories. At the end
of the 20th century the Soviet Union collapsed and Lithuania
not only became politically independent but also switched
from a planned to market economy. However, the kolkhoz
settlement structure, which has been rapidly changing in
recent years due to the lack of workplaces, is still similar to
the one that was formed in the Soviet period. The importance
of the traditional activities of rural areas (e.g. agriculture,
The purpose of the article is to show the main trends
in the changes to the system of rural settlements in Lithu-
ania and to determine the regional peculiarities of these
changes. In order to achieve this, several tasks were set.
Firstly it was necessary to describe the trends in the main
demographic and socioeconomic indicators during the last
distance issues. The third step was the analysis of the situa-
tion in the rural territories of Lithuania and this was carried
out in the context of the changes in the sizes and locations
of rural settlements.
Regional disparities in depopulating territories
in post-socialist countries in Europe
Smith (1996) stressed that in order to forecast the devel-
past. The historical heritage and the changes in the settle-
ment system are especially evident in Central and Eastern
European1 (CEE) countries. The weakness of the regions
or the currently ongoing processes of degradation of the
settlement network in CEE countries depend on historical
circumstances (Farago, 1999; Bihari and Kovács, 2006;
Timár and Kovács, 2009). The socioeconomic changes in
the CEE countries started at the end of the 20th century
when they emerged from a period of domination by the
Soviet Union.
Many researchers (e.g. Becker and Bloom, 1998; Kris-
jane, 2001; Sobotka et al., 2003; Nagy, 2005; Nagy, 2006;
Burneika et al., 2013; Otto and Chmielewska, 2014) claim
that the growth of territorial imbalances and the degrada-
tion of networks of settlements in the CEE countries are
consequences of the transition period. When switching
from a planned to a market economy, power was given to
entrepreneurs (Scott and Storper, 2003), as entrepreneurship
was thought to be the engine that would lift the country to
a higher economic level. However, although business has
given to the consequences of capitalism for the regions. The
transition period saw an increase in the growth of capitals
and other big cities while the rural settlements have depopu-
lated and degraded. This growing territorial polarisation
has led to increased attention being paid to lagging regions
(Czyz, 2002; Grossmann et al., 2008; Pallagst, 2010; Reck-
ien and Martinez-Fernandez, 2011; Lang, 2011, 2012).
The researchers underline the negative polarisation trends,
stressing that such territorial unevenness results in the emer-
gence of areas of growth and stagnation.
1 We use CEE to mean the post-socialist countries of central and eastern Europe that
did not belong to the Commonwealth of Independent States.
Peripheralisation trends in rural territories: the case of Lithuania
This article describes the main trends in the changes to the system of rural settlements in Lithuania and determines the
regional peculiarities of these changes. The analysis was carried out using data collected during the censuses of 2001 and
-
sis showed that the population decreased in the majority of settlements independently of their size. However, distinct regional
collected from the peripheral areas located further from cities or roads of regional importance. The survey showed that the
north-eastern and southern parts of Lithuania are depopulated most, whereas in the western part of the country the number
of residents was stable until 2000, and only in the 21st century did it start to decrease due to the increasing emigration rates.
Also, the analysis of the structure of settlements allowed us to point out the historical circumstances as the cause of regional
differences. In the north-eastern part of Lithuania the settlements are smaller than in the western part of Lithuania. The analy-
sis shows that the increasing importance of the centre-periphery factor will further determine the decline of rural settlements
in peripheral territories in Lithuania.
Keywords: peripheralisation, rural settlements, rural regions, depopulation
* Vilnius, Lithuania. Corresponding
author: [email protected]

Peripheralisation trends in rural territories: the case of Lithuania
123
However, the processes of depopulation and changes
in the network of settlements in post-socialist countries
were not unexpected and stand as the natural process. The
demographic and socioeconomic problems in CEE countries
occur in all territorial units but, with the growing inequal-
ity between centres and peripheries (Raagmaa, 1996, 2003;
Churski et al., 2014), they most strongly affect the peripheral
rural territories (Amcoff and Westholm, 2007). The strong
urban centres rapidly grow together with the rural territo-
ries around them that serve as residential places for higher-
incomes residents, whereas the remote agricultural rural
regions and big industrial centres from Soviet times continue
to decline.
This article aims to add to the body of literature that
shows the ongoing changes in the post-socialist countries of
Europe. The information it contains draws attention to the
declining (and even disappearing) system of settlements and
the increasing peripheralisation process in Lithuania.
Methodology
Lithuania is divided into 60 LAU1 regions (municipali-
ties or ), of which six are city (urban) munici-
Alytaus) and 54 include both urban (towns) and rural ter-
ritories2.
This article focuses on rural territories. The term rural
territory (settlement
law and researchers use this term in various ways. Here we
-
lic of Lithuania Law on the Territorial Administrative Units
of the Republic of Lithuania and Their Boundaries (Republic
of Lithuania, 1994). The statistical information that is col-
According to the law, small towns (fewer than 3000 inhabit-
ants), villages and steadings, i.e. residential territories hav-
ing no characteristic features of city or town, are attributed
to rural residential territories. Rural territories cover 97.4
per cent of Lithuania’s territory ( ,
2013). According to the population census of 20113, there
were 20,940 rural settlements in Lithuania. Therefore, rural
settlements account for over 99 per cent of all settlements
(including cities and towns), but only around 33 per cent of
the population, of Lithuania.
The results section consists of three parts that were pre-
-
teen years. This part has been prepared using data that were
provided by Statistics Lithuania4.
The second part presents the accessibility situation that
appears in Lithuania when combining time and location
questions. By adapting the methodology that was developed
by European authors (Schurmann and Spiekermann, 2006;
Dijkstra and Poelman, 2008; Jonard et al., 2009), the periph-
2 The other territorial levels in Lithuania are ten NUTS3 regions (apskritys), and
LAU2 wards.3 Available from http://osp.stat.gov.lt/en/2011-m.-surasymas4 http://www.stat.gov.lt/en/home
on just two components: settlement network (especially big-
ger cities) and car travel times. Cities where the population
exceeds 50 thousand was considered as centres of attraction.
This threshold was chosen because cities of such size can
offer a wider selection of jobs, higher education, special-
ised health institutions, supermarkets and various services
(Schurmann and Spiekermann, 2006; Dijkstra and Poelman,
2008). Following this approach, the six biggest cities in
Therefore, the accessibility of these cities by car within a
certain time was analysed using ArcGIS software. Accord-
ing to Dijkstra and Poelman (2008), who analysed remote
rural territories in the EU, the optimal accessibility time
by car to the regional centre should not exceed 30 minutes,
although accessibility time up to 45 minutes was considered
to be relatively good. Therefore, a 45 minutes limit was used
as a criterion to distinguish remote rural territories. Mean-
while, those regions from which it takes more than an hour
to reach the centre of attraction by car are considered to be
‘extremely peripheral’ (Tóth, 2006).
Using the same analysis principle, accessibility was esti-
mated at a different scale: the accessibility by car of the cen-
tres of the 60 municipalities. This analysis made it possible
to identify the places in Lithuania that were lagging even
within the territory of the municipality. In accordance with
the accessibility of the administrative centre by car within
15 minutes. Meanwhile, the locations from which it took
more than 35 minutes to reach the centre of the municipal-
ity were designated as peripheral. We recognise that these
accurate information concerning Lithuania.
The third, main, part of the article shows the changes
and transformations of the network of rural settlements in
Lithuania during the period 2001-2011. Our analysis and the
information in the Figures were based on the 2001 and 2011
population and house census data provided by Statistics
Lithuania5. In order to prepare the comparative analysis and
to determine the regional disparities, and to show the trends
evident in the changes, we compiled a database of all 20.9
thousand Lithuanian rural settlements. From the database
-
ised in 2013 and 2014, we were able to count the population
change even in the smallest settlements. We were also able
to look deeper into the social features: age structure, pos-
other than the place of residence. The collected data led us
to exclude the most vulnerable settlements where there were
only a few residents left and even to identify the settlements
that were left without inhabitants. The changes in the net-
work of Lithuanian rural settlements were analysed on the
bases of the changes in the number of residents that occurred
in particular settlements.
5 http://osp.stat.gov.lt/en/2011-m.-surasymas

124
Results
Fluctuations in the main demographic and
socioeconomic indicators in Lithuania
In the post-reform period in Lithuania, demographic and
socioeconomic changes were closely connected with periods
of economic boom and recession. Since 1996 the number
of inhabitants has constantly decreased (Figure 1). Lithuania
lost around 20 per cent of its inhabitants during this period,
and currently the total population does not exceed three mil-
lion. The main causes of population decline are high emigra-
tion and low fertility rates.
The average population density of Lithuania was 55.4
inhabitants per km² in 1996, 53.8 inhabitants per km² in
2000, 52.1 inhabitants per km² in 2006, and 46.1 inhabit-
ants per km² in 2012 (Figure 1). The population density
decreased at different rates across Lithuania: a notable
decline in inhabitants occurred in the infertile and excep-
tionally natural but economically weak areas or border
regions but the most rapid depopulation was in urban ter-
The number of inhabitants in the rural areas has also
decreased. Between 1996 and 2012 the rural territories in
total in Lithuania have lost 15.6 per cent of their popula-
tion. In 1996 the population density in the rural territories
decreased slightly to 17.7 inhabitants per km². In 2006 the
rural population density did not exceed 17 inhabitants per
(Figure 1).
There was a negative rate of natural population increase
(RNI) during the analysed period. This has led to the problem
of an ageing population, one that has become particularly
acute in the north-eastern and southern parts of Lithuania.
Prior to 2000 the RNI did not exceed -1.5‰, whereas after
2000 the rate leapt to -3‰ and still remains highly negative
(Figure 1). By contrast, at the beginning of the last decade of
the 20th century the RNI was positive (in 1992 it was 3.2‰)
but since then it has been constantly decreasing, reaching its
lowest rate (-4.0‰) in 2006.
Net migration rates changed during the period under
analysis. There was (and still is) a quite intensive emigra-
tion process. The last decade of the 20th century was distin-
guished by a high emigration rate, which showed in the low
net migration rates: in 1996 and 1998 average net migration
rates in Lithuania were accordingly -6.5‰ and -6.2‰ (Fig-
ure 1). The net migration rate increased to -9.5‰ in 2004 but
in 2006 emigration decreased and the net migration values
were the lowest (-1.4‰) for the entire analysed period. There
was however only a short pause before another emigration
wave, which peaked in 2010, when the net emigration rate
reached -25.2‰ (Figure 1).
During the same period, constant economic growth was
noted at national level through foreign direct investment
(FDI) and added value created by the employed population.
Meanwhile, the unemployment and construction indicators
In the middle of the last decade of the 20th century the
unemployment rate was relatively low. In 1996 it was 7.1
per cent but by 2000 it had reached 16.4 per cent. In the
2006, when it reached 3.4 per cent. After 2006, the rate again
increased to a peak of 17.8 per cent in 2010, the highest
unemployment rate of the entire post-reform period. The rate
then fell slightly to 11.7 per cent in 2012, i.e. similar to the
periods (Burneika, 2012).
sum invested in Lithuania has grown 18 times, from LTL 755
per inhabitant in 1996 to LTL 14,059 per inhabitant in 2012.
The amount of money invested and the number of inves-
tors still show an increase (Figure 2). Constant growth also
occurred in the added value created by the employed popula-
in 1996 the added value created by the employed population
was only LTL 8.2 thousand per inhabitant, whereas in 2012
the average level of this indicator had reached LTL 31.3
thousand per inhabitant (Figure 2).
During the period of analysis, the level of construction
activity were varied. Between 1996 and 2004 the num-
60 20
16
1854
Tota
l p
op
. den
sity
(in
h/k
m2)
Rura
l p
op
. den
sity
(in
h/k
m2)
42 14
48
1996
1998
2000
2002
2004
2006
2008
2010
2012
total rural
(a
0 0
-3
-1
-4
-2
-6
Net
mig
rati
on (
‰)
Rat
e of
nat
ura
l in
crea
se (
‰)
-30 -5
-18
-12
-24
1996
1998
2000
2002
2004
2006
2008
2010
2012
migration natural increase
(b
Figure 1: Demographic changes in the post-reform period in
Lithuania: (a) population density and (b) net migration and rate of
natural population increase.
Data source: Statistics Lithuania
Peripheralisation trends in rural territories: the case of Lithuania
125
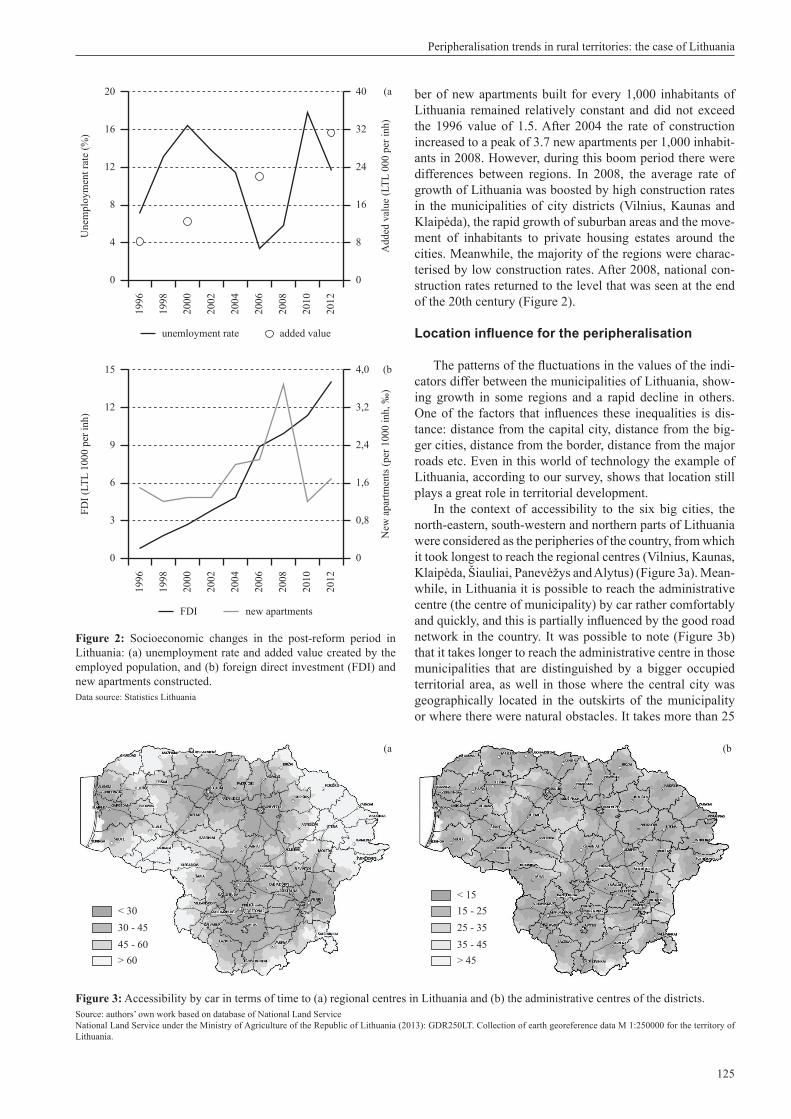
ber of new apartments built for every 1,000 inhabitants of
Lithuania remained relatively constant and did not exceed
the 1996 value of 1.5. After 2004 the rate of construction
increased to a peak of 3.7 new apartments per 1,000 inhabit-
ants in 2008. However, during this boom period there were
differences between regions. In 2008, the average rate of
growth of Lithuania was boosted by high construction rates
in the municipalities of city districts (Vilnius, Kaunas and
-
ment of inhabitants to private housing estates around the
cities. Meanwhile, the majority of the regions were charac-
terised by low construction rates. After 2008, national con-
struction rates returned to the level that was seen at the end
of the 20th century (Figure 2).
-
cators differ between the municipalities of Lithuania, show-
ing growth in some regions and a rapid decline in others.
-
tance: distance from the capital city, distance from the big-
ger cities, distance from the border, distance from the major
roads etc. Even in this world of technology the example of
Lithuania, according to our survey, shows that location still
plays a great role in territorial development.
In the context of accessibility to the six big cities, the
north-eastern, south-western and northern parts of Lithuania
were considered as the peripheries of the country, from which
it took longest to reach the regional centres (Vilnius, Kaunas,
-
while, in Lithuania it is possible to reach the administrative
centre (the centre of municipality) by car rather comfortably
network in the country. It was possible to note (Figure 3b)
that it takes longer to reach the administrative centre in those
municipalities that are distinguished by a bigger occupied
territorial area, as well in those where the central city was
geographically located in the outskirts of the municipality
or where there were natural obstacles. It takes more than 25
< 30
30 - 45
> 60
45 - 60
(a
15 - 25
25 - 35
> 45
35 - 45
< 15
(b
Figure 3: Accessibility by car in terms of time to (a) regional centres in Lithuania and (b) the administrative centres of the districts.
Source: authors’ own work based on database of National Land Service
National Land Service under the Ministry of Agriculture of the Republic of Lithuania (2013): GDR250LT. Collection of earth georeference data M 1:250000 for the territory of
Lithuania.
20 40
8
24
16
3216
Unem
plo
ym
ent
rate
(%
)
Added
val
ue
(LT
L 0
00 p
er i
nh)
0 0
8
12
4
1996
1998
2000
2002
2004
2006
2008
2010
2012
unemloyment rate added value
(a
15 4,0
0,8
2,4
1,6
3,212
FD
I (L
TL
1000 p
er i
nh)
New
ap
artm
ents
(p
er 1
000 i
nh, ‰
)
0 0
6
9
3
1996
1998
2000
2002
2004
2006
2008
2010
2012
FDI new apartments
(b
Figure 2: Socioeconomic changes in the post-reform period in
Lithuania: (a) unemployment rate and added value created by the
employed population, and (b) foreign direct investment (FDI) and
new apartments constructed.
Data source: Statistics Lithuania

126
minutes to reach the administrative centre from only a small
part of the territory of Lithuania. Most of the territories from
which it takes 35, 45 or more minutes to reach the admin-
istrative centre are located in eastern and central Lithuania
(Figure 3b).
The relationship between location and peripherality in
the different districts of Lithuania was illustrated by sta-
-
cult to access are depopulating faster than rural settlements
on the outskirts of the bigger Lithuanian cities or the cit-
ies that serve as the centres of the district. These inequali-
ties between settlements of different locations according to
centre-periphery factor are presented next.
Rural settlement development
trends in the 21st century
During the period 2001-2011 the population density
decreased in 74 per cent of rural settlements in Lithuania,
including 8.1 per cent where the settlements became com-
pletely depopulated. In 18.5 per cent of settlements the num-
ber of inhabitants increased, while in 7.5 per cent of settle-
ments the population level remained unchanged.
Around the three biggest cities of Lithuania (in the
where the overall population increased, the rural popula-
tion increased in 35-40 per cent of rural settlements and
decreased in approximately 50 per cent of them (Figure 4).
In those settlements in the outskirts of Vilnius, Kaunas and
Klaip da, where the population increased, the speed of
growth has exceeded several-fold the speed of population
decline in those villages where the population decreased.
By contrast, in the peripheral territories in the surround-
ings of small towns, in those villages where the population
increased, the speed of growth was several-fold slower than
the speed of population decline in those villages where the
number of population decreased.
The survey showed that the development trends of the
settlements depend on both geographical position and the
size of the settlement. The speed of depopulation was fast-
est in the smallest rural settlements, while in the biggest vil-
lages (with populations of more than 2000) the population
increased. However, it was the case that most of the big rural
settlements were on the outskirts of larger cities (Vilnius,
Spatial distribution trends of
occupation of the rural population
The importance of traditional activities of rural territories
In recent years about 9 per cent of the employed popula-
tion of Lithuania and about 27 per cent of the employed
rural population worked in those sectors (in 1989 56.0 per
cent of the employed rural population worked in agriculture
and forestry). Therefore, more than 70 per cent of the rural
population of Lithuania works in sectors other than farming.
It means that rural territories are not anymore the places of
residence for farmers and forestry workers only.
In Soviet times a great part of the rural population
worked in their settlements of residence or close by. Now
it is the opposite: more than 50 per cent of the population
of rural settlements works outside their villages. The rela-
tionship between the population that works in the settle-
ment where they live and the population that goes to work
in other territories depends on the supply of employment in
the settlement itself and the location of the settlement with
regard to the city system. According to the population census
of 2011, more than 50 per cent of the employed population
of rural settlements in the municipalities that were in the
economic hinterland of big cities (regional centres) worked
outside their place of residence. In the remote municipalities
The average density of the
rural settlements (100 km2)
in municipalities in 2011
9-10
11-20
31-40
41-50
21-30
Settlements where the population declined
Settlements where the population did not change
Settlements where the population increased
City municipalities
500-989
250-500
100-250
7-100
The number of the
rural settlements
with residents in 2011
The changes during 2001-2011 (%)
Figure 4: Average density of rural settlements in Lithuanian municipalities in 2011 and changes in the numbers of inhabitants in rural
settlements in the period 2001-2011.
Source: authors’ own work based on Census data of Statistics Lithuania
Peripheralisation trends in rural territories: the case of Lithuania
127
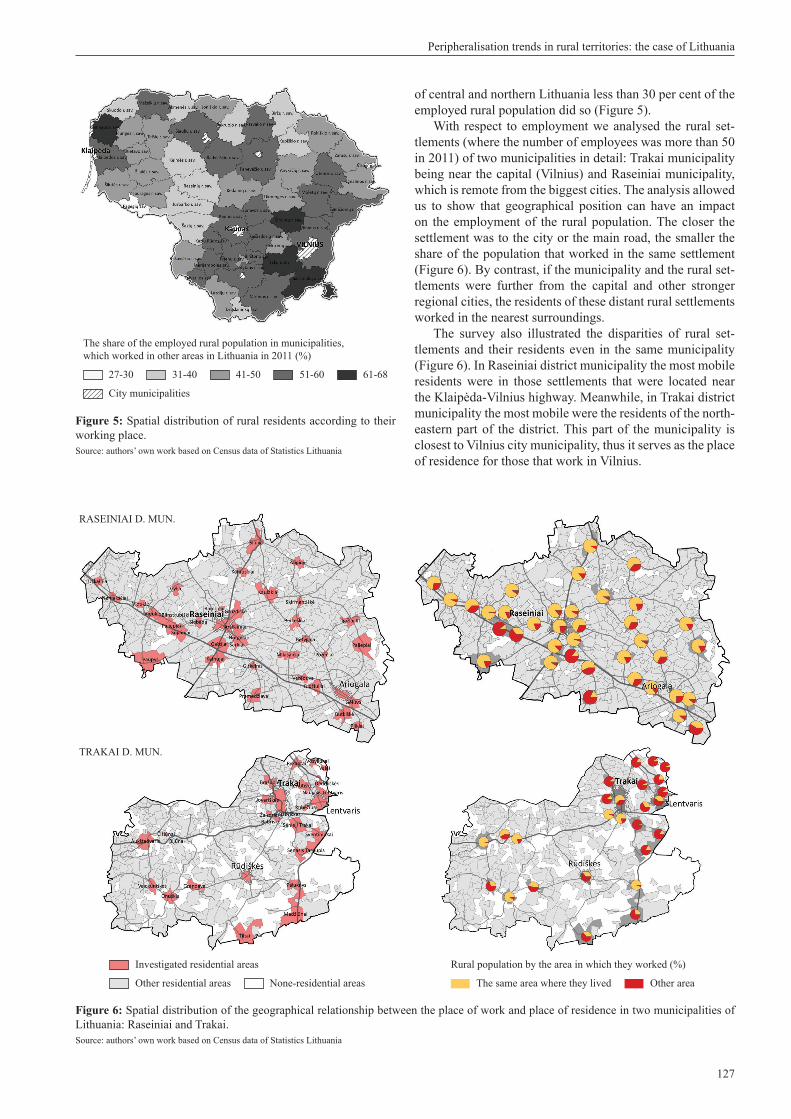
of central and northern Lithuania less than 30 per cent of the
employed rural population did so (Figure 5).
With respect to employment we analysed the rural set-
tlements (where the number of employees was more than 50
in 2011) of two municipalities in detail: Trakai municipality
being near the capital (Vilnius) and Raseiniai municipality,
which is remote from the biggest cities. The analysis allowed
us to show that geographical position can have an impact
on the employment of the rural population. The closer the
settlement was to the city or the main road, the smaller the
share of the population that worked in the same settlement
(Figure 6). By contrast, if the municipality and the rural set-
tlements were further from the capital and other stronger
regional cities, the residents of these distant rural settlements
worked in the nearest surroundings.
The survey also illustrated the disparities of rural set-
tlements and their residents even in the same municipality
(Figure 6). In Raseiniai district municipality the most mobile
residents were in those settlements that were located near
municipality the most mobile were the residents of the north-
eastern part of the district. This part of the municipality is
closest to Vilnius city municipality, thus it serves as the place
of residence for those that work in Vilnius.
City municipalities
27-30 31-40 41-50 51-60 61-68
The share of the employed rural population in municipalities,
which worked in other areas in Lithuania in 2011 (%)
Figure 5: Spatial distribution of rural residents according to their
working place.
Source: authors’ own work based on Census data of Statistics Lithuania
RASEINIAI D. MUN.
TRAKAI D. MUN.
Investigated residential areas
Other residential areas None-residential areas The same area where they lived Other area
Rural population by the area in which they worked (%)
Figure 6: Spatial distribution of the geographical relationship between the place of work and place of residence in two municipalities of
Lithuania: Raseiniai and Trakai.
Source: authors’ own work based on Census data of Statistics Lithuania

128
Changes in the functions of rural
settlements and centre-periphery factor
While the importance of traditional rural activities
decreases in the rural territories the demand for rural terri-
tories for other activities increases. The most important of
these include the demand in rural territories on the outskirts
of larger settlements for the construction of dwellings and
the demand for rural territories for the relaxation of citizens
in the recreation districts. In the municipalities around the
settlements (up to 20-30 km from the city centre) are already
formed and are developing further. Around the smaller cities
(the centres of municipalities), areas of suburban settlements
are also forming (only accordingly smaller ones). In the rural
territories where there is a demand for recreation, the number
of summer visitors is increasing several-fold and the differ-
ence between the winter and summer population levels is
increasing.
The changes in rural settlements attributable to the fac-
tor of centre-periphery take place in the general historically
created background of regional differences. North-eastern
by bigger rural settlements. In the different regions of Lithu-
ania, depending on the geographical position with regard to
the centre-periphery, the functions of rural settlements have
changed in different ways, as described above. However, in
most rural territories of Lithuania depopulation of the vil-
lages is occurring.
During our survey we investigated the changes in insti-
tutions and service establishments in the rural settlements.
This analysis showed that institutions in rural settlements are
rapidly disappearing.
Firstly, most of the kindergartens in the smaller rural
settlements have been closed. In Soviet times it was normal
to have a kindergarten in every kolkhoz central settlement.
After the Soviet Union collapsed, these central settlements
lost both their importance and their residents of working
Thus, in six years (from 1989 to 1995) the number of kinder-
gartens in rural territories decreased by over 75 per cent and
the number is still falling (Figure 7). Although during the
last decade the number of kindergartens has changed only
slowly, a fundamental difference is evident between rural
and urban territories: in the cities the number of kindergar-
tens has recently increased after a period of stability, whereas
in the villages the decline is continuing. Our survey under-
lined that the number of kindergartens depends on the size of
the settlement and its place in the hierarchy of settlements.
According to the survey data, the kindergartens remained in
the bigger settlements where the number of residents was not
less than 600. However, in recent years multifunctional cen-
tres have begun to be established in the smaller rural settle-
ments, where the education of groups of pre-school children
is projected to be one of the activities.
The speed of decline in the number of schools is also
very rapid. Practically all primary schools are being closed,
and the closing of basic schools was related to local factors
(activity of the community, the role of wards, geographical
position etc.). Where schools of neighbouring village com-
pete for survival it is often the case that one of the schools
is closed and other is renovated. Meanwhile, the libraries
remain in almost all settlements where they used to be.
The survey also showed that in practically all rural set-
tlements the former kolkhoz catering institutions have disap-
peared. These catering institutions have remained (or new
ones have been established) only in some settlements in the
outskirts of bigger cities, near the main roads or in the rec-
reation regions. They do not serve local people but rather
the visitors or passing trade. Meanwhile, according to the
data collected during our survey, the number of shops in
the rural settlements remained similar in comparison with
Soviet times. The concentration of shops was noted in the
bigger settlements. While visiting the rural settlements we
the rural settlement. Shops belonging to supermarket chains
were present in villages with not less than 300 residents.
Private shops not belonging to the supermarket chains were
found in the smaller villages. Meanwhile, in the smallest vil-
lages (<100 population) the residents were usually served by
mobile shops visiting the settlements.
have survived in most former central kolkhoz settlements but
their hours of operation have been reduced, with some work-
ing only for a couple of hours per day. In most settlements
the cultural centres were abandoned or badly neglected. In
recent years, however, these centres have been renovated at
a rapid rate and have become the multifunctional centres for
the village residents.
During recent years in Lithuania the activity of local
rural communities has increased: in almost every bigger
being implemented, public squares and central parts of the
settlements are renewed, multifunctional centres are being
created, and so on. On the other hand, owing to the depopu-
lation and ageing society the possibilities for government,
the institutions of the districts or local rural communities to
processes in Lithuania are weak.
1200
900
Num
ber
of
kin
der
gar
tens
0
600
300
1990 1991 1995 2000 2005 2010 2013
urban rural
Figure 7: Numbers of kindergartens in urban and rural areas of
Lithuania during the period 1990-2013.
Data source: Statistics Lithuania

Peripheralisation trends in rural territories: the case of Lithuania
129
References
Amcoff, J. and Westholm, E. (2007): Understanding rural change –
demography as a key to the future. Futures 39, 363-379. http://
dx.doi.org/10.1016/j.futures.2006.08.009
Becker, C. and Bloom, D. (1998): The Demographic Crisis in the
Former Soviet Union: Introduction. World Development 26 (11),
1913-1919. http://dx.doi.org/10.1016/S0305-750X(98)00097-7
Bihari, Zs. and Kovács, K. (2006): Slopes and slides: spatial in-
equalities in employment opportunities in Hungary at the turn
Conclusions
The general trend is of negative change in Lithuania,
are able to maintain their demographic and socioeconomic
potential. In the greater part of Lithuania the process of
peripheralisation is taking place. The constant rural depopu-
lation underlines that many rural territories are in a state of
permanent ‘backwardness’ relative to areas that are more
attractive for living such as the cities or even foreign coun-
tries. The peripheralisation process is clearest in the north-
eastern part of Lithuania where there is no city that could
serve as a centre of attraction.
rural territories is that of ‘centre-periphery’, which functions
in the context of different historically formed settlement
networks and natural conditions. The main instrument of
this factor is the territorial distribution of work places. The
better-paid places of work that exist in the bigger cities and
their outskirts determine their greater attractiveness. Data on
the share of the employed rural population and the distribu-
tion of their work places illustrate the decrease of traditional
activities in rural territories and the mobility of rural popu-
lation. Such a situation can lead to the migration of more
mobile residents to places closer to centres of employment
(usually the bigger cities or their outskirts).
The concentration of population in the cities and their
outskirts and the depopulation of peripheral territories are
natural processes that change the territorial residential sys-
kolkhoz
structure. If these trends continue, the transformation of
rural territories could occur in several directions. The rural
territories on the outskirts of bigger cities will become the
residential quarters for city residents. Those in the recrea-
tional regions of Lithuania will be transformed into to sum-
mer residential settlements. Meanwhile, the rural territories
in the periphery will become sparsely populated agricultural
and forestry regions. Such scenarios show that some rural
settlements are capable of adjusting to the demands of the
changing society, whereas the others lag behind and are con-
demned to slow (or fast) oblivion.
Acknowledgement
This article presents research that is funded by a grant
(No. MIP-006/2013) received from the Research Council of
Lithuania.
of the millennium, Europa XXI. Core and peripheral regions in
Central and Eastern Europe 14, 77-94.
(2013): The impact of Vilnius city on the transformation trends
of the sparsely populated EU east border region. Etniškumo
Studijos 2, 50-69.
Burneika, D. (2012). Transformations in Lithuania – factors of
change and regional patterns, in G. Gorzelak et al. (eds), Adapt-
ability and Change: The Regional Dimensions in Central and
Eastern Europe. Drelow: Poligraf, 267-283.
Churski P., Burneika, D. and Korec, P. (2014): Areas of economic
growth and areas of stagnation as objects of special intervention
in the regional policies: an international comparison, in P. Chur-
ski (ed.), The social and economic growth vs. the emergence
of economic growth and stagnation areas. Poznan: Bogucki
Wydawnictwo Naukowe, 151-188.
Czyz, T. (2002): Application of the potential model to the analysis
of regional differences in Poland. Geographia Polonica 75, 13-
24.
-
lation in EU countries and distribution of sparsely populated
8, 31-36.
Dijkstra, L. and Poelman, H. (2008): Remote Rural Regions. How
Regional Focus no. 1/2008, DG Regio. Brussel: European
Commission.
(ed.), Regional processes and spatial structures in Hungary in
the 1990’s. Pécs, Hungary: Regionális Kutatások Központja,
316-327.
Grossmann, K., Haase, A., Rink, D. and Steinführer, A. (2008):
of a Cross-National Transfer of Research Approaches, in M.
Novak and M. Nowosielksi (eds), Declining Cities / Develop-
ing Cities: Polish and German Perspectives. Poznan: Instytut
Zachodni, 77-99.
-
port system analysis and ranking in Lithuanian administrative
regions. Transport XXII (3), 214-220.
Jonard, F., Lambotte, M., Ramos, F., Terres, J.M. and Bamps, C.
(2009): Delimitation of rural areas in Europe using criteria of
and Technical Report. Brussel: European Commission.
rural territories in 1990-2010. Geopolitical Studies 16, 199-212.
-
of settlement network of the most sparsely populated territories
46, 32-45.
Krisjane, Z. (2001): New Trends in the Development of small
9, 33-47.
Lang, T. (2011): Regional development issues in Central and East-
ern Europe: shifting research agendas from a focus on peripher-
ies to peripheralisation? in A. Eröss and D. Karacsonyi (eds),
Geography in Visegrad and Neighbour Countries. Budapest,
GRI HAS, 57-64.
Lang, T. (2012): Shrinkage, Metropolization and Peripheralization
in East Germany. European Planning Studies 20 (10), 1747-
1754. http://dx.doi.org/10.1080/09654313.2012.713336
fondas 2013 m. sausio 1 d. [The land fund of the Republic of
Lithuania, 1 January 2013]. Vilnius: National Land Service un-
der the Ministry of Agriculture and the State Enterprise Centre
of Registers.
Nagy, E. (2005): Urban Development in Post-transition Hungary:
130
-
ographia Polonica 78 (1), 137-151.
Nagy, G. (2006): Economic potential of regions – modelling the
spatial structure of Hungary in the period of transition. Europa
XXI. Core and peripheral regions in Central and Eastern Eu-
rope 14, 7-26.
Otto, M. and Chmielewska, M. (2014). Social inclusion by revitali-
sation? The potential of disused industrial areas as an opportu-
nity for mitigating social polarisation. Quaestiones geographi-
cae 33 (2), 115-125.
Pallagst, K. (2010): Viewpoint: The Planning Research Agenda:
Shrinking Cities, a Challenge for Planning Cultures. Town Plan-
ning Review 81 (5), 1-6. http://dx.doi.org/10.3828/tpr.2010.22
Raagmaa, G. (1996): Shifts in regional development of Estonia dur-
ing the transition. European Planning Studies 4 (6), 683-703.
http://dx.doi.org/10.1080/09654319608720374
Raagmaa, G. (2003): Centre-periphery model explaining the re-
gional development of informational and transitional society.
Paper presented at the 43rd Congress of the European Regional
Science Association, Jyväskylä, Finland, 27-30 August 2003.
Reckien, D. and Martinez-Fernandez, C. (2011): Why Do Cities
Shrink? European Planning Studies 19 (8), 1375-1397. http://
dx.doi.org/10.1080/09654313.2011.593333
Republic of Lithuania (1994): Republic of Lithuania Law on the
Territorial Administrative Units of the Republic of Lithuania
60-1183.
Schurmann, C. and Spiekermann, K. (2006): Accessibility Analysis
of the Baltic Sea Region. Final Report for the Baltic Sea Region
INTERREG IIIB Secretariat. Dortmund: Spiekermann & Weg-
ner Urban and Regional Research, and Oldenburg in Holstein:
Spatial Planning and Geoinformation (RRG).
Scott, A. and Storper, M. (2003): Regions, Globalization, Develop-
ment. Regional Studies 37 (6-7), 579-593. http://dx.doi.org/10.
1080/0034340032000108697a
the Revanchist City. New York: Routledge.
Sobotka, T., Zeman, K. and Kantorova, V. (2003): Demographic
Shifts in the Czech Republic after 1989: A second Demographic
Transition View. European Journal of Population 19 (3), 249-
260. http://dx.doi.org/10.1023/A:1024913321935
Timár, J. and Kovács, Z. (2009): Hinterland Development, in R.
Kitchin and N. Thrift (eds), International Encyclopaedia of Hu-
man Geography (Volume 5). Oxford: Elsevier, 128-135. http://
dx.doi.org/10.1016/B978-008044910-4.00843-9
Tóth, G. (2006): Centre-Periphery Analysis about the Hungarian
Public Road System. Paper presented at the 46th Congress of
the European Regional Science Association, Volos, Greece, 30
August – 3 September 2006.