peripheral nervous system function, physical activity...
TRANSCRIPT

PERIPHERAL NERVOUS SYSTEM FUNCTION, PHYSICAL ACTIVITY AND PHYSICAL FITNESS IN OLDER ADULTS
by
Brittney Susanne Lange-Maia
BS in Exercise Science, Indiana University-Purdue University Indianapolis, 2009
MPH in Epidemiology, University of Pittsburgh 2010
Submitted to the Graduate Faculty of
the Graduate School of Public Health in partial fulfillment
of the requirements for the degree of
Doctor of Philosophy
University of Pittsburgh
2015

UNIVERSITY OF PITTSBURGH
GRADUATE SCHOOL OF PUBLIC HEALTH
This dissertation was presented
by
Brittney Susanne Lange-Maia
It was defended on
April 10, 2015
and approved by
Dissertation Advisor
Elsa S. Strotmeyer, PhD, MPH Assistant Professor, Department of Epidemiology
Graduate School of Public Health, University of Pittsburgh
Anne B. Newman, MD, MPH Chair, Department of Epidemiology
Graduate School of Public Health, University of Pittsburgh
Jane A. Cauley, DrPH Professor, Department of Epidemiology
Graduate School of Public Health, University of Pittsburgh
Robert M. Boudreau, PhD Assistant Professor, Department of Epidemiology
Graduate School of Public Health, University of Pittsburgh
John Jakicic, PhD Chair, Department of Health and Physical Activity
School of Education, University of Pittsburgh
ii

Copyright © by Brittney Susanne Lange-Maia
2015
iii

ABSTRACT
Peripheral nervous system function (PNS) impairments are often unappreciated as risk
factors for major geriatric outcomes. This dissertation aimed to examine the mechanism of these
consequences of poor PNS function. The relationships of sensorimotor peripheral nerve function
and physical activity (PA), longitudinal physical fitness assessed via endurance walking
performance, and the associations with cardiac autonomic function were investigated. Lower-
extremity sensorimotor impairments have been linked to poor mobility-related outcomes, while
cardiac autonomic impairments are associated with increased risk of cardiovascular outcomes
and death. Ultimately, both divisions play important roles in the ability of older adults to be
physically active and remain independent. Diabetes-related PNS impairments may present
challenges for maintaining PA and endurance, though this work has not been extended to age-
related PNS dysfunction. In addition, sensorimotor and autonomic function are rarely examined
together, despite being components of the same system.
First, worse sensorimotor peripheral nerve function in older men from the Pittsburgh site
of the Osteoporotic Fractures in Men Study was found to be associated with lower levels of self-
reported and objectively measured daily PA. In particular, worse amplitude, which indicates
axonal degeneration, was associated with lower levels of objectively measured activity. In the
Health, Aging and Body Composition Study (Health ABC) sensorimotor peripheral nerve
Elsa S. Strotmeyer, PhD
PERIPHERAL NERVOUS SYSTEM FUNCTION, PHYSICAL ACTIVITY AND PHYSICAL FITNESS IN OLDER ADULTS
Brittney Susanne Lange-Maia
University of Pittsburgh, 2015
iv
impairments were related to lower physical fitness, evident through slower endurance walking
and greater rate of slowing over six years of follow-up. Those with sensory peripheral nerve
impairments completed the long distance corridor walk approximately 15 seconds slower than
those without impairments, and these impairments had an additional four seconds of slowing per
year. Finally, in Health ABC worse lower extremity sensorimotor function was associated with
poorer cardiac autonomic function.
PNS impairments appear to play major roles in the disability pathway in old age and
warrant further study. These findings suggest possible novel mechanisms for these associations,
including lower PA, fitness and endurance, and cardiac autonomic function. Helping older
adults maintain their health and physical function is a major public health priority. Interventions
aimed at promoting PA in those with PNS impairments may be beneficial for reducing poor
outcomes in older adults.
v

TABLE OF CONTENTS
ACKNOWLEDGMENTS ....................................................................................................... XIII
1.0 INTRODUCTION ........................................................................................................ 1
1.1 PERIPHERAL NERVOUS SYSTEM OVERVIEW ....................................... 3
Diseases Associated with Peripheral Nervous System Dysfunction ............ 4 1.1.1
1.1.1.1 Similarities to Peripheral Arterial Disease ......................................... 5
Autonomic Nervous System Function and the Cardiovascular System ..... 6 1.1.2
1.2 SENSORIMOTOR PERIPHAL NERVOUS SYSTEM FUNCTION IN
OLDER ADULTS ................................................................................................................. 7
Signs and Symptoms of Sensorimotor Peripheral Nerve Function 1.2.1
Impairments ................................................................................................................. 8
Epidemiology in the General Population of Older Adults ........................... 9 1.2.2
Sensorimotor Peripheral Nerve Function Assessment Methods ............... 13 1.2.3
1.2.3.1 Nerve Conduction Studies .................................................................. 13
1.2.3.2 Quantitative Sensory Testing ............................................................. 14
Risk Factors for Sensorimotor Peripheral Nerve Function Impairments 16 1.2.4
1.2.4.1 Peripheral Neuropathy in Diabetes ................................................... 23
1.2.4.2 Disease-Related Peripheral Neuropathy ........................................... 25
Biomechanical Impact of Sensorimotor Peripheral Nerve Impairments . 27 1.2.5
vi
Sensorimotor Peripheral Nerve Function and Walking Endurance ........ 28 1.2.6
1.3 AUTONOMIC PERIPHERAL NERVOUS SYSTEM FUNCTION IN
OLDER ADULTS ............................................................................................................... 29
Cardiovascular Autonomic Neuropathy ..................................................... 29 1.3.1
Cardiac Autonomic Function Assessment Methods ................................... 30 1.3.2
1.3.2.1 Heart Rate Variability ........................................................................ 30
1.3.2.2 Bedside Autonomic Function Batteries ............................................. 32
1.3.2.3 Resting Heart Rate .............................................................................. 33
1.3.2.4 Heart Rate during Exercise Testing .................................................. 34
Risk Factors for Cardiac Autonomic Neuropathy ..................................... 35 1.3.3
Autonomic Nervous System Function in Diabetes ...................................... 37 1.3.4
1.4 PHYSICAL ACTIVITY AND PERIPHERAL NERVOUS SYSTEM
FUNCTION ......................................................................................................................... 39
Evidence of Physical Activity Improving Sensorimotor Peripheral Nerve 1.4.1
Function ...................................................................................................................... 39
1.4.1.1 Physical Activity and Sensorimotor Peripheral Nerve Function:
Animal Models ................................................................................................... 44
Evidence of Physical Activity Improving Cardiac Autonomic Function . 45 1.4.2
1.5 PHYSICAL ACTIVITY AND OLDER ADULTS.......................................... 49
Physical Activity Definitions and Recommendations ................................. 50 1.5.1
Physical Activity Epidemiology in Older Adults ........................................ 52 1.5.2
Methodological Issues in Measuring Physical Activity in Older Adults .. 53 1.5.3
vii

1.5.3.1 Sensorimotor Peripheral Nerve Function Impairments and Exercise
Prescription ........................................................................................................ 60
1.5.3.2 Cardiac Autonomic Function Impairments and Exercise
Prescription ........................................................................................................ 60
1.6 SPECIFIC AIMS ............................................................................................... 61
Sensorimotor Peripheral Nerve Function and Physical Activity .............. 61 1.6.1
Sensorimotor Peripheral Nerve Function and Endurance Walking 1.6.2
Performance................................................................................................................ 62
Sensorimotor Peripheral Nerve Function and Indicators of Cardiac 1.6.3
Autonomic Function .................................................................................................. 63
2.0 SENSORIMOTOR PERIPHERAL NERVE FUNCTION AND PHYSICAL
ACTIVITY IN OLDER MEN.................................................................................................... 64
2.1 INTRODUCTION ............................................................................................. 65
2.2 METHODS ......................................................................................................... 67
Participants .................................................................................................... 67 2.2.1
Peripheral Nerve Function Examination .................................................... 68 2.2.2
Physical Activity Assessment ........................................................................ 69 2.2.3
Covariates ....................................................................................................... 71 2.2.4
Statistical Analyses ........................................................................................ 71 2.2.5
2.3 RESULTS ........................................................................................................... 72
2.4 DISCUSSION ..................................................................................................... 80
viii

3.0 SENSORIMOTOR PERIPHERAL NERVE FUNCTION AND THE
LONGITUDINAL RELATIONSHIP WITH ENDURANCE WALKING IN THE
HEALTH, AGING AND BODY COMPOSITION STUDY ................................................... 85
3.1 INTRODUCTION ............................................................................................. 86
3.2 METHODS ......................................................................................................... 88
Participants .................................................................................................... 88 3.2.1
Endurance Walking Assessment .................................................................. 90 3.2.2
Peripheral Nerve Function Examination .................................................... 90 3.2.3
Additional Covariates.................................................................................... 91 3.2.4
Statistical Methods ........................................................................................ 93 3.2.5
3.3 RESULTS ........................................................................................................... 94
3.4 DISCUSSION ................................................................................................... 101
4.0 SENSORIMOTOR AND CARDIOVASCULAR AUTONOMIC PERIPHERAL
NERVE FUNCTION IN OLDER ADULTS IN THE HEALTH, AGING AND BODY
COMPOSITION STUDY ......................................................................................................... 105
4.1 INTRODUCTION ........................................................................................... 106
4.2 METHODS ....................................................................................................... 108
Participants .................................................................................................. 108 4.2.1
Sensorimotor Peripheral Nerve Function ................................................. 110 4.2.2
Cardiac Autonomic Function ..................................................................... 111 4.2.3
Covariates ..................................................................................................... 112 4.2.4
Statistical Methods ...................................................................................... 114 4.2.5
4.3 RESULTS ......................................................................................................... 115
ix

4.4 DISCUSSION ................................................................................................... 122
5.0 DISSERTATION DISCUSSION ............................................................................ 127
5.1 SUMMARY OF FINDINGS ........................................................................... 127
5.2 PUBLIC HEALTH SIGNIFICANCE............................................................ 130
5.3 FUTURE DIRECTIONS................................................................................. 132
BIBLIOGRAPHY ..................................................................................................................... 135
x

LIST OF TABLES
Table 1: Risk Factors for Sensorimotor Peripheral Nerve Function Impairments Identified in
Epidemiologic Studies .................................................................................................................. 19
Table 2: Causes of Clinical Peripheral Neuropathy ..................................................................... 26
Table 3: Common Tools Used to Measure Physical Activity...................................................... 56
Table 4: Participant Characteristics by Tertile of Average Daily METS .................................... 74
Table 5: Peripheral Nerve Function and Physical Activity by Tertile of Average Daily METS 75
Table 6: Participant Characteristics by Long Distance Corridor Walk (LDCW) Eligibility and
Completion in the Health, Aging, and Body Composition Study 2000/01 Clinic Visit ............... 96
Table 7: Peripheral Nerve Function by LDCW Eligibility/Completion Group ........................... 97
Table 8: Peripheral nerve functioning and longitudinal performance in LDCW from 2000/01 to
2006/07 in the Health, Aging and Body Composition Study ..................................................... 100
Table 9: Health ABC 2000/01 Clinic Visit Participant Characteristics by Sex ......................... 116
Table 10: Sensorimotor and Cardiac Autonomic Function by Sex ........................................... 117
Table 11: Correlation* Matrix of Continuous Sensorimotor and Autonomic Function Measures
..................................................................................................................................................... 118
xi

LIST OF FIGURES
Figure 1: Conceptual Model for the Relationship between the Peripheral Nervous System,
Physical Activity, and Physical Fitness in older Adults ................................................................. 3
Figure 2: Participant Flow Diagram from the MrOS Pittsburgh Site .......................................... 68
Figure 3: Adjusted Means of Total Physical Activity Scale for the Elderly (PASE) Score by
Peripheral Nerve Function ............................................................................................................ 77
Figure 4: Mean Minutes Spent in Light, Moderate, and Vigorous Activity per Day by Motor and
Sensory Amplitude........................................................................................................................ 79
Figure 5: Participant Flow Diagram for the Health ABC Cohort ................................................ 89
Figure 6: Participant Flow Chart for the 2000/01 Health ABC Clinic Visit ............................. 110
Figure 7: Mean Unadjusted Resting Heart Rate by Sensorimotor Function ............................. 119
Figure 8: Unadjusted Odds of Orthostatic Hypotension by Sensorimotor Function ................. 120
Figure 9: Adjusted Heart Rate Range During the LDCW By Monofilament Detection ........... 122
xii

ACKNOWLEDGMENTS
I would like to thank my dissertation chair and primary advisor, Dr. Elsa Strotmeyer for
her support, guidance, and patience. I also sincerely thank each of my dissertation committee
members: Dr. Anne Newman for sharing her wisdom and teaching me to be a better writer and
epidemiologist; Dr. Jane Cauley for her encouragement and willingness to talk through and
develop ideas; Dr. Robert Boudreau for his insightful statistical guidance; and Dr. John Jakicic
for challenging me to think critically and better understand physical activity issues for older
adults. I also owe a great deal of gratitude to Dr. Nancy Glynn. She and Dr. Newman helped me
through a very difficult time in my life, and I will forever be thankful for their support.
Undoubtedly, I would not be in the position to be defending a dissertation without Dr. Nicole
Keith, my undergraduate mentor who helped me navigate the process of entering the world of
academic and scientific research.
I owe a great deal of thanks to my loving husband Francisco. Throughout this process he
has been my biggest supporter, and I am excited to see what our future holds. I also thank my
dad, brother, grandparents and numerous aunts, uncles, cousins and friends for their continued
encouragement. Of course I cannot thank my family without also including my sheepdog,
Ringo, who probably deserves his own honorary degree from listening to all of my practice
presentations.
xiii

Finally, as Abraham Lincoln eloquently stated, “All I am or ever hope to be, I owe to my
angel mother.” My mom was always my greatest advocate, and she never let me believe that
anything but the sky was the limit. She made great sacrifices to help me become the woman I
am today, and I hope that she would be proud of who I have become.
xiv
1.0 INTRODUCTION
Declines in aerobic fitness and associated cardiorespiratory changes are hallmarks of the
aging process [1-7]. Previous studies have suggested that aerobic fitness peaks in the early to
mid-20s and decreases thereafter, with the steepest decline observed after the age of 45 [5,7-11].
Age-related declines in maximal heart rate, forced expiratory volume, and lean body tissue seem
to explain much of the observed aerobic fitness deterioration [12-14]. Low aerobic fitness can
lead to functional limitations and disability [15], and is associated with increased risk of all-
cause mortality [16,17].
Though physical activity and exercise are known to increase physical fitness [18-20],
many reasons exist as to why adopting an active lifestyle is difficult—particularly for older
adults [21]. Behavioral scientists have played an integral role in developing lifestyle
interventions aimed at increasing physical activity (PA) for the prevention and treatment of
diabetes [22], obesity [22,23] and other conditions, however, the general population remains
primarily inactive [24]. This inactivity is even more pronounced in older adults [25], who are
often cited as the least active age group [24,26]. Exploring the impact that conditions associated
with aging have on exercise and PA participation, and conversely, the impact that activity can
have on these conditions remains a necessary area of investigation. Inactivity can lead to
reduced aerobic fitness, which can then lead to a downward spiral of further inactivity and
reduced fitness, making even simple daily activities taxing and fatiguing [27]. Due to the
1

heterogeneity of older adults in terms of health status and functional ability, strategies to increase
activity specific to certain prevalent conditions will be valuable for increasing PA overall in
older adults.
Damage to the peripheral nervous system—which encompasses the autonomic and
sensorimotor divisions—occurs during the aging process, even in the absence of diabetes [28-
30]. Sensorimotor peripheral nerve function is worse in old age, and lower sensorimotor
peripheral nerve function in older adults is related to worse lower extremity function [31-34],
bone density [35], strength [36] and power [37], as well as an increased risk for falls [38-41].
Age-related impairments in autonomic function negatively impact cardiovascular system
function [42]. However, the relationship between exercise and physical activity participation
with these impairments has been largely unexplored, despite the potential for exercise and PA
participation to influence each of these outcomes. PA could potentially be in the pathway
between peripheral nerve function impairments and worse lower-extremity and cardiovascular
outcomes. Some work has been done in investigating the influence of nervous system function
on PA and physical fitness, but this work has primarily focused on central nervous system
function [43-47] or specific neurologic disorders, like Parkinson disease [48,49] and multiple
sclerosis [50,51]. The association between the peripheral nervous system and PA or fitness on
the other hand, remains a relatively unexplored area. Figure 1 outlines the conceptual model
linking physical activity, physical fitness, and the contribution of peripheral nervous system in
older adults. The purpose of this dissertation is to identify and address gaps in the literature
pertaining to peripheral nervous system function in older adults and its association with physical
activity and fitness.
2

Figure 1: Conceptual Model for the Relationship between the Peripheral Nervous System,
Physical Activity, and Physical Fitness in older Adults
1.1 PERIPHERAL NERVOUS SYSTEM OVERVIEW
The peripheral nervous system (PNS) includes the nerves and ganglia outside of the brain
and spinal cord. These nerves control automatic functions of the body and provide information
to the central nervous system about the external environment. The PNS is divided into two
distinct divisions: the sensorimotor division which provides awareness of and response to
3

surroundings and the external environment to the through sensory and motor nerves, and the
autonomic system which is largely responsible for monitoring and maintaining the internal
environment of the body. The autonomic nervous system controls the automatic functions of the
body, including regulating heart rate and blood pressure, bronchial dilation and contraction,
among other functions of the internal organs. The autonomic nervous system is then further
divided to the sympathetic, parasympathetic, and enteric divisions. The sympathetic and
parasympathetic divisions are responsible for automatic functions that help the body to either
prepare the body to respond to a stimulus or help the body conserve energy. Typically, actions
of the sympathetic division are those that are related to the “fight or flight” response while the
parasympathetic division is associated with the “rest and digest” state. Both divisions are
equally important and exist in a crucial balance. The third portion, the enteric division, is also
known as the intrinsic division and exists in the lining of the gastrointestinal system and is the
focus of the field of neurogastroenterology.
Diseases Associated with Peripheral Nervous System Dysfunction 1.1.1
While the central nervous system is protected by the spine, cranium, and blood-brain-
barrier, the peripheral nervous system does not have these protections and can be vulnerable to
chemical and mechanical injuries. A large research focus exists regarding damage to the PNS
caused by diabetes, although PNS impairments can arise during the aging process even in the
absence of diabetes [29-31,42], and these impairments are often asymptomatic [30]. Other
conditions that result in PNS damage include cancer treatment [52], Vitamin B12 deficiency
[53,54], long-term alcohol abuse [55], multiple sclerosis [56], Parkinson’s disease, spinal cord
4

injuries, HIV [57-59] and AIDS [60], Guillain Barre Syndrome [61], heavy metal [62,63] and
toxic chemical exposure [64], and surgery or injuries involving the nerves.
1.1.1.1 Similarities to Peripheral Arterial Disease
Deficits in sensorimotor nerve function often result in loss of sensation or pain in the
extremities, though early and advanced stages of nerve function impairments may be
asymptomatic. While peripheral nervous system dysfunction can impact the upper extremities,
the lower extremities are the focus when considering outcomes related to mobility. Sensorimotor
nerve dysfunction may have parallels to damage that occurs during peripheral arterial disease
(PAD). Although PAD impacts the lower extremities through vascular pathways rather than
through the nervous system, both PAD [65-68] and sensorimotor nerve function impairments
impact lower extremity function [31,34]—a cornerstone for maintaining mobility. Much has
been explored regarding the benefits of physical activity and PAD [69,70] and it is recognized
that PAD may make physical activity and exercise participation difficult [71]. In particular, pain
associated with PAD can lead to the inability to walk long distances, which is also a concern
with sensorimotor nerve function impairments.
Since vasculature and nerve impairments are linked conditions [72,73], the associations
between PAD and mobility can be can be used as a model for exploring the relationship between
peripheral nervous system function and mobility. Work by Ylitalo and colleagues in the National
Health and Nutrition Examination Survey (NHANES) indicates that the 2.5% of the U.S.
population age 40 and older have both sensorimotor peripheral nerve impairments (defined as
10g monofilament insensitivity) and PAD [74]. Under half (48.8%) of those with both
sensorimotor impairment and PAD have diabetes. In this study, those with both conditions were
significantly older than those with neither PAD nor peripheral nerve impairment (age 66.4 ± 2.5
5

vs. 56.2 ± 0.3 years, p<0.001). Exercise induced lower limb ischemia is a common symptom in
peripheral arterial disease. Evidence exists that those with this ischemia have worse sensory
nerve function, and the sensory nerve abnormalities may be linked to the ischemic pain felt
during exercise [75]. Extensive work has been done in examining in the association between
PAD and lower extremity difficulties, and this work could serve as a framework for future
studies in lower extremity sensorimotor peripheral nerve impairments.
Autonomic Nervous System Function and the Cardiovascular System 1.1.2
In contrast to sensorimotor neuropathies which impact the extremities, autonomic nerve
function impairments includes damage to the nerves that carry information from the brain and
spinal cord to the heart, bladder, intestines, sweat glands, pupils, and blood vessels. Autonomic
nerve function impairments lead several conditions, including digestive system issues (vomiting,
constipation, diarrhea, problems swallowing), urinary incontinence, unusually small pupils
(usually occurring only in one eye), and heat intolerance, which is related to sweating and blood
vessel contraction/dilation and sweating issues [76]. Autonomic nerve function impairments
affect many organ systems, but damage to the autonomic nerves in the cardiovascular system is
the form that can most greatly affect exercise and physical activity participation. Cardiac
autonomic neuropathy is associated with increased mortality [77], sudden cardiac death [78], and
silent myocardial infarction [79,80]. Due to the major outcomes associated with cardiac
autonomic nerve function impairments, they are often considered to be the most serious form of
damage to the autonomic nervous system [81]. Like nerve impairments impacting the
sensorimotor nerves, autonomic nerve function impairments are often undiagnosed in older
6
adults [81]. However, the impact of cardiac autonomic nerve function impairments on geriatric
mobility outcomes is largely unknown.
Though sensorimotor and autonomic nerve impairments are seemingly very different,
both play crucial roles in the ability for older adults to be physically active and maintain
functional independence. Sensorimotor nerve dysfunction may adversely affect the ability to use
the lower extremities, while the impairments in autonomic system function may lead to the
inability to the cardiovascular system to respond appropriately to exercise.
1.2 SENSORIMOTOR PERIPHAL NERVOUS SYSTEM FUNCTION IN OLDER
ADULTS
The sensorimotor division of the peripheral nervous system consists of sensory nerves
which detect touch, temperature, pain, vibration, and other sensations, while motor nerves relay
signals from the central nervous system (CNS) that allow for voluntary movement. The sensory
nerves relay information about the environment to the CNS for integration, which then in turn
sends impulses via the motor nerves to lead to motion in response to the environment.
Many methods are used for testing sensorimotor nerve function. Ideally multiple tests
should be used together in order to get a complete picture about both the sensory and motor
nerves. Sensorimotor peripheral nerve function exists on a continuum, which is important to
consider rather than only the presence or absence of clinical neuropathy. From work examining
the progression of peripheral nerve function declines in diabetes, we know that intact nervous
system function is on the highest end of the continuum, followed by asymptomatic subclinical
impairments [82]. Then more pronounced, clinical peripheral nerve function impairments can
7

occur in the absence of symptoms, or symptoms may manifest without evidence on quantitative
tests. The most serious form of nerve function decline is clinical symptomatic peripheral
neuropathy. Compared to diabetes, the progression from intact sensorimotor peripheral nervous
system functioning to nerve impairments and neuropathy may differ for older adults. Currently,
this progression has been inadequately studied in older adults.
Signs and Symptoms of Sensorimotor Peripheral Nerve Function Impairments 1.2.1
Common signs and symptoms of peripheral neuropathy in the lower extremities include
prickling, stabbing, burning, or aching pain; feeling of asleep numbness; weakness or heaviness
in muscles of the extremities; open, persistent sores; gangrene; foot drop (difficulty in lifting one
or both feet) and sensitive skin (more common at night than during the day). Although signs and
symptoms are easy to assess via self-report and are specific to the disease, some of these
symptoms are not sensitive enough to truly identify those with peripheral neuropathy, peripheral
nerve function impairments, or subclinical disease.
Symptoms of neuropathy are often classified as negative or positive symptoms [83],
Negative symptoms include: insensitivity to touch, reduced sensitivity to temperature, loss of
vibratory sensation, or decreased ability to detect sensation from a pin-prick, and are associated
with damage to the large, myelinated sensory fibers. While negative symptoms may be
uncomfortable, they are not painful. Positive symptoms, on the other hand, include: ongoing
superficial pain, pain from light touch or light pressure or non-painful cold or warm stimulus,
tingling, prickling, or burning sensation, itching, pain similar to an electric shock, “pins and
needles” sensation, increased response from a painful stimulus, or any sensation of pain from a
8

stimulus that would not normally cause pain. Positive symptoms are indicative of damage to the
thinly myelinated or unmyelinated small fibers.
Neuropathic pain differs from nociceptive pain in several ways. Nociceptive pain serves
as a warning for impeding tissue damage and is important for survival. Under circumstances
where the nervous system is functioning normally, intense stimuli activate nociceptor primary
sensory neurons, these signals are processed in the CNS, and motor neurons illicit a response in
order to remove the stimulus. Neuropathic pain, on the other hand, arises from damage to the
nerves and provides no survival benefit and can lead to diminished quality of life [84].
Neuropathic pain can arise independently of a stimulus, or from hypersensitivity to a stimulus
that would not normally be painful [84].
Epidemiology in the General Population of Older Adults 1.2.2
Sensorimotor peripheral nerve dysfunction is commonly seen in older adults. In
particular, absent ankle reflexes and vibration sensation loss have at times been thought of as
normal findings in older adults, and have been listed as such in some geriatric text books [85].
However—as in many areas of geriatric research—peripheral nervous system function changes
during the aging process are being more closely examined in the context of geriatric outcomes
(falls, disability, and death).
Prevalence estimates of peripheral neuropathy and nerve function decline vary greatly
depending on population and definitions used. A fundamental aspect of epidemiology is
appropriately determining a case definition. Unfortunately, without clear definitions of
peripheral neuropathy or nerve dysfunction, describing patterns on the population level is
difficult [86]. Currently, no population based studies have examined the patterns of sensory and
9

motor peripheral nerve function over time in older adults. Even the prevalence of clinical
peripheral neuropathy is difficult to assess because not all with symptoms follow up with a
health care provider or have treatment [87]. Though nerve conduction testing is useful in clinical
settings for identifying damage or impairments in the sensory and motor peripheral nerves, this
method is invasive, time consuming, and requires specialized training in order to conduct—
ultimately making nerve conduction testing not feasible for many epidemiologic studies.
Although symptoms are useful for characterizing severity of disease, an absence of symptoms
does not equal an absence of disease [88]. Additionally, since early stages of the disease are
often asymptomatic, peripheral nerve function impairments may not be detectable to the
participant, although nerve damage may be present. Monofilament testing or vibration detection
testing can be incorporated into large epidemiologic studies relatively easily, though these tests
only give information on sensory deficits, not motor. Due to the difficulties, comparing
prevalence estimates across studies should be done with caution.
Older age is associated with higher incidence of peripheral neuropathy, and this was
measured in the Italian Longitudinal Study of Aging (ILSA). Older Italian adults age 65-84 were
initially screened for distal symmetrical neuropathy, and then evaluated again after three years of
follow-up [29]. A population-based sample from eight different municipalities was followed-up
for 3 years, with 100 of the 3,066 participants developing clinical distal symmetrical neuropathy.
The initial screening for neuropathy included two stages. The first stage involved self-reported
diagnosis, self-reported symptoms and a brief neurologic exam (heel gait, bilateral Achilles
tendon reflex, touch and pain sensation). Those who screened positive were then examined by a
neurologist and received an extensive neurologic examination in order to determine a clinical
neuropathy diagnosis. For the follow-up, cases of peripheral nerve function decline were
10

identified via telephone interview which included questions about self-reported physician
diagnosis of neuropathy in the past year.
Age was a significant predictor of developing clinical distal symmetrical neuropathy,
with every year of increasing age associated with a relative risk of 1.07 (95% CI: 1.01-1.14) for
diabetic participants and 1.05 (95% CI = 1.02-1.09) for the entire study population. Adjusted
annual incidence of distal symmetrical neuropathy was 7.9 per 1,000 person years (95% CI =
6.3-9.5) in the entire study population, 5.76 (95% CI: 4.3-7.3) per 1,000 person years for the
participants without diabetes, and 32.2 (95% CI: 21.7-42.7) in diabetic participants. Baseline
prevalence estimates of distal symmetrical neuropathy were 6.36% in those 70-74 years of age,
9.37 for those 75-79, and 9.32 for those age 80-84 years. A limitation to this study is that cases
were initially identified using a clinical diagnosis of peripheral symmetrical neuropathy, while
the follow-up involved the self-report diagnosis of peripheral neuropathy. Because many older
adults with nerve function impairments may not seek treatment for symptoms or even be aware
of their nerve function impairments, these rates may underestimate the true incidence in this
population.
To assess prevalence of peripheral nerve function impairments in the general U.S.
population, Gregg and colleagues utilized 10-g monofilament touch sensation testing and self-
reported neuropathy symptom data from the NHANES 1999-2000 cycle [30]. Peripheral nerve
function impairment was defined in this study as having one or more insensate area on the foot
using 10g monofilament testing, though this was not a clinical diagnosis. Self-reported
symptoms were also collected and included the presence of numbness, loss of feeling, or painful
or tingling sensations in the feet in the past three months. Overall, 14.8% of the study population
age 40+ years and 26% in the Type 2 diabetic population over 40 years old had peripheral nerve
11

function impairments. Nearly half of the non-diabetic participants with peripheral nerve function
impairment were asymptomatic, while 62% of diabetic participants with peripheral nerve
function impairment were asymptomatic. Older age was highly associated with these
impairments. For participants age 40-49 years, 8.1% had peripheral nerve function impairment,
compared to 28.4% of those age 70-79 and 34.7% of those age 80 and older (p<0.05 for both).
This study filled an important gap in the literature at the time by providing prevalence
estimates of peripheral nerve function decline in the general U.S. population as opposed to a
clinical population. Additionally, the combination of monofilament testing and symptom
reporting provided important insight into the severity of peripheral nerve function impairment in
the U.S. Interestingly, most participants with these impairments were asymptomatic. Peripheral
nerve function impairments have often been thought of as a condition only occurring with
diabetes, but this work in NHANES indicated that this is not the case.
In a study of 759 community dwelling older adults (age 65 and older) recruited from
family medicine practices, the prevalence of at least one bilateral sensory deficit was 26% for
those age 65-74, 36% in those age 75-84, and 54% in those age 85 years and older [85]. Sensory
deficits examined in this study included light touch in the feet, vibration in the medial malleoli,
position perception in the great toe and deep tendon ankle reflexes. Only a portion of those
with any sensory deficit reported symptoms of peripheral neuropathy or of impaired physical
function: 28% reported numbness of extremities, 48% pain or discomfort, 31% restless legs, 44%
trouble walking, and 35% reported trouble with balance, while 29% reported no symptoms. Of
those reporting bilateral sensory deficits, only 40% reported having any disease or condition that
is known to cause peripheral neuropathy (diabetes, vitamin B12 deficiency, chronic hepatitis,
renal failure, autoimmune disease, or reporting a prior diagnosis of peripheral neuropathy). This
12

supports the thought that peripheral nerve dysfunction in the elderly is typically idiopathic, but
using self-report diagnosis is a limitation in this study. Many of these conditions are under
diagnosed, and many older adults may have one or more of these conditions without being
aware.
Sensorimotor Peripheral Nerve Function Assessment Methods 1.2.3
Numerous methods exist for assessing peripheral nerve function. Methods for assessing
motor and sensory function can vary greatly in terms of feasibility for clinical settings or
epidemiological studies, cost, participant burden, and experience needed to administer the tests.
1.2.3.1 Nerve Conduction Studies
As mentioned previously, nerve conduction testing is often used in clinical settings to
measure sensory and motor nerve function. The usual measurements taken include latency,
amplitude, and duration. Latency is the time that it takes for the onset of a negative response
after the stimulus; amplitude is defined as the distance between the baseline to negative peak or
from the negative peak to positive peak, while the duration is the time from the onset of the
negative or positive peak until return to baseline. The distance between two stimulus points and
proximal and distal latency to negative peak in milliseconds, are then used to calculate mean
conduction velocity (m/s). F-waves can also be studied via nerve conduction testing. In
contrast to sensory and motor nerve conduction studies that examine the conduction velocity
along a limb segment, F-waves represent the action potential traveling from the simulation site to
the spinal cord’s ventral horn, and back to the stimulation site. F-wave conduction velocity is
13

calculated using the distance from the stimulation site to the corresponding spinal segment (this
distance is multiplied by two since the action potential must travel back to the stimulated nerve).
In the lower extremity, sensory nerve conduction testing is often done at the sural sensory
nerve, while motor nerve conduction testing is done at the peroneal motor nerve or tibial motor
nerve. Nerve conduction testing is only able be done for large, myelinated nerve fibers. Motor
nerve conduction methods are sensitive, specific, and have moderate to high reproducibility in
older adults [89].
Nerve conduction impairments often preclude clinical symptoms and may be the first
objective indications of the disease, making them especially important for assessing subclinical
disease [82]. However, nerve conduction studies are time consuming in clinical or
epidemiologic settings, and the absence of a sural nerve response is common in older adults.
Administering these tests also takes a considerable amount of education, training and experience,
and inaccuracies in measurement technique may also lead to considerable error in the
measurements [90,91]. F-wave analysis is particularly complicated, mostly because several
stimuli are required in order to get an accurate measurement. Computerized automated analyses
are considered to be feasible and reliable alternatives to analyzing F-wave latencies [92] and
other measures of nerve conduction. However, established clinical cut-points of function cannot
be used with measurements from automated methods.
1.2.3.2 Quantitative Sensory Testing
Quantitative sensory testing involves using a specific sensory stimulus (touch,
temperature, pain, or vibration) to invoke a response from a specific nerve pathway. These
testing techniques are considered semi-objective because they rely on a patient’s response to the
stimulus. This response-dependent testing may be an issue in the oldest-old where cognitive
14

decline may influence the participant’s ability to accurately respond to the stimulus. These tests
can be done using a variety of stimuli, a cotton swab, light touch from a finger, or 10-g
monofilaments. Although using more than one monofilament, a light (1.4-g) and standard (10-g)
monofilament, for example, allows investigators to categorize participants by having light touch
sensitivity (1.4g) or standard insensitivity (10g), the use of a single monofilament (typically
10g) is common. The monofilaments are often touched to specific locations on the foot or great
toe, and the participant indicates if the touch is detected. However, no standard protocol for
monofilament testing exists, particularly in regards to number of touches or location of the foot,
which is an issue in research and clinical settings.
Vibration perception threshold tests are also used for sensory nerve function testing, and
these tests can be quickly and easily administered in a research or clinical setting. Higher
perception threshold values indicate worse sensory nerve function. Quantitative sensory testing
is used for evaluating the function of small sensory nerves. Vibration threshold testing can be
done using an automated device or with tuning forks. The Vibratron is a device where an
individual rests his or her foot on a small platform that has a small post that vibrates under the
great toe. The voltage gradually increases and the participant indicates when he or she feels the
vibration, and the participant is not told when the vibration will begin. Higher vibration
perception threshold indicates worse peripheral nerve function. However, because the
participant is instructed to indicate the exact moment when he or she feels the vibration, scores
can be influenced by reaction time.
Vibration threshold testing may be done using a tuning fork, and tuning fork tests can
either be qualitative or quantitative in nature. For the qualitative method, an examiner taps a 128
Hz tuning fork on a hard surface and then touches the tuning fork to a location on the
15

participant’s body. The perceived vibration of the participant is then compared to examiner.
Although this method is easy and is done quickly in a clinical setting, it has not been well
validated and is examiner dependent. Questions remain about the reliability, sensitivity, and
specificity of this method. The quantitative method, on the other hand, involves using a Rydel-
Seiffer 64 Hz tuning fork [93]. This device has two triangles that intersect at different points
with different vibration amplitudes from the tuning fork. The intersection point of the triangles
moves from 0-8 with decreasing vibration amplitude. The participant indicates when he or she
no longer feels the vibration, and the score is the value of where the triangles are intersecting. A
sum score of 4 on bilateral toe testing indicates abnormal vibration threshold. The qualitative
method takes no additional time compared to qualitative tuning fork method, but has been shown
to be better associated with sensory nerve action potential amplitude in a patient population of
middle-aged to older adults with Waldenström's macroglobulinemia and non-diseased controls
[93].
Risk Factors for Sensorimotor Peripheral Nerve Function Impairments 1.2.4
In general, peripheral nerve function dysfunction or impairments in older adults are
idiopathic in nature with no clear cause aside from aging itself. In older adults who are seen in
specialty clinics, a specific cause of neuropathy is often determined [94]. However, those who
are seen at specialty clinics often have severe symptoms or worse cases of peripheral neuropathy.
Likely, a large proportion of older adults are not seen in a primary care setting for their
peripheral nerve impairments, much less in a specialty setting [87]. Despite this, several risk
factors have been identified in epidemiologic studies related to peripheral nerve impairments and
16

clinical neuropathy, both in the general population and specifically for populations with diabetes.
These risk factors are described in detail in Table 1.
From a demographic standpoint, older age [29,30,95], male sex [30], black race [30], and
Hispanic ethnicity [30] are associated with a higher prevalence of peripheral nerve impairment in
the general population. Taller height is associated with higher prevalence of peripheral nerve
impairment due to neuronal length [96]. Because men are often taller than women, the higher
prevalence of peripheral nerve impairment in men compared to women is largely related to
height differences. Racial and ethnic differences are often attributed to the higher prevalence of
diabetes and other cardiometabolic risk factors in some racial or ethnic minorities compared to
whites.
Cardiovascular risk factors [97], obesity [74,98], coronary heart disease [99], and
peripheral artery disease [99] have been found to be associated with worse peripheral nerve
function in epidemiologic studies. In some studies, statin use has been associated with worse
peripheral nerve function [97,100]. However, the association of statin use and peripheral nerve
function impairments has been controversial, with some studies finding a protective effect of
statins on the development of peripheral neuropathy [101]. Statins lower cholesterol, a
fundamental component of the protective myelin sheath on an axon, which is one of the
hypothesized mechanisms by which statin use is associated with worse peripheral nerve function.
Statins are among the most commonly used medications by older adults [102], which highlights
the importance of determining whether statins cause significant harm to the nervous system, and
whether risks of these medications outweigh the cardiovascular benefits.
In addition to conditions related to the cardiovascular system, knee osteoarthritis is
another common condition in older adults that is associated with potentially worse peripheral
17

nerve function [103]. Pain arising from osteoarthritis has traditionally been considered to be
nociceptive, however, recent evidence has suggested a contributing role of sensory nerve fiber
damage in osteoarthritis. In a cohort of patients with knee osteoarthritis (n=92, age 70.3±8.0
years), knee pain was evaluated in order to determine whether the pain was neuropathic in nature
(determined by using painDETECT, a peripheral neuropathy questionnaire) [104]. In this cohort
5.4% were classified as having neuropathic pain in their osteoarthritic knee, with an additional
15.2% as having probably neuropathic pain. Presence of neuropathic pain was associated with
later stages of osteoarthritis.
From a nutritional standpoint, low vitamin B12 [53] and high homocysteine [54] have
been shown to be associated with poorer peripheral nerve function in older adults. Excessive
alcohol use [105], which is often linked to poor nutrition and dietary habits, also can lead to
nerve damage [106]. Currently, it is unclear whether alcohol has an independent effect on nerve
function or whether damage occurs through nutritional pathways [106].
18

Table 1: Risk Factors for Sensorimotor Peripheral Nerve Function Impairments Identified in Epidemiologic Studies
Risk Factor Study Population Outcome Definition Magnitude of Relationship
Age
Older Italians (Age 65-84)
At baseline, peripheral neuropathy was clinically diagnosed. Follow-up cases were ascertained via self-report diagnosis.
Each year of older age associated with a RR of 1.07 (95% CI =1.01-1.14) in diabetic participants for developing neuropathy and 1.05 (95% CI= 1.02-1.09) in the entire study population of older Italians [29].
NHANES (Age 40+)
Peripheral nerve function impairment: 1 or more insensate area on monofilament testing using a 10-g monofilament at a total of six sites on the foot.
Prevalence of peripheral neuropathy was higher in older age groups. Prevalence of peripheral neuropathy was 8.1% in those 40-49 years, and 34.7% in those 80+ years [30].
Women’s Health and Aging Study participants (n=894, Age 65+)
Vibration perception threshold measured using the Vibatron II. Nerve function values defined as: Normal = <3.43 units; Mild dysfunction = 3.43 to <4.87; Moderate dysfunction 4.87 to <6.31; Severe dysfunction ≥6.31 units
Women who were age 85 and older were at a 6.5, 7.5, and 13.3 times greater odds of mild, moderate, and severe dysfunction compared to women who were age 65-74 years [95].
Sex
NHANES (Age 40+)
Peripheral nerve function impairment: 1 or more insensate area on monofilament testing using a 10-g monofilament at a total of six sites.
Men had a higher prevalence of peripheral nerve function impairment compared to women (18.2% vs. 12.6%, p<0.05) [30].
Race/Ethnicity
NHANES (Age 40+)
Peripheral nerve function impairment: 1 or more insensate area on monofilament testing using a 10-g monofilament at a total of six sites.
The prevalence of impairment varied across racial groups. Prevalence was 14.4% in non-Hispanic whites, 19.4% in Hispanic participants, and 21.9% in non-Hispanic black participants (p<0.05 compared to whites) [30].
Diabetes
NHANES (Age 40+)
Peripheral nerve function impairment: 1 or more insensate area on monofilament testing using a 10-g monofilament at a total of six sites.
Prevalence of peripheral nerve function impairment in diabetic participants was approximately twice that of the prevalence of the general population of U.S. adults age 40+ (28.5% vs. 14.8%, p<0.001) [30].
19

Diabetes in Old Age
Women’s Health and Aging Study participants (n=894, Age 65+)
Vibration perception threshold measured using Vibatron II. Nerve function values defined as: Normal = <3.43 units, Mild dysfunction = 3.43 to <4.87 Moderate dysfunction 4.87 to <6.31, Severe dysfunction ≥6.31 units
Women with diabetes were at 1.8, 2.4, and 1.6 times greater odds of mild, moderate, or severe dysfunction compared to those without diabetes [95]. (Diabetes was self-reported)
Italians age 55 years and older (n=4191)
Those with 2 or more symptoms or polyneuropathy underwent clinical examination to confirm neuropathy. Probable polyneuropathy definition: impairment of at least 2 nerve functions (sensation, strength, tendon reflexes) in the extremities with symmetrical distribution
In the study population, the prevalence of probable polyneuropathy was 2.2% in non-diabetic participants compared to 19.0% in diabetic participants [107].
Diabetes Duration
Italians age 55 years and older (n=4191)
Those with 2 or more symptoms or polyneuropathy underwent clinical examination to confirm neuropathy. Probable polyneuropathy definition: impairment of at least 2 nerve functions (sensation, strength, tendon reflexes) in the extremities with symmetrical distribution
Longer diabetes duration was significantly associated with probable polyneuropathy among those with diabetes (p<0.001). The duration of diabetes for those without polyneuropathy was 10.0 years, compared to duration of 12.7 years for those with neuropathy. (p<0.02) [107].
Worse Glycemic Control in those with Diabetes
Diabetic veterans from an outpatient clinic (n=775, Age 65-84)
Peripheral nerve function impairment: insensitivity to 10-g monofilament at any of 9 sites on the foot.
Each 1% increase in glycohemoglobin was associated with 1.06 (p=0.031) greater odds of peripheral nerve impairment [105].
Italians age 55 years and older (n=4191)
Probable polyneuropathy definition: impairment of at least 2 nerve functions (sensation, strength, tendon reflexes) in the extremities with symmetrical distribution (clinical diagnosis).
Among diabetic participants in this study, those with polyneuropathy had higher mean fasting blood glucose compared to those without polyneuropathy (187.1 vs. 149.0 g/dl, p<0.001) and higher mean post parandial glucose 206.2 vs. 165.4 g/dl, p=0.01) [107].
Table 1 Continued
20

Cardiovascular Risk Factors
NHANES (Age 40+)
Peripheral nerve function impairment: 1 or more insensate area on monofilament testing using a 10-g monofilament at a total of six sites.
Those with peripheral nerve impairment had higher triglycerides (187.0 vs. 158.5, p=0.05), larger waist circumference (105.5cm vs. 98.4cm, p<0.001) and a larger percentage had hypertension 66.9 vs. 55.3%, p=0.007) compared to those without impairment [97].
Coronary Heart Disease
Non-diabetic, elderly Italians from ILSA (n=2,512, age 74.3±5.7)
At baseline, peripheral neuropathy was clinically diagnosed. Follow-up cases were ascertained via self-report diagnosis. Clinically diagnosed peripheral neuropathy was further classified according to etiology.
A larger proportion of older adults who developed clinical idiopathic distal symmetric neuropathy had a history of coronary heart disease compared to participants who did not develop neuropathy over the 3 year follow up (25.5% vs 12.0%, p=0.04) [99].
Obesity
NHANES (Age 40+)
Peripheral nerve function impairment: 1 or more insensate area on monofilament testing using a 10-g monofilament at a total of six sites.
Obese participants (BMI ≥30) were 2.20 times more likely to have peripheral nerve function impairment compared to non-obese participants [74].
Women age 42-52 from the Michigan site of the Study of Women Across the Nation neuropathy sub-study (n=396)
Peripheral nerve dysfunction was defined as ≤80% correct responses on 10-gram monofilament testing (10 repetitions on big toe) or ≥4 signs or symptoms on the Michigan Neuropathy Screening Instrument [108].
Each 5 unit increase in baseline BMI was associated with a 1.24 greater odds of peripheral nerve dysfunction by year 12 in the study [98].
Statin Use
NHANES (Age 40+)
Peripheral nerve function impairment: 1 or more insensate area on monofilament testing using a 10-g monofilament at a total of six sites.
Statin use was significantly associated with peripheral neuropathy in adjusted multivariate logistic regression: OR=1.3 (95% CI = 1.1-1.6) compared to those who did not use statins [97].
Low Vitamin B12
Older adults in Health ABC (n=2279, age 72-83)
Peroneal motor nerve conduction amplitude and velocity and 1.4 and 10-g monofilament testing were used to measure peripheral nerve function.
Vitamin B12 deficiency (serum B12 < 260pmol/L) was associated with a 1.50 greater odds off insensitivity to the light monofilament compared to those with normal Vitamin B12. Vitamin B12 deficiency was also associated with worse nerve conduction velocity compared to those with normal Vitamin B12, 42.3 vs. 43.5 m/sec, respectively, p=0.01 [53].
Table 1 Continued
21

High Homocysteine
Italian older adults in the InCHIANTI Study (n=678, age 60+)
Motor nerve conduction testing, 10-g monofilament testing.
High homocysteine was associated with worse compound motor action potential. Those with initially normal but transitioned to high homocysteine had 5.4 greater odds of not feeling the monofilament compared to those with normal homocysteine [54].
Height
NHANES (n=5,229, age 40+)
Peripheral nerve function impairment: 1 or more insensate area on monofilament testing using a 10-g monofilament at a total of six sites.
Those taller than 175.5 centimeters were at a 2.3 greater adjusted odds of peripheral neuropathy compared to those 175.5 centimeters or shorter [96].
Excessive Alcohol Use
Diabetic veterans (n=775, age 65-84)
Peripheral nerve function impairment: 1 or more insensate area on monofilament testing using a 10-g monofilament at a total of six sites.
A CAGE Alcohol score of 4 (highest possible score) was associated with an increased odds of 6.96 (0.008) of peripheral neuropathy compared to a CAGE score of 0 (lowest possible score) [105].
Peripheral Artery Disease
Non-diabetic, elderly Italians from ILSA (n=2,512, age 74.3±5.7)
Peripheral neuropathy was clinically diagnosed at baseline. Follow-up cases were ascertained via self-report diagnosis. Clinically diagnosed peripheral neuropathy was further classified according to etiology.
Peripheral artery disease was an independent predictor of clinical idiopathic distal symmetric neuropathy (HR = 2.45, 95% CI: 1.01-5.91) [99].
Renal Failure
Participants (n=135) undergoing hemodialysis
Participants underwent clinical nerve function using twenty neurophysiological parameters.
The prevalence of having an abnormal value on any of the neurophysiological tests was 84.4%, with 63% of the study population having two or more abnormal values [109].
Knee Osteoarthritis
Adults (age 53-81) with knee osteoarthritis (n=92) being seen at an outpatient clinic for knee pain.
The PainDETECT questionnaire (possible scores 0-38) was used to assess the possibility of peripheral neuropathic pain. Participants were categorized as likely having neuropathic pain (score ≥19), possibly having neuropathic pain (score 13-18) and as unlikely to having neuropathic pain (score ≤12)
In this cohort, 5.4% of participants were classified as likely having neuropathic pain, and 15.2% as possibly having neuropathic pain. Pain score was positively correlated with Kellgren-Lawrence grade, indicating that neuropathic pain may be associated with later stages of knee osteoarthritis [104].
Table 1 Continued
22
1.2.4.1 Peripheral Neuropathy in Diabetes
Although peripheral nerve impairments arise during aging, most of the research regarding
nerve impairments has been focused on nerve dysfunction that occurs with the progression of
diabetes. Diabetic peripheral neuropathy (DPN) has been defined by the Toronto Diabetic
Neuropathy Expert Group as “a symmetrical, length-dependent sensorimotor poly neuropathy
attributable to metabolic and microvessel alterations as a result of chronic hyperglycemic
exposure (diabetes) and cardiovascular risk covariates” [82]. Hyperglycemia is a major factor in
the development of neuropathy in diabetes.[110] DPN is the one of the most frequent
complication related to diabetes and poor diabetic control, with some estimates of upwards of
50% of peripheral neuropathy in older diabetic populations [88]. Neuropathic pain in diabetes
has been defined as “pain arising as a direct consequences of abnormalities in the peripheral
sensorimotor system” [111] and symmetrical decreased or loss of distal sensation is also
common in DPN [82]. Advanced DPN is often preventable, with podiatric care, patient
education, glycemic control, and cardiovascular risk factor reduction being the main targets for
prevention [88].
Candrilli and colleagues utilized combined NHANES data from the 1999-2000 and 2001-
2002 cycles, to describe the prevalence and burden of peripheral nerve function decline
symptoms among adults with self-reported diabetes age 40 and older [112]. Using self-reported
symptoms of peripheral neuropathy, the estimated prevalence of symptoms of peripheral
neuropathy among this sample was 32.7% [112]. Symptoms of peripheral neuropathy were most
prevalent in the 60-69 year age group among diabetic adults (34.4%), and this may have been
due to a survival or participation effect. Symptoms were more prevalent in women compared to
men (34.4% vs. 31.0%) and in non-Hispanic blacks (38.4%) compared to other race/ethnicity
23
groups (p<0.05 for all). Symptoms of peripheral neuropathy among diabetic adults were
associated with an increased odds of being unable to work due to physical limitations (OR=3.32,
95% CI=1.60-6.52), and having four or more health care visits in the past year (OR=2.25, 95%
CI=1.32-3.83) compared to those without symptoms. Although the ability to work may be less
relevant to those past retirement age, physical limitations can threaten older adults’
independence, which is a major concern in this age group.
Metabolic disorders are also associated with peripheral nerve dysfunction. In particular,
diabetes is a major risk factor for peripheral nerve dysfunction in older adults [30,29,95], with
longer diabetes duration [29] and worse glycemic control [105,107] being associated with worse
peripheral nerve function in those with diabetes. Renal failure and poor kidney function can
also adversely affect peripheral nervous system function. Uremic polyneuropathy is commonly
seen in patients with chronic renal failure, and may potentially stabilize or improve with chronic
dialysis treatment or renal transplantation [113]. Uremic neurotoxin accumulation is the primary
mechanism of nerve damage in renal failure.
Though work in diabetes gives insights about damage that occurs to the peripheral
nervous system with age, many gaps remain in the literature about the age-related nerve
impairments that occur during independently of diabetes. The combined increase of the aging
population and rise in diabetes prevalence may lead to much higher rates of peripheral nerve
function decline in the coming years. From a public health perspective, urgency exists to
understand these nerve function impairments and develop strategies to minimize them in the
population.
24

1.2.4.2 Disease-Related Peripheral Neuropathy
Without question, diabetes is the single largest cause of disease-related peripheral
neuropathy, however, other factors are known causes of peripheral neuropathy. These causes
fall under a few main categories, including physical injury, systemic disease, toxic exposures,
infectious and autoimmune disorders, and inherited conditions [106]. Specific diseases,
conditions and the explanations of their effects on peripheral nerve function are listed in Table 2.
The specific diseases and conditions that may be most relevant for older adults include kidney
disorders, vascular diseases, repetitive injuries, cancer treatments and Shingles.
25

Table 2: Causes of Clinical Peripheral Neuropathy
General Cause Specific Cause Explanation
Physical Injury
Traumatic Injury Traumatic injury can lead to nerves being severed, crushed, compressed, or stretched. In severe cases, these forces can partially or fully detach the nerve from the spinal cord.
Repetitive Stress on Joints
Repetitive stress on joints can lead to entrapment neuropathy. The repetitive flexing of joints can damage and inflame ligaments, tendons, and muscles, thus narrowing nerve passageways.
Systemic Disease
Diabetes Chronic hyperglycemia damages nerve tissue and is a common cause of peripheral neuropathy [82].
Kidney Disorders Kidneys are responsible for eliminating toxic substances in the blood. If not functioning properly, toxic substances that damage nerve tissue can accumulate.
Vascular Diseases Vascular damage with blood flow can deprive nerve tissue of oxygen and lead to damage.
Vitamin Deficiencies
Certain vitamins, namely E, B1, B6, B12, thiamine and niacin play essential roles in promoting nerve function. Deficiencies of these vitamins can then in turn lead to nerve tissue damage.
Chronic Inflammation Inflammation of the tissue surrounding nerves can spread to the nerve itself. Additionally, chronic inflammation with swelling can lead to nerve entrapment.
Alcoholism
Alcoholism is often associated with poor nutrition and nutritional deficiencies, with thiamine deficiency being common in alcoholism. Additionally, alcohol itself may directly damage the nerves, but this is not yet clear in the literature.
Toxic Exposures
Anticancer Drugs
Some chemotherapy drugs are neurotoxins, and damage to nerves is dependent on the cumulative dose of the drugs. Recovery from chemotherapy induced neuropathy can take a long period of time in order for nerve regeneration to occur [52].
Heavy Metals
Arsenic, lead, mercury, cadmium are neurotoxins and can lead to neuropathy. In some cases, the neuropathy reverses when the exposure is taken away, but damage may also be permanent [62].
Industrial Chemicals
Many solvents and volatile substances are neurotoxins, and exposure is typically seen in industrial workers.[114] These substances may also have synergistic effects when exposure and alcohol abuse occur together [64].
26

Biomechanical Impact of Sensorimotor Peripheral Nerve Impairments 1.2.5
Although much of the work investigating the biomechanical effects of peripheral nerve
function decline has been done in diabetic populations, considerable evidence exists that
peripheral nerve function impairments result in altered gait mechanics [115-120], and the
adoption of inefficient and less stable gait patterns. These gait alterations include shorter and
wider steps, and spent more time in the double support and stance phases, and utilize a “hip
strategy” while walking by pulling the legs forward using hip flexor muscles, rather than an
“ankle strategy” of pushing the legs forward using plantar-flexor muscles [116]. Many of these
Infectious and Autoimmune
Disorders
Shingles, Epstein-Barr Virus,
Cytomegalovirus, and Herpes Simplex Virus
This group of viruses target nerve tissue and often lead to damage to the sensory nerves.
HIV Neuropathic symptoms are common in HIV, and different forms of neuropathy may develop during different stages of HIV.
Charcot-Marie-Tooth Disease
Charcot-Marie-Tooth is a condition where the genes responsible for making neurons or the myelin sheath flawed.
Genetic Mutations
Other genetic mutations may lead to heredity neuropathies. Inherited neuropathies that present in childhood are typically severe, while those that present in early adulthood are less severe.
Guillain-Barré
This syndrome results in inflammatory neuropathies due to the immune system attacking the nervous system.
Inherited Conditions
Charcot-Marie-Tooth disease
This disease is the most common cause of genetic-related peripheral neuropathy and is characterized by mutations in the genes responsible for the structure or function of the axon or myelin sheath [106].
General inherited conditions
Other genetic mutations can lead to peripheral nerve dysfunction. Typically more severe mutations result in severe dysfunction that presents in childhood while less severe mutations may not present with any impairment and are typically evident in adulthood, if at all.
27
Table 2 Continued

gait abnormalities may result from the reduced range of motion at the ankle, reduced motor
control, loss of sensation, and thickening of soft tissues [115,117,118,121]. Because of the
associations of gait alterations and injuries and falls [117,122-124], these biomechanical factors
are likely in the pathway between peripheral nerve function impairments and reduced physical
function.
Sensorimotor Peripheral Nerve Function and Walking Endurance 1.2.6
Studies examining sensorimotor peripheral nerve function and gait have typically utilized
short walking courses, and little work has been done examining sensorimotor peripheral nerve
function on longer courses. Walking endurance—the ability to walk for a sustained time or
distance—is important for remaining active in the community. Özdirenç and colleagues
compared walking endurance from a 6-minute walk test between diabetic adults (age 59.3±7.8
years) and healthy non-diabetic adults and found that the diabetic adults had significantly worse
walking endurance [125]. Though the differences between diabetic and non-diabetic adults may
be in part due to peripheral nerve function, this study did not include any measure of peripheral
nerve function, which prevented the investigators from fully exploring the potentially reasons for
the differences in endurance walking. In addition, although the 6-minute walk test is considered
a valid measure of physical fitness, it has been shown that older adults are more likely to work
closer to their maximal effort on the Long Distance Corridor Walk (LDCW)—an endurance
walking test that was developed in the Health ABC Study [126]. In general, walking in daily
activities is performed over a specific distance rather than for a specific time, making walking
tests like the LDCW potentially more relevant for daily living in terms of endurance walking.
28

In the InCHIANTI study, faster motor nerve conduction velocity (indicating better
peripheral nerve function) was associated with faster completion of a 400m endurance walking
test. Though nerve conduction velocity testing allows for the examination of a range of motor
nerve function, this single measure only gives a partial picture. Ideally, studies should include
more than one measure, including the presence of symptoms, sensory nerve tests, and touch
sensation examinations [82].
1.3 AUTONOMIC PERIPHERAL NERVOUS SYSTEM FUNCTION IN OLDER
ADULTS
Autonomic nerve function impairments can affect various involuntary processes in the
body, but these impairments are often overlooked in clinical settings. Compared to sensorimotor
peripheral nerve impairments and neuropathy, autonomic peripheral nerve impairments are less
understood and studied. However, like sensorimotor peripheral nerve function dysfunction,
when autonomic nerve function dysfunction acknowledged, it is often in the context of diabetes,
although changes occur in the autonomic nervous system with aging [42].
Cardiovascular Autonomic Neuropathy 1.3.1
Cardiovascular autonomic neuropathy (CAN) is a condition that arises due to damage to
the autonomic nerve fibers that innervate the heart and blood vessels, which leads to the inability
cardiovascular system to properly regulate heart rate, blood pressure, and vascular dynamics.
29

Autonomic balance is necessary for cardiovascular system regulation, the ability of the
cardiovascular system to respond to stimuli, and the maintenance of homeostasis.
Autonomic balance involves the complex interaction between the parasympathetic and
sympathetic nervous system and other physiologic mechanisms that keep heart rate and blood
pressure functioning normally [80]. CAN results in a higher risk for cardiac arrhythmias, silent
myocardial infarction and sudden cardiac death [80]. Signs and symptoms of CAN include
resting tachycardia, orthostatic hypotension, and silent myocardial ischemia [127] resulting from
cardiac injury from increased mitochondrial oxidative stress and calcium dependent apoptosis
[128]. Exercise intolerance is also common in CAN due to the inability of the cardiovascular
system to respond appropriately to stimuli. Exercise intolerance is the lack of ability to exercise
for a duration or intensity that would be expected for an individual’s age and condition, and may
result in severe fatigue from exercise, unusual breathlessness, and muscle weakness or pain.
Cardiac Autonomic Function Assessment Methods 1.3.2
Several methods exist for assessing cardiac autonomic function. These methods vary
widely in their clinical utility, feasibility, and cost.
1.3.2.1 Heart Rate Variability
Heart rate variability is the most commonly used method for assessing CAN, and
decreased heart rate variability is the earliest clinical indicator of CAN [128]. Heart rate
variability is defined as “the variation over time of the period between consecutive heartbeats”
[129] and reflects abnormalities in parasympathetic and sympathetic function. Imbalances
between the sympathetic and parasympathetic nervous system lead to changes in heart rate, with
30
low sympathetic and/or high parasympathetic activity leading to cardio-deceleration, while high
sympathetic and/or low parasympathetic activity leading to cardio acceleration [129]. Reduced
heart rate variability may be indicative of poor cardiovascular health, and is predictive of adverse
cardiovascular outcomes, such as hypertension, coronary artery disease, chronic heart failure,
and myocardial infarction [130].
In the collection of heart rate variability, a participant wears a standard Holter monitor,
which includes an electrocardiogram (ECG). Collection periods vary, with durations short
durations of 5-7 minutes to free-living data collection of 24 hours being common in the
literature [82]. The ECG readings are analyzed using specialized software, with various
techniques available for characterizing the data. A number of complex indices related to cardiac
electrophysiology and autonomic function can be obtained through HRV measurements,
depending on the analysis technique used. These methods include time-domain, geometric,
frequency-domain, non-linear methods, and long term correlation, although the time-domain and
frequency-domain methods are the most common. The time-domain method is based upon the
intervals from beat to beat, while the frequency-domain method utilizes bands of frequency, and
then the beats within each band are summed. Common time-domain indices include the
standard deviation of all normal to normal intervals (SDNN), the root mean square of successive
differences between normal to normal intervals (rMSSD), and the standard deviation of normal
to normal intervals in a given short-term time frame (SDNN-index). Generally, higher values are
considered to reflect healthier HRV, though exceptions exist.
High frequency signals are indicative of parasympathetic activity (0.15-0.40 Hz) while
low frequency signals indicate sympathetic activity (0.04-0.14 Hz) [129]. In general, recordings
31

of shorter duration (i.e. 5-7 minutes) should be analyzed using the time-domain analysis, where
longer recordings (i.e. 24 hours) should be analyzed with the frequency-domain analysis method.
Though higher heart rate variability measures are considered to reflect better cardiac
functioning, in some instances this is not the case. For example, in a study of older adults from
the Cardiovascular Health Study, abnormal heart rate patterns were found to be associated with
elevated time and frequency domain heart rate variability indices [131]. In particular, higher
rMSSD values usually reflect higher parasympathetic input, though in older adults higher values
can also reflect the presence of erratic heart rhythms. Non-linear heart rate variability measures,
however, can detect abnormal heart rate variability indices resulting from underlying cardiac
control or function abnormalities. Poincare ratios are often used for the characterizing the degree
of erratic rhythms. However, non-linear heart rate variability analysis is often much more time
consuming than time or frequency domain analysis. Many older adults may have abnormal heart
rate patterns, which add to the complexity of utilizing these measures in older adults.
1.3.2.2 Bedside Autonomic Function Batteries
Although heart rate variability is largely considered the gold standard for assessing
cardiac autonomic function, other tests involving blood pressure or heart rate measurement can
be easily utilized in the clinical setting [132]. First, orthostatic hypotension is a common
indicator of CAN. As a patient transitions from sitting to standing, blood pressure drops
significantly with common cut points being >20mmHg for systolic or >10mmHG drop for
diastolic blood pressure [132]. Often times this can lead to dizziness, lightheadedness, or
syncope, but orthostatic hypotension is commonly asymptomatic. Other measures include:
measuring blood pressure during the Valsalva maneuver; heart rate during deep breathing; blood
pressure response to a hand grip test, where a patient holds 30% of their maximal hand grip on a
32

dynamometer for 3-4 minutes; and the 30:15 ratio, where heart rate is measured 30 seconds prior
to and 60 seconds after going from supine to standing. In the 30:15 ratio, heart rate should be
highest at 15 seconds after standing, while 30 seconds after standing the heart rate should be
close to the supine heart rate [132].
1.3.2.3 Resting Heart Rate
Resting heart rate (HR) alone is an easy performed measure used to estimate cardiac
autonomic function [132]. Though resting HR can be influenced by several factors, resting HR
is indicative of vagus nerve function and parasympathetic function. Elevated resting heart rate
has been shown to be associated with an increased risk of cardiovascular morbidity and mortality
[133-135]. Elevated resting heart rate has been shown to be associated with an increased risk of
cardiovascular morbidity and mortality in numerous studies, even after adjusting for common
cardiovascular risk factors. Change in resting heart rate has also been shown to predict ischemic
heart disease deaths [136]. In a large prospective cohort study of 13,499 men and 15,826 women
without cardiovascular disease in Norway, resting heart rate was measured at baseline and then
10 years later, with mortality follow up continuing for approximately 13 years after the second
measure. After a mean follow-up of 12 ± 2 years, there were 3038 deaths, with 388 of the deaths
being caused by ischemic heart disease. A change in resting heart rate of greater than 25 beats
from the first to the second measure was associated with a 1.80 (95% CI 1.10-3.10) increased
risk of death compared to those with a resting heart rate change of ± 5 beats.
Elevated resting heart rate is associated with poor outcomes, though the
association between resting heart rate and disease is not necessarily linear. In a meta-analysis
including data from three population-based cohorts of middle aged and older adults (including
the Health Aging and Body Composition Study, Cardiovascular Health Study [137], and Kuopio
33

Ischemic Heart Disease Study), a non-linear association was found between resting heart rate and
risk of heart failure [138]. Risk for heart failure was higher for those with higher heart rate, but
those with very low heart rate (< 60 beats per minute) also had a higher risk of heart failure.
Although resting heart rate can give some insight on cardiovascular autonomic function,
it may also be influenced by other factors, including acute illness, emotional stress, caffeine
intake, and certain medications, among others. In particular, beta blockers, calcium channel
blockers, and tricyclic antidepressants [139] can influence heart rate. In addition, very low heart
rate in young, healthy populations is often indicative of very high fitness levels rather than
autonomic imbalance. Because of this, interpreting heart rate as a measure of pure autonomic
function should be done with caution.
1.3.2.4 Heart Rate during Exercise Testing
Heart rate should be variable and responsive to various situations (i.e. accelerate during
exercise, and then return to normal post-exercise). Thus, measuring heart rate during exercise
testing is also be useful for identifying cardiovascular autonomic function impairments [140].
Typically, to evaluate heart rate response, resting heart rate is subtracted from peak heart rate
from an exercise test. Though heart rate response is often calculated from maximal graded
treadmill tests, these measures can also be examined from submaximal exercise tests. To
evaluate heart rate recovery, the difference between peak heart rate and heart rate after a
specified rest period after testing (typically one or two minutes post-test). A delay in heart rate
returning to normal after exercise has been associated with increased risk of mortality in those
with CAN and diabetes [141], though heart rate changes during exercise are also associated with
increased risk of cardiovascular outcomes and sudden death in healthy individuals [142].
34
In healthy, working men between the ages of 42 and 53 years, an increase of heart rate
less than 89 beats per minute during a peak exercise test was associated with an increased risk of
sudden death (relative risk = 6.18, 95% CI: 2.31-16.11) during 23 years of follow-up.
Additionally, a decrease in heart rate post exercise of less than 25 beats per minute (difference
between peak heart rate and heart rate measured 1-minute post-test) was associated with an
increased risk of sudden death (Relative Risk= 2.20, 95% CI: 1.02-4.74). Likely, the best
measures of autonomic function to consider for epidemiologic studies are resting heart rate and
heart rate response and heart rate recovery during a submaximal exercise test because of their
relative ease to collect and analyze without extensive equipment.
Risk Factors for Cardiac Autonomic Neuropathy 1.3.3
Presently, few studies have examined cardiac autonomic function in the general
population of non-diabetic older adults. Much of the work in this area has been focused on
populations with diabetes, although risk factors for decreasing heart rate variability have been
identified through epidemiologic studies. In particular, older age, male sex, diabetes (fasting
glucose ≥126 mg/dL), and the presence of other cardiovascular risk factors are associated worse
measures of heart rate variability [42,143].
Stein and colleagues were among the first to analyze heart rate variability in a large
epidemiologic study of older adults. In the Cardiovascular Health Study, older adults (n=585,
age >65 years) had two 24-hour Holter recordings, 5 years apart to examine the change in heart
rate variability. When examining the changes, it was found that autonomic cardiac function
decreased the most between the ages of 65-75, with function leveling out at 75 and beyond,
although overall changes were small. These changes were independent of cardiovascular risk
35

[42]. However, because participants had to have two visits in order for change to be analyzed,
likely the healthiest older participants were able to return for a second visit. In essence,
participants who were not unable to return for the visit may also have experienced larger changes
in autonomic function, biasing the results towards the null.
When examining differences in heart rate variability by cardiovascular disease risk, those
at higher risk for cardiovascular disease at baseline had worse heart rate variability measures
after adjusting for covariates compared to those at lower risk. (Low risk for cardiovascular
disease was defined as having SBP ≤140 mmHg, DBP ≤90 mmHg, no beta blockers or anti-
hypertensive medications, BMI ≤ 30, no history of MI, stroke, known coronary heart disease or
congestive heart failure, fasting glucose <110 mg/dl, and no hypoglycemic medication use.)
Higher risk participants had lower heart rate overall, and the authors hypothesized that this was
likely due to lower physical activity in the higher risk group. Because physical activity was not
measured in conjunction with HRV, no confirmation was provided for this hypothesis and it
remains to be tested.
In the Atherosclerosis Risk in Communities (ARIC) study [143], Schroeder and others
examined the effect of diabetes on 9-year change in heart rate variability using 2- and 6-minute
beat-to-beat heart rate recordings. Participants in this study were younger (45-64 years) than
those in CHS, and the study sample was also larger (n=6,245 individuals with 9 year follow up
data, and n=9,940 with baseline data). Diabetic participants (defined as those with fasting
glucose ≥7.0mmol/L, non-fasting glucose ≥11.1mmol/L, self-reported physician diagnosis, or
use of pharmacologic hypoglycemic treatment) had lower heart rate variability at baseline (R-R
interval 852.69, 95% CI: 844.45-860.94, for diabetic participants vs. 916.99, 95% CI: 913.54-
920.43, for participants with normal fasting glucose, p<0.05). (Normal fasting glucose defined
36

as <5.6mmol/L.) In those with diabetes, the adjusted mean annual change in R-R intervals was
3.88 milliseconds/year (95% CI: 2.72-5.04), compared to 6.74 (95% CI: 6.33-7.16) in
participants with normal fasting glucose (p<0.05). Though these epidemiologic studies were
useful for identifying changes in autonomic function, more work is needed in order to determine
how changes in autonomic function over time are related to geriatric outcomes.
Autonomic Nervous System Function in Diabetes 1.3.4
Diabetes has a major impact on the autonomic nervous system. Changes in cardiac
autonomic function can be detected though exercise-based CAN assessments and these
abnormalities are even present in middle-aged diabetic individuals who have no evidence of
autonomic neuropathy otherwise [144]. In a study of 18 middle age diabetic participants (age 55
± 2 years) and 20 healthy controls (age 51 ± 1 years) participants underwent two 16-minute
submaximal bicycle exercise tests followed by a 45 minute recovery autonomic nervous system
function was measured during exercise and recovery. During the second exercise test, atropine
was administered at peak exercise in order for the final two minutes of exercise and the recovery
period to occur under parasympathetic blockade. Participants underwent standard CAN testing
(heart rate response to deep breathing, standing, and Valsalva maneuver, and blood pressure
response to standing and during sustained hand grip) to determine whether exercise based testing
could uncover cardiac autonomic dysfunction in those with normal standard CAN assessments.
In the early recovery period after submaximal exercise, diabetic participants had a delay in heart
rate recovery compared to the controls (heart rate recovery one minute post exercise: 18.5 ± 1.9
bpm for diabetic participants compared to 27.6 ± 1.5 bpm for controls, p<0.001). Diabetic
participants also had a suppressed parasympathetic effect on the RR interval during recovery
37

compared to controls (RR interval during recovery: 154 ± 16 milliseconds for diabetic
participants vs. 211 ± 15 milliseconds for controls p = 0.004).
The diabetic participants in this study had well-controlled type 2 diabetes and had good
scores on the standard CAN assessments. The fact that diabetic participants have autonomic
abnormalities on exercise-based assessments but not high scores on typical CAN measures
highlights the importance of measuring subclinical autonomic function. However, a limitation
of this study is that the techniques used to capture reduced autonomic function (two separate
submaximal exercise tests, one with parasympathetic blockade) are not feasible to use in
population studies and may be inappropriate for older adults with chronic conditions (particularly
cardiovascular disease risk factors) that may make this testing unsafe. Early detection of
dysfunctions using techniques that are feasible for older adult populations will be important for
future work in this area.
Currently, it is unclear whether tight glucose control has a long-term impact on protecting
against the development of autonomic neuropathy in diabetes [80]. In the Veteran’s Affairs
Diabetes Trial, no microvascular benefits of intensive glucose therapy over standard therapy for
veterans with type 2 diabetes, and there was a slight trend of an increase in incidence of
autonomic neuropathy existed in the intensive therapy group [145]. However, the participants in
this study were a relatively homogeneous group in that they were all veterans, predominantly
men (97%) had a relatively long duration of diabetes (mean 11.5 years since diagnosis), and
many (40%) already had a cardiovascular event. Long term studies with representative
populations of older adults or those with diabetes would be needed to help address this question.
The results of this study were in contrast to studies of Type 1 diabetes where better glucose
control was related to a lower incidence of CAN in the Diabetes Control and Complications Trial
38

and Follow-up Study from baseline to study year 13/14 [146]. These contradictory results are
possibly due to the “metabolic memory” effect of hyperglycemia, and that historical glucose
levels may be most important factor in predicting CAN [147].
1.4 PHYSICAL ACTIVITY AND PERIPHERAL NERVOUS SYSTEM FUNCTION
The benefits of physical activity on metabolic and cardiovascular risk factors are well
established and supported by leading professional organizations [26,148-150]. Physical activity
may also be beneficial for peripheral nervous system function for older adults. Muscle
contraction has an insulin-like effect on the body by increasing the cell membrane ability to
absorb glucose from the blood [151], therefore physical activity may be an important part of
reducing the damaging effects of hyperglycemia have on the peripheral nervous system.
Additionally, physical activity can improve vascular and endothelial function in the lower
extremities [152-154], and higher levels of physical activity participation are associated with
lower levels of inflammatory markers [155,156], both of which could potentially influence
peripheral nerve function.
Evidence of Physical Activity Improving Sensorimotor Peripheral Nerve Function 1.4.1
Worse peripheral nerve function may be associated with lower levels of physical activity,
and in turn, low levels of physical activity could potentially lead to worse peripheral nerve
function. Despite the potential for these bidirectional effects, little has been done to explore the
relationship between physical activity and sensorimotor peripheral nerve function. The
39

relationship between sensorimotor peripheral nerve function and physical activity has not been
examined in epidemiologic studies of older non-diabetic participants. Additionally, only small
studies have been performed in humans examining the effects of PA or exercise training on
peripheral nerve function, and these studies have been primarily conducted in populations of
middle-aged diabetic populations rather than populations of older adults.
One study examining peripheral neuropathy and walking in older adults indicated that
older adults with peripheral neuropathy take fewer steps per day compared to older adults
without peripheral neuropathy [157]. However, from prior epidemiologic studies it is known
that worse sensorimotor peripheral nerve function is associated with worse lower extremity
physical functioning even without progressing to the point of clinical peripheral neuropathy [31],
making it important to study a full range of peripheral nerve function. In addition, although
pedometers can be useful for promoting activity in an intervention setting, pedometers only
count ambulatory activity and may not accurately reflect an individual’s total daily activity.
In an analysis of diabetic participants in NHANES, no direct relationship was found
between peripheral neuropathy and the number of minutes spent in moderate to vigorous
physical activity (MVPA) per day [158]. Nevertheless, those with better diabetic control (as
measured by HbA1c) and higher levels of activity were less likely to have peripheral neuropathy
compared to what would be expected from the individual effects of PA and diabetes control. In
this study, the mean number of minutes of MVPA was only 11.7 minutes, which could be an
explanation for the lack of association between PA and peripheral neuropathy. Though the use
of accelerometer in NHANES may help provide a more accurate representation of participants’
total daily activity, only MVPA was considered. Examining objectively measured physical
activity at a wide range of intensities (including light intensity activity) may beneficial for
40

clarifying the relationship between peripheral nerve function and PA in older adults—
particularly since older adults spend very little time in MVPA [25,159].
In regards to intervention studies examining change in peripheral nerve function with
physical activity, Kluding and colleagues conducted a pre-test post-test design study with middle
aged participants (n=19, age 58.4 ± 5.98 years) with diabetes (duration 12.4 ± 12.2 years) to
determine the effects of an exercise intervention on neuropathic symptoms and nerve function
[160]. The exercise program lasted for 10 weeks and included 2 days per week of aerobic
exercise and 2 days of resistance training. After the training program, participants reported less
pain compared to baseline on the Michigan Neuropathy Screening Instrument symptom
questionnaire (5.2 points vs. 4 points, p=0.01). No differences existed after training in nerve
conduction or on quantitative sensory tests. A major limitation to this study is that no control
group was studied and the sample size was very small. Additionally the training program may
not have been long enough to elicit positive changes in quantitative tests of motor and sensory
nerve function. Despite the limitations, this study does provide important insight into the relief
of neuropathy pain that could result from an exercise program. However, a controlled trial is
needed before making definitive conclusions about these improvements.
A clinical trial in Italy examined the effects of a long-term exercise training program in
the prevention of the development of peripheral neuropathy in type 1 and type 2 diabetic
participants (n=78) without signs or symptoms of neuropathy [161]. The intervention group
(n=31, age 49 ± 15.5 years) participated in a 4 hour per week treadmill-based brisk walking
program for a total of 4 years. Control participants did not receive any intervention. After the 4
year trial, 8 control participants (17.0%) but zero intervention participants developed motor
neuropathy (p<0.05), and 14 (29.8%) control and 2 (6.4%) intervention participants developed
41

sensory neuropathy. Although this is a promising result, the authors did not define sensory or
motor neuropathy, limiting the interpretability of the results. However, continuous measures of
nerve function were included, and peroneal motor nerve conduction improved in the intervention
group (1.8 ± 2.7 m/s), while a slight decrease in motor nerve conduction (-0.6 ± 3.3 m/s) was
observed in the control group (p<0.001 for between group differences). Similarly, there was a
slight increase in sural sensory nerve conduction velocity for the intervention group (0.4 ± 3.3
m/s) while there was a decrease in sensory nerve conduction velocity for the control group (-2.7
± 2.8, p<0.001 for difference between groups).
Importantly, this study was much longer than the typical exercise trial (four years total),
and required a large commitment from the intervention participants (four one-hour supervised
exercise sessions per week). The authors reported that all participants in both arms completed
the study, and the attendance rate for the intervention was greater than 90%--adherence that is
rarely seen in any kind of clinical trial. The participants in this trial were likely very highly
motivated and concerned about their health in order to achieve this sort of attendance—and
differed from the general population with diabetes, limiting the generalizability of this study. In
addition, the participants in this study had only mild hyperglycemia, and are not representative of
those with more serious disease.
Alternative modes of aerobic exercise aside from walking have been proposed as
potentially beneficial for those with peripheral neuropathy. These recommendations have been
acknowledged in diabetes literature, and the American College of Sports Medicine and American
Diabetes Association have recommended that those with peripheral neuropathy engage in non-
weight bearing activity [162]. These recommendations may be relevant to older adults with
peripheral nerve impairments. In particular, non-weight bearing activity may be a safer
42

alternative to walking for older adults with sensory impairments or symptoms of numbness or
pain in the lower extremities.
In a small (n=29) randomized clinical trial, a walking program was compared to a non-
weight-bearing (NWB) exercise program for improving walking capacity (6-minute walking
distance) and daily step counts (measured via pedometer) in adults with diabetic peripheral
neuropathy (mean age 64.5 ± 12.5 years) [163]. The walking intervention consisted of 1-hour
group sessions, 3 times a week, for 12 weeks where participants were instructed to walk to
achieve specific step counts, based upon their baseline activity. Step counts were increased
every two weeks. Sessions also included balance exercises and body weight resistance exercises.
Participants were also instructed to walk outside of the center-based sessions. The NWB group
also participated in 1-hour group sessions, 3 times a week for 12 weeks, but used performed all
exercises while either lying or sitting. Participants used elastic bands for resistance exercises,
and used either a stationary upright or recumbent cycle ergometer for their aerobic exercise.
After the 12-week intervention, the walking group experienced greater increases in
walking endurance compared to baseline (27 more meters during the 6-minute walking test for
the walking group compared to two fewer meters for the NWB group compared to baseline,
p=0.014). Also, the walking group increased their daily step count by an average of 685 steps
from baseline, compared to the NWB group who on average walked 493 steps fewer compared
to baseline (p=0.026 comparing group differences). Although the walking group improved
walking endurance and in daily step counts, the NWB group had greater improvements in
HbA1c, (-0.4% compared to baseline) compared to the walking group (-0.2% compared to
baseline, p=0.037 comparing group differences). The improvements in glucose control could
potentially help peripheral nerve function. Additionally, during exercise, those in the NWB
43

group had fewer lower extremity musculoskeletal pain complaints compared to the walking
group.
It is not particularly surprising that a group in a walking intervention will walk more than
a group in an intervention that promotes other modes of exercise. Comparing activity of the two
intervention groups using other tools (i.e. an accelerometer or questionnaire) may have given a
more accurate comparison of activity between the two groups. This was a small study not
powered to detect differences in secondary outcomes, and also did not measure peripheral nerve
function, which are limitations to this study. However, this study provides evidence that
exercise, whether through walking or NWB activity can be beneficial for those with diabetic
peripheral neuropathy, although the benefits may be different for the different exercise modes.
Exploring whether walking or NWB exercise is more beneficial for pain and peripheral nerve
function outcomes in older adults would be an important next step considering the results of this
study.
1.4.1.1 Physical Activity and Sensorimotor Peripheral Nerve Function: Animal Models
Animal models have been utilized in exploring nerve impairments and the physiologic
changes that occur after exercise training. Animal work has suggested that aerobic exercise
training is beneficial in reducing myelin loss in the sciatic nerves of type 1 diabetic rats (diabetes
induced with streptozotocin) with neuropathy after 56 days of aerobic training [164]. In the rats
that developed neuropathy, the exercise training was successful in improving motor nerve
function compared to the rats with neuropathy that did not undergo the training program.
Additionally, treadmill training in wild-type C57BL6 mice with injured peripheral nerves
enhanced motor axon regeneration after two weeks of training [165]. These adult mice had
surgical induced peripheral nerve injury, where the sciatic nerve was severed and then repaired.
44

Similar results were found in a study of adult Sprague-Dawley rats that had their sciatic nerve
severed and repaired, comparing passive (bicycle) and active (treadmill) exercise in nerve
regeneration after transaction and repair at the sciatic nerve [166]. After two months of training,
both modes of training led to slight improvements in muscle reinnervation, and there was an
increase in the number of regenerated axons in the distal nerve compared to the control animals.
These animal studies provide evidence that exercise is beneficial for nerve and motor axon
regeneration in a laboratory setting—important precursor work for examining relationships
between regeneration of human nerves via exercise training.
Some evidence exists from animal studies that weight bearing aerobic exercise can
potentially increase Schwann cell apoptosis in distal peripheral nerves [167]. This work was
done in diabetic rats, in which rats were randomly assigned to one of three groups: an aquatic
exercise group, a treadmill exercise group, and control. After 12 weeks of exercise, sural and
sciatic nerves were assessed, and it was determined that the treadmill based exercise lead to the
increased Schwann cell apoptosis in the sural nerves. However, no evidence exists in humans
that different aerobic exercise modes differentially affect mechanical loading on peripheral
nerves, although this may be an area worthy of investigation in determining ideal modes of
exercise for those with peripheral nerve dysfunction.
Evidence of Physical Activity Improving Cardiac Autonomic Function 1.4.2
Physical activity and aerobic exercise are beneficial for overall cardiovascular health, and
may help improve heart rate variability by improving vagal tone and decreasing sympathetic
activity in the heart [130]. During aerobic activity, the heart rate accelerates in response to
increased sympathetic activity and reduced vagal modulation of heart rate. After long term
45

aerobic training, the balance between sympathetic and parasympathetic activity shifts towards a
parasympathetic predominance due to increased vagal modulation of the heart rate and in
response to reduced sympathetic activity [168]. The primary autonomic nervous system
adaptation with exercise training is a decrease in resting heart rate and lower heart rate at
submaximal exercise [128]. Exercise training also improves heart rate variability due to
increased compliance of large arteries, which leads to a higher load on barorecepter nerves,
which can improve parasympathetic tone [128]. Aerobic exercise may improve vagal tone and
decrease sympathetic activity [130], and also increase cortical blood flow, which improves
sympathetic, parasympathetic, and central cholinergic activity [169].
Compared to evidence for exercise improving sensorimotor function, more evidence
exists to support the benefit of PA and fitness to the cardiac autonomic nervous system. In
general, a variety of exercise programs have been shown to improve heart rate variability—
particularly in patient populations with diabetes, chronic heart failure, prior myocardial
infarction, or those that undergo coronary artery bypass grafting [130]. These prior studies
generally involved small sample sizes (n<50) with exercise programs ranging in duration from 2
to 52 weeks.
In one study focusing on older adults, an intensive, 14-week interval cycling training
program was found to increase heart rate variability in a small sample of older men (n=11, age
73.5 ± 4.2 years) [170]. However, these older men were former trained cyclists free of any
known cardiac abnormalities, and are not representative of the population of older adults.
Although the intensity of this program may not be suitable for all older adults, this study
supports cycling as an exercise to improve autonomic nerve function. Because cycling is a non-
46

weight bearing activity, this form of exercise could be beneficial for older adults who have
difficulty walking.
The Diabetes Prevention Program (DPP) was a landmark phase III randomized clinical
trial which compared a lifestyle intervention (PA + diet), Metformin treatment, and control for
the development of diabetes in pre-diabetic adults (age 50.4 ± 10.6 years). Heart rate variability
was measured at baseline and annually throughout the four year trial using a ten second 12-lead
ECG segment [171]. Mean heart rate, standard deviation of all normal-to-normal R-R intervals
(SDNN), and the root mean square of successive differences between all normal-to-normal R-R
intervals (rMSSD) were generated for examining cardiac autonomic function. These measures
did not vary between treatment groups at baseline; however, the lifestyle intervention group saw
the greatest improvements in these measures over the mean follow up of 3.2 years (p<0.05 for
all). Heart rate decreased by 4.74 beats per minute (95% CI: -5.21 to -4.27) for the lifestyle
group, compared to a decline 1.88 beats per minute for the Metformin group (95% CI: -2.39 to -
1.37), and a decline of 2.12 beats per minute (95% CI: -2.57 to -1.67) in the control group. For
SDNN, the lifestyle group experienced an increase of 1.32 (95% CI: 0.32 to 2.34) ms, while
there was no significant change for the Metformin group, and the control group experienced a
decline in this measure of 1.21 ms (95% CI: -2.03 to -0.39). The lifestyle group also saw
improvements in rMSSD over the follow-up period (change of 2.98 ms, 95% CI: 1.71-4.25)
while there were no significant changes for either the Metformin or control groups. Although
physical activity was a main component to the lifestyle intervention in the DPP, weight loss
through dietary modifications was also an important part of the study. Physical activity could
very well have played a major role in the heart rate variability improvements seen by the lifestyle
intervention group, but weight loss and dietary changes may have also contributed.
47

This study was important in that it focused on heart rate variability in a population free of
disease at baseline, and the fact that the PA program focused on moderate-intensity activities that
could easily be adopted by older adults. Additionally, the large, multicenter design of this study
improved generalizability. Though the lifestyle intervention was most effective in the prevention
of diabetes in participants age 60-85 [172], the results for this study were not stratified by age, so
we cannot conclude whether the improvements in heart rate variability in the lifestyle group were
different across age groups.
In the Look AHEAD study, overweight adults with type 2 diabetes (n= 5145 participants
from 16 study centers, age 45-75 years) were randomized to participate either in an intensive
lifestyle intervention (weight loss via physical activity and dietary changes) or diabetes support
and education (general recommendations about healthful eating and physical activity in type 2
diabetes) [173]. The primary purpose of the Look AHEAD trial was to assess whether the
intensive lifestyle intervention was successful in reducing cardiovascular morbidity and mortality
long-term.
Several measures of cardiovascular function were collected in this study, and in a paper
by Ribisl and colleagues, change in heart rate recovery from baseline to 1-Year follow-up were
assessed [174]. At baseline, participants underwent a graded exercise treadmill test in order to
assess maximal cardiorespiratory fitness. Fitness testing was repeated at the 1-Year follow-up,
though this test was submaximal. Because of the potential for certain medications, namely beta-
blockers, to influence heart rate response during exercise, participants taking these medications
were analyzed separately. Heart rate recovery was used in this study as a measure of autonomic
function.
48

At baseline, no differences existed between the intensive lifestyle group vs. the diabetes
education group in any measure of heart rate (resting heart rate, peak exercise heart rate, heart
rate range, heart rate at 2-minutes post-test, and heart rate recovery), stratified by beta blocker
use. After one year of follow-up, the intensive lifestyle intervention group not taking beta-
blockers had significantly lower resting heart rate, higher heart rate range, lower heart rate at 2-
minutes post-test, and better heart rate recovery compared to those not taking beta blockers in the
diabetes support and education group. These relationships were also observed between the
intensive lifestyle intervention group and diabetes support and education group in those taking
beta-blocker, though the associations were not as strong. Though the effects of weight loss,
dietary changes, and physical activity cannot be teased apart in this study in terms of which had
the largest effect on autonomic improvement, this study provides evidence that cardiac
autonomic function can be improved via an intensive lifestyle intervention for those with type 2
diabetes. Physical activity interventions appear to be promising for improving cardiac
autonomic function, though more work is needed to determine the effect for older adults.
1.5 PHYSICAL ACTIVITY AND OLDER ADULTS
Throughout history—with the exception of the past few decades—humans had little
choice but to live active lifestyles in order to survive. Although modern life is astronomically
different from that of our Stone Age ancestors, in a biologic and metabolic sense we are still
programmed for their way of life. From an evolutionary standpoint, optimization of aerobic
metabolic pathways was advantageous in order to conserve energy and prepare for food
shortages [175]. Today, food shortages are uncommon in most developed nations and
49

overconsumption of calories is a cause for concern. Physical inactivity leads to decreased
skeletal muscle insulin sensitivity and increased abdominal fat storage, both of which play roles
in promoting metabolic dysfunction [175]. Some exercise physiologists assert that rather than
studying the effects of physical activity, we are actually studying “the effect of reintroducing
exercise into an unhealthy sedentary population that is genetically programmed to expect
physical activity” [176]. Physical activity across the lifespan is associated with lower levels of
fat mass in women in early old age, and in higher appendicular lean mass in both older men and
women [177].
Physical Activity Definitions and Recommendations 1.5.1
Physical activity has been defined as “any bodily movement produced by skeletal
muscles that results in energy expenditure” [178], while exercise “is a subset of physical
activity that is planned, structured, and repetitive and has as a final or an intermediate objective
the improvement or maintenance of physical fitness” [178]. The 2008 Physical Activity
Guidelines for Americans recommends that older adults follow the guideline of performing at
least 150 minutes per week of moderate intensity activities, 75 minutes of vigorous intensity
activities, or a combination of both, which is consistent with the guidelines for healthy adults
[179]. Activities should be performed in bouts of at least 10 minutes, and for optimal health
benefits, it is recommended to gradually work up to accumulating 300 minutes per week of
moderate activities or 150 minutes per week of vigorous activities. Ideally, this activity should
be spread throughout the week. In addition, strength training exercises should be performed at
least two days per week at a moderate to high intensity, while working all major muscle groups.
50

Although these guidelines may be appropriate for older adults without major disease, it
has been acknowledged that older adults who are very unfit or have chronic conditions may not
be able to achieve these recommendations. Instead, these older adults should be as active as their
conditions allow, and any amount of physical activity is better than none. For older adults, the
recommendations include performing balance exercises, particularly if they are at risk for falling,
although the guidelines do not describe those who may be at fall risk. Balance exercise
examples may include backwards walking, standing on one foot, toe stands, and heel or toe
walking. These exercises should be progressive, working towards more difficult skills once
beginning balance exercises are mastered. Three days of balance exercises are recommended
from a balance program designed to reduce the risk of falls in older adults. Flexibility exercises
are also important for older adults in order to maintain the range of motion necessary for
activities of daily living and physical activities. Flexibility exercises should not take the place of
aerobic or strength training activities, and are not known to confer any specific health benefit.
Due to the lack of clear evidence of the ideal frequency or duration of flexibility exercises for
older adults, no specific flexibility training guidelines exist. All of the above recommendations
are consisted with the guidelines set in the ACSM position stand for exercise and older adults
[26].
Health and functional status can play major roles in the ability for older adults to adopt a
physically active lifestyle [180]. Physical activity could potentially play a role in improving
health, but those with health issues may need additional guidance and support from fitness and
health care professionals on becoming active. In fact, pain and poor health are the two most
common reasons older adults cite as their reason for not being physically active [181]. Also,
acute illnesses, which are common in older adults, can quickly lead to loss of muscle tissue and
51

strength and can delay recovery and the return to prior functional status [182]. Each consecutive
illness can lead to inactivity, strength and aerobic capacity declines, and make it harder to return
to prior functional capacity. Continuation of this cycle can be extremely detrimental and put
older adults at much higher risk for disability [182].
Physical Activity Epidemiology in Older Adults 1.5.2
Despite the numerous health benefits associated with physical activity, older adults are
the most physically inactive age group in the U.S. [24], with only roughly 10% of adults age 70+
reaching national physical activity guidelines [183]. Over the past 50 years, physical activity has
been declining in the population, and these declines can be attributed to changes in occupations,
land use, and transportation, and increase in sedentary behaviors like television watching and
computer use [184]. NHANES data from 2005-2006 have indicated that the mean minutes of
moderate activities declines with age, with 20-29 year old individuals achieving an average of
approximately 58 minutes per week, in contrast to those who are age 70 and older, who achieve
only approximately 20 minutes of moderate activity per week [183]. Physical activity was
measured via hip-worn accelerometry. Though the average number of minutes of moderate
activity declines with age, on average, even younger adults do not reach the minimal
recommendations of 150 minutes per week.
Prior studies incorporating objective measures of physical activity have shown that most
of the activity energy expenditure in older adults comes from sedentary or light activity, like
housework or sitting activities [25]. Because light and sedentary activities are difficult to recall
using subjective measures, objective tools (like accelerometers and other physical activity
monitors) are needed to capture the full range of activity. Also, recent work has shown that
52

separate health risks from sedentary behaviors exist, independent of physical activity [185,186].
Objective physical activity measures can allow investigators to examine both sedentary activities
and physical activities; however, this is a more recent area of focus, and many studies still focus
on moderate or vigorous physical activity, which may not be common in populations of older
adults.
Methodological Issues in Measuring Physical Activity in Older Adults 1.5.3
Accurately assessing physical activity is challenging in all populations, though there are
some methodological issues unique to assessing activity in older populations. Table 3 describes
common tools used to measure physical activity, and the strengths and limitations of these tools.
Unfortunately, no single tool is perfect, and strengths and limitations must be considered when
designing a study.
When choosing a tool for measuring physical activity, several factors must be considered.
First, cost is often a barrier, particularly for large scale epidemiologic studies. Although the cost
of many physical activity monitors has dropped substantially as technology has improved, the
cost of purchasing hundreds of monitors and the needed software for data processing can be
prohibitively expensive. Second, an appropriate assessment tool should be appropriate for
measuring the types of activities the population actually does. Common domains of activity
include occupational activity, transportation, household and care taking, and sports and leisure
[187]. In the context of older adults, a questionnaire focusing on occupational activities, sports
participation, or activities that older adults are unlikely to do would be inappropriate and likely
lead to an underestimation of physical activity. Questionnaires specifically developed for and
validated in older adult populations, such as the Physical Activity Scale for the Elderly (PASE)
53

[188] or CHAMPS [189] would be important to consider. Because light intensity activities make
up a large proportion of energy expenditure by older adults, and these light activities can be
difficult to recall, physical activity monitors can help to capture the full spectrum of activity
intensity. In general, subjective methods are appropriate for assessing moderate and higher
intensity activities, while objective measures are more accurate in assessing a range of physical
activities [187]. Similarly, the tool of choice should accurately measure the exposure (type of
activity) of interest. For example, if light activity is of interest, an objective measure may better
capture the exposure rather than a questionnaire. However, a limitation of accelerometry and
other activity monitors is that although they can give information about physical activity
participation on a full spectrum of intensity, they do not give information about specific
activities. For example, resistance training and weight-bearing activity are important for bone
density [190], though in general, many activity monitors cannot currently distinguish these from
other activities. Though limitations exist with monitors, this is a quickly growing field and the
conjunction of physical activity researchers with computer scientists has driven the development
of novel analysis techniques and algorithms which can aid in the recognition of specific activities
and patterns.
Intensity is an important aspect of classifying types of physical activity, though intensity
is a relative term. Activity that one individual may consider “moderate” for one individual may
be “very intense” for another individual who has very low aerobic capacity or functional ability.
Physical activity monitors can help classify intensity though objective definitions, however,
many definitions of intensity were developed from work in young, healthy populations.
Comparing activity between younger and older adults even using objective measures should be
done with caution. Though older age is associated with lower levels of physical activity, making
54

absolute comparisons between older and younger adults may be inappropriate using cut-points.
Some groups have begun utilizing alternative measures from acceleromtery data rather than
counts using cut-points to determine intensity. These measures include minute-by-minute
activity counts to examine patterns of activity throughout the day; cumulative activity counts to
determine total activity for a day [191]. The field of computer science has also begun to intersect
with physical activity epidemiology, and techniques using raw acceleromtery to identify specific
activities have also been developed [192,193]. However, currently these techniques require
considerable training in computer science and biostatistics to use, though these developments
will ultimately help shape physical activity assessment in the future and hopefully help to
improve current measurement methods.
Unfortunately, physical activity is not just a public health issue in the United States, but
the issue is prevalent in other westernized nations, and is increasingly becoming a problem in
developing nations as well [194]. Worldwide, older age is associated with lower levels of
physical inactivity, which could lead to a major global public health burden in conjunction with
the aging population becoming the fastest growing demographic [195]. Direct comparisons of
physical activity levels between countries are difficult due to inconsistent methods used to
measure activity, and the lack of reliable data from many low income countries [196].
Expectations about the aging process can influence whether older adults remain or become
physically active or participate in other healthy behaviors [197,198]. Norms and expectations
regarding aging can vary widely between cultures [199], adding to the complexity of promoting
physical activity on a global scale.
55

Table 3: Common Tools Used to Measure Physical Activity
Measurement Tool Description Advantages
Disadvantages
Physical Activity Scale for the Elderly (PASE)
The PASE assesses physical activity from the past seven days. Participants indicate how often and for how long they participated in activities in each intensity category. Participants also indicate whether they participated in household, gardening, occupational, or care giving activities [200]
The questionnaire refers to the past seven days, a period where recall should not be difficult. The questionnaire can be administered in less than 15 minutes, and it is easy to score, making it feasible to incorporate into large studies.
Activity from the past seven days may not be representative of an individual’s usual activity habits, which may be more relevant to health outcomes. In a validation study, the correlation between PASE score and doubly labeled water was 0.28 [201].
Modified Minnesota Questionnaire used in the Health Aging and Body Composition Study (Health ABC)
Measures leisure activity, housework, care giving, walking, and stair climbing. Participants first indicate whether they have done each specific activity at least 10 times in the past year. If yes, participants are then questioned about the number of times per week and the duration [202]. Time spent in the activity is multiplied by its metabolic equivalent [203] to obtain weekly energy expenditure.
This questionnaire is easy and quick to administer. Although modified from its original form in order to be appropriate for Health ABC, energy expenditure from this questionnaire is associated with functional outcomes important in studies of older adults [204].
Because this is a modified questionnaire, validation data does not exist specifically for this questionnaire. Energy expenditure values resulting from scoring the total energy expenditure from the original Minnesota Leisure Time Questionnaire (MLTQ) is weakly correlated with total energy expenditure measured by doubly labeled water (r=0.23) . MLTQ energy expenditure (from the original or modified version) may not accurately represent true energy expenditure. Rather, energy expenditure values should be used to rank or group participants. Additionally, participants may have difficulty recalling whether they participated in an
56

activity at least 10 times in the past year. Detailed questions are only asked about activity in the past seven days, which may not be representative of usual activity habits.
CHAMPS
Participants indicate the number of days per week and number of hours per session of various physical activities that older adults commonly do. The time frame used in this questionnaire is a “typical week in the past four weeks” [189].
Participants are instructed to think about a typical week in the past four weeks, which may better represent usual activities. In addition to questions about physical activities, this questionnaire also contains questions about other activities that older adults may do (i.e. play cards, visit with friends, etc), to minimize socially desirable responding. The questionnaire can be administered quickly in about 10-15 minutes.
Participants may have difficulty quantifying activity from a “usual week” of the past month.
Physical Activity Diary
Participants record all of their physical activities for a specified duration (i.e. seven days). Typically the specific activity, duration, and intensity are recorded.
Participants can indicate all activities rather than choosing from a specific list of activities. In theory, since participants are recording the activities as they do them, there should be fewer recall issues.
This method requires considerable participant burden. Participants may stop recording their activity if they feel the diary is burdensome. Additionally, calculating and processing data from a physical activity diary is difficult and time consuming for study staff.
Table 3 Continued
57

Accelerometer
Accelerometers have the capability to capture movement and quantify that movement for the assessment of activity intensity, duration, and frequency.
Accelerometers objectively measure physical activity and are able to capture the full range of physical activity: sedentary, light, moderate, and vigorous.
Specialized software is needed to process accelerometry counts. Several cut-points have been identified for distinguishing the intensity of various activities. However, many cut-points have been established using younger adults and may not be appropriate for older adult populations [205]. Additionally, accelerometers may underestimate step counts for individuals who walk very slowly [206].
ActivPAL Inclinometer
This physical activity monitor is attached to the right upper thigh and records body posture. This monitor can identify lying, sitting, and standing positions, as well as transitions and steps.
This monitor provides accurate and valid estimations of time spent lying, sitting, and standing upright, which is useful for studies examining sedentary time.
Step counting may be less accurate for older adults with impaired physical function and slow gait speed [207]. This monitor is to be used for identifying time spent in various postures, and should not be used in a study where the aim is to measure physical activity.
Pedometer
Pedometers are small devices used for counting steps and are typically worn on the waist band.
Pedometers are inexpensive and can be easily incorporated into an epidemiologic study or clinical trial. Recording step counts is relatively easy and has a low participant burden.
Pedometers may underestimate step counts for those with very slow gait speed [206]. Accuracy of pedometers can vary widely between various piezoelectric and spring levered devices [208]. Positioning on the body is very important. If the device is not positioned properly, it may not be able to detect steps. Additionally, since pedometers only count steps, any activity that does not involve walking or running (i.e. biking, swimming, and weight lifting) would not be counted.
Table 3 Continued
58

Body Media SenseWear Armband
This physical activity monitor is worn on the upper arm and uses body temperature, heat flux, galvanic skin response, and a tri-axial accelerometer to calculate energy expenditure and track physical activity and sleep [209].
This activity monitor has been validated to provide estimates of energy expenditure in older adults [210].
There have been some reports of minor discomfort while wearing the device [211]. Those with low shoulder mobility may have difficulty putting the monitor on and taking it off.
Doubly Labeled Water
This method involves the ingestion of a measured amount of water labeled with isotopes of oxygen and hydrogen that can be traced as they break down and leave the body, and this rate is used to calculate energy expenditure using calorimetric equations [212].
This method is considered to be the gold standard for assessing free-living energy expenditure. Energy expenditure can be assessed over periods of several days or several weeks, and this method has relatively low participant burden.
Although this method gives information about energy expenditure, the types of activities a participant engages in cannot be assessed. Also, the required isotopes and equipment needed for doubly labeled water analysis is cost prohibitive for large epidemiologic studies.
Table 3 Continued
59

1.5.3.1 Sensorimotor Peripheral Nerve Function Impairments and Exercise Prescription
On a national scale, brisk walking is encouraged as a primary mode of aerobic exercise.
Although walking is important for the maintenance of independence, situations exist where
walking is not the most appropriate mode of exercise. For example, many symptoms that
develop in the lower extremities during peripheral nerve function decline, including numbness in
the feet can make weight bearing exercises like walking—difficult and painful. In the ACSM
and American Diabetes Association (ADA) joint position statement on exercise and type 2
diabetes, this difficulty has been acknowledged, and non-weight bearing activities (e.g.
swimming or biking) are recommended for those who have symptoms in the feet and lower
extremities. If a walking exercise program is deemed appropriate for a patient, foot care is
highlighted as a vital component of the program in order to prevent open sores or ulcers [162].
Translating this recommendation to older adults without diabetes but with peripheral nerve
function impairments is important since these symptoms can occur in the absence of diabetes.
1.5.3.2 Cardiac Autonomic Function Impairments and Exercise Prescription
Cardiovascular autonomic neuropathy and nerve function decline brings its own set of
challenges when prescribing exercise for older adults. Pre-participation screening by a physician
is an important step before beginning an exercise program for individuals with cardiovascular
risk factors, metabolic disease, or for older adults aiming to exercise at a high intensity [148].
Due to the risk of adverse cardiac events with CAN, a physician should evaluate those with CAN
before beginning an exercise program. Screening should be performed in order to detect
cardiovascular abnormalities [162].
60

Because those with autonomic neuropathy often have resting tachycardia but reduced
maximal heart rate, the estimated maximal heart rate calculation of 220 minus age may not be
suitable for assessing exercise intensity [213]. Alternatively, having participants indicate their
rating of perceived exertion (RPE) is appropriate, providing that the scale has been fully
explained. Because cardiac autonomic nerve function impairments are associated with low
exercise tolerance, physical activity programs should start with short bouts, with gradual
increases in duration and intensity. It may take a considerable amount of time before a
participant with low exercise tolerance can work up to achieving the recommended dose of
physical activity consistent with national guidelines.
1.6 SPECIFIC AIMS
Sensorimotor Peripheral Nerve Function and Physical Activity 1.6.1
A major gap in knowledge exists for the descriptive relationship between physical
activity and peripheral nerve function in older adults. The work by Loprinzi [158] and
colleagues examining objectively measured physical activity and peripheral neuropathy in
diabetic participants from NHANES disregarded the importance of light activities and only
focused on MVPA, though it is known that levels of MVPA may be low in the general
population, particularly in the general population of older adults. This study also only focused
on those with diabetes, and peripheral nerve function was not measured, rather peripheral
neuropathy was used as the outcome. In MrOS, peripheral nerve function measures were
collected at Visit 3, along with objectively measured physical activity. Although this study only
61

includes older men, the large sample size, variety of sensorimotor peripheral nerve function
measures, and objectively measured physical activity data make this study an excellent
opportunity for determining the descriptive relationship between physical activity and peripheral
nerve function.
Specific Aim 1: To determine whether better peripheral nerve function is associated with
higher levels of physical activity participation and fewer minutes of sedentary time in older men.
Hypothesis: Men with better sensorimotor peripheral nerve function will participate in
more minutes of physical activity (light, moderate, and vigorous activity) and fewer minutes of
sedentary behaviors per day compared to older men with worse sensorimotor peripheral nerve
function.
Sensorimotor Peripheral Nerve Function and Endurance Walking Performance 1.6.2
Second, we do not know how sensorimotor peripheral nerve function impacts endurance
walking. In the Health, Aging, and Body Composition (Health ABC) study sensorimotor
peripheral nerve function measures were collected the 2000/01 clinic visit. Additionally, the
long distance corridor walk (LDCW)—a validated measure of walking endurance in older adults
[214] was administered at the 2000/01 clinic visit, and every other year thereafter through the
10th year of the study (2006/07 clinic visit). Currently the relationship between walking
endurance and sensorimotor peripheral nerve function has not been explored in a longitudinal
matter, making this a novel analysis.
Specific Aim 2: To determine whether worse sensorimotor peripheral nerve function
associated with worse performance over time on an endurance walking test, the long distance
corridor walk (LDCW).
62

Hypothesis: Participants with worse sensorimotor peripheral nerve function will be more
likely to be ineligible or unable to complete the LDCW, will have slower initial completion
times, and experience greater slowing over time compared to those with better sensorimotor
peripheral nerve function.
Sensorimotor Peripheral Nerve Function and Indicators of Cardiac Autonomic 1.6.3
Function
Finally, sensorimotor peripheral nerve function and cardiovascular autonomic function
are often studied separately, though function in both divisions is worse in older age.
Cardiovascular autonomic function can be assessed using heart rate and blood pressure measures
from fitness tests, like the Long Distance Corridor Walk in Health ABC. Because of the common
risk factors associated with sensorimotor and autonomic peripheral nerve impairments
(particularly cardiovascular risk factors), it is plausible that those with worse sensorimotor
peripheral nerve function also have worse cardiac autonomic peripheral nerve function. Using
sensorimotor peripheral nerve function measures and information on heart rate measured during
the LDCW from Health ABC 2000/01 clinic visit (resting heart rate, heart rate response to the
LDCW, and heart rate recovery after the LDCW), we can assess the associations between these
two divisions.
Specific Aim 3: To determine whether sensorimotor peripheral nerve function is
associated with cardiac autonomic function in older adults.
Hypothesis: Older adults with better sensorimotor peripheral nerve function will also
have better cardiac autonomic function.
63

2.0 SENSORIMOTOR PERIPHERAL NERVE FUNCTION AND PHYSICAL
ACTIVITY IN OLDER MEN
ABSTRACT
Sensorimotor peripheral nerve (PN) impairments are common in older adults and
negatively impact mobility. The purpose of this study was to determine whether worse PN
function is associated with lower levels of PA in older men. In 2007-09, participants at the
Pittsburgh, PA, site of the Osteoporotic Fractures in Men Study (age 78.9 ± 4.7 years) underwent
nerve conduction testing of the peroneal motor and sural sensory nerves to assess amplitude,
latency, and f-wave latency. Sensory PN function was also assessed using 1.4g and 10g
monofilaments. Symptoms of peripheral neuropathy were collected via self-report. Self-report
PA was assessed using the Physical Activity Scale for the Elderly (PASE). PA was assessed
objectively using a multisensor armband to determine minutes per day spent in sedentary (<1.6
METS, excluding sleep), light (1.6 to <3.0 METS), moderate (3.0 to <6.0 METS) and vigorous
(6.0+ METS) activity. Continuous measures of PN function were split into worse function
(lowest tertile) and better function (highest two tertiles) to approximate clinical thresholds of PN
function. We compared adjusted mean PASE scores between PN function groups using
ANOVA. Multivariate linear regression modeled the association between PN function and
minutes per day of each level of activity.
64

Participants (n=341) spent a median of 832.4, 63.8, 69.2, and 8.80 minutes per day in
sedentary, light, moderate, and vigorous activities, respectively. Higher mean PASE scores
(adjusted for age, BMI, self-reported health, diabetes, peripheral arterial disease, and arterial
stiffening) were found for those with better distal motor compared to those with worse distal
motor latency (PASE score 160.6 vs 138.3, p<0.01). Participants reporting any neuropathic
symptoms had lower mean PASE scores compared to those with no symptoms (131.9 vs. 155.8,
p<0.05). In unadjusted models, men with better motor amplitude participated in 17.9%, 19.4
and 41.5% more minutes of light, moderate and vigorous activity per day, and 3.9% fewer
minutes in sedentary time compared to those with worse motor amplitude (p<0.05 for all).
Participants with better sensory amplitude participated in 19.6%, 24.1, and 41.4% more minutes
of light, moderate, and vigorous activity compared to those with worse sensory amplitude,
though sedentary time did not differ. Adjusting for age, BMI, self-reported health, diabetes,
peripheral arterial disease, and arterial stiffening attenuated many relationships with light,
moderate, and sedentary time to non-significance, though those with better amplitude
participated in more vigorous activity then men with worse amplitude. No relationships were
found with other nerve function measures. Worse sensory and motor PN function is associated
with less PA in older men, indicating a potential pathway for disability that warrants further
investigation.
2.1 INTRODUCTION
Sensorimotor peripheral nerve (PN) dysfunction negatively impacts mobility in older
adults—a cornerstone for maintaining independence. Worse sensorimotor PN function in older
65

adults is associated with poorer lower extremity function [31-34,66], strength [36,215], and
power [37], as well as an increased risk for falls [38-41] and mobility disability [216]. Deficits in
sensorimotor nerve function may result in pain or loss of sensation in the extremities, which
could greatly influence the ability to be physically active.
Currently, few studies have examined the association between clinical peripheral
neuropathy and physical activity (PA), and existing studies have focused on adults with diabetes
[157,158] rather than community-dwelling older adults. Though diabetes is a common
contributor to PN impairments, PN dysfunction occurs with aging even in the absence of
diabetes [29]. Worse PN function is associated with worse lower extremity outcomes in older
adults even without diagnosed clinical peripheral neuropathy [31], highlighting the importance of
examining a full range of PN function.
A major gap in the literature exists regarding the descriptive relationship between PN
function and PA in older adults. Examining objectively measured physical activity across a wide
range of intensities (including light activity) may be beneficial for clarifying the relationship
between PN function and PA in older adults—particularly since older adults spend very little
time in moderate or vigorous PA [25,159]. Despite the potential for lower extremity function to
influence the ability to be physically active, the relationship between PN function and PA
participation has not been explored in community dwelling older adults. Whether worse PN
function is related to lower levels of PA is unclear, though PA could potentially be in the
pathway from PN impairments to mobility disability. The aim of this study was to determine
whether better PN function is associated with higher levels of participation in PA in older men.
66

2.2 METHODS
Participants 2.2.1
Participants at the Monongahela Valley, PA (near Pittsburgh, PA), site of the
Osteoporotic Fractures in Men Study (MrOS) underwent peripheral nerve function assessments
at the 2007/09 clinic visit. Briefly, MrOS is a multicenter longitudinal cohort study of healthy
aging focusing on the risk factors for fractures in older men (n=5,994; mean age 73.7 ± 5.9 years
at baseline) [217]. Ambulatory men age 65 and older were recruited and completed the baseline
visit between March 2000 and April 2002 from six U.S. clinical sites [218]. Eligibility criteria
for the main study at the baseline visit included the ability to walk without assistance from
another person or walking aid, ability to provide self-reported data, capacity to understand and
provide informed consent, absence of bilateral hip replacement, absence of any severe disease or
condition that would results in imminent death, and anticipated residence near a clinical site for
the duration of the study period. In total, 426 men had PN function and PASE questionnaire data
the 2007/09 clinic visit, and objective physical activity data was available for 341 participants
(Figure 2). The study protocol was approved by the University of Pittsburgh Institutional
Review Board, and all participants provided written informed consent before testing.
67

Figure 2: Participant Flow Diagram from the MrOS Pittsburgh Site
Peripheral Nerve Function Examination 2.2.2
Nerve conduction testing was performed bilaterally on the deep peroneal motor nerve and
the sural sensory nerve using an automated nerve conduction study device (NC-stat)—a valid
and reliable method for assessing nerve function in older adults [92]. Before testing,
participants’ feet were warmed to 30°C if they were <30°C. Peroneal motor nerve parameters
included: motor amplitude of the compound muscle action potential in millivolts (CMAP); distal
motor latency in milliseconds; and mean F-wave latency in milliseconds. Sural sensory nerve
measures included sural nerve action potential (SNAP) and sensory amplitude in microvolts and
distal sensory latency in milliseconds. Continuous measures of nerve function were split into
poor function (lowest tertile) and higher function (middle and highest tertiles) to approximate
clinically relevant cut points indicating poor nerve function.
68

Sensory PN function was also assessed through monofilament testing using light (1.4-g)
and standard (10-g) monofilament touches at the dorsum of the left great toe. Light and standard
monofilament sensitivity were defined as feeling at least 3 out of 4 touches, while insensitivity
was defined as the inability to detect three touches. The standard monofilament was only used if
the participant had light monofilament insensitivity. Sensory testing was performed on the non-
dominant side while motor testing was performed on both sides except in the case of technical
difficulty.
Symptoms of peripheral neuropathy within the past 12 months were assessed via self-
report from a modified Michigan Neuropathic Screening Instrument [108] and included (1)
numbness or tingling, (2) sudden stabbing, burning, or aches, or (3) an open persistent sore or
gangrene on either foot or leg in the past 12 months.
Physical Activity Assessment 2.2.3
Self-report physical activity was assessed using the Physical Activity Scale for the
Elderly (PASE) [200]. Briefly, the PASE includes questions about the intensity, frequency, and
duration of various physical activities over the past seven days. Activities include walking,
strenuous (ex. jogging, swimming, singles tennis), moderate (ex. golf without a cart, doubles
tennis) and light activities (ex. golf with a cart, shuffleboard), muscle strengthening exercises,
lawn work and gardening, occupational activities that include walking or standing, caring for
another person, home repairs, and housework. The frequency and duration of participation in the
various categories are multiplied by activity weights based on intensity and summed in order to
give a total PASE score. The PASE score is a unitless, relative measure, with higher scores
indicating higher levels of physical activity. The PASE has been previously validated against
69

energy expenditure measured via doubly labeled water [188,201] and objectively measured PA
[219,220], and PASE score has been correlated with physiologic and performance characteristics
in older adults [221]. The PASE has high test-retest reliability [200,222] and longitudinal
changes in PA over approximately five years have been previously described in the MrOS study
population [223].
Objective physical activity was measured using the SenseWear Armband (SWA; Body
Media, Inc., Pittsburgh, PA). Participants were instructed to wear the monitor at all times for 7-
days, removing the monitor only for brief periods for bathing or water activities. The SWA
includes heat flux, galvanic skin response, skin temperature, and near body temperature sensors,
as well as a two-axis accelerometer. Data were sampled in 1-minute epochs and used to estimate
energy expenditure in kilocalories per day [224]. Data collected by the sensors along with age,
height, weight, handedness, and smoking status were used in propriety algorithms (Innerview
Professional 5.1 software) to estimate energy expenditure, metabolic equivalents (METS), and
sleep time. Energy expenditure measured by SWA has been validated using doubly labeled
water in older adults [210]. Average minutes per day spent in each level of PA were calculated
using MET cut-points, with categories being defined as follows: light/lifestyle activity = 1.6 to
<3.0 METS, moderate activity 3.0-<6.0 METS, vigorous activity 6.0+ METS, and sedentary
time < 1.6 METS (excluding sleep time). Total time spent in each of these categories during the
wearing period was averaged over all days in order to limit variability and reflect usual activity
patterns. As described previously by Cawthon and colleagues [225], if a participant wore the
monitor < 90% of the time during any 24-hour period, that period was not used in calculating
energy expenditure. Only participants with at least five 24-hour periods were included in
analyses.
70

Covariates 2.2.4
We considered several factors potentially related to PA or PN function as covariates.
Height and weight were measured using a stadiometer and calibrated balance beam scale,
respectively, and were used to calculate body mass index (BMI). Lean and fat mass were
measured using dual-energy x-ray absorptiometry (Hologic 4500A). Diabetes was defined by
fasting glucose measure of ≥126mg/dL [226] at the baseline MrOS clinic visit or self-reported
physician diagnosis at the 2007/09 clinic visit. Peripheral arterial disease was defined as ankle-
brachial index (ABI) of <0.9, while arterial stiffening was defined as an ABI of >1.3 [227]. The
Teng Modified Mini-Mental State Exam (3MSE) was used to assess cognition [228] and the
Geriatric Depression Scale (GDS) measured depressive symptoms [229]. History of cigarette
smoking (never, current, former), current alcohol consumption (drinks/week), and health status
(excellent, good, fair, poor, very poor) were assessed though self-report. Chronic health
conditions included self-report hypertension, congestive heart failure, cerebrovascular disease,
and cardiovascular disease.
Statistical Analyses 2.2.5
Descriptive statistics were expressed using mean ± standard deviation for continuous
variables or median and interquartile range where appropriate, and frequencies for categorical
variables. Participants were grouped based upon tertile of daily average METS from the
SenseWear Armband, and tests of trend were used to assess differences in participant
characteristics between the three ordered groups. PN function measures and minutes spent in the
four levels of activity were also compared between MET groups. ANOVA models compared the
71

adjusted mean PASE score between PN function groups. Because many measures of PN
function were correlated (correlation coefficients ranging from 0.17 for sensory amplitude and
latency and 0.34 between motor and sensory amplitude, p<0.05 each), each measure of PN
function was modeled separately. Multivariate linear regression was used to model the
association between PN function and objectively measured PA, which allowed an examination of
the effect of PN function on participation in each level of activity (sedentary, light, moderate,
and vigorous) in one model. This method makes use of the correlations between the components
of the multi-dimensional outcome to better identify differences between the groups. Minutes
spent in each level of activity were right skewed to no activity, thus natural logged versions of
these variables were used for analysis. Results were back transformed in order to report minutes
spent in each level of activity.
All models (ANOVA models for PASE; multivariate regression models for SWA
outcomes) were built progressively, with covariates with p<0.10 being considered for a
multivariable model, though diabetes was forced into the final model regardless of significance.
Factors that could influence PA or PN function were considered as covariates until a final,
parsimonious model with only factors reaching p<0.05 was determined for each PN function
predictor and PA level outcome. All data analyses were performed using STATA version 12.1
(StataCorp, College Station, TX).
2.3 RESULTS
Participants (n= 341, age 78.7 ± 4.7 years, BMI 28.1 ± 4.0 kg/m2) in this cohort of older
men spent a median of 832.4, 63.8, 69.2, and 8.80 minutes per day in sedentary, light, moderate,
72

and vigorous activities, respectively. Those with lower mean daily MET levels were older,
consumed fewer drinks per week, had higher BMI, higher fat and lean mass, were more likely to
have diabetes, and reported more depressive symptoms compared to those in the higher mean
daily MET tertile (Table 4; p<0.05 for trend for all). Differences across other chronic conditions
and diseases were not significant. Participants with lower daily average MET levels had lower
motor amplitude, were more likely to have 1.4 or 10-g monofilament insensitivity, and had a
higher burden of neuropathic symptoms—particularly numbness (Table 4). As expected, those
with lower daily MET levels had lower scores on the PASE, spent fewer minutes per day in
light, moderate, and vigorous activities, and spent more minutes per day being sedentary
compared to those with higher daily MET levels (Table 5; p<0.001 for all).
73

Table 4: Participant Characteristics by Tertile of Average Daily METS
Tertile 1 (n=114 ) Average Daily METS: 0.79 – 1.11
Tertile 2 (n= 114) Average Daily METS: 1.11 -- 1.29
Tertile 3 (n= 113) Average Daily METS: 1.30 – 2.11
P for Trend
Age, Mean ± SD 80.0 ± 5.2 78.6 ± 4.6 77.6 ± 4.1 <0.001 Health Habits Drinks per week 2.4 ± 1.2 2.5 ± 1.2 2.9 ± 1.2 0.013 Current Smoker, N (%) 4 (3.5) 3 (2.6) 2 (1.8) 0.963 Former Smoker 64 (56.1) 73 (64.0) 67 (59.3) Body Composition Height, cm 171.8 ± 6.1 173.1 ± 6.1 171.9 ± 6.4 0.754 BMI, kg/m2 30.3 ± 4.0 27.9 ± 3.3 26.1 ± 3.4 <0.001 Fat Mass, kg 27.5 ± 7.0 22.7 ± 5.8 19.0 ± 6.1 <0.001 Lean Mass, kg 58.3 ± 7.5 57.0 ± 6.5 54.5 ± 7.0 <0.001 Chronic Health Conditions Diabetes, N (%) 35 (33.3) 20 (18.9) 17 (16.2) 0.003 Hypertension 72 (63.2) 59 (51.8) 60 (53.1) 0.127 Heart Attack 22 (19.3) 9 (7.9) 13 (11.5) 0.079 Stroke 7 (6.1) 3 (2.6) 7 (6.2) 0.988 Congestive Heart Failure 8 (7.0) 3 (2.6) 3 (2.7) 0.098 Peripheral Arterial Disease 14 (13.6) 13 (12.0) 8 (7.6) 0.210 Arterial Stiffening 18 17.5) 26 (24.1) 31 (29.3) Cognition and Mental Health 3MSE Score 92.8±5.3 94.3 ± 4.7 92.6 ± 6.3 0.554
GDS Score 2.0 ± 2.0 1.5 ± 1.6 1.5 ± 1.6 0.034
74

Table 5: Peripheral Nerve Function and Physical Activity by Tertile of Average Daily METS
Tertile 1 (n=114 ) Average Daily METS: 0.79 – 1.11
Tertile 2 (n= 114) Average Daily METS: 1.11 -- 1.29
Tertile 3 (n= 113) Average Daily METS: 1.30 – 2.11
P for Trend
Motor Nerve Function Motor Amplitude (CMAP), mV 1.9 ± 1.4 2.2 ± 1.6 2.6 ± 1.6 <0.001 Distal Motor Latency, ms 4.6 ± 0.9 4.6 ± 0.7 4.5 ± 0.8 0.757 Mean F-Wave Latency, ms 61.2 ± 4.5 61.6 ± 5.5 61.0 ± 5.5 0.924
Sensory Nerve Function Sensory Amplitude (SNAP), mV 2.2± 2.6 3.4 ± 3.0 4.0 ± 3.1 <0.001 Distal Sensory Latency, ms 3.2 ± 0.2 3.2 ± 0.2 3.2± 0.3 0.311 1.4-g Monofilament Insensitivity 25 (26.6) 31 (35.6) 17 (18.5) 0.012 10-g Monofilament Insensitivity 21 (22.3) 5 (5.8) 12 (13.0)
Neuropathic Symptoms Numbness 36 (38.7) 25 (28.7) 19 (20.7) 0.007 Stabbing Pain 15 (16.0) 11 (12.6) 11 (12.0) 0.425 Open Sore 1 (1.1) 2 (2.3) 0 (0.0) 0.492 Any symptoms 43 (45.7) 30 (34.5) 25 (27.2) 0.008 One Symptom 33 (35.5) 23 (26.4) 20 (21.7) 0.012 Two Symptoms 9 (9.7) 6 (6.9) 5 (5.4) Three Symptoms 0 (0.00) 1 (1.2) 0 (0.0)
PASE Score 118.6 ± 65.8 152.9± 57.3 172.6 ± 70.5 <0.001 Daily Minutes of Activity from SenseWear Armband, Median (Interquartile Range)
Sedentary, <1.6 METS 894.8 (830.4-953.8) 846.4 (806.0-908.4) 742.4 (693.7-808.0) <0.001 Light, 1.6 to <3.0 METS 38.5 (28.4-54.4) 63.7 (50.0-81.8) 89.4 (74.6-111.4) <0.001 Moderate, 3.0-<6.0 METS 37.5 (21.8-52.8) 71.1 (51.0-88.8) 134.0 (102.0-163.8) <0.001 Vigorous, ≥6.0 METS 4.7 (2.0-8.5) 8.6 (5.6-13.0) 17.8 (10.0-28.2) <0.001
75

Figure 3 displays the differences in adjusted mean PASE score (adjusting for age, BMI,
self-reported health, diabetes, peripheral arterial disease, and arterial stiffening) by PN function.
Those with better distal motor latency had significantly higher total PASE scores compared to
those with worse distal motor latency (160.6 ± 9.7 vs 138.3 ± 13.5, p=0.009). Those without
symptoms of peripheral neuropathy had higher PASE scores compared to those reporting one or
two or more symptoms (155.8 ± 10.3 vs 131.9 ± 13.3, p=0.007). Specifically, those without
numbness had higher PASE scores compared to those with numbness (153.5 ± 10.4 vs 132.4 ±
15.1, p=0.025). Motor amplitude, f-wave latency, sensory amplitude, distal sensory latency,
monofilament detection, stabbing pain, and presence of open sores were not associated with
PASE score.
76

Means adjusted for age, BMI, self-reported health, diabetes, peripheral arterial disease, arterial and stiffening. Continuous measures of nerve function were split into tertiles and those with worse function (lowest tertile of amplitude, highest tertile of latency) were compared to those with better function (combined highest and middle tertile of amplitude, combined lowest and middle tertile of latency). *P<0.05 for difference between groups.
Figure 3: Adjusted Means of Total Physical Activity Scale for the Elderly (PASE) Score by Peripheral Nerve Function
77

In unadjusted multivariate regression models examining minutes spent in objectively
measured activity, men with better CMAP participated in 17.9%, 19.4 and 41.5% more minutes
of light, moderate and vigorous activity per day, and 3.9% fewer minutes in sedentary time (data
not shown) compared to those with worse CMAP (p<0.05 for all). Participants with better
sensory amplitude participated in 19.6%, 24.1, and 41.4% more minutes of light, moderate, and
vigorous activity compared to those with worse sensory amplitude, though sedentary time did not
differ. Adjusting for age, BMI, self-reported health, diabetes, peripheral arterial disease, and
arterial stiffening attenuated the relationships with light, moderate, and sedentary time to non-
significance. Those with better motor amplitude participated in 27.2% more minutes of vigorous
activity compared to those with worse motor amplitude (p=0.015), while those with better
sensory amplitude participated in 24.2% more vigorous activity compared to those with worse
sensory amplitude (p=0.046) (Figure 4). Distal motor latency, f-wave latency, distal sensory
latency, monofilament detection, and symptoms of peripheral neuropathy were not associated
with objectively assessed physical activity.
78
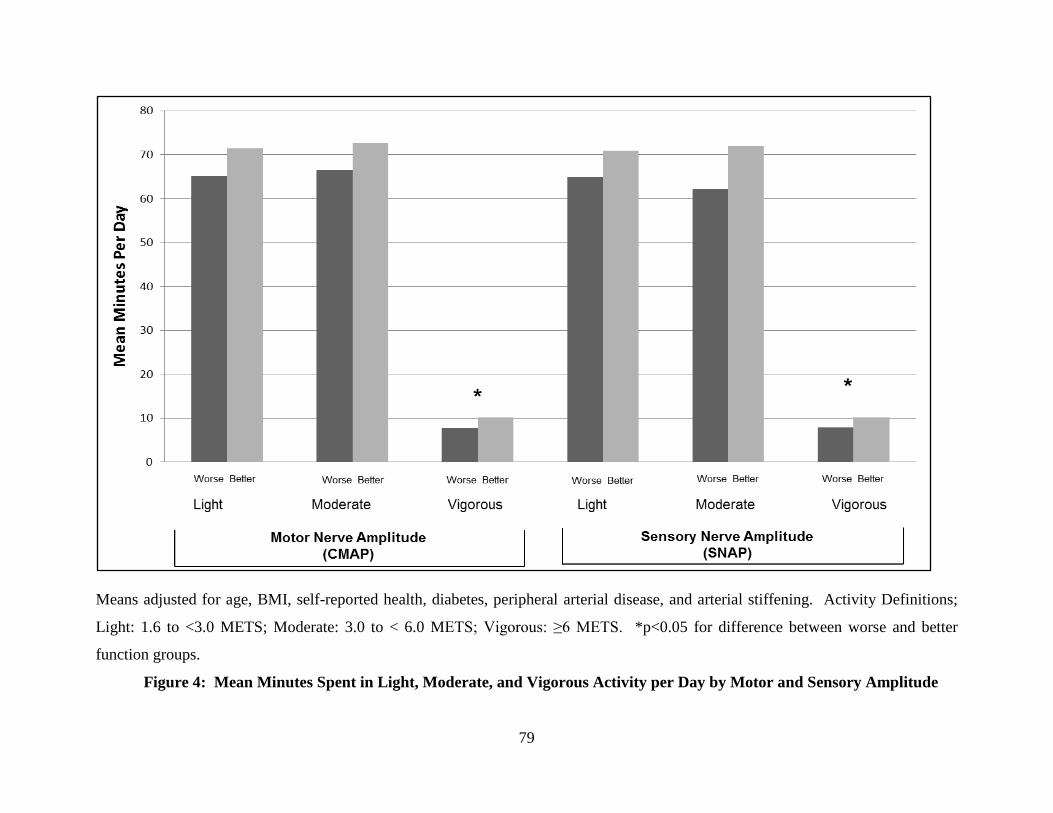
Means adjusted for age, BMI, self-reported health, diabetes, peripheral arterial disease, and arterial stiffening. Activity Definitions;
Light: 1.6 to <3.0 METS; Moderate: 3.0 to < 6.0 METS; Vigorous: ≥6 METS. *p<0.05 for difference between worse and better
function groups.
Figure 4: Mean Minutes Spent in Light, Moderate, and Vigorous Activity per Day by Motor and Sensory Amplitude
79

2.4 DISCUSSION
In this cohort of community dwelling older men, better PN function was associated with
higher levels of PA. However, not all nerve function measures were associated with PA. We
observed relationships of PN function with PA both using both objective and self-report
measures of PA. Sensory and motor amplitude were associated with objective PA, while distal
motor latency and presence of neuropathic symptoms were associated with self-report PA. We
are uncertain as to why these relationships varied, though were consistent in indicating motor
nerve function relationships with PA. Importantly, motor nerve function is rarely measured in
studies of PA and older adults, though future studies should consider doing so. This study adds
to the growing body of literature that PN function should be evaluated as a factor in the
disablement pathway for older adults.
Presently, very little work has been done in investigating the relationship between PN
function and PA, and this work has focused on diabetic populations rather than older adults. In
diabetic participants in the in 2003-2004 cycle of for the National Health and Nutrition
Examination Survey (NHANES), no direct association was found between minutes per day of
moderate to vigorous PA and peripheral neuropathy. However, though those with better diabetic
control (as measured by HbA1c) and higher PA were less likely to have peripheral neuropathy
compared to what would be expected from the individual effects of PA and diabetes control
[158]. On average, this population participated in very few minutes of objectively measured PA
(measured using hip-worn accelerometers) per day (mean = 11.7 minutes, 95% CI = 9.1-14.4
80

minutes), which may have limited the ability to examine the relationship between PA and
peripheral neuropathy in this population.
Peripheral neuropathy has been acknowledged in the diabetes literature as potentially
making PA difficult. Due to the relationship between worse sensory PN function and worse
lower extremity outcomes [31-34,36-41,66,215,216], these considerations may be relevant for
older adults with PN impairments. The American College of Sports Medicine and American
Diabetes Association recommended in a joint position statement that those with peripheral
neuropathy can safely participate in weight-bearing exercises as long as they do not have any
open sores [162]. Additionally, it was recommended that foot care (examining for potential
sores, selecting appropriate footwear) be an important component of any PA program for those
with diabetic peripheral neuropathy. However, these recommendations have not been tested for
older adults, and clearly more work is needed in this area.
In our study, motor and sensory amplitude were associated with objective PA, though
other measures of nerve function were not. Nerve conduction testing may be a more sensitive
measure to pick up earlier or subclinical impairments compared to monofilament testing or
symptoms. Interestingly, we observed relationships with objective PA and both sensory and
motor amplitudes but not latencies. This is consistent with prior work in this cohort by Ward and
colleagues who examined the association between PN function and lower extremity muscle
power [230]. Amplitude and latency are indicators of different types of PN damage, with worse
amplitude being indicative of axonal degeneration, while latency, a component of conduction
velocity, is a sign of demyelination [231]. These aspects of PN function do not necessarily
decline simultaneously, and the protective myelin sheath may remain intact for remaining motor
81

units [232]. The effect of reduced axonal degeneration may have a greater impact on PA than
latency, though this should be examined further.
In the InCHIANTI study—a population based cohort study of older adults in Italy—
higher CMAP measured at the peroneal motor nerve was found to be associated with higher calf-
muscle density in older adults [232]. PN impairments, particularly axonal degeneration along
with the associated worse muscle quality and function could make activity more difficult, and
PA is also known to influence body composition and muscle function. Determining the timing
of these neuromuscular changes with PA patterns is worthy of future study in order to develop
interventions to reduce the burden of lower extremity outcomes.
A major strength of this study is the inclusion of comprehensive PN function measures,
which allowed us to examine a range of PN function and also examine potential specific
pathways of PN function. Also, assessing objective PA in addition to self-report PA allowed us
to better characterize the activity patterns of these older men than through using a self-report
measure alone. This was particularly helpful for assessing participation in light intensity
activities and sedentary time. The majority of energy expenditure for older adults comes from
sedentary and light activities [25,159], which makes it especially important to measure the lower
end of intensity in order to capture the full extent of activity in this population. Light activity
and sedentary time are difficult to recall, and PA questionnaires may not be adequate for
assessing these intensities [233].
Limitations to this work should be considered. Although the use of an automated
neurodiagnostic instrument allowed nerve conduction testing to be done in a non-invasive,
efficient manner, clinical cut-points established using traditional methods cannot be applied to
measurements from automated instruments. Instead, we approximated clinical thresholds by
82

comparing those in the worst tertile to those in the middle and best tertiles. Future work is also
needed in order to determine whether these results are applicable to other populations, including
those with disabilities, women and non-white older adults.
In our analyses examining objective activity, we used MET cut-points to define intensity
levels of physical activity. Though these categories allowed us to examine a range of activity
intensities, cut-points can have limitations when applied to populations of older adults. Physical
activity guidelines include recommendations for specific intensity levels, but relative intensity is
important for prescribing physical activity for older adults [26]. Because many studies originally
validating cut-points from accelerometer output were conducted in younger, healthy populations,
alternate activity count cut-points and novel analysis methods have been suggested for assessing
physical activity for older adults using accelerometers [191,234-236]. Many of these
suggestions were made for traditional accelerometers, not necessarily for multi-sensor devices
which process data using proprietary algorithms.
We considered the cross-sectional relationship between PN function and PA, though a
bidirectional relationship between PN function and PA is possible. PN impairments—
particularly sensory impairments—may make activity more difficult, while PA may be beneficial
for improving PN function. Small studies of participants with diabetes have indicated that
exercise training may help reduce symptoms in those with peripheral neuropathy [237], a long-
term exercise intervention (4 years) can help reduce the incidence of peripheral neuropathy
[161], and short term interventions may produce beneficial changes in gait performance in those
with diabetic peripheral neuropathy. Improving functional outcomes via PA is important for
helping those with PN impairments to maintain independence.
83

In conclusion, some measures of better PN function were associated with more PA per
day in older men. Lower levels of physical activity may potentially be in the pathway between
worse PN function and lower extremity disability. This potential pathway warrants further
investigation in diverse populations of older men and women, and also in longitudinal work.
84

3.0 SENSORIMOTOR PERIPHERAL NERVE FUNCTION AND THE
LONGITUDINAL RELATIONSHIP WITH ENDURANCE WALKING IN THE
HEALTH, AGING AND BODY COMPOSITION STUDY
ABSTRACT
Sensorimotor peripheral nerve deficits affect gait and may reduce walking endurance in
older adults. The purpose of this study was to determine whether lower extremity sensorimotor
peripheral nerve deficits are associated with reduced walking endurance in older adults.
Community dwelling older adults enrolled in Health, Aging and Body Composition study who
participated in the 2000/01 annual clinical examination (n=2393; age 76.5 ± 2.9 years; 48.2%
male; 38.2% black) and subset with longitudinal data (n=1,178) underwent sensorimotor
peripheral nerve function testing. Nerve conduction amplitude and velocity were measured at
the peroneal motor nerve. Sensory nerve function was measured using vibration detection
threshold and monofilament testing at the big toe. Symptoms of lower-extremity peripheral
neuropathy included numbness or tingling and sudden stabbing, burning, pain, or aches in the
feet or legs. The long distance corridor walk (LDCW) was administered in 2000/01 and every
two years afterwards for 6 years to assess endurance walking performance over time. In separate
fully adjusted linear mixed models poor vibration threshold (>130 microns) 10g and 1.4g
monofilament insensitivity were each associated with slower LDCW completion time (16.0,
14.1, and 6.7, seconds slower, respectively, p<0.05 for each). Poor motor amplitude (<1mV),
85

poor vibration perception threshold, and 10-g monofilament insensitivity were related to a
greater slowing/year (4.7, 4.3, and 4.3 additional seconds/year, respectively, p<0.05), though
poor motor amplitude was not associated with initial completion time. Poorer sensorimotor
peripheral nerve function is related to slower endurance walking and greater rate of slowing over
time. Interventions for those with poor sensorimotor peripheral nerve functioning should be
considered in order for adults to maintain walking endurance.
3.1 INTRODUCTION
Sensorimotor peripheral nerve function deficits are common in older adults; with
estimates from the National Health and Nutrition Examination Survey (NHANES) indicating
that 28.5% of older adults aged 70-79 and 34.8% of those 80+ have reduced touch sensation on
the foot as measured by a simple screening tool [30]. In the Health, Aging and Body
Composition (Health ABC) study, recent work has shown that 55% of older adults (N=1,680;
age 76.5 ± 2.9 years) without mobility disability at the 2000/01 examination had evidence of
lower extremity peripheral nerve impairments [216]. Poor peripheral nerve function in older
adults is associated with worse lower extremity function [31-34], quadriceps and ankle
dorsiflexion strength [36,215] quadriceps muscle power [37], as well as an increased risk for
falls [38-41] and lower extremity limitation [216]. Worse lower extremity sensation and motor
control resulting from sensorimotor peripheral nerve dysfunction can lead to altered gait
mechanics and the adoption of inefficient and less stable gait patterns [115-120]. In addition,
symptoms related to peripheral nerve function impairments—including pain or numbness in the
lower extremities—may make weight bearing activities, such as walking, difficult.
86

Although poorer sensorimotor peripheral nerve function is associated with slower usual
gait speed on short walking courses
[31,34,66], the impact of peripheral nerve function on endurance walking in community
dwelling older adults is limited in current literature. Walking endurance—the ability to walk
quickly for a sustained time or distance—is important for maintaining independence and
remaining active in the community. Though aerobic fitness plays a major role in walking
endurance, other disease-related factors—such as peripheral nerve function—may influence
walking endurance and the maintenance of walking endurance over time, particularly given the
associations with lower extremity function.
Poor peripheral nerve function in older adults occurs even in the absence of diabetes [29],
though diabetes is a major contributor. However, work has been limited in exploring the
association of peripheral nerve dysfunction and walking endurance in either population.
Evidence exists that walking endurance is worse in diabetic adults compared to non-diabetic
healthy adults [125], Peripheral nerve function may contribute to these differences, though it
was not measured in previous studies. Walking endurance is worse in the presence of a greater
burden of lower extremity complications resulting from diabetic peripheral neuropathy,
including ulcers and amputations [238], however, these are extreme examples of peripheral
neuropathy damage. In the InCHIANTI study, motor nerve conduction velocity was cross-
sectionally associated with slower completion of a fast-paced 400m walking test for older adults
[66]. These studies were limited in their peripheral nerve function assessments by using only
peripheral neuropathy diagnoses or one measure of motor nerve function. Ideally, both motor
and sensory nerve assessments should be included in addition to the collection of symptoms in
order to examine the full range of peripheral nerve function from subclinical to symptomatic [82]
87

and also investigate the contribution of sensory versus motor function. Furthermore, no
longitudinal studies have examined if peripheral nerve function contributes to decline in
endurance walking over time in old age.
The aims of this study were to 1) examine whether sensorimotor peripheral nerve
function is related to walking endurance in older adults, and 2) determine whether sensorimotor
peripheral nerve function is associated with the rate of change in walking endurance over six
years of follow-up in the Health ABC study.
3.2 METHODS
Participants 3.2.1
Participants were from Health ABC, a longitudinal cohort study of community-dwelling
older adults (n=3075; age 70-79; 48.4% male; 41.6% black at baseline) from Pittsburgh, PA and
Memphis, TN aimed at investigating factors related to the development of functional limitation
and disability [126]. Participants were recruited through mailings to a random sample of white
Medicare beneficiaries and to all age-eligible black community residents. To be eligible for the
study, participants had to self-report no difficulty in walking ¼ mile, climbing 10 steps, or
performing any basic activity of daily living; be free of any life-threatening cancers; and plan to
remain in the study area for at least three years. Participants completed the baseline visit
between April 1997 and June 1998 and provided written informed consent. All protocols
associated with the Health ABC study were approved by institutional review boards at the
University of Pittsburgh and University of Tennessee Health Science Center.
88

A total of 2,404 participants had a clinic visit in 2000/01. Of these, 2393 had complete
data for nerve function and long distance corridor walk measures. Figure 1 describes the number
of participants who completed this visit and had complete nerve function and long distance
corridor walk measures.
Figure 5: Participant Flow Diagram for the Health ABC Cohort
89

Endurance Walking Assessment 3.2.2
The long distance corridor walk (LDCW) was administered in 2000/2001 and at follow-
up visits in 2002/03, 2004/05 and 2006/07 to assess walking endurance [214]. Exclusion criteria
included: systolic blood pressure >200 mmHg, resting pulse of ≥120 beats per minute, presence
of an electrocardiogram abnormality, or cardiac surgery, worsening of chest pain or shortness of
breath in the prior three months. The test was conducted in a dedicated corridor with two traffic
cones spaced 20 meters apart. Participants walked 10 laps around the cones for a total of 400
meters. The distance walked in the two minute warm-up was measured and completion time for
the 400m walk was recorded in seconds. This test included a two minute warm-up walk where
the participant was instructed to “cover as much ground as possible” followed immediately by
the LDCW performed “as quickly as possible at a pace that can be maintained for 400 meters”
[239]. Heart rate was recorded for each lap and blood pressure was measured at the end of the
test. The test was stopped if heart rate surpassed 135 beats per minute, or for lightheadedness,
dizziness, chest pain, shortness of breath or leg pain.
Peripheral Nerve Function Examination 3.2.3
Lower extremity sensory and motor nerve function was assessed in 2001/2002 visit by a
trained examiner. Motor nerve function was measured objectively using peroneal motor nerve
conduction amplitude in millivolts and peroneal motor nerve conduction velocity in meters per
second, as previously described [89]. Stimulation occurred at the popliteal fossa and ankle using
the NeuroMax 8 (XLTEK, Oakville, Ontario, Canada). Sensory nerve function was measured
using vibration detection threshold and monofilament testing. Vibration detection threshold (in
90

microns) was measured at the bottom of the great toe with a VSA-3000 Vibratory Sensory
Analyzer (Medoc, Durham, NC). Monofilament insensitivity was defined as the inability to
detect three out of four touches at the dorsum of the large toe with a standard 10-g monofilament
and light touch 1.4-g monofilament (North Coast Medical, Morgan Hill, CA). Feet were warmed
to 30°C before all tests. All measures were performed on the right side unless contraindicated
due to knee replacement, amputation, trauma, ulcer, or recent surgery, in which case the left side
was tested unless also contraindicated.
Symptoms of peripheral neuropathy were collected via self-report in a modified
Michigan Neuropathy Screening Instrument questionnaire [108] and included (1) numbness,
"asleep feeling," prickly feeling or tingling (2) sudden stabbing, burning, or deep aches, or (3)
an open persistent sore or gangrene on either foot or leg in the past 12 months.
Clinically meaningful cut points were used to define motor nerve impairment, with motor
amplitude <1 mV and motor nerve conduction velocity <40 m/sec being used to define poor
function [240]. For vibration threshold, >130 microns was used to define impairment. These
cut-points were previously established by Ward and colleagues and are related to quadriceps
strength changes over time [215] and incident mobility limitation [216].
Additional Covariates 3.2.4
Clinical site, baseline age, sex, and race were included as demographic characteristics.
Several factors potentially related to poor nerve function or walking endurance were also
considered as covariates. These measures were from the 2000/01 clinic visit unless otherwise
noted.
91

Smoking history (never, former, current) was reported by questionnaire at 1999/2000.
Health status (excellent, very good, good, fair, or poor), current alcohol use (drinks per week),
physical activity (kilocalories expended per week in walking and stair climbing) [203] were
assessed via questionnaire. Body composition (fat mass and bone-free lean mass) was measured
using dual-energy X-ray absorptiometry (DXA; 4500A, Hologic, Inc., Bedford, MA). Body
mass index (BMI) was calculated in weight in kilograms per squared height in meters using a
standard physician’s balance scale and stadiometer, respectively.
Diabetes was defined using self-reported physician’s diagnosis, hypoglycemic
medication use, or by fasting glucose ≥126 mg/dL (8 hour fast), and impaired fasting glucose
was defined as fasting glucose level of 100-125 mg/dL after an 8 hour fast [226]. Arterial
stiffening and peripheral arterial disease were assessed using ankle brachial index [227], with
values <0.9 being used to indicate peripheral arterial disease and >1.3 for arterial stiffening.
Hypertension was defined by self-report, medication use, or measured systolic blood pressure
≥140mmHg or diastolic blood pressure ≥90mmHg. Poor vitamin B12 status was defined as
<260 pmol/L [53] and insufficient renal function was defined as Cystatin-C >1mg/dL [241]. The
Center for Epidemiologic Studies Depression Scale (CES-D) score assessed depressive
symptoms [242].
Cognitive function was measured using the Digit Symbol Substitution Test [243] at
baseline and the Modified Mini-Mental State Examination [244] in 1999/2000. Prevalent
coronary heart disease (bypass/coronary artery bypass graft, carotid endarterectomy, myocardial
infarction, angina, or congestive heart failure), cerebrovascular disease (transient ischemic attack
or stroke), lung disease (asthma, chronic obstructive pulmonary disease, or emphysema), and
osteoarthritis in the knee or hip were assessed at baseline.
92

Statistical Methods 3.2.5
Participants were grouped based upon initial 2000/01 eligibility and completion. Groups
included: being ineligible for the LDCW, starting but not completing the full 400m, completing
the full LDCW in >7 minutes, and completing the LDCW in ≤7 minutes. Prior work from the
aerobic fitness validation study of the LDCW has indicated that those who require >7 minutes
(420 seconds) to complete the LDCW likely have significant functional limitations [214].
Descriptive statistics were expressed using proportions for categorical variables and mean ±
standard deviation for continuous variables. Tests of trend were used to assess differences in
characteristics between the four ordered groups. We also examined the peripheral nerve function
measures between the four initial LDCW eligibility and completion groups. Linear mixed-
effects models were used to assess the association between peripheral nerve function and change
in LDCW completion time over six years of follow-up. Mixed models were used in order to
maximize the available data, though only participants who completed the LDCW in 2000/01 and
at least one follow-up could be included in the models (n=1178, Figure 5). We used two-sample
t-tests for continuous variables and chi-square tests for categorical variables to compare those
who were included in the model or not.
Some peripheral nerve function measures were moderately correlated; therefore each
peripheral nerve function measure was modeled separately. The date of each Health ABC visit
was used in the models as the time parameter. Interaction terms between each predictor and time
indicate rate of change in LDCW completion time over the course of the study contributed by
that predictor. We used time-varying covariates for factors that were updated throughout the
study (physical activity, weight, body composition). Models were built progressively using
forward stepwise techniques, initially retaining factors reaching a significance of p<0.10. We
93

started with unadjusted models including peripheral nerve function and the interaction term
between time and peripheral nerve function. Age, sex, race, site, height, and weight and
interaction terms for each of the covariates with time were then added for a minimally adjusted
model. We further adjusted for baseline health status, lifestyle habits (smoking, alcohol
consumption, and physical activity), prevalent diseases and conditions, and mental health and
cognitive function variables as well as the time interactions for each of these covariates. For our
final, parsimonious model, we retained only factors reaching a significance of p<0.05 in the
multivariate model. Because of the strong relationship between diabetes and peripheral nerve
function, diabetes was retained in the final model regardless of significance. No factors other
than these appreciably attenuated the effect of peripheral nerve predictors. For sensitivity
analyses we added an interaction term between diabetes and peripheral nerve function, and we
also reran the linear mixed models excluding participants with diabetes. We did not impose any
structure on the covariance matrix of the random effects, and all models included a random
intercept and a random slope for the visit parameter. All data analyses were performed using
STATA version 12.1 (StataCorp, College Station, TX).
3.3 RESULTS
Of the participants with complete data on 2000/01 visit LDCW eligibility and at least one
measure of nerve function (n=2393; age 76.5 ± 2.9 years; 48.2% male; 38.2% black), 345
participants (14.4%) were ineligible for the LDCW, 407 participants (17.0%) started the walk but
were unable to complete the full 10 laps, 113 participants (4.7%) completed the LDCW in >7
minutes, and 1528 participants (52.0%) completed the LDCW in ≤7 minutes. A significant trend
94

existed for those who completed the LDCW to be slightly younger, have a lower BMI, be less
likely to be female or black, and generally be in better health and have fewer chronic conditions
than those who were ineligible or unable to complete the full LDCW (Table 6). Specifically,
there were approximately 3.5 times more participants who were ineligible for the LDCW
reported fair or poor health compared to those who completed the LDCW in ≤7 minutes.
Though trends were significant across groups, similarities existed between those who were
ineligible, did not complete the full LDCW, and completed in >7 minutes.
95

Table 6: Participant Characteristics by Long Distance Corridor Walk (LDCW) Eligibility and Completion in the Health, Aging, and Body Composition Study 2000/01 Clinic Visit
Participant Characteristics Ineligible for LDCW n=345
Did Not Finish LDCW n=407
Completed LDCW in >7 Minutes n=113
Completed LDCW in ≤7 minutes n=1528
P for Trend
Pittsburgh Site % (n) 55.7 (192) 53.6 (218) 43.4 (49) 49.7 (760) 0.03 Age, Mean ± SD 77.2 ± 2.9 76.8 ± 2.9 76.8 ± 3.0 76.3 ± 2.8 <0.001 Female Sex 57.1 (197) 62.7 (255) 62.8 (71) 46.9 (716) <0.001 Black Race 55.7 (192) 46.2 (188) 54.0 (61) 31.0 (473) <0.001 Health Fair or Poor 29.2 (100) 22.7 (92) 22.3 (25) 8.3 (127) <0.001 Body Composition BMI 28.9 ± 5.4 28.6 ± 5.3 28.6 ± 5.8 26.4 ± 4.1 <0.001 Bone-Free Lean Mass (kg) 48.6 ± 9.3 48.6 ± 9.7 47.4 ± 9.5 49.3 ± 10.7 0.24 Fat Mass (kg) 28.5 ± 10.1 28.6 ± 9.5 28.8 ± 10.4 24.9 ± 7.7 <0.001 Lifestyle Habits Current Smoker 10.2 (34) 10.4 (42) 11.6 (13) 7.5 (113) <0.001 Drink >1 Drink/Week 25.2 (84) 23.6 (95) 21.4 (24) 33.6 (509) <0.001 Physical Activity* (kcal/kg/week) 3.1 ± 6.7 3.6 ± 6.0 3.0 ± 7.4 7.3 ± 20.1 <0.001 Prevalent Diseases and Conditions Diabetes 29.9 (103) 28.8 (117) 30.1 (34) 26.3 (263) <0.001 Impaired Fasting Glucose 15.7 (54) 18.0 (73) 13.3 (15) 15.8 (242) Hypertension 77.9 (261) 67.5 (272) 68.8 (77) 54.5 (822) <0.001 Coronary Heart Disease 21.5 (73) 26.3 (105) 15.2 (17) 14.7 (222) <0.001 Cerebrovascular Disease 11.5 (38) 9.9 (39) 7.3 (8) 4.8 (72) <0.001 Lung Disease 24.6 (85) 26.3 (105) 17.7 (20) 15.0 (229) <0.001 Osteoarthritis (Knee or Hip) 17.1 (59) 14.0 (57) 14.2 (16) 9.0 (138) <0.001 Peripheral Arterial Disease 28.8 (90) 24.5 (94) 19.4 (21) 11.2 (167) <0.001 Arterial Stiffening 4.5 (14) 4.4 (17) 8.3 (9) 5.2 (79) <0.001 Insufficient Renal Function** 41.1 (139) 35.9 (143) 37.6 (41) 22.4 (335) <0.001 Poor Vitamin B12 (<260 pmol/L) 16.0 (52) 16.7 (65) 17.1 (18) 17.4 (344) 0.51 Shortness of Breath While Walking 44.6 (154) 43.7 (178) 38.1 (43) 22.5 (344) <0.001 Mental Health and Cognitive Function CES-D Score*** 8.2 ± 7.7 7.4 ± 7.0 7.6 ± 6.0 5.7 ± 5.8 <0.001 3MSE Score**** 87.9 ± 8.9 89.0 ± 8.8 86.9 ± 9.6 91.6 ± 7.3 <0.001 Digit Symbol Substitution Score 31.7 ± 14.4 34.7 ± 14.5 31.6 ± 15.2 28.6 ± 14.2 <0.001
*Physical Activity: Kcals/kilogram body weight spent per week walking and stair climbing
**Cystatin-C >1mg/dL
***CES-D: enter for Epidemiologic Studies Depression Scale [242]
****3MSE: Modified Mini-Mental State Examination [244]
96

Better peripheral nerve function was associated with being eligible for and having better
performance on the LDCW (Table 7). In particular, higher motor amplitude, lower vibration
threshold, detection of both monofilaments, and no symptoms of peripheral neuropathy were
associated with better LDCW performance (p<0.05 for each). Motor nerve conduction velocity
was not associated with LDCW eligibility or completion.
Table 7: Peripheral Nerve Function by LDCW Eligibility/Completion Group
Peripheral Nerve Function Measure
Ineligible for LDCW n=345
Did Not Finish LDCW n=407
Completed LDCW in >7 Minutes n=113
Completed LDCW in ≤7 minutes n=1528
P for trend
Motor Nerve Function Motor amplitude, mV, Mean ± SD 3.0 ± 2.1 3.1 ± 2.0 3.1 ± 2.0 3.5 ± 2.0 <0.001 Poor amplitude 19.9 (47) 13.8 (41) 15.0 (12) 8.8 (110) <0.001 Sensory Nerve Function Conduction velocity, m/sec 43.2 ± 5.6 43.3 ± 5.2 44.8 ± 5.7 43.7 ± 5.4 0.33 Poor conduction velocity 21.1 (52) 22.7 (63) 20.3 (15) 21.9 (262) 0.37 Vibration threshold, microns 56.0 ± 39.5 52.5 ± 35.4 55.2 ± 35.8 50.1 ± 34.7 0.03 Poor vibration threshold 9.9 (32) 4.8 (19) 9.2 (10) 5.0 (74) 0.008 1.4 monofilament insensitivity 38.3 (127) 36.7 (35) 42.7 (84) 36.2 (23) <0.001 10-g monofilament insensitivity 13.0 (43) 10.3 (41) 14.6 (16) 7.1 (107) Symptoms of Peripheral Neuropathy One symptom 31.0 (105) 31.0 (125) 30.1 (34) 24.9 (379) <0.001 Two or More Symptoms 19.2 (65) 11.4 (46) 6.2 (7) 7.9 (120)
97

In the longitudinal analysis examining change in LDCW completion time over the 6
years of follow-up (n=1178; age 76.2 ± 2.8 years; 52.1% male; 31.2% black), worse motor
amplitude (per 1 SD lower), worse vibration threshold (per 1 SD higher) and poor vibration
threshold (threshold >131 microns), 10g and 1.4gmonofilament insensitivity were associated
with 3.9, 5.2, 19.6, 9.3, and 20.7 seconds slower initial LDCW completion time, respectively,
(Table 8) when adjusting for age, sex, race, site, height, and weight (p<0.05 for all). In general,
the relationships were slightly attenuated after further adjusting for health habits and health
conditions, though the same significant relationships remained with the exception of lower motor
amplitude (per SD poorer amplitude). Poor vibration perception threshold (>130 microns) was
associated with completing the LDCW 16.0 seconds slower, and an additional 4.3 seconds of
slowing per year compared to those with vibration perception threshold ≤130 microns. Standard
10-g monofilament insensitivity was associated with completing the LDCW 14.1 seconds slower
and an additional 4.3 seconds of slowing per year. No associations between either motor nerve
conduction velocity or presence of symptoms of peripheral neuropathy were found in any of the
models. In sensitivity analyses, no significant interaction was found between peripheral nerve
function and diabetes, and all results remained consistent when excluding individuals with
diabetes.
Compared to those included in the mixed models, those not included in the longitudinal
analyses were slightly older (mean age 76.9 ± 2.9 vs. 76.2 ± 2.8 years, p<0.001), more likely to
be women (55.8% vs. 52.1%, p<0.001) and more likely to be black (44.9% vs. 32.2%, p<0.001).
Those not included in the models also had worse motor nerve amplitude (3.1 ± 1.9 vs. 3.6 ± 2.0
mV, p<0.001), higher vibration perception threshold (53.6 ± 36.4 vs. 49.5 ± 34.6 microns,
p=0.005), were more likely to have 10-g (10.7% vs. 7.0%) or 1.4-g (37.6% vs. 36.1%)
98
monofilament insensitivity (p=0.004), and were more likely to report at least one symptom of
peripheral neuropathy (42.3% vs. 31.8%, p<0.001). No difference existed in motor nerve
conduction velocity between those excluded and those included in the longitudinal analysis (43.5
± 5.4 vs. 43.7 ± 5.8 m/sec, p=0.54). The most common reasons for not being included in the
mixed models were not finishing the initial LDCW (n=407) and meeting exclusion criteria at the
initial LDCW assessment (n=345).
99

Table 8: Peripheral nerve functioning and longitudinal performance in LDCW from 2000/01 to 2006/07 in the Health, Aging and Body Composition Study Model 1 Model 2 Model 3: Final Model
Standardized Betas Standardized Betas Standardized Betas
Main Effect Time Interaction
Main Effect Time Interaction
Main Effect Time Interaction
Motor Nerve Function
SD lower amplitude, mV 3.9* 0.5 3.7* 0.3 2.2 0.3
Poor amplitude 5.8 4.8** 3.2 4.4** -0.9 4.7**
SD Slower Conduction Velocity, m/sec -0.8 -0.1 -0.5 0.3 1.1 0.3
Poor Conduction Velocity -2.1 -0.04 0.9 -0.3 -3.9 -0.5
Sensory Nerve Function
SD higher vibration perception threshold, μ 5.2** 1.6** 4.9** 1.7** 3.2* 1.7**
Poor vibration perception threshold 19.6** 4.1* 20.1** 4.9** 16.0* 4.3*
1.4 monofilament insensitivity 9.3** -0.6 8.6** -0.6 6.7* -0.7
10-g monofilament insensitivity 20.7** 4.4** 16.3** 4.5** 14.1** 4.3** *p<0.05, **p≤0.01. Model 1: Adjusted for age, sex, race and site. Model 2: Adjusted for Model 1 + health status, physical activity, current cigarette smoking, lean mass and fat mass Model 3: Motor amplitude and conduction velocity: Model 2 + PAD, cerebrovascular disease, diabetes, insufficient renal function, shortness of breath while walking, and DSST score. Cigarette smoking and health status were removed from Model 3. Model 3: Sensory nerves function: Model 2 + PAD, cerebrovascular disease, diabetes, insufficient renal function, DSST score, CES-D and hypertension. Cigarette smoking and health status were removed from Model 3. Model 3: Vibration perception threshold: Model 2 + PAD, cerebrovascular disease, diabetes, insufficient renal function, DSST score, CES-D and hypertension. Health status was removed from Model 3.
100

3.4 DISCUSSION
In this cohort of community-dwelling older adults, poorer motor and sensory peripheral
nerve function was related to worse endurance walking performance and sensory nerve function
was associated with greater slowing of endurance walking speed over time. Additionally,
peripheral nerve function and presence of symptoms of neuropathy were related to the inability
to complete the LDCW. Peripheral nerve dysfunction should be appreciated as a risk factor in
the disablement pathway, and these findings add to the growing body of literature indicating that
peripheral nerve dysfunction in older adults is related to adverse lower-extremity outcomes.
Though peripheral nerve dysfunction is often thought to be primarily a concern for those with
diabetes, these results support previous work indicating that peripheral nerve function is an
important predictor of mobility related outcomes in older adults independent of diabetes
[31,216].
The sensory and motor nerves of the lower extremities play key roles in gait. Sensory
nerves detect touch, vibration, and other sensations regarding the external environment, and
motor nerves that relay signals from the central nervous system that allow for voluntary
movement. Sensory peripheral nerve function in the lower extremities is crucial for perception
of joint position, posture, and balance—all factors that play roles in walking quickly. Vibration
perception threshold and standard monofilament insensitivity were strongly associated with the
slowing of endurance walking over time. Worse vibration perception threshold has been shown
to be associated with worse balance and slower gait in older adults without diabetes or overt
peripheral neuropathy [31,34,95,245].
101

Little work exists relating sensorimotor peripheral nerve function and endurance walking
in older adults. McDermott and colleagues found in the InCHIANTI study that motor nerve
conduction velocity was associated with slower completion of a fast-paced 400m walking test for
older adults [66], though this study did not include measures of motor nerve amplitude, sensory
peripheral nerve function or the assessment of symptoms of peripheral neuropathy. The
association with conduction velocity is in contrast to our results where we found that sensory
peripheral nerve function measures were associated with worse walking endurance and greater
slowing over time, while there was no association with motor nerve conduction velocity. Age
and racial differences between the InCHIANTI and Health ABC cohorts may have contributed to
the differences in findings. Our null findings with nerve conduction velocity are consistent with
prior work in this cohort. Worse motor nerve amplitude (a sign of axonal degeneration) but not
worse motor nerve conduction velocity (a sign of demyelination) has been shown to be
associated with lower extremity physical performance [31] and incident lower extremity
limitation [216] in the Health ABC cohort.
The effect size of poor sensory peripheral nerve function was similar in magnitude to
those of common risk factors associated with worse walking endurance. For example, current
smoking was independently associated with completing the initial LDCW 14.0 seconds slower,
and those with cerebrovascular disease completed the initial LDCW 16.1 seconds slower than
those without cerebrovascular disease, though neither of these factors were significantly
associated with greater slowing over time. This is similar to the effect of poor vibration
perception threshold (16.0 seconds slower) and 10g monofilament insensitivity (14.1 seconds) on
initial LDCW completion time, and these factors were each related to greater slowing over time
(4.3 seconds slower for each). This effect is also approximately equivalent to 5 years of aging.
102

Peripheral nerve impairments are common in older adults,[30] and improving functional
outcomes in those with these impairments may be important on many levels. Work in diabetic
populations has shown that deficits in lower extremity peripheral nervous system function are
associated with altered gait biomechanics [118-120]. Because of the associations between gait
alterations and injuries and falls [117,122-124], these factors may also be in the pathway
between peripheral nerve dysfunction and worse lower-extremity function for older adults.
Sensory nerve impairments in particular may increase the risk of falling due to the inability to
adequately sense the lower extremities. Physical activity can help older adults improve physical
function and delay persistent mobility limitations [246], however, whether physical activity
interventions can be used to reduce physical functional impairments due to poor peripheral nerve
function is currently unknown.
A major strength of this study is that we incorporated several measures of both motor and
sensory nerve function as well as symptoms associated with peripheral neuropathy. Including
objective and subjective measures is especially important because an absence of symptoms does
not necessarily equate to an absence of disease [88], particularly in older adults where nerve
function deficits may be asymptomatic [30]. In addition, the large sample size and longitudinal
study design allowed an examination of several factors that could potentially influence peripheral
nerve function and/or walking endurance over time.
Though the use of mixed models allowed us to maximize our available data, only those
who completed the LDCW at the 2000/01 clinic visit and at least one follow-up could be used in
the longitudinal analysis. Those who could not complete the LDCW at the 2000/01 clinic visit
or at least one follow-up had worse peripheral nerve function compared to those who completed
the LDCW, and it is possible that those without a 2000/01 clinic visit or at least one additional
103

follow-up had the worst peripheral nerve function of all. Thus, we may have underestimated the
true effect of peripheral nerve function on the worsening of walking endurance. Unfortunately,
the retention bias resulting from the fact that participants returning for clinic visits are healthier
than those who did not is applicable to most cohort studies of older adults [247]. An additional
limitation is that our physical activity assessment measure was restricted to only kilocalories per
kilogram body weight spent per week in walking and stair climbing, as these were the only
physical activities assessed consistently throughout the selected follow-up period. Some limited
evidence exists that adults with well controlled diabetes and higher levels of physical activity
are less likely to have peripheral neuropathy [158], though additional work is needed in
determining the relationship between physical activity and peripheral nerve function.
In conclusion, poorer sensory and motor peripheral nerve function in older adults is
related to slower endurance walking and greater slowing over time. Interventions to reduce the
burden of sensorimotor peripheral nerve function impairments should be considered in order to
help older adults to maintain walking endurance—which can be crucial for remaining
independent in the community.
104

4.0 SENSORIMOTOR AND CARDIOVASCULAR AUTONOMIC PERIPHERAL
NERVE FUNCTION IN OLDER ADULTS IN THE HEALTH, AGING AND BODY
COMPOSITION STUDY
ABSTRACT
Age-related peripheral nervous system (PNS) impairments are prevalent, with sensorimotor
impairments associated with poor mobility and cardiac autonomic impairments associated with
adverse cardiac outcomes. Although sensorimotor and cardiac autonomic impairments have
been found associated in persons with diabetes, the nature of the relationship in general
community-dwelling populations of older adults is unknown. Health ABC Study participants
(n=2393, age=76.5±2.9, 52% women, 38% black) underwent peripheral nerve testing at the
2000/01 clinic visit. Nerve conduction amplitude and velocity were measured at the peroneal
motor nerve. Sensory nerve function was measured using vibration detection threshold and
monofilament testing at the big toe. Symptoms of lower-extremity peripheral neuropathy
included numbness or tingling and sudden stabbing, burning, pain, or aches in the feet or legs.
Cardiac autonomic function measures included resting HR (HR), orthostatic hypotension, as well
as HR range and recovery to submaximal exercise testing. Poor motor conduction velocity (<40
m/sec) was associated with higher odds of orthostatic hypotension (OR=1.57, p=0.05), while
poor motor amplitude (<1 mV) was associated with higher resting HR (β= 2.20, p=0.001).
Insensitivity to the 1.4g monofilament was associated with worse HR range (increase in HR from
105

resting to the end of the submaximal test, adjusting for performance; β=-1.56, p=0.028). Other
PNS measures were not related. Associations remained were independent of age, sex, race,
diabetes, and health and lifestyle factors known to influence PNS function. Sensorimotor and
autonomic function are independently related, and future studies should investigate common
underlying processes for the development of multiple PNS impairments in older adults.
4.1 INTRODUCTION
The peripheral nervous system (PNS) consists of two distinct divisions, the sensorimotor
and the autonomic nervous systems. Even though both play integral roles in providing
information to the central nervous system to appropriately respond to stimuli and in controlling
automatic functions of the body, typically they are examined as separate entities. PNS aging is
characterized by a phenomenon known as “selective vulnerability” in which locally specific
structural and functional changes can occur which vastly affect some groups of neurons while
leaving others relatively intact [248]. In particular, long, myelinated axons (like those
innervating the lower limbs) and sympathetic neurons are vulnerable to damage. PNS
dysfunction is often considered in the context of diabetes or specific neurological conditions,
though age-related impairments may occur in either division even in the absence of any
pathologic conditions [28].
Sensorimotor peripheral nerve function impairments are common in older adults [29,30],
with recent work from Health ABC showing that 55% of older adults (N=1,680; age 76.5 ± 2.9
years) without mobility disability have evidence of lower extremity peripheral nerve
impairments [216]. Sensorimotor nerve function impairments in the lower extremities are
106

associated with poorer lower extremity physical function [31-34], worse lower extremity muscle
strength [36,215] and power [37], and an increased risk for falls [38-41] and mobility limitations
[216]. In contrast to lower extremity sensorimotor PNS impairments that impact sensory
perception and motor control of the lower limbs, cardiac autonomic impairments inhibit the
ability of the cardiovascular system to appropriately respond to internal and external stimuli and
maintain homeostasis. Autonomic nerve function impairments can affect other bodily systems,
though cardiac autonomic nerve impairments are often seen as the most serious given their
association with adverse cardiovascular outcomes and death [133,140,142,249,250]. Despite
these risks, autonomic impairments are underappreciated as risk factors in epidemiologic studies
of older adults. Though under-studied, autonomic impairments are common in older adults. In
the Irish Longitudinal Study on Ageing (n=4475, age 50+ years), 6.9% of the study cohort and
18.5% of participants age 80 and older had postural hypotension, an indicator of cardiac
autonomic impairment [251].
Although sensorimotor and autonomic nerve impairments seem very different, they may
be related. Damage to sensorimotor and autonomic nerve fibers in diabetes has largely been
attributed to damage related to hyperglycemia [132,252-254] and poor metabolic control;
although advanced glycation end products [255,256], inflammation [257,258], dyslipidemia
[259] and other cardiovascular risk factors [73,260-262] appear to play roles as well. Work in
populations with diabetes (both Type 1 and Type 2) provides evidence that worse sensorimotor
function is associated with an increased risk of cardiovascular events [263,264]. Additionally,
cardiac autonomic neuropathy is associated with higher odds of developing diabetic somatic
peripheral neuropathy [261], with the severity of cardiac autonomic neuropathy related to a
higher prevalence of peripheral neuropathy [265].
107

Aside from the extensive studies of neuropathy in diabetic populations, the relationship
between sensorimotor and cardiac autonomic function is largely unexamined in either diabetes or
general populations of older adults. Age-related PNS changes can occur independently of
diabetes. Associations between age-related sensorimotor and autonomic impairments have not
been explored and may differ from impairments attributed to diabetes. However, because of the
common underlying risk factors associated with sensorimotor and autonomic peripheral nerve
impairments (particularly cardiovascular risk factors), it is plausible that those with worse
sensorimotor function may also have worse cardiac autonomic function. The purpose of this
study was to examine the independent association between lower-extremity sensorimotor
peripheral nerve function and cardiac autonomic function in older adults.
4.2 METHODS
Participants 4.2.1
Study participants were from the Health, Aging and Body Composition Study (Health
ABC) who completed a clinic visit in 2000/01. Briefly, Health ABC is a longitudinal cohort
study of black and white, initially well-functioning, community dwelling older men and women
from Pittsburgh, PA and Memphis, TN (n=3075; age 70-79; 48.4% male; 41.6% black at
baseline). The purpose of Health ABC was to investigate factors related to the development of
functional limitations and disability [126]. Participants were recruited via mailings to a random
sample of white Medicare beneficiaries and to all age-eligible black community residents.
Eligibility criteria for this study included: having no self-reported difficulty in walking ¼ mile,
108

climbing 10 steps, or performing any basic activity of daily living; no life-threatening cancers;
and plans to remain in the study area for at least the next three years. Participants underwent
baseline clinic visits between April 1997 and June 1998.
Of the original cohort, 2404 participants completed the 2000/01 clinic visit (187
participants were deceased, 74 had a home visit, 233 phone visit, 9 proxy visit, 9 withdrew from
study, and 105 were missing for other reasons). A total of 2393 participants underwent
sensorimotor peripheral nerve function testing and were considered for this analysis (1 refused
nerve exam, 4 were missing nerve measures, 6 had other missing data). All of the 2393
participants included for this analysis had at least one measure of cardiac autonomic function.
Figure 6 shows the participant flow chart of the analytic samples for this study. All participants
provided written informed consent before participating in the study. All study protocols were
approved by institutional review boards at the University of Pittsburgh and University of
Tennessee Health Science Center.
109

Figure 6: Participant Flow Chart for the 2000/01 Health ABC Clinic Visit
Sensorimotor Peripheral Nerve Function 4.2.2
Lower extremity sensory and motor nerve function testing was performed by a trained
examiner. Peroneal motor nerve conduction responses were obtained at the extensor digitorum
brevis muscle, with recording of amplitude (in millivolts) and motor nerve conduction velocity
(in meters per second), as previously described [89]. Peroneal nerve was stimulated at the
popliteal fossa and ankle using the NeuroMax 8 (XLTEK, Oakville, Ontario, Canada). Sensory
nerve function was assessed via vibration threshold and light touch detection. Vibration
detection threshold (in microns) was measured at the bottom of the great toe with a VSA-3000
Vibratory Sensory Analyzer (Medoc, Durham, NC). Light touch sensitivity testing was
performed using a standard 10-g monofilament and light touch 1.4-g monofilament (North Coast
110

Medical, Morgan Hill, CA). Monofilament insensitivity was defined as the inability to detect at
least 3 of 4 touches at the dorsum of the great toe. If needed, feet were warmed to 30°C before
nerve testing. All measures were performed on the right side unless contraindicated due to knee
replacement, amputation, trauma, ulcer, or recent surgery, in which case testing was performed
on the left side. Symptoms of peripheral neuropathy were collected via self-report using a
modified version of the Michigan Neuropathy Screening Instrument questionnaire [108].
Presence of symptoms included reporting any of the following on either foot or leg in the past 12
months: (1) numbness, "asleep feeling," prickly feeling or tingling (2) sudden stabbing, burning,
or deep aches, or (3) an open persistent sore or gangrene. Clinically meaningful cut-points of
motor amplitude of <1 mV and motor nerve conduction velocity <40 m/sec were used to define
poor function [240]. For vibration threshold, >130 microns was used to define impairment.
These cut-points were previously used by Ward and colleagues, and have been shown to be
associated with lower quadriceps strength [215] and worse endurance walking performance
[266], as well as incident mobility limitation [216].
Cardiac Autonomic Function 4.2.3
Radial pulse was used for resting heart rate (HR). Postural hypotension was assessed
using the difference between blood pressure measurements taken while in a seated position, and
one minute after transitioning to a standing position. Diastolic postural hypotension measured in
this manner predicted falls in diabetic participants in Health ABC [39]. Postural hypotension
was defined as drop of >20 mmHg of systolic or >10mmHg diastolic blood pressure between
seated and standing measurements [267].
111

Cardiac autonomic function was also assessed using the cardiovascular response to the
long distance corridor walk (LDCW) [239]. Participants who were ineligible for the LDCW
(n=345) or who did not complete the full 10 laps (n=407) were not included in analyses
involving HR range or recovery. Briefly, the LDCW is an over ground, submaximal walking test
which has been validated to provide an estimate of aerobic fitness in older adults [214]. HR
range was defined as the difference between resting HR and HR at the end of the LDCW, while
HR recovery was defined as the difference between HR at the end of the LDCW and HR 2
minutes post-test. These methods have been used previously by Newman and colleagues in
assessing the association between LDCW performance and incident cardiovascular disease,
mortality, and mobility limitation and disability in Health ABC [268]. Because HR parameters
measured during submaximal exercise are influenced by exertion, models for HR range and HR
recovery were adjusted for LDCW completion time. In Paper 2 we found that participants who
had worse peripheral nerve function had slower LDCW completion times were more likely to
complete the LDCW in greater than 7 minutes, an indicator of very low aerobic fitness [269].
We tested for interactions between sensorimotor function and completion time on HR range and
HR recovery and stratified analyses by completion time (completed in ≤7 minutes vs. >7
minutes) if evidence of a significant interaction existed.
Covariates 4.2.4
Age, sex, race, and clinical site were included as demographic characteristics. In
addition, several factors which could potentially influence sensorimotor or cardiovascular
function were considered as possible covariates. All factors were measured at the 2000/01 clinic
visit unless otherwise stated. Lifestyle factors were assessed via self-report and included:
112

smoking history (never, former, current; reported in 1999/2000), current drinking frequency
(drinks per week), and physical activity (kilocalories expended per week in walking and stair
climbing) [203]. Body composition (fat mass and bone-free lean mass) was measured using
dual-energy X-ray absorptiometry (DXA; 4500A, Hologic, Inc., Bedford, MA). Body mass
index (BMI) was calculated in weight in kilograms per squared height in meters using a standard
physician’s balance scale and stadiometer, respectively.
Diabetes was defined using self-reported physician’s diagnosis, hypoglycemic
medication use, or by fasting glucose ≥126 mg/dL (8 hour fast) and impaired fasting glucose was
defined as fasting glucose level of 100-125 mg/dL (8 hour fast).[226] Ankle brachial index
values of <0.9 indicated peripheral arterial disease and >1.3 for arterial stiffening [227].
Hypertension was defined by self-report, medication use, or systolic blood pressure ≥140mmHg
or diastolic blood pressure ≥90mmHg measured at the clinic visit. Poor vitamin B12 status was
defined as <260 pmol/L [53] and insufficient renal function was defined as Cystatin-C >1mg/dL
[241].
Other prevalent diseases or conditions assessed at baseline (1997/98) included
cardiovascular disease (bypass/coronary artery bypass graft, carotid endarterectomy, myocardial
infarction, angina, or congestive heart failure), Parkinson’s disease, cerebrovascular disease
(transient ischemic attack or stroke), lung disease (asthma, chronic obstructive pulmonary
disease, or emphysema), and osteoarthritis in knee or hip. Self-reported pain in the lower
extremities while walking was assessed via questionnaire. Depressive symptoms were collected
using the Center for Epidemiologic Studies Depression Scale (CES-D) [242]. Medications
known to potentially influence HR, blood pressure, or cholesterol were included from the
detailed medication inventory collected at the 1999/2000 visit. These medications included use
113

of beta blockers, anti-hypertensive medications (based on the Iowa Drug Information Service),
calcium-channel blockers, tricyclic antidepressants [139] and statins. Levels of total cholesterol,
interleukin-6 (IL-6), and C-reactive protein (CRP) were assessed from blood samples collected
by venipuncture after an overnight fast.
Statistical Methods 4.2.5
Descriptive statistics and measures of sensorimotor and autonomic function were
expressed using mean ± standard deviations and proportions for continuous and categorical
variables, respectively. Means and proportions were compared between men and women
because of the potential sex-differences in PNS function [270,271]. T-tests and chi-squared
tests, respectively, compared descriptive factors unless non-parametric versions of these tests
were more appropriate. We examined the correlations between sensorimotor and cardiac
autonomic function using Pearson correlation coefficients for continuous measures, and
Spearman correlation coefficients for correlations involving interval measures.
We modeled the effect of sensorimotor function on continuous indicators of cardiac
autonomic function (resting HR, HR range, and HR recovery) using linear regression. We also
split these continuous outcomes into quintiles, and modeled the effect using ordinal or
multinomial logistic regression when appropriate to account for potential non-linear
relationships. The effect of sensorimotor peripheral nerve function and odds of postural
hypotension were modeled using logistic regression.
We began with minimally adjusted models, and progressively added covariates using
manual stepwise regression techniques. Covariates reaching a significance level of p<0.10 were
considered for a multivariable model. Only factors reaching a significance of p<0.05 in the
114

multivariable model were included in the final, parsimonious model, though age, sex, race, site,
and diabetes were forced into final models regardless of significance. Because measures of
sensorimotor function are moderately correlated (r=0.32, p<0.001 between motor amplitude and
conduction velocity), separate models were built for each. Models were sex stratified if
interactions were observed between sex and sensorimotor function in predicting autonomic
function. We also ran sensitivity analyses using age tertiles rather than continuous age in order
to determine whether associations between sensorimotor and autonomic function differed by age
group or the effect of age was not linear. Final sensitivity analyses were run removing
participants taking any medication that could potentially influence heart rate (beta blockers
tricyclic antidepressants, and calcium channel blockers).
4.3 RESULTS
Women and men in this study differed on many lifestyle and health factors (Table 9).
The prevalence of select diseases and conditions varied by sex, with women being less likely to
have diabetes or impaired fasting glucose, coronary heart disease, arterial stiffening, insufficient
renal function, or poor vitamin B12 status, though women were more likely to have hypertension
and osteoarthritis, and reported more depressive symptoms. Women had higher levels of CRP
and total fasting cholesterol, while men had slightly higher values of IL-6. Women were more
likely to take hypertensive, calcium channel blockers, and tricyclic antidepressants.
115

Table 9: Health ABC 2000/01 Clinic Visit Participant Characteristics by Sex
*Physical Activity: Kilocalories/kilogram body weight spent per week in walking and stair climbing; **Cystatin-C >1mg/dL; ***CES-D: Center for Epidemiologic Studies Depression Scale
Participant Characteristics Men N= 1154
Women N=1239
P-Value
Pittsburgh Site % (n) 51.2 (591) 50.7 (628) 0.80 Age, Mean ± SD 76.7 ± 2.9 76.4 ± 2.9 0.01 Black Race 33.5 (386) 42.6 (528) <0.001 Health Fair or Poor 13.4 (154) 15.4 (190) 0.17
Anthropomorphic Characteristics and Body Composition Body Mass Index 27.1 ± 4.0 27.4 ± 5.4 0.057 Height, meters 1.7 ± 0.7 1.6 ± 0.6 <0.001 Weight (kg) 81.0 ± 13.4 69.9 ± 14.6 <0.001 Bone-Free Lean Mass (kg) 57.0 ± 7.3 41.5 ± 6.2 <0.001 Fat Mass (kg) 23.9 ± 7.4 28.4 ± 9.2 <0.001
Lifestyle Habits Current Smoker 8.9 (101) 8.3 (101) <0.001 Drink >1 Drink/Week 39.0 (442) 21.9 (267) <0.001 Physical Activity* (kcal/kg/week) 7.1 ± 18.2 4.7 ± 15.0 <0.001
Prevalent Diseases and Conditions Diabetes 25.0 (289) 18.4 (228) <0.001 Impaired Fasting Glucose 20.0 (231) 12.4 (153) Hypertension 57.8 (658) 63.4 (774) 0.01 Parkinson’s Disease 0.7 (8) 0.5 (6) 0.50 Coronary Heart Disease 24.8 (269) 13.3 (155) <0.001 Cerebrovascular Disease 6.4 (72) 7.1 (85) 0.54 Lung Disease 16.2 (187) 19.6 (243) 0.03 Osteoarthritis (Knee or Hip) 10.4 (120) 16.1 (200) <0.001 Peripheral Arterial Disease 16.2 (180) 16.2 (192) <0.001 Arterial Stiffening 7.2 (80) 3.2 (38) Insufficient Renal Function** 33.1 (376) 23.5 (282) <0.001 Poor Vitamin B12 (<260 pmol/L) 19.9 (221) 14.4 (169) <0.001 Depressive Symptoms 5.6 ± 5.9 7.2 ± 6.8 <0.001 Pain in Legs While Walking 23.0 (264) 24.9 (307) 0.48
Laboratory Measures CRP, mg/L 4.4 ± 9.6 5.3 ± 7.3 0.014 IL-6, pg/mL 3.8 ± 3.7 3.5 ± 3.8 0.048 Total Fasting Cholesterol, mg/dL 180.6 ± 32.8 202.1 ± 38.4 <0.001
Medication Use Statins 20.7 (232) 18.8 (228) 0.26 Beta Blockers 17.5 (199) 16.9 (208) 0.71 Calcium Channel Blockers 21.3 (242) 25.2 (310) 0.02 Anti-hypertensive Medications 56.2 (640) 61.6 (758) 0.008 Tricyclic Antidepressants 1.3 (15) 3.3 (40) 0.002
116

Several significant differences in sensorimotor and autonomic function were observed by
sex (Table 10). Women had better motor and sensory peripheral nerve function, but were more
likely to report symptoms of peripheral neuropathy. Women had slightly higher resting HR, but
were less likely to have postural hypotension and also had a better HR range and recovery to the
LDCW compared to men.
Table 10: Sensorimotor and Cardiac Autonomic Function by Sex
*HR at End of LDCW – Resting HR, BPM, Mean ± SD
**HR at End of LDCW – HR 2 Min Post Test, BPM, Mean ± SD
Peripheral Nervous System Function Measure
Men N=1154
Women N=1239
P-Value
Motor Nerve Function Motor amplitude, mV, Mean ± SD 3.0 ± 1.9 3.6 ± 2.0 <0.001 Poor amplitude, %(n) 15.7 (137) 7.4 (73) <0.001 Conduction velocity, m/sec 41.7 ± 4.8 45.3 ± 5.3 <0.001 Poor conduction velocity 33.2 (272) 12.9 (120) <0.001
Sensory Nerve Function Vibration threshold, microns 59.8 ± 37.1 44.1 ± 32.5 <0.001 Poor vibration threshold 8.7 (96) 3.2 (39) <0.001 1.4 monofilament insensitivity 40.9 (463) 33.2 (404) <0.001
10-g monofilament insensitivity 12.3 (139) 5.6 (68) Symptoms of Peripheral Neuropathy
One symptom 25.7 (296) 28.3 (347) 0.005 Two or More Symptoms 8.2 (94) 11.8 (144)
Autonomic Nervous System Function Resting HR, BPM, Mean ± SD 62.3 ± 10.8 63.6 ± 10.0 0.002 Postural Hypotension 7.2 (83) 6.1 (76) 0.30 HR Range* 43.4 ± 14.3 44.6 ± 15.1 0.087 HR Recovery 17.8 ± 10.5 18.9 ± 10.5 0.029
117

Despite the differences in participant characteristics and PNS function by sex, no
significant interactions by sex existed, and thus the following results were not sex-stratified.
Several of the motor and sensory nerve measures were significantly correlated with the
indicators of cardiac autonomic function, although no associations were observed with symptoms
of peripheral neuropathy (Table 11).
Table 11: Correlation* Matrix of Continuous Sensorimotor and Autonomic Function
Measures
Resting HR Orthostatic Hypotension HR Range HR Recovery
Motor Nerve Amplitude
-0.052 (0.026)
0.014 (0.547)
0.037 (0.179)
0.019 (0.481)
Motor Nerve Conduction Velocity
0.027 (0.226)
-0.090 (<0.001)
0.097 (<0.001)
0.057 (0.044)
Vibration Threshold
0.005 (0.830)
0.046 (0.029)
-0.047 (0.002)
-0.022 (0.378)
Monofilament Insensitivity
-0.010 (0.650)
-0.005 (0.806)
-0.051 (0.041)
0.008 (0.738)
Presence of Neuropathy Symptoms
0.013 (0.547)
0.025 (0.224)
0.018 (0.474)
0.022 (0.0372)
*Pearson correlation coefficients shown for correlations of continuous measures, and Spearman
correlation coefficients shown for correlations involving interval measures. Partial correlation
coefficients are shown for HR Range and HR Recovery to account for long distance corridor
walk completion time.
118

Figure 7 displays the mean unadjusted resting heart rate by sensorimotor function. After
adjusting for age, study site, race, diabetes, beta blocker use, CRP and total fasting cholesterol,
each standard deviation of lower motor nerve amplitude was associated with a resting HR of 1.03
higher beats per minute, and having poor motor amplitude (< 1mV) was associated with higher
resting HR of 2.20 beats per minute (p=0.005). After removing participants taking medications
that could influence heart rate (n=876), poor amplitude was associated with a higher resting heart
rate of 2.48 beats per minute (p=0.011). The relationship between amplitude and resting heart
rate was attenuated when removing participants taking any medication that could influence
resting heart rate, though results remained statistically significant.
Figure 7: Mean Unadjusted Resting Heart Rate by Sensorimotor Function
119

Unadjusted odds of orthostatic hypotension by sensorimotor function are displayed in
Figure 8. In adjusted models, only conduction velocity remained associated with odds of
orthostatic hypotension. Each standard deviation of slower motor nerve conduction velocity was
associated with 1.37 higher odds of orthostatic hypotension (p=0.005) after adjusting for age,
sex, race, site, diabetes, poor health, and IL-6. Poor conduction velocity (< 40m/sec) was
associated with 1.57 higher odds of orthostatic hypotension (p=0.05). Finally, those with 1.4g
monofilament insensitivity had an average HR range of 1.43 beats per minute lower compared to
those who were able to detect the 1.4g monofilament (p=0.036). No associations remained with
HR recovery after adjusting for common covariates.
Figure 8: Unadjusted Odds of Orthostatic Hypotension by Sensorimotor Function
Normal Function Poor Function/ Monofilament Insensitivity
120

HR range and recovery were negatively correlated with LDCW completion time
(r = -0.309 and r = -0.328, respectively, p<0.001 for each.) In adjusted models, associations
between monofilament detection (1.4g and 10g insensitivity combined for statistical power) and
HR range remained. A significant interaction existed between completion time and
monofilament detection on HR range, and thus models for monofilament detection and HR range
were stratified by completion time (completed in ≤7 minutes vs. >7 minutes). In separate fully
adjusted models (adjusted for age, sex, race, site, diabetes, height, fat mass, lean mass, beta
blocker use, and calcium channel blocker use), monofilament insensitivity was associated with a
HR range of 1.8 beats per minute lower in participants who completed the LDCW in 7 minutes
or less, while monofilament insensitivity was not significantly associated with HR range in those
who competed the LDCW in greater than 7 minutes (Figure 9). When removing participants
taking any medication that could influence heart rate (n=534), monofilament insensitivity was
associated with a heart rate range of 1.66 beats per minute lower (p=0.035) compared to those
who detected the monofilaments.
121

Adjusted for age, sex, race, site, diabetes, fat mass, lean body mass, height, beta blocker use,
and calcium channel blocker use.
Figure 9: Adjusted Heart Rate Range During the LDCW By Monofilament Detection
4.4 DISCUSSION
Some indicators of worse sensorimotor peripheral function were independently
associated with worse cardiac autonomic function for some, but not all measures. Motor nerve
function was associated with cardiac autonomic function measures of resting heart rate and
orthostatic hypotension. Monofilament insensitivity was associated with lower HR range in
participants who completed the LDCW in seven minutes or less, while monofilament
insensitivity was associated with higher HR range in those who took greater than 7 minutes
complete the LDCW. To our knowledge, this is the first study examining the association
between these PNS divisions in a population of community dwelling older adults. Generally, the
122

sensorimotor and autonomic divisions of the PNS are not examined simultaneously. Though
PNS function is often considered in the context of diabetes, age-related PNS changes are not as
well understood.
The PNS is comprised of large and small fibers, each responsible for distinct aspects of
neurotransmission. Within the sensorimotor division, large myelinated fibers (Aα, Aβ) mediate
motor control as well as touch, vibration, and position perception. Small, thinly myelinated (Aδ)
or unmyelinated (C fibers) of the sensorimotor division provide information about pain in
addition to cold and warm perception, respectively. The autonomic division is made up of thinly
myelinated and unmyelinated fibers, and mediates HR, blood pressure, sweating, gastrointestinal
and genitourinary function. The most consistent significant associations observed in this
analysis were between motor nerve function and HR and orthostatic hypotension, which are
highly influenced by vagal nerve function. Though these relationships were between different
fiber types, this observation is consistent with the notion of selective vulnerability, where the
long nerve fibers (like the vagus and peroneal nerves) are particularly prone to damage.
Damage to the peripheral nervous system in the context of diabetes is often attributed to
long-term metabolic disturbances and hyperglycemia, [88,110,260] though our observed
associations were not explained by factors largely thought of as influencing nerve function. In
particular, these associations were independent of age, sex, race, diabetes, and prevalent diseases.
In the model building process, very few covariates were significantly associated with
sensorimotor and indicators of cardiac autonomic function, and multivariable models included
few parameters beyond age, sex, race, study site and diabetes—which were included in all
models regardless of significance, suggesting a primary association between the PNS
components. However, the effect sizes of the observed relationships were small. For example,
123

poor motor amplitude was associated with a resting heart rate of 2.20 beats per minute higher
compared to those with normal amplitude. In a longitudinal study by Jensen and colleagues
examining the risk of mortality by resting heart rate in middle aged men, the risk of mortality
increased by about 16% per every 10 beats per minute higher. The heart rate differences
observed in our study were much smaller, and may not be as clinically relevant. Additionally,
even though some measures of sensorimotor peripheral nerve function were independently
associated with the indicators of cardiac autonomic function, the overall R2 values for these
models were low (results not shown). This may indicate potential underlying mechanisms
common to the pathogenesis of sensorimotor and autonomic dysfunction that were not captured
by the included covariates, or it may simply indicate small associations.
We expected age to explain a large portion of the association between sensorimotor and
cardiac autonomic function. Sensorimotor impairments are highly prevalent in this cohort of
older adults; however, age was weakly associated with orthostatic hypotension and HR recovery,
and was not associated with resting HR or HR range (results not shown). Age did not
significantly attenuate any of the observed associations between sensorimotor and autonomic
function. This supports an independent relationship between sensorimotor and autonomic
function, and that the relationships we observed were not simply due to simultaneous age related
declines in sensorimotor and autonomic function, but rather a direct relationship between the
two.
Monofilament insensitivity was differentially associated with HR range in this cohort,
with the relationship differing between those who completed the LDCW in ≤7 compared to those
who completed in >7 minutes. In those who completed the LDCW in ≤7, monofilament
insensitivity was associated with lower HR range when adjusting for continuous completion
124
time, indicating worse cardiac autonomic function. However, in those who completed in >7
minutes, monofilament insensitivity was not significantly associated with larger HR range.
Work validating the LDCW against maximal treadmill testing indicated that requiring >7
minutes (420 seconds) to complete the LDCW is approximately equivalent to an aerobic capacity
level of <12 mL O2 per kilogram of body weight per minute [269], which is a critical threshold
of fitness where independence and community living may be severely compromised [272].
A major strength of this study is the inclusion of many diverse factors known to influence
sensorimotor or autonomic function. In addition, sensorimotor peripheral nerve function was
assessed through the use of objective and subjective measures in addition to self-reported
symptoms—an important consideration since impairments in older adults are commonly
asymptomatic [30]. Examining motor and sensory nerve function separately allowed us to
investigate specific pathways in which sensorimotor and autonomic function may be related.
The measures of autonomic function are clinically relevant and could feasibly be administered in
a variety of settings. A limitation is that we could only assess heart rate range and heart rate
recovery in participants who completed the full LDCW. In Paper 2 we demonstrated that
participants with sensorimotor impairments are less likely to complete the full LDCW compared
to those with better sensorimotor function. Thus, the participants who were included in the heart
rate range and heart rate recovery portion of the analysis had better sensorimotor function overall
compared the full analytic sample, potentially biasing these results towards the null.
Though we were able to include a variety of measures of cardiac autonomic function,
other measures often utilized in clinical settings—for example, expiratory-inspiratory ratio, HR
variability, and tilt-table testing—were not assessed in Health ABC. These measures are rarely
included in epidemiologic studies, and HR variability in particular can be computationally
125

challenging to analyze and also difficult to interpret. The measures we used are surrogates of
autonomic function, and could be influenced by current acute physiologic and health status,
potentially resulting in residual confounding. This is a first step in an area which needs much
more investigation, including detailed assessments of cardiac autonomic function. Future work
should include comprehensive examinations of each aspect of sensorimotor and autonomic
function. Including HR variability and other sensitive measures of autonomic function may aid
in clarifying this association. Though it has limitations, HR variability analyzed using frequency
domain methods may be useful for separating the effects of sympathetic and parasympathetic
modulation. Consideration of other organ systems controlled largely by the autonomic nervous
system (gastrointestinal, genitourinary) may also be useful. A final limitation is that though we
had access to a detailed medication inventory, these medications were assessed in the 1999/2000
clinic visit and thus may not reflect the participants’ medication regimen one year later when
PNS function was measured.
This study demonstrated that some aspects of worse sensorimotor peripheral nerve
function are independently associated with worse indicators of cardiovascular autonomic
function in community-dwelling older adults. Both play roles in the ability of older adults to be
physically active and remain independent. Given the poor outcomes associated with PNS
impairments, future epidemiologic studies should consider assessing these often
underappreciated risk factors in order to gain insight into the contribution of PNS function to
health in old age.
126

5.0 DISSERTATION DISCUSSION
5.1 SUMMARY OF FINDINGS
The overall objective of this dissertation was to examine age-related peripheral nerve
function impairments in the context of PA, fitness, and autonomic function in older adults. Prior
work has indicated the association between poor sensorimotor peripheral nerve function
impairments and mobility-related outcomes in older adults. PA, fitness, endurance, and
autonomic function may be in the pathway between sensorimotor impairments and geriatric
outcomes. This work is critical as it provides potential mechanisms with ay underlie the
relationships between poor peripheral nerve impairment and lower extremity outcomes in old
age.
One factor which may account for the relationships of poor peripheral nerve impairment
and lower extremity outcomes of older age is reduced PA. Lower extremity sensorimotor
impairments were found to be cross-sectionally associated with lower levels of PA in older men
from the MrOS study. In particular, worse distal motor latency and the presence of neuropathic
symptoms were associated with lower self-reported PA, while worse motor and sensory
amplitude were associated with fewer minutes per day of objectively measured PA. Crude
associations between worse motor and sensory amplitude with light and moderate activity were
attenuated by age, BMI, diabetes, self-reported health, peripheral arterial disease and arterial
127

stiffening, though significant relationships existed with vigorous activity. Because of the cross-
sectional nature of this study, it is unclear whether higher levels of activity (particular vigorous
activity) are protective against age-related peripheral nerve function impairments, or whether
those with intact peripheral nerve function are able to maintain high activity levels because of
their better nerve function. However, this was the first study to examine the relationship
between peripheral nerve impairments and PA in older adults and supports the need for
longitudinal studies for clarifying the direction of these relationships and the intensity of PA that
is most beneficial.
Declines in physical fitness and endurance in old age can lead to mobility
impairments/disability [15,273] and even death [16,274]. PA can influence physical fitness and
endurance in older adults [5,19,20], though declines in physical fitness and endurance may be
fundamental aspects of the aging process [4,2,8,275]. Maintaining fitness and endurance above
critical thresholds is pertinent for preventing mobility disability. In addition to reduced PA,
declines in fitness and endurance could also be in the pathway between sensorimotor
impairments and adverse mobility outcomes. Poor sensorimotor function was associated with
worse walking endurance performance, with sensory impairments being associated with a greater
rate of slowing over time in older black and white men and women in Health ABC. Those with
sensory peripheral nerve impairments completed the long distance corridor walk approximately
15 seconds slower and experienced an additional slowing of four seconds per year compared to
those without these impairments. Interestingly, motor impairments were not related to
longitudinal decline. These findings were independent of diabetes and other health and
behavioral factors known to influence sensorimotor function. Sensory nerve impairments (poor
vibration perception threshold and 1.4/10g monofilament insensitivity) had the largest effect on
128

endurance walking performance over time, indicating the major impact that reduced sensation
has on mobility. Maintaining walking endurance is critical for remaining independent in the
community. Interventions aimed at reducing the burden of sensory impairments, or maintaining
endurance in spite of impairments should be considered.
An additional component of the PNS, the autonomic division, supports the ability to be
physically active, particularly via cardiovascular response to exercise. The capacity of the
cardiovascular system to adequately respond to and recover from activity is a major focus in
exercise physiology, and is largely controlled by the autonomic nervous system. Poor cardiac
autonomic function is associated with exercise intolerance and can ultimately lead to cardiac
outcomes, disability, and death. Work in populations with diabetes has suggested an association
between cardiac autonomic neuropathy and the development of sensorimotor peripheral
neuropathy [261]. Greater severity of cardiac autonomic neuropathy has also been associated
with a higher prevalence of peripheral neuropathy [276].
Despite being components of the same system, sensorimotor function and autonomic
function are rarely examined together, and the association has not been previously examined or
defined for older adults. Cardiac autonomic impairments could potentially also be within the
pathway between sensorimotor impairments and geriatric outcomes. In Health ABC, we found
that poor conduction velocity was associated with higher odds of orthostatic hypotension,
suggesting an association between demyelination and the inability for the cardiac autonomic
system to adequately respond to postural changes. Additionally, poor motor amplitude was
associated with higher resting HR. Insensitivity to the 1.4g monofilament was associated with a
lower heart rate range during the submaximal exercise test, after adjusting for performance on
the test. Sensorimotor and autonomic function remained independently related after adjusting
129

for age, sex, race, diabetes, and health and lifestyle factors known to influence PNS function, and
these factors did not attenuate findings substantially. Therefore, this work suggests a primary
association between function in the two divisions of the PNS. Future studies should investigate
common underlying processes for the development of multiple PNS impairments.
5.2 PUBLIC HEALTH SIGNIFICANCE
Traditionally, studies examining PNS function were concentrated in the area of diabetes
or other disease-related dysfunction and impairment. Despite the important work from
populations with diabetes, age-related peripheral nerve impairments may differ from those in
diabetes and should be examined for their impact on geriatric conditions and outcomes. Though
diabetes-related peripheral nerve impairments can give insight and drive hypotheses regarding
age-related changes, is important to study these impairments in broader populations of older
adults—particularly given the tremendous expected increase in number and proportion of this
population in the coming years. Gaining a better understanding of the peripheral nervous system
in older adults can ultimately help drive prevention efforts including the development of
interventions to help reduce the poor outcomes associated with age-related impairments. Work
from this dissertation suggests PA interventions which focus on PNS impairments may be
beneficial for older adults. Alternative PA recommendations for those with reduced sensation in
the lower extremities may be warranted, though further work is needed in this area.
Ultimately, PA is likely in the pathway between PNS impairments and major geriatric
outcomes like falls, disability, and death. Older adults tend to become less active over time
[277], and PNS impairments may be a contributing factor to these declines in activity. No
130
longitudinal studies have examined changes in physical activity by peripheral nerve impairments.
However, peripheral nerve impairments are associated with a higher risk of mobility disability
[216], an indicator that physical activity is likely decreasing as well.
My prior work in Health ABC has indicated that higher levels of PA are associated with
better long distance corridor walk performance [275]. Additionally, higher levels of PA are
associated with better cardiac autonomic function in older adults [278], and PA interventions can
also improve cardiac autonomic function [171,174]. It is unclear whether PA interventions lead
to improvements in sensorimotor peripheral nerve function in older adults; though improving
outcomes for those with sensorimotor impairments via PA is a worthy of study, particularly
given the high prevalence of these impairments in community-dwelling older adults [29,30,216].
PA can play a key role in improving health, reducing chronic conditions, and promoting
independence throughout the aging process [279]. Given the drastic demographic shift occurring
in the U.S. as the “baby boomer” generation ages, keeping older adults healthy and independent
for as long as possible is a major public health priority. By the year 2030, it is expected that the
population of U.S. adults age 65+ will double, with this age group making up 20% of the
population [280]. Because many older adults have at least one chronic health condition, nearly
66% of national health care expenditures are for this age group [280].
Per Olaf Astrand, a notable exercise physiologist may have best stated the major cost of
physical inactivity and reduced aerobic fitness in older adults: “As a consequence of diminished
exercise tolerance, a large and increasing number of elderly people will be living below, at, or
just above "thresholds" of physical ability, needing only a minor intercurrent illness to render
them completely dependent” [19]. Unfortunately little has changed regarding the PA status of
older adults since he made this comment nearly 20 years ago.
131

Sensorimotor and autonomic peripheral nerve function impairments have been
underappreciated as risk factors for disability in older adults, despite their potential to
significantly impact lower extremity and cardiovascular function. Although national PA
guidelines acknowledge that older adults may have difficulty achieving the recommended levels
of PA due to chronic conditions, these recommendations are generally not tailored to these
specific chronic conditions. For example, reduced sensation in the lower extremities due to PNS
impairments may make walking difficult, whereas other forms of physical activity may be more
appropriate. Acknowledging specific conditions like PNS impairments and providing PA
recommendations based upon those conditions may make PA more feasible for older adults.
5.3 FUTURE DIRECTIONS
Both sensorimotor and cardiac autonomic peripheral nerve function play roles in the
ability for older adults to be physically active. Peripheral nerve impairments should be
integrated into future work examining the impact of PA on functional outcomes in older adults.
Worse sensorimotor peripheral nerve function was found to be associated with lower
levels of PA in a primarily white, community-dwelling population of older men. An obvious
future direction of this work is to examine this association in women and in ethnically diverse
populations. The field of PA epidemiology has advanced significantly with the development of
activity monitors, though the use of traditional summary measures of activity (i.e. total minutes
spent in various intensities of activity) has its limitations. More recently, novel techniques for
analyzing raw PA signals has allowed for researchers to examine patterns of activity
accumulation [191], duration of activity bouts, and even the identification of specific activities
132

[192,193]. Though some of these methods need further validation in free-living environments,
they bring exciting possibilities for future work. Examining whether sensorimotor peripheral
nerve function impairments are not only associated with lower levels but also different activity
patterns could help drive the development of successful PA interventions. Considering the high
prevalence of sedentary behaviors in older adults, work examining patterns of sedentary time and
breaks in sedentary behaviors are warranted. Simply avoiding sedentary behavior confers its
own health benefits [185], which are important even for those who are active [186].
Currently, many traditional algorithms used for analyzing objectively measured physical
activity data do not distinguish between aerobic and resistance training activities. However,
novel analysis techniques are constantly being developed which may allow for even more
detailed analyses of activity than are currently available. Given the association between
sensorimotor impairments with worse lower extremity strength [36,215] and power [230],
resistance training activities are of particular interest in examining the association between PA
and sensorimotor impairments and for developing future interventions to reduce mobility
limitations. Though overground walking may be difficult for those with reduced lower extremity
sensation, weight bearing activities for the purpose of developing muscle strength and power
may be beneficial for improving functional outcomes.
Aspects of cardiac autonomic function are often assessed in exercise physiology studies,
including heart rate range and heart rate recovery to exercise testing. Autonomic function can
impact the ability to be active, and is a potential mechanism in which PNS impairments lead to
geriatric outcomes and conditions. The association between sensorimotor and cardiac autonomic
function is a particularly novel finding, and provides valuable insight into PNS aging. This work
suggests a primary association between cardiac autonomic and lower extremity sensorimotor
133

function. Traditionally, effects of aging on specific bodily systems have been examined
separately, though aging does not affect single system components in isolation. Work is needed
to further investigate the development of multiple PNS impairments during the aging process.
The inclusion of comprehensive sensorimotor and cardiac autonomic assessment methods (i.e.
nerve conduction and heart rate variability, among others) into one single study could help
further clarify this relationship. Using a holistic approach to study PNS impairments may also be
more efficient for developing interventions for improving overall PNS function and related
lower-extremity outcomes for older adults.
134

BIBLIOGRAPHY
1. Buskirk E, Hodgson J (1987) Age and aerobic power: the rate of change in men and women. Federation proceedings 46 (5):1824-1829
2. Astrand I (1960) Aerobic work capacity in men and women with special reference to age. Acta physiologica Scandinavica Supplementum 49 (169):1-92
3. Gerstenblith G, Lakatta EG, Weisfeldt ML (1976) Age changes in myocardial function and exercise response. Progress in cardiovascular diseases 19 (1):1-21
4. Astrand I, Astrand PO, Hallback I, Kilbom A (1973) Reduction in maximal oxygen uptake with age. J Appl Physiol 35 (5):649-654
5. Ogawa T, Spina RJ, Martin WH, Kohrt WM, Schechtman KB, Holloszy JO, Ehsani AA (1992) Effects of aging, sex, and physical training on cardiovascular responses to exercise. Circulation 86 (2):494-503. doi:10.1161/01.cir.86.2.494
6. Fleg J, Strait J (2012) Age-Associated Changes in Cardiovascular Structure and Function: A Fertile Milieu for Future Disease. Heart Fail Rev 17:545-554
7. Inbar O, Oren A, Scheinowitz M, Rotstein A, Dlin R, Casaburi R (1994) Normal cardiopulmonary responses during incremental exercise in 20- to 70-yr-old men. Med Sci Sports Exerc 26 (5):538-546
8. Fleg J, Morrell C, Bos A, Brant L, Talbot L, Wright J, Lakatta E (2005) Accelerated Longitudinal Decline of Aerobic Capacity in Healthy Older Adults. Circulation 112:674-682
9. Astrand P, Bergh U, Kilbom A (1997) A 33-yr follow-up of peak oxygen uptake and related variables of former physical education students. J Appl Physiol 82 (6):1844-1852
10. Rogers M, Hagberg J, Martin W, Ehsani A, Holloszy J (1990) Decline in VO2max with aging in master athletes and sedentary men. J Appl Physiol 68 (5):2195-2199
11. Eskurza I, Donato AJ, Moreau KL, Seals DR, Tanaka H (2002) Changes in maximal aerobic capacity with age in endurance-trained women: 7-yr follow-up. J Appl Physiol 92 (6):2303-2308. doi:10.1152/japplphysiol.01124.2001
135

12. Hollenberg M, Yang J, Haight T, Tager I (2006) Longitudinal Changes in Aerobic Capacity: Implications for Concepts of Aging. J Gerontol 61A (8):851-858
13. Fleg JL, Lakatta EG (1988) Role of muscle loss in the age-associated reduction in VO2 max. J Appl Physiol 65 (3):1147-1151
14. Booth F, Weeden S, Tseng B (1994) Effect of aging on human skeletal muscle and motor function. Med Sci Sports Exerc 26 (5):556-560
15. Morey M, Pieper C, Cornoni-Huntley J (1998) Physical fitness and functional limitations in community-dwelling older adults. Med Sci Sports Exerc 30 (5):715-723
16. Blair S, Kampert J, Kohl H, Barlow C, Macera C, Paffenbarger R, Gibbons L (1996) Influences of cardiorespiratory fitness and other precursors on cardiovascular disease and all-cause mortality in men and women. 276 (6):205-210
17. Aging and working capacity. Report of a WHO Study Group (1993). World Health Organization technical report series 835:1-49
18. Fletcher G, Balady G, Blair S, Blumenthal J, Caspersen C, Chaitman B, Epstein S, Sivarajan Froelicher E, Froelicher V, Pina I, Pollock M (1996) Statement on Exercise: Benefits and Recommendations for Physical Activity Programs for All Americans. Circulation 96:857-862
19. Astrand P (1992) Physical activity and fitness. Am J Clin Nutr 55 (6 Suppl):1231S-1236S
20. Dehn M, Bruce R (1972) Longitudinal variations in maximal oxygen intake with age and activity. J Appl Physiol 33 (6):805-807
21. Caspersen C, Kriska A, Dearwater S (1994) Physical activity epidemiology as applied to elderly populations. Baillière's Clinical Rheumatology 8 (1):7-27. doi:http://dx.doi.org/10.1016/S0950-3579(05)80222-5
22. Wing R, Goldstein M, Acton K, Birch L, Jakicic J, Sallis J, Smith-West D, Jeffery R, Surwit R (2001) Behavioral science research in diabetes: lifestyle changes related to obesity, eating behavior, and physical activity. Diabetes Care 24 (1):117-123
23. Hainer V, Toplak H, Mitrakou A (2008) Treatment modalities of obesity: what fits whom? Diabetes Care 31 Suppl 2:S269-277. doi:10.2337/dc08-s265
24. Troiano R, Berrigan D, Dodd K, Mâsse L, Tilert T, McDowell M (2008) Physical activity in the United States measured by accelerometer. Med Sci Sports Exerc 40 (1):181
25. Colbert L, Matthews C, Schoeller D, Havinghurst T, Kim K (2013) Intensity of Physical Activity in the Energy Expenditure of Older Aults. J Aging Phys Act
26. Nelson ME, Rejeski WJ, Blair SN, Duncan PW, Judge JO, King AC, Macera CA, Castaneda-Sceppa C (2007) Physical activity and public health in older adults: recommendation from the
136

American College of Sports Medicine and the American Heart Association. Med Sci Sports Exerc 39 (8):1435-1445. doi:10.1249/mss.0b013e3180616aa2
27. Schrack J, Simonsick E, Ferrucci L (2010) The Energetic Pathway to Mobility Loss: An Emerging New Framework for Longitudinal Studies on Aging. J Am Geriatr Soc 58:S329-S336
28. Verdu E, Ceballos D, Vilches J, Navarro X (2000) Influence of aging on peripheral nerve function and regeneration. Journal of the peripheral nervous system : JPNS 5 (4):191-208
29. Baldereschi M, Inzitari M, Di Carlo A, Farchi G, Scafato E, Inzitari D (2007) Epidemiology of distal symmetrical neuropathies in the Italian elderly. Neurology 68 (18):1460-1467. doi:10.1212/01.wnl.0000260606.36443.29
30. Gregg E, Sorlie P, Pulose-Ram R, Eberhardt M, Wolz M, Burt V, Cuirtin L, GEngelgau M, Geiss L (2004) Prevalence of Lower-Extremity Disease in the U.S. Adult Population 40+ Years of Age with and Without Diabetes. Diabetes Care 27 (27):1591-1597
31. Strotmeyer E, De Rekeneire N, Schwartz A, Faulkner K, Resnick H, Goodpaster B, Shorr R, Vinik A, Harris T, Newman A (2008) The Relationship of Reduced Peripheral Nerve Function and Diabetes with Physical Performance in Older White and Black Adults. Diabetes Care 31 (9):17671-11772
32. Cimbiz A, Cakir O (2005) Evaluation of balance and physical fitness in diabetic neuropathic patients. Journal of diabetes and its complications 19 (3):160-164. doi:10.1016/j.jdiacomp.2004.06.005
33. Resnick H, Stansberry K, Harris T, Tirivedi M, Smith K, Morgan P, Vinik A (2002) Diabetes, peripheral neuropathy, and old age disability. Muscle & nerve 25 (1):43-50
34. Resnick H, Vinik A, Schwartz A, Leveille S, Brancati F, Balfour J, Guralnik J (2000) Independent effects of peripheral nerve dysfunction on lower-extremity physical function in old age: the Women's Health and Aging Study. Diabetes Care 23 (11):1642-1647. doi:10.2337/diacare.23.11.1642
35. Strotmeyer ES, Cauley JA, Schwartz AV, de Rekeneire N, Resnick HE, Zmuda JM, Shorr RI, Tylavsky FA, Vinik AI, Harris TB, Newman AB (2006) Reduced peripheral nerve function is related to lower hip BMD and calcaneal QUS in older white and black adults: the Health, Aging, and Body Composition Study. Journal of bone and mineral research : the official journal of the American Society for Bone and Mineral Research 21 (11):1803-1810. doi:10.1359/jbmr.060725
36. Strotmeyer E, de Rekeneire N, Schwartz A, Resnick H, Goodpaster B, Faulkner K, Shorr R, Vinik A, Harris T, Newman A, Study ftHA (2009) Sensory and Motor Peripheral Nerve Function and Lower-Extremity Quadriceps Strength: The Health, Aging and Body Composition Study. J Am Geriatr Soc 57 (11):2004-2010. doi:10.1111/j.1532-5415.2009.02487.x
137

37. Ward R, Caserotti P, Faulkner K, Boudreau R, Zirkovic S, Lee C, Goodpaster B, Cawthon P, Newman A, Cauley J, Strotmeyer E (2014: In Press) Peripheral Nerve Function and Lower Extremity Muscle Power in Older Men. Arch Phys Med Rehab
38. Richardson J, Ching C, Hurvitz E (1992) The relationship between electromyographically documented peripheral neuropathy and falls. J Am Geriatr Soc 40 (10):1008-1012
39. Schwartz A, Vittinghoff E, Sellmeyer D, Feingold K, de Rekeneire N, Strotmeyer E, Shorr R, Vinik A, Odden M, Park S, Faulkner K, Harris T (2008) Diabetes-Related Complications, Glycemic Control, and Falls in Older Adults. Diabetes Care 31 (3):391-396. doi:10.2337/dc07-1152
40. Ferrucci L, Bandinelli S, Cavazzini C, Lauretani F, Corsi A, Bartali B, Cherubini A, Launer L, Guralnik J (2004) Neurological examination findings to predict limitations in mobility and falls in older persons without a history of neurological disease. Am J Med 116 (12):807-815. doi:http://dx.doi.org/10.1016/j.amjmed.2004.01.010
41. Lalli P, Chan A, Garven A, Midha N, Chan C, Brady S, Block E, Hu B, Toth C (2013) Increased gait variability in diabetes mellitus patients with neuropathic pain. Journal of diabetes and its complications 27 (3):248-254. doi:10.1016/j.jdiacomp.2012.10.013
42. Stein P, Barzilay J, Chaves P, Domitrovich P, Gottdiener J (2009) Heart rate variability and its changes over 5 years in older adults. Age and ageing 38 (2):212-218. doi:10.1093/ageing/afn292
43. Colcombe S, Kramer AF (2003) Fitness effects on the cognitive function of older adults: a meta-analytic study. Psychological science 14 (2):125-130
44. Kramer A, Colcombe S, McAuley E, Eriksen K, Scalf P, Jerome G, Marquez D, Elavsky S, Webb A (2003) Enhancing brain and cognitive function of older adults through fitness training. Journal of molecular neuroscience : MN 20 (3):213-221. doi:10.1385/jmn:20:3:213
45. Netz Y, Dwolatzky T, Zinker Y, Argov E, Agmon R (2011) Aerobic fitness and multidomain cognitive function in advanced age. International psychogeriatrics / IPA 23 (1):114-124. doi:10.1017/s1041610210000797
46. Hindin SB, Zelinski EM (2012) Extended practice and aerobic exercise interventions benefit untrained cognitive outcomes in older adults: a meta-analysis. J Am Geriatr Soc 60 (1):136-141. doi:10.1111/j.1532-5415.2011.03761.x
47. Angevaren M, Aufdemkampe G, Verhaar H, Aleman A, Vanhees L (2008) Physical activity and enhanced fitness to improve cognitive function in older people without known cognitive impairment. The Cochrane database of systematic reviews (2):CD005381. doi:10.1002/14651858.CD005381.pub2
48. Speelman A, van de Warrenburg B, van Nimwegen M, Petzinger G, Munneke M, Bloem B (2011) How might physical activity benefit patients with Parkinson disease? Nature reviews Neurology 7 (9):528-534. doi:10.1038/nrneurol.2011.107
138

49. Ellis T, Motl RW (2013) Physical activity behavior change in persons with neurologic disorders: overview and examples from Parkinson disease and multiple sclerosis. Journal of neurologic physical therapy : JNPT 37 (2):85-90. doi:10.1097/NPT.0b013e31829157c0
50. Larocca NG (2011) Impact of walking impairment in multiple sclerosis: perspectives of patients and care partners. The patient 4 (3):189-201. doi:10.2165/11591150-000000000-00000
51. Motl RW, Pilutti LA (2012) The benefits of exercise training in multiple sclerosis. Nature reviews Neurology 8 (9):487-497. doi:10.1038/nrneurol.2012.136
52. Quasthoff S, Hartung H (2002) Chemotherapy-induced peripheral neuropathy. J Neurol 249 (1):9-17. doi:10.1007/PL00007853
53. Leishear K, Boudreau RM, Studenski SA, Ferrucci L, Rosano C, de Rekeneire N, Houston DK, Kritchevsky SB, Schwartz AV, Vinik AI, Hogervorst E, Yaffe K, Harris TB, Newman AB, Strotmeyer ES (2012) Relationship between vitamin B12 and sensory and motor peripheral nerve function in older adults. J Am Geriatr Soc 60 (6):1057-1063. doi:10.1111/j.1532-5415.2012.03998.x
54. Leishear K, Ferrucci L, Lauretani F, Boudreau RM, Studenski SA, Rosano C, Abbate R, Gori AM, Corsi AM, Di Iorio A, Guralnik JM, Bandinelli S, Newman AB, Strotmeyer ES (2012) Vitamin B12 and homocysteine levels and 6-year change in peripheral nerve function and neurological signs. J Gerontol A Biol Sci Med Sci 67 (5):537-543. doi:10.1093/gerona/glr202
55. Fennelly J, Frank O, Baker H, Leevy CM (1964) Peripheral neuropathy of the aocoholic: Aetiological role of aneurin and other B-complex vitamins. British medical journal 2 (5420):1290-1292
56. Pollock M, Calder C, Allpress S (1977) Peripheral nerve abnormality in multiple sclerosis. Annals of Neurology 2 (1):41-48. doi:10.1002/ana.410020107
57. Wulff E, Wang A, Simpson D (2000) HIV-associated peripheral neuropathy: epidemiology, pathophysiology and treatment. Drugs 59 (6):1251-1260
58. Simpson D, Olney R (1992) Peripheral neuropathies associated with human immunodeficiency virus infection. Neurologic clinics 10 (3):685-711
59. Germaniskis L, Singer EJ (1995) HIV and peripheral neuropathy. Journal of the International Association of Physicians in AIDS Care 1 (6):30-33
60. Cornblath DR, McArthur JC (1988) Predominantly sensory neuropathy in patients with AIDS and AIDS-related complex. Neurology 38 (5):794-796
61. Pascuzzi R, Fleck J (1997) Acute peripheral neuropathy in adults. Guillain-Barre syndrome and related disorders. Neurologic clinics 15 (3):529-547
62. Järup L (2003) Hazards of heavy metal contamination. British Medical Bulletin 68:167-182
139

63. Ludolph AC, Spencer PS (1995) Toxic neuropathies and their treatment. Bailliere's clinical neurology 4 (3):505-527
64. Lolin Y (1989) Chronic neurological toxicity associated with exposure to volatile substances. Human toxicology 8 (4):293-300
65. McDermott M, Liu K, Greenland P, Criqui MH, Chan C, Pearce W, Schneider J, Ferrucci L, Celic L, Taylor L, Vonesh E, Martin G, Clark E (2004) Functional Decline in Peripheral Arterial Disease. JAMA 292 (4):453-461
66. McDermott M, Guralnik J, Albay M, Bandinelli S, Miniati B, Ferrucci L (2004) Impairments of Muscles and Nerves Associated with Peripheral Arterial Disease and Their Relationship with Lower Extremity Functioning: The InCHIANTI Study. J Am Geriatr Soc 52 (3):405-410. doi:10.1111/j.1532-5415.2004.52113.x
67. McDermott M, Greenland P, Liu K, Guralnik J, Criqui M, Dolan N, Chan C, Celic L, Pearce W, Schneider J, Sharma L, Clark E, Gibson D, Martin G (2001) Leg symptoms in peripheral arterial disease: Associated clinical characteristics and functional impairment. JAMA 286 (13):1599-1606. doi:10.1001/jama.286.13.1599
68. Dolan N, Liu K, Criqui M, Greenland P, Guralnik J, Chan C, Schneider J, Luna Mandapat A, Martin G, McDermott M (2002) Peripheral Artery Disease, Diabetes and Reduced Lower Extremity Functioning. Diabetes Care 25 (1):113-120
69. Fokkenrood HJ, Bendermacher BL, Lauret GJ, Willigendael EM, Prins MH, Teijink JA (2013) Supervised exercise therapy versus non-supervised exercise therapy for intermittent claudication. The Cochrane database of systematic reviews 8:CD005263. doi:10.1002/14651858.CD005263.pub3
70. Hamburg NM, Balady GJ (2011) Exercise rehabilitation in peripheral artery disease: functional impact and mechanisms of benefits. Circulation 123 (1):87-97. doi:10.1161/circulationaha.109.881888
71. Guidon M, McGee H (2013) Recruitment to clinical trials of exercise: challenges in the peripheral arterial disease population. Physiotherapy 99 (4):305-310. doi:10.1016/j.physio.2012.12.010
72. Fitzgerald P, Jankovic J (1989) Lower body parkinsonism: Evidence for vascular etiology. Movement Disorders 4 (3):249-260. doi:10.1002/mds.870040306
73. Tesfaye S, Chaturvedi N, Eaton S, Ward J, Manes C, Ionescu-Tirgoviste C, Witte D, Fuller J (2005) Vascular Risk Factors and Diabetic Neuropathy. The New England journal of medicine 352 (4):341-350
74. Ylitalo K, Sowers M, Heeringa S (2011) Peripheral vascular disease and peripheral neuropathy in individuals with cardiometabolic clustering and obesity: National Health and Nutrition Examination Survey 2001-2004. Diabetes Care 34 (7):1642-1647. doi:10.2337/dc10-2150
140

75. Tew G, Ouedraogo N, Nicolas G, Leftheriotis G, Copeland R, Abraham P (2012) Impaired somatosensation in patients with isolated proximal-without-distal exercise-related lower-limb ischemia. The Clinical journal of pain 28 (5):404-409. doi:10.1097/AJP.0b013e3182340c01
76. Klein CM (2008) Evaluation and management of autonomic nervous system disorders. Seminars in neurology 28 (2):195-204. doi:10.1055/s-2008-1062263
77. Maser RE, Mitchell BD, Vinik AI, Freeman R (2003) The association between cardiovascular autonomic neuropathy and mortality in individuals with diabetes: a meta-analysis. Diabetes Care 26 (6):1895-1901
78. Rathmann W, Ziegler D, Jahnke M, Haastert B, Gries F (1993) Mortality in diabetic patients with cardiovascular autonomic neuropathy. Diabetic medicine : a journal of the British Diabetic Association 10 (9):820-824
79. Astrup A, Tarnow L, Rossing P, Hansen B, Hilsted J, Parving H (2006) Cardiac autonomic neuropathy predicts cardiovascular morbidity and mortality in Type 1 diabetic patients with diabetic nephropathy. Diabetes Care 29 (2):334-339. doi:10.2337/diacare.29.02.06.dc05-1242
80. Vinik A, Maser R, Ziegler D (2011) Autonomic imbalance: prophet of doom or scope for hope? Diabetic medicine : a journal of the British Diabetic Association 28 (6):643-651. doi:10.1111/j.1464-5491.2010.03184.x
81. Vinik A, Ziegler D (2007) Diabetic Cardiovascular Autonomic Neuropathy. Circulation 115 (3):387-397. doi:10.1161/circulationaha.106.634949
82. Tesfaye S, Boulton A, Dyck P, Freeman R, Horowitz M, Kempler P, Lauria G, Malik RA, Spallone V, Vinik A, Bernardi L, Valensi P, Toronto Diabetic Neuropathy Expert G (2010) Diabetic neuropathies: update on definitions, diagnostic criteria, estimation of severity, and treatments. Diabetes Care 33 (10):2285-2293. doi:10.2337/dc10-1303
83. Nickel F, Seifert F, Lanz S, Maihofner C (2012) Mechanisms of neuropathic pain. European Neuropsychopharamcology (22):81-91
84. O'Connor A (2009) Neuropathic pain: quality-of-life impact, costs and cost effectiveness of therapy. PharmacoEconomics 27 (2):95-112. doi:10.2165/00019053-200927020-00002
85. Mold JW, Vesely SK, Keyl BA, Schenk JB, Roberts M (2004) The prevalence, predictors, and consequences of peripheral sensory neuropathy in older patients. The Journal of the American Board of Family Practice / American Board of Family Practice 17 (5):309-318
86. Martyn C, Hughes R (1997) Epidemiology of peripheral neuropathy. J Nerol Neruosurg Psychiatry 62:310-318
87. Hartemann A, Attal N, Bouhassira D, Dumont I, Gin H, Jeanne S, Said G, Richard JL, Working Group on the Diabetic Foot from the French-speaking Society of D (2011) Painful diabetic neuropathy: diagnosis and management. Diabetes & metabolism 37 (5):377-388. doi:10.1016/j.diabet.2011.06.003
141

88. Boulton A (2005) Management of diabetic peripheral neuropathy. Clinical Diabetes 23 (1):9-15. doi:10.2337/diaclin.23.1.9
89. Ward R, Boudreau R, Vinik A, Zivkovic S, Njajou O, Satterfield S, Harris T, Newman A, Strotmeyer E (2013) Reproducibility of peroneal motor nerve conduction measurement in older adults. Clinical neurophysiology : official journal of the International Federation of Clinical Neurophysiology 124 (3):603-609. doi:10.1016/j.clinph.2012.07.027
90. Gooch CL, Weimer LH (2007) The electrodiagnosis of neuropathy: basic principles and common pitfalls. Neurologic clinics 25 (1):1-28. doi:10.1016/j.ncl.2007.01.011
91. Koo Y, Cho C, Kim B (2012) Pitfalls in Using Electrophysiological Studies to Diagnose Neuromuscular Disorders. J Clin Neurol 8 (1):1-14. doi:10.3988/jcn.2012.8.1.1
92. Fisher MA (2005) Comparison of automated and manual F-wave latency measurements. Clinical neurophysiology : official journal of the International Federation of Clinical Neurophysiology 116 (2):264-269. doi:10.1016/j.clinph.2004.08.016
93. Pestronk A, Florence J, Levine T, Al-Lozi M, Lopate G, Miller T, Ramneantu I, Waheed W, Stambuk M (2004) Sensory exam with a quantitative tuning fork: rapid, sensitive and predictive of SNAP amplitude. Neurology 62 (3):461-464
94. George J, Twomey JA (1986) Causes of polyneuropathy in the elderly. Age and ageing 15 (4):247-249
95. Resnick H, Vinik A, Heimovitz H, Brancati F, Guralnik J (2001) Age 85+ years accelerates large-fiber peripheral nerve dysfunction and diabetes contributes even in the oldest-old: the Women's Health and Aging Study. J Gerontol A Biol Sci Med Sci 56 (1):M25-31
96. Cheng YJ, Gregg EW, Kahn HS, Williams DE, De Rekeneire N, Narayan KM (2006) Peripheral insensate neuropathy--a tall problem for US adults? Am J Epidemiol 164 (9):873-880. doi:10.1093/aje/kwj281
97. Tierney E, Thurman D, Beckles G, Cadwell B (2013) Association of statin use with peripheral neuropathy in the U.S. population 40 years of age or older. Journal of diabetes 5 (2):207-215. doi:10.1111/1753-0407.12013
98. Ylitalo K, Herman W, Harlow S (2013) Serial anthropometry predicts peripheral nerve dysfunction in a community cohort. Diabetes/metabolism research and reviews 29 (2):145-151. doi:10.1002/dmrr.2367
99. Baldereschi M, Inzitari M, Di Carlo A, Bovis F, Maggi S, Capurso A, Solfrizzi V, Panza F, Scafato E, Inzitari D (2013) Vascular factors predict polyneuropathy in a non-diabetic elderly population. Neurological sciences : official journal of the Italian Neurological Society and of the Italian Society of Clinical Neurophysiology 34 (6):955-962. doi:10.1007/s10072-012-1167-x
142

100. Otruba P, Kanovsky P, Hlustik P (2011) Treatment with statins and peripheral neuropathy: results of 36-months a prospective clinical and neurophysiological follow-up. Neuro endocrinology letters 32 (5):688-690
101. Davis TM, Yeap BB, Davis WA, Bruce DG (2008) Lipid-lowering therapy and peripheral sensory neuropathy in type 2 diabetes: the Fremantle Diabetes Study. Diabetologia 51 (4):562-566. doi:10.1007/s00125-007-0919-2
102. Qato D, Alexander G, Conti R, Johnson M, Schumm P, Lindau S (2008) Use of prescription and over-the-counter medications and dietary supplements among older adults in the united states. JAMA 300 (24):2867-2878. doi:10.1001/jama.2008.892
103. Dimitroulas T, Duarte RV, Behura A, Kitas GD, Raphael JH (2014) Neuropathic pain in osteoarthritis: A review of pathophysiological mechanisms and implications for treatment. Seminars in arthritis and rheumatism. doi:10.1016/j.semarthrit.2014.05.011
104. Ohtori S, Orita S, Yamashita M, Ishikawa T, Ito T, Shigemura T, Nishiyama H, Konno S, Ohta H, Takaso M, Inoue G, Eguchi Y, Ochiai N, Kishida S, Kuniyoshi K, Aoki Y, Arai G, Miyagi M, Kamoda H, Suzkuki M, Nakamura J, Furuya T, Kubota G, Sakuma Y, Oikawa Y, Suzuki M, Sasho T, Nakagawa K, Toyone T, Takahashi K (2012) Existence of a neuropathic pain component in patients with osteoarthritis of the knee. Yonsei medical journal 53 (4):801-805. doi:10.3349/ymj.2012.53.4.801
105. Adler A, Boyko E, HAhroni J, Stensel V, Forsberg R, Smith D (1997) Risk Factors for Diabetic Peripheral Sensory Neuropathy. Diabetes Care 20 (7):1162-1167
106. Stroke NIoNDa (2014) Peripheral Neuropathy Fact Sheet. Accessed May 14 2014
107. Beghi E, Monticelli M (1997) Diabetic polyneuropathy in the elderly. Prevalence and risk factors in two geographic areas of Italy. Italian General Practitioner Study Group (IGPSG). Acta neurologica Scandinavica 96 (4):223-228
108. Feldman EL, Stevens MJ, Thomas PK, Brown MB, Canal N, Greene DA (1994) A practical two-step quantitative clinical and electrophysiological assessment for the diagnosis and staging of diabetic neuropathy. Diabetes Care 17 (11):1281-1289
109. Bazzi C, Pagani C, Sorgato G, Albonico G, Fellin G, D'Amico G (1991) Uremic polyneuropathy: a clinical and electrophysiological study in 135 short- and long-term hemodialyzed patients. Clinical Nephrology 35 (4):176-181
110. Group DR (1995) The effect of intensive diabetes therapy on the development and progression of neuropathy. Ann Intern Med (38):869-880
111. Treede R, Jensen T, Campbell J, Cruccu G, Dostrovsky J, Griffin J, Hansson P, Hughes R, Nurmikko T, Serra J (2008) Neuropathic pain: Redefinition and a grading system for clinial and research purposes. Neurology 70 (18):1630-1635
143

112. Candrilli S, Davis K, Kan H, Lucero M, Rousculp M (2007) Prevalence and the associated burden of illness of symptoms of diabetic peripheral neuropathy and diabetic retinopathy. Journal of diabetes and its complications 21 (5):306-314. doi:10.1016/j.jdiacomp.2006.08.002
113. Barrett K (2011) Neurologic manifestations of acute and chronic renal disease. Continuum (Minneapolis, Minn) 17 (1 Neurologic Complications of Systematic Disease):45-55. doi:10.1212/01.con.0000394673.82619.24
114. White R, Proctor S (1997) Solvents and neurotoxicity. Lancet 349:1239-1243
115. Mueller M, Minor S, Sahrmann S, Schaaf J, Strube M (1994) Differences in the Gait Characteristics of Patients with Diabetes and Peripheral Neuropathy Compared with Age-Matched Controls. Physical Therapy 74 (4):299-308
116. Katoulis E, Ebdo-Parry M, Lanshammar H, Vileikyte L, Krlkarni J, Boulton A (1997) Gait Abnormalities in Diabetic Neuropathy. Diabetes Care 20 (12):1904-1907
117. Raspovic A (2013) Gait Characteristics of People with Diabetes-Related Peripheral Neuropathy, with and without a History of Ulceration. Gait & posture In Press
118. Brach J, Talkowiski J, Strotmeyer E, Newman A (2008) Diabetes Mellitus and Gait Dysfunction: Possible Explanitory Factors. Physical Therapy 88 (11):1365-1374
119. Deschamps K, Matricali GA, Roosen P, Nobels F, Tits J, Desloovere K, Bruyninckx H, Flour M, Deleu PA, Verhoeven W, Staes F (2013) Comparison of foot segmental mobility and coupling during gait between patients with diabetes mellitus with and without neuropathy and adults without diabetes. Clinical biomechanics 28 (7):813-819. doi:10.1016/j.clinbiomech.2013.06.008
120. Menz H, Lord S, St George R, Fitzpatrick R (2004) Walking stability and sensorimotor function in older people with diabetic peripheral neuropathy. Arch Phys Med Rehab 85 (2):245-252. doi:10.1016/j.apmr.2003.06.015
121. Andersen H (2012) Motor dysfunction in diabetes. Diabetes/metabolism research and reviews 28 Suppl 1:89-92. doi:10.1002/dmrr.2257
122. Tinetti M, Speechley M, Ginter S (1988) Risk Factors for Falls among Elderly Persons Living in the Community. The New England journal of medicine 319 (26):1701-1707. doi:doi:10.1056/NEJM198812293192604
123. Hausdorff JM, Edelberg HK, Mitchell S, Goldberger A, Wei J (1997) Increased Gait Unsteadiness in Community-Dwelling Elderly Fallers. Arch Phys Med Rehab 78 (March 1997):278-286
124. Hausdorff JM, Rios DA, Edelberg HK (2001) Gait variability and fall risk in community-living older adults: a 1-year prospective study. Arch Phys Med Rehab 82 (8):1050-1056. doi:10.1053/apmr.2001.24893
144

125. Özdirenç M, Biberoğlu S, Özcan A (2003) Evaluation of physical fitness in patients with Type 2 diabetes mellitus. Diabetes research and clinical practice 60 (3):171-176. doi:http://dx.doi.org/10.1016/S0168-8227(03)00064-0
126. Simonsick E, Newman A, Nevitt M, Kkritchevsky S, Ferrucci L, Guralnik J, Harris T (2001) Measuring Higher Level Physical Function in Well-Functioning Older Adults. J Gerontol A Biol Sci Med Sci M644-649
127. Vinik A, Maser R, Mitchell B, Freeman R (2003) Diabetic Autonomic Neuropathy. Diabetes Care 26 (5):1553-1579. doi:10.2337/diacare.26.5.1553
128. Baumert M, Lambert G, Dawood T, Lambert E, Esler M, McGrane M, Barton D, Sanders P, Nalivaiko E (2009) Short-term heart rate variability and cardiac norepinephrine spillover in patients with depression and panic disorder. American journal of physiology Heart and circulatory physiology 297 (2):H674-679. doi:10.1152/ajpheart.00236.2009
129. AU R, Paul Joseph K, Kannathal N, Lim C, Suri J (2006) Heart rate variability: A review. Medical & biological engineering & computing 44 (12):1031-1051. doi:10.1007/s11517-006-0119-0
130. Routledge F, Campbell T, McFetridge-Durdle J, Bacon S (2010) Improvements in heart rate variability with exercise therapy. The Canadian journal of cardiology 26 (6):303-312
131. Stein P, Domitrovich P, Hui N, Rautaharju P, Gottdiener J (2005) Sometimes higher heart rate variability is not better heart rate variability: results of graphical and nonlinear analyses. Journal of cardiovascular electrophysiology 16 (9):954-959. doi:10.1111/j.1540-8167.2005.40788.x
132. Vinik A (2002) Diagnosing Diabetic Autonomic Neuropathy. Medscape
133. Jouven X, Empana JP, Escolano S, Buyck JF, Tafflet M, Desnos M, Ducimetiere P (2009) Relation of heart rate at rest and long-term (>20 years) death rate in initially healthy middle-aged men. Am J Cardiol 103 (2):279-283. doi:10.1016/j.amjcard.2008.08.071
134. Floyd JS, Sitlani CM, Wiggins KL, Wallace E, Suchy-Dicey A, Abbasi SA, Carnethon MR, Siscovick DS, Sotoodehnia N, Heckbert SR, McKnight B, Rice KM, Psaty BM (2015) Variation in resting heart rate over 4 years and the risks of myocardial infarction and death among older adults. Heart 101 (2):132-138. doi:10.1136/heartjnl-2014-306046
135. Lonn EM, Rambihar S, Gao P, Custodis FF, Sliwa K, Teo KK, Yusuf S, Bohm M (2014) Heart rate is associated with increased risk of major cardiovascular events, cardiovascular and all-cause death in patients with stable chronic cardiovascular disease: an analysis of ONTARGET/TRANSCEND. Clinical research in cardiology : official journal of the German Cardiac Society 103 (2):149-159. doi:10.1007/s00392-013-0644-4
136. Nauman J, Janszky I, Vatten LJ, Wisloff U (2011) Temporal changes in resting heart rate and deaths from ischemic heart disease. JAMA 306 (23):2579-2587. doi:10.1001/jama.2011.1826
145

137. Fried LP, Borhani NO, Enright P, Furberg CD, Gardin JM, Kronmal RA, Kuller LH, Manolio TA, Mittelmark MB, Newman A, et al. (1991) The Cardiovascular Health Study: design and rationale. Annals of epidemiology 1 (3):263-276
138. Khan H, Kunutsor S, Kalogeropoulos A, Georgiopoulou V, Newman A, Harris T, Bibbins‐Domingo K, Kauhanen J, Gheorghiade M, Fonarow G, Kritchevsky S, Laukkanen J, Butler J (2015) Resting Heart Rate and Risk of Incident Heart Failure: Three Prospective Cohort Studies and a Systematic Meta‐Analysis. J Am Heart Assoc 4 (1). doi:10.1161/jaha.114.001364
139. van Zyl L, Hasegawa T, Nagata K (2008) Effects of antidepressant treatment on heart rate variability in major depression: A quantitative review. BioPsychoSocial Medicine 2 (1):12
140. Lauer M (2009) Autonomic function and prognosis. Cleveland Clinic journal of medicine 76 Suppl 2:S18-22. doi:10.3949/ccjm.76.s2.04
141. Cheng YJ, Lauer MS, Earnest CP, Church TS, Kampert JB, Gibbons LW, Blair SN (2003) Heart rate recovery following maximal exercise testing as a predictor of cardiovascular disease and all-cause mortality in men with diabetes. Diabetes Care 26 (7):2052-2057
142. Jouven X, Empana J, Schwartz P, Desnos M, Courbon D, Ducimetière P (2005) Heart-Rate Profile during Exercise as a Predictor of Sudden Death. The New England journal of medicine 352 (19):1951-1958. doi:doi:10.1056/NEJMoa043012
143. Schroeder E, Chambless L, Liao D, Prineas R, Evans G, Rosamond W, Heiss G (2005) Diabetes, glucose, insulin, and heart rate variability: the Atherosclerosis Risk in Communities (ARIC) study. Diabetes Care 28 (3):668-674
144. Banthia S, Bergner D, Chicos A, Ng J, Pelchovitz D, Subacius H, Kadish A, Goldberger J (2013) Detection of cardiovascular autonomic neuropathy using exercise testing in patients with type 2 diabetes mellitus. Journal of diabetes and its complications 27 (1):64-69. doi:10.1016/j.jdiacomp.2012.09.002
145. Duckworth W, Abraira C, Moritz T, Reda D, Emanuele N, Reaven PD, Zieve FJ, Marks J, Davis SN, Hayward R, Warren SR, Goldman S, McCarren M, Vitek ME, Henderson WG, Huang GD (2009) Glucose control and vascular complications in veterans with type 2 diabetes. The New England journal of medicine 360 (2):129-139. doi:10.1056/NEJMoa0808431
146. Pop-Busui R, Low P, Waberski B, Martin C, Albers J, Feldman E, Sommer C, Cleary P, Lachin J, Herman W (2009) Effects of prior intensive insulin therapy on cardiac autonomic nervous system function in type 1 diabetes mellitus: the Diabetes Control and Complications Trial/Epidemiology of Diabetes Interventions and Complications study (DCCT/EDIC). Circulation 119 (22):2886-2893. doi:10.1161/circulationaha.108.837369
147. LeRoith D, Fonseca V, Vinik A (2005) Metabolic memory in diabetes--focus on insulin. Diabetes/metabolism research and reviews 21 (2):85-90. doi:10.1002/dmrr.530
148. ACSM (2013) ACSM's Guidelines for Exercise Testing and Prescription. Ninth edn. American College of Sports Medicine,
146

149. Chodzko-Zajko WJ, Proctor DN, Fiatarone Singh MA, Minson CT, Nigg CR, Salem GJ, Skinner JS (2009) American College of Sports Medicine position stand. Exercise and physical activity for older adults. Med Sci Sports Exerc 41 (7):1510-1530. doi:10.1249/MSS.0b013e3181a0c95c
150. Sigal RJ, Kenny GP, Wasserman DH, Castaneda-Sceppa C, White RD (2006) Physical activity/exercise and type 2 diabetes: a consensus statement from the American Diabetes Association. Diabetes Care 29 (6):1433-1438. doi:10.2337/dc06-9910
151. Ivy JL (1987) The insulin-like effect of muscle contraction. Exercise and sport sciences reviews 15:29-51
152. Hambrecht R, Fiehn E, Weigl C, Gielen S, Hamann C, Kaiser R, Yu J, Adams V, Niebauer J, Schuler G (1998) Regular Physical Exercise Corrects Endothelial Dysfunction and Improves Exercise Capacity in Patients With Chronic Heart Failure. Circulation 98 (24):2709-2715. doi:10.1161/01.cir.98.24.2709
153. Gokce N, Vita JA, Bader DS, Sherman DL, Hunter LM, Holbrook M, O’Malley C, Keaney Jr JF, Balady GJ (2002) Effect of exercise on upper and lower extremity endothelial function in patients with coronary artery disease. Am J Cardiol 90 (2):124-127. doi:http://dx.doi.org/10.1016/S0002-9149(02)02433-5
154. Maiorana A, O’Driscoll G, Cheetham C, Dembo L, Stanton K, Goodman C, Taylor R, Green D (2001) The effect of combined aerobic and resistance exercise training on vascular function in type 2 diabetes. J Am Coll Cardiol 38 (3):860-866. doi:10.1016/S0735-1097(01)01439-5
155. Loprinzi P, Cardinal B, Crespo C, Brodowicz G, Andersen R, Sullivan E, Smit E (2013) Objectively measured physical activity and C-reactive protein: National Health and Nutrition Examination Survey 2003–2004. Scand J Med Sci Sports 23 (2):164-170. doi:10.1111/j.1600-0838.2011.01356.x
156. Loprinzi PD, Ramulu PY (2013) Objectively Measured Physical Activity and Inflammatory Markers Among US Adults With Diabetes: Implications for Attenuating Disease Progression. Mayo Clinic Proceedings 88 (9):942-951. doi:http://dx.doi.org/10.1016/j.mayocp.2013.05.015
157. van Sloten T, Savelberg H, Duimel-Peeters I, Meijer K, Henry R, Stehouwer C, Schaper N (2011) Peripheral neuropathy, decreased muscle strength and obesity are strongly associated with walking in persons with type 2 diabetes without manifest mobility limitations. Diabetes research and clinical practice 91 (1):32-39. doi:10.1016/j.diabres.2010.09.030
158. Loprinzi PD, Hager KK, Ramulu PY (2013) Physical activity, glycemic control, and diabetic peripheral neuropathy: A national sample. Journal of diabetes and its complications (0). doi:http://dx.doi.org/10.1016/j.jdiacomp.2013.08.008
159. Copeland J, Esliger D (2009) Accelerometer Assessment of Physical Activity in Active, Healthy Older Adults. J Aging Phys Act 17 (1):17-30
147

160. Kluding P, Pasnoor M, Singh R, Jernigan S, KFarmer K, Rucker J, Sharma N, Wright D (2012) The Effect of Exercise on Neuropathic Symptoms, Nerve Function, and Cutaneous Innervation in People with Diabetic Peripheral Neuropathy. Journal of diabetes and its complications 26:424-429
161. Balducci S, Iacobellis G, Parisi L, Di Biase N, Calandriello E, Leonetti F, Fallucca F (2006) Exercise training can modify the natural history of peripheral neuropathy. Journal of diabetes and its complications 20:216-223
162. Exercise and Type 2 Diabetes: American College of Sports Medicine and the American Diabetes Association: Joint Position Statement (2010). Med Sci Sports Exerc 42 (12):2282-2303 2210.1249/MSS.2280b2013e3181eeb2261c
163. Mueller M, Tuttle L, LeMaster J, Strube M, McGill J, Hastings M, Sinacore D (2013) Weight-Bearing Versus Nonweight-Bearing Exercise for Persons With Diabetes and Peripheral Neuropathy: A Randomized Controlled Trial. Arch Phys Med Rehab 94 (5):829-838. doi:http://dx.doi.org/10.1016/j.apmr.2012.12.015
164. Selagzi H, Buyukakilli B, Cimen B, Yilmaz N, Erdogan S (2008) Protective and therapeutic effects of swimming exercise training on diabetic peripheral neuropathy of streptozotocin-induced diabetic rats. Journal of endocrinological investigation 31 (11):971-978
165. English AW, Cucoranu D, Mulligan A, Sabatier M (2009) Treadmill training enhances axon regeneration in injured mouse peripheral nerves without increased loss of topographic specificity. The Journal of comparative neurology 517 (2):245-255. doi:10.1002/cne.22149
166. Udina E, Puigdemasa A, Navarro X (2011) Passive and active exercise improve regeneration and muscle reinnervation after peripheral nerve injury in the rat. Muscle & nerve 43 (4):500-509. doi:10.1002/mus.21912
167. Kim WS, Lee SU (2010) Harmful effect of land-based endurance exercise in rats with diabetic nerve. Med Sci Sports Exerc 42 (9):1625-1631. doi:10.1249/MSS.0b013e3181d58e09
168. Hautala AJ, Kiviniemi AM, Tulppo MP (2009) Individual responses to aerobic exercise: the role of the autonomic nervous system. Neuroscience and biobehavioral reviews 33 (2):107-115. doi:10.1016/j.neubiorev.2008.04.009
169. Hotta H, Uchida S (2010) Aging of the autonomic nervous system and possible improvements in autonomic activity using somatic afferent stimulation. Geriatrics & gerontology international 10:S127-S136. doi:10.1111/j.1447-0594.2010.00592.x
170. Pichot V, Roche F, Denis C, Garet M, Duverney D, Costes F, Barthelemy J (2005) Interval training in elderly men increases both heart rate variability and baroreflex activity. Clinical autonomic research : official journal of the Clinical Autonomic Research Society 15 (2):107-115. doi:10.1007/s10286-005-0251-1
148

171. Carnethon MR, Prineas RJ, Temprosa M, Zhang ZM, Uwaifo G, Molitch ME (2006) The association among autonomic nervous system function, incident diabetes, and intervention arm in the Diabetes Prevention Program. Diabetes Care 29 (4):914-919
172. Crandall J, Schade D, Ma Y, Fujimoto WY, Barrett-Connor E, Fowler S, Dagogo-Jack S, Andres R (2006) The influence of age on the effects of lifestyle modification and metformin in prevention of diabetes. J Gerontol A Biol Sci Med Sci 61 (10):1075-1081
173. Ryan D, Espeland M, Foster G, Haffner S, Hubbard V, Johnson K, Kahn S, Knowler W, Yanovski S (2003) Look AHEAD (Action for Health in Diabetes): design and methods for a clinical trial of weight loss for the prevention of cardiovascular disease in type 2 diabetes. Controlled clinical trials 24 (5):610-628
174. Ribisl P, Gaussoin S, Lang W, Bahnson J, Connelly S, Horton E, Jakicic J, Killean T, Kitzman D, Knowler W, Stewart K (2012) Lifestyle intervention improves heart rate recovery from exercise in adults with type 2 diabetes: results from the Look AHEAD study. Journal of obesity 2012:309196. doi:10.1155/2012/309196
175. Booth F, Laye M, Lees S, Rector R, Thyfault J (2008) Reduced physical activity and risk of chronic disease: the biology behind the consequences. Eur J Appl Physiol 102 (4):381-390. doi:10.1007/s00421-007-0606-5
176. Booth F, Gordon S, Carlson C, Hamilton M (2000) Waging war on modern chronic diseases: primary prevention through exercise biology. J Appl Physiol 88 (2):774-787
177. Bann D, Kuh D, Wills A, Adams J, Brage S, Cooper R (2014) Physical activity across adulthood in relation to fat and lean body mass in early old age: Findings from the medical research council National Survey of Health and Development, 1946-2010. Am J Epidemiol. doi:10.1093/aje/kwu033
178. Caspersen C, Powell K, Christenson G (1985) Physical activity, exercise, and physical fitness: definitions and distinctions for health-related research. Public health reports (Washington, DC : 1974) 100 (2):126-131
179. Services] USDoHaH (2008) 2008 Physical Activity Guidelines for Americans
180. Schutzer K, Graves B (2004) Barriers and motivations to exercise in older adults. Preventive medicine 39 (5):1056-1061. doi:10.1016/j.ypmed.2004.04.003
181. Cohen-Mansfield J, Marx M, Guralnik J (2003) Motivators and barriers to exercise in and older community-dwelling population. J Aging Phys Act 11:242-253
182. Griffiths RD, Hall JB (2010) Intensive care unit-acquired weakness. Critical care medicine 38 (3):779-787. doi:10.1097/CCM.0b013e3181cc4b53
183. Tucker J, Welk G, Beyler N (2011) Physical activity in U.S.: adults compliance with the Physical Activity Guidelines for Americans. American journal of preventive medicine 40 (4):454-461. doi:10.1016/j.amepre.2010.12.016
149

184. Brownson R, Boehmer T, Luke D (2005) Declining rates of physical activity in the United States: What are the contributors? Annual Review of Public Health 26 (1):421-443. doi:doi:10.1146/annurev.publhealth.26.021304.144437
185. Healy G, Dunstan D, Salmon J, Cerin E, Shaw JE, Zimmet P, Owen N (2008) Breaks in Sedentary Time: Beneficial associations with metabolic risk. Diabetes Care 31 (4):661-666. doi:10.2337/dc07-2046
186. Hamilton M, Healy G, Dunstan D, Zderic T, Owen N (2008) Too little exercise and too much sitting: Inactivity physiology and the need for new recommendations on sedentary behavior. Curr Cardiovasc Risk Rep 2 (4):292-298. doi:10.1007/s12170-008-0054-8
187. Kriska A (2000) Ethnic and cultural issues in assessing physical activity. Res Q Exerc Sport 71 (2 Suppl):S47-53
188. Schuit A, Schouten E, Westerterp K, Saris W (1997) Validity of the Physical Activity Scale for the Elderly (PASE): According to Energy Expenditure Assessed by the Doubly Labeled Water Method. J Clin Epidemiol:541-546
189. Stewart A, Mills K, King A, Haskell W, Gillis D, Ritter P (2001) CHAMPS Physical Activity Questionnaire for Older Adults: Outcomes for Interventions. Med Sci Sports Exerc 33 (7):1126-1141
190. Layne JE, Nelson ME (1999) The effects of progressive resistance training on bone density: a review. Med Sci Sports Exerc 31 (1):25-30
191. Schrack J, Zipunnikov V, Goldsmith J, Bai J, Simonsick E, Crainiceanu C, Ferrucci L (2014) Assessing the "physical cliff": detailed quantification of age-related differences in daily patterns of physical activity. J Gerontol A Biol Sci Med Sci 69 (8):973-979. doi:10.1093/gerona/glt199
192. Bai J, Goldsmith J, Caffo B, Glass T, Crainiceanu C (2012) Movelets: A dictionary of movement. Electronic journal of statistics 6:559-578. doi:10.1214/12-ejs684
193. He B, Bai J, Zipunnikov V, Koster A, Caserotti P, Lange-Maia B, Glynn N, Harris T, Crainiceanu C (2014) Predicting human movement with multiple accelerometers using movelets. Med Sci Sports Exerc 46 (9):1859-1866. doi:10.1249/mss.0000000000000285
194. Rodgers A, Ezzati M, Vander Hoorn S, Lopez A, Lin R, Murray C (2004) Distribution of major health risks: findings from the Global Burden of Disease study. PLoS medicine 1 (1):e27. doi:10.1371/journal.pmed.0010027
195. Bauman A, Reis R, Sallis J, Wells J, Loos R, Martin B (2012) Correlates of physical activity: why are some people physically active and others not? Lancet 380 (9838):258-271. doi:10.1016/s0140-6736(12)60735-1
150

196. Hallal PC, Andersen LB, Bull FC, Guthold R, Haskell W, Ekelund U (2012) Global physical activity levels: surveillance progress, pitfalls, and prospects. Lancet 380 (9838):247-257. doi:10.1016/s0140-6736(12)60646-1
197. Horton S, Baker J, Côté J, Deakin JM (2008) Understanding Seniors' Perceptions and Stereotypes of Aging. Educational Gerontology 34 (11):997-1017. doi:10.1080/03601270802042198
198. Bennett T, Gaines J (2010) Believing what you hear: The impact of aging stereotypes upon the old. Educational Gerontology 36 (5):435-445. doi:10.1080/03601270903212336
199. Keith J, Fry C, Glascock A, Ikels C, Dickerson-Putman J, Harpending H, Draper P (1994) Age, Health, and Functionality. The Aging Experience: Diversity and Commonality across Cultures. SAGE Publications, Inc., Thousand Oaks, CA. doi:doi: http://dx.doi.org/10.4135/9781452243382
200. Washburn R, Smith K, Jette A, Janney C (1993) The physical activity scale for the elderly (PASE): Development and evaluation. J Clin Epidemiol 46 (2):153-162. doi:http://dx.doi.org/10.1016/0895-4356(93)90053-4
201. Bonnefoy M, Normand S, Pachiaudi C, Lacour J, Laville M, Kostka T (2001) Simultaneous validation of ten physical activity questionnaires in older men: A doubly labeled water study. J Am Geriatr Soc:28-35
202. Taylor H, Jacobs Jr D, Schucker B, Knudsen J, Leon A, Debacker G (1978) A questionnaire for the assessment of leisure time physical activities. J Chronic Dis 31 (12):741-755. doi:http://dx.doi.org/10.1016/0021-9681(78)90058-9
203. Ainsworth B, Haskell W, Leon A (1993) Compendium of Physical Activities: Classification of Energy Costs of Human Physical Activities. Med Sci Sports Exerc:71-83
204. Brach J, Simonsick E, Kritchevsky S, Yaffe K, Newman A (2004) The Association Between Physical Function and Lifestyle Activity and Exercise in the Health, Aging, and Body Composition Study. J Am Geriatr Soc 52:502-509
205. Hall KS, Howe CA, Rana SR, Martin CL, Morey MC (2013) METs and accelerometry of walking in older adults: standard versus measured energy cost. Med Sci Sports Exerc 45 (3):574-582. doi:10.1249/MSS.0b013e318276c73c
206. Storti K, Pettee K, Brach J, Talkowiski J, Richardson C, Kriska A (2007) Gait Speed and Step-Count Monitor Accuracy in Community-Dwelling Older Adults. Med Sci Sports Exerc:59-64
207. Taraldsen K, Askim T, Sletvold O, Einarsen E, Bjastad K, Indredavik B, Helbostad J (2011) Evaluation of a body-worn sensor system to measure physical activity in older people with impaired function. Phys Ther 91 (2):277-285. doi:10.2522/ptj.20100159
151

208. Tudor-Locke C, Williams J, Reis J, Pluto D (2002) Utility of pedometers for assessing physical activity: convergent validity. Sports medicine (Auckland, NZ) 32 (12):795-808
209. BodyMedia I (2010) SenseWear Armband and Display Manual. Pittsburgh, PA
210. Mackey D, Manini T, Schoeller D, Koster A, Glynn N, Goodpaster B, Satterfield S, Newman A, Harris T, Cummings S (2011) Validation of an Armband to Measure Daily Energy Expenditure in Older Adults. J Gerontol A Biol Sci Med Sci:1108-1113
211. St-Onge M, Mignault D, Allison D, Rabasa-Lhoret R (2007) Evaluation of a portable device to measure daily energy expenditure in free-living adults. Am J Clin Nutr 85 (3):742-749
212. Schoeller D, Ravussin E, Schutz Y, Acheson K, Baertschi P, Jequier E (1986) Energy Expenditure by Doubly Labeled Water: Validation in Humans and Proposed Calculation. Am J Physiol:R823-830
213. Colberg S, Swain D, Vinik A (2003) Use of heart rate reserve and rating of perceived exertion to prescribe exercise intensity in diabetic autonomic neuropathy. Diabetes Care 26 (4):986-990
214. Simonsick E, Fan E, Fleg J (2005) Estimating Cardiorespiratory Fitness in Well-Functioning Older Adults: Treadmill Validation of the Long Distance Corridor Walk. J Am Geriatr Soc:127-132
215. Ward R, Boudreau R, Caserotti P, Harris T, Zivkovic S, Goodpaster B, Satterfield S, Kritchevesky S, Schwartz A, Vinik A, Cauley J, Newman A, Strotmeyer E (2014) Sensory and Motor Peripheral Nerve Function and Longitudinal Quadriceps Strength. J Am Geriatr Soc In Press
216. Ward RE, Boudreau RM, Caserotti P, Harris T, Zivkovic SA, Goodpaster B, Satterfield S, Kritchevesky S, Schwartz AV, Vinik A, Cauley J, Simonsick EM, Newman AB, Strotmeyer ES (2014: In Press) Sensory and Motor Peripheral Nerve Function and Incident Mobility Disability. J Am Geriatr Soc
217. Orwoll E, Blank J, Barrett-Connor E, Cauley J, Cummings S, Ensrud K, Lewis C, Cawthon P, Marcus R, Marshall L, McGowan J, Phipps K, Sherman S, Stefanick M, Stone K (2005) Design and baseline characteristics of the osteoporotic fractures in men (MrOS) study — A large observational study of the determinants of fracture in older men. Contemporary Clinical Trials 26 (5):569-585. doi:http://dx.doi.org/10.1016/j.cct.2005.05.006
218. Blank J, Cawthon P, Carrion-Petersen M, Harper L, Johnson J, Mitson E, Delay R (2005) Overview of recruitment for the osteoporotic fractures in men study (MrOS). Contemporary Clinical Trials 26 (5):557-568. doi:http://dx.doi.org/10.1016/j.cct.2005.05.005
219. Washburn R, Ficker J (1999) Physical Activity Scale for the Elderly (PASE): the relationship with activity measured by a portable accelerometer. The Journal of sports medicine and physical fitness 39 (4):336-340
152

220. Harada N, Chiu V, King A, Stewart A (2001) An evaluation of three self-report physical activity instruments for older adults. Med Sci Sports Exerc 33 (6):962-970
221. Washburn R, McAuley E, Katula J, Mihalko S, Boileau R (1999) The Physical Activity Scale for the Elderly (PASE): Evidence for Validity. J Clin Epidemiol 52 (7):643-651. doi:http://dx.doi.org/10.1016/S0895-4356(99)00049-9
222. Dinger MK, Oman RF, Taylor EL, Vesely SK, Able J (2004) Stability and convergent validity of the Physical Activity Scale for the Elderly (PASE). The Journal of sports medicine and physical fitness 44 (2):186-192
223. Janney C, Cauley J, Cawthon P, Kriska A, for the Osteoporotic Fractures in Men Study G (2010) Longitudinal Physical Activity Changes in Older Men in the Osteoporotic Fractures in Men Study. J Am Geriatr Soc 58 (6):1128-1133. doi:10.1111/j.1532-5415.2010.02861.x
224. Jakicic JM, Marcus M, Gallagher KI, Randall C, Thomas E, Goss FL, Robertson RJ (2004) Evaluation of the SenseWear Pro Armband to assess energy expenditure during exercise. Med Sci Sports Exerc 36 (5):897-904
225. Cawthon P, Blackwell T, Cauley J, Ensrud K, Dam T, Harrison S, Peters K, Mackey D (2013) Objective assessment of activity, energy expenditure, and functional limitations in older men: the Osteoporotic Fractures in Men study. J Gerontol A Biol Sci Med Sci 68 (12):1518-1524. doi:10.1093/gerona/glt054
226. Diagnosis and classification of diabetes mellitus (2013). Diabetes Care 36 Suppl 1:S67-74. doi:10.2337/dc13-S067
227. Aboyans V, Criqui M, Abraham P, Allison M, Creager M, Diehm C, Fowkes F, Hiatt W, Jonsson B, Lacroix P, Marin B, McDermott M, Norgren L, Pande R, Preux P, Stoffers H, Treat-Jacobson D (2012) Measurement and interpretation of the ankle-brachial index: a scientific statement from the American Heart Association. Circulation 126 (24):2890-2909. doi:10.1161/CIR.0b013e318276fbcb
228. Teng E, Chui H (1987) The Modified Mini-Mental State (3MS) examination. J Clin Psychiatry 48 (8):314-318
229. Yesavage J, Brink T, Rose T, Lum O, Huang V, Adey M, Leirer V (1982) Development and validation of a geriatric depression screening scale: A preliminary report. J Psychiatr Res 17 (1):37-49. doi:http://dx.doi.org/10.1016/0022-3956(82)90033-4
230. Ward R, Caserotti P, Faulkner K, Boudreau R, Zivkovic S, Lee C, Goodpaster B, Cawthon P, Newman A, Cauley J, Strotmeyer E (2014) Peripheral nerve function and lower extremity muscle power in older men. Arch Phys Med Rehabil 95 (4):726-733. doi:10.1016/j.apmr.2013.11.018
231. Mallik A, Weir AI (2005) Nerve conduction studies: essentials and pitfalls in practice. J Neurol Neurosurg Psychiatry 76 Suppl 2:ii23-31. doi:10.1136/jnnp.2005.069138
153

232. Lauretani F, Bandinelli S, Bartali B, Di Iorio A, Giacomini V, Corsi AM, Guralnik JM, Ferrucci L (2006) Axonal degeneration affects muscle density in older men and women. Neurobiology of aging 27 (8):1145-1154. doi:10.1016/j.neurobiolaging.2005.06.009
233. Tudor-Locke C, Myers A (2001) Challenges and opportunities for measuring physical activity in sedentary adults. Sports medicine (Auckland, NZ) 31 (2):91-100
234. Pruitt LA, Glynn NW, King AC, Guralnik JM, Aiken EK, Miller G, Haskell WL (2008) Use of accelerometry to measure physical activity in older adults at risk for mobility disability. J Aging Phys Act 16 (4):416-434
235. Gorman E, Hanson HM, Yang PH, Khan KM, Liu-Ambrose T, Ashe MC (2014) Accelerometry analysis of physical activity and sedentary behavior in older adults: a systematic review and data analysis. European Review of Aging and Physical Activity 11 (1):35-49. doi:10.1007/s11556-013-0132-x
236. Evenson KR, Buchner DM, Morland KB (2012) Objective measurement of physical activity and sedentary behavior among US adults aged 60 years or older. Preventing chronic disease 9:E26
237. Kluding P, Pasnoor M, Singh R, Jernigan S, Farmer K, Rucker J, Sharma N, Wright D (2012) The effect of exercise on neuropathic symptoms, nerve function, and cutaneous innervation in people with diabetic peripheral neuropathy. Journal of diabetes and its complications 26 (5):424-429. doi:http://dx.doi.org/10.1016/j.jdiacomp.2012.05.007
238. Kanade RV, Deursen RWM, Harding K, Price P (2006) Walking performance in people with diabetic neuropathy: benefits and threats. Diabetologia 49 (8):1747-1754. doi:10.1007/s00125-006-0309-1
239. Simonsick E, Montgomery P, Newman A, Bauer D, Harris T (2001) Measuring Fitness in Healthy Older Adults: The Health ABC Long Distance Corridor Walk. J Am Geriatr Soc 49:1544-1548
240. Maser RE, Nielsen VK, Dorman JS, Drash AL, Becker DJ, Orchard TJ (1991) Measuring subclinical neuropathy: does it relate to clinical neuropathy? Pittsburgh epidemiology of diabetes complications study-V. The Journal of diabetic complications 5 (1):6-12
241. Shlipak M, Wassel Fyr C, Chertow G, Harris T, Kritchevsky S, Tylavsky F, Satterfield S, Cummings S, Newman A, Fried L (2006) Cystatin C and mortality risk in the elderly: the health, aging, and body composition study. Journal of the American Society of Nephrology : JASN 17 (1):254-261. doi:10.1681/asn.2005050545
242. Radloff L (1977) The CES-D Scale: A Self-Report Depression Scale for Research in the General Population. Appl Psychol Meas 1 (3):385-401. doi:10.1177/014662167700100306
243. Wechsler Adult Intelligence Scale—Revised (1981). Psychological Corporation, San Antonio, TX
154

244. Teng E, Chui H (1987) The Modified Mini-Mental State (3MS) Examination. J Clin Psychiatry 48 (8):314-318
245. Buchman AS, Wilson RS, Leurgans S, Bennett DA (2009) Vibratory thresholds and mobility in older persons. Muscle & nerve 39 (6):754-760. doi:10.1002/mus.21263
246. Rejeski W, Axtell R, Fielding R, Katula J, King A, Manini T, Marsh A, Pahor M, Rego A, Tudor-Locke C, Newman M, Walkup M, Miller M (2013) Promoting Physical Activity for Elders with Compromised Function: The Lifestyle Interventions and Independence for Elders (LIFE) Study Physical Activity Intervention. Clin Interv Aging 8:1119-1131
247. Strotmeyer E, Arnold A, Boudreau R, Ives D, Cushman M, Robbins J, Harris T, Newman A (2010) Long-term retention of older adults in the Cardiovascular Health Study: implications for studies of the oldest old. J Am Geriatr Soc 58 (4):696-701. doi:10.1111/j.1532-5415.2010.02770.x
248. Cowen T, Ulfhake B, King R (2005) Aging in the Peripheral Nervous System. In: Dyck P, Thomas P (eds) Peripheral Neuropathy, vol 1. 4 edn. Elsevier Saunders, Philadelphia, PA,
249. Algra A, Tijssen JG, Roelandt JR, Pool J, Lubsen J (1993) Heart rate variability from 24-hour electrocardiography and the 2-year risk for sudden death. Circulation 88 (1):180-185. doi:10.1161/01.cir.88.1.180
250. Chang M, Havlik RJ, Corti MC, Chaves PH, Fried LP, Guralnik JM (2003) Relation of heart rate at rest and mortality in the Women's Health and Aging Study. Am J Cardiol 92 (11):1294-1299
251. Finucane C, O'Connell MD, Fan CW, Savva GM, Soraghan CJ, Nolan H, Cronin H, Kenny RA (2014) Age Related Normative Changes in Phasic Orthostatic Blood Pressure in a Large Population Study: Findings from the Irish Longitudinal Study on Ageing (TILDA). Circulation. doi:10.1161/circulationaha.114.009831
252. Boulton AJM, Vinik AI, Arezzo JC, Bril V, Feldman EL, Freeman R, Malik RA, Maser RE, Sosenko JM, Ziegler D (2005) Diabetic Neuropathies: A statement by the American Diabetes Association. Diabetes Care 28 (4):956-962. doi:10.2337/diacare.28.4.956
253. Motataianu A, Balasa R, Voidazan S, Baijko Z (2013) Cardiovascular Autonomic Neuropathy in Context of Other Complications of Type 2 Diabetes Mellitus. BioMed Research International 2013:8. doi:10.1155/2013/507216
254. Vinik AI, Strotmeyer ES, Nakave AA, Patel CV (2008) “Diabetic Neuropathy in Older Adults”. Clinics in geriatric medicine 24 (3):407-v. doi:10.1016/j.cger.2008.03.011
255. Huijberts MS, Schaper NC, Schalkwijk CG (2008) Advanced glycation end products and diabetic foot disease. Diabetes/metabolism research and reviews 24 Suppl 1:S19-24. doi:10.1002/dmrr.861
155

256. Brownlee M (1992) Glycation products and the pathogenesis of diabetic complications. Diabetes Care 15 (12):1835-1843
257. Rong LL, Yan SF, Wendt T, Hans D, Pachydaki S, Bucciarelli LG, Adebayo A, Qu W, Lu Y, Kostov K, Lalla E, Yan SD, Gooch C, Szabolcs M, Trojaborg W, Hays AP, Schmidt AM (2004) RAGE modulates peripheral nerve regeneration via recruitment of both inflammatory and axonal outgrowth pathways. FASEB journal : official publication of the Federation of American Societies for Experimental Biology 18 (15):1818-1825. doi:10.1096/fj.04-1900com
258. Rong LL, Gooch C, Szabolcs M, Herold KC, Lalla E, Hays AP, Yan SF, Yan SS, Schmidt AM (2005) RAGE: a journey from the complications of diabetes to disorders of the nervous system - striking a fine balance between injury and repair. Restorative neurology and neuroscience 23 (5-6):355-365
259. Wiggin TD, Sullivan KA, Pop-Busui R, Amato A, Sima AAF, Feldman EL (2009) Elevated Triglycerides Correlate With Progression of Diabetic Neuropathy. Diabetes 58 (7):1634-1640. doi:10.2337/db08-1771
260. Valensi P, Paries J, Attali JR (2003) Cardiac autonomic neuropathy in diabetic patients: influence of diabetes duration, obesity, and microangiopathic complications--the French multicenter study. Metabolism 52 (7):815-820
261. Elliott J, Tesfaye S, Chaturvedi N, Gandhi RA, Stevens LK, Emery C, Fuller JH (2009) Large-fiber dysfunction in diabetic peripheral neuropathy is predicted by cardiovascular risk factors. Diabetes Care 32 (10):1896-1900. doi:10.2337/dc09-0554
262. The effect of intensive diabetes therapy on measures of autonomic nervous system function in the Diabetes Control and Complications Trial (DCCT) (1998). Diabetologia 41 (4):416-423
263. Young LH, Wackers FJ, Chyun DA, Davey JA, Barrett EJ, Taillefer R, Heller GV, Iskandrian AE, Wittlin SD, Filipchuk N, Ratner RE, Inzucchi SE (2009) Cardiac outcomes after screening for asymptomatic coronary artery disease in patients with type 2 diabetes: the DIAD study: a randomized controlled trial. JAMA 301 (15):1547-1555. doi:10.1001/jama.2009.476
264. Brownrigg JR, de Lusignan S, McGovern A, Hughes C, Thompson MM, Ray KK, Hinchliffe RJ (2014) Peripheral neuropathy and the risk of cardiovascular events in type 2 diabetes mellitus. Heart 100 (23):1837-1843. doi:10.1136/heartjnl-2014-305657
265. Bilal N, Erdogan M, Ozbek M, Cetinkalp S, Karadeniz M, Ozgen AG, Saygili F, Yilmaz C, Tuzun M, Kabalak T (2008) Increasing severity of cardiac autonomic neuropathy is associated with increasing prevalence of nephropathy, retinopathy, and peripheral neuropathy in Turkish type 2 diabetics. Journal of diabetes and its complications 22 (3):181-185. doi:10.1016/j.jdiacomp.2006.12.003
266. Lange-Maia B, Newman A, Cauley J, Boudreau R, Caserotti P, Glynn N, Harris T, Kritchevesky S, Schwartz A, Satterfield S, Simonsick E, Vinik A, Zivkovic S, Strotmeyer E (In Preparation) Sensorimotor peripheral nerve function and the longitudinal relationship with endurance walking in the Health, Aging, and Body Composition Study.
156

267. Freeman R, Wieling W, Axelrod FB, Benditt DG, Benarroch E, Biaggioni I, Cheshire WP, Chelimsky T, Cortelli P, Gibbons CH, Goldstein DS, Hainsworth R, Hilz MJ, Jacob G, Kaufmann H, Jordan J, Lipsitz LA, Levine BD, Low PA, Mathias C, Raj SR, Robertson D, Sandroni P, Schatz I, Schondorff R, Stewart JM, van Dijk JG (2011) Consensus statement on the definition of orthostatic hypotension, neurally mediated syncope and the postural tachycardia syndrome. Clinical autonomic research : official journal of the Clinical Autonomic Research Society 21 (2):69-72. doi:10.1007/s10286-011-0119-5
268. Newman A, Simonsick E, Naydeck B, Boudreau R, Kritchevsky S, Nevitt M, Pahor M, Satterfield S, Brach J, Studenski S, Harris T (2006) Association of Long-Distance Corridor Walk Performance with Mortality, Cardiovascular Disease, Mobility Limitation, and Disability. JAMA 295 (17):2018-2026
269. Simonsick EM, Fan E, Fleg JL (2006) Estimating cardiorespiratory fitness in well-functioning older adults: treadmill validation of the long distance corridor walk. J Am Geriatr Soc 54 (1):127-132. doi:10.1111/j.1532-5415.2005.00530.x
270. Robinson LR, Rubner DE, Wahl PW, Fujimoto WY, Stolov WC (1993) Influences of height and gender on normal nerve conduction studies. Arch Phys Med Rehabil 74 (11):1134-1138
271. Huikuri HV, Pikkuja¨msa¨ SM, Airaksinen KEJ, Ika¨heimo MJ, Rantala AO, Kauma H, Lilja M, Kesa¨niemi YA (1996) Sex-Related Differences in Autonomic Modulation of Heart Rate in Middle-aged Subjects. Circulation 94 (2):122-125. doi:10.1161/01.cir.94.2.122
272. Binder EF, Birge SJ, Spina R, Ehsani AA, Brown M, Sinacore DR, Kohrt WM (1999) Peak aerobic power is an important component of physical performance in older women. J Gerontol Ser A-Biol Sci Med Sci 54 (7):M353-M356. doi:10.1093/gerona/54.7.M353
273. Arnett SW, Laity JH, Agrawal SK, Cress ME (2008) Aerobic reserve and physical functional performance in older adults. Age and ageing 37 (4):384-389. doi:10.1093/ageing/afn022
274. Newman AB, Simonsick EM, Naydeck BL, Boudreau RM, Kritchevsky SB, Nevitt MC, Pahor M, Satterfield S, Brach JS, Studenski SA, Harris TB (2006) Association of long-distance corridor walk performance with mortality, cardiovascular disease, mobility limitation, and disability. JAMA 295 (17):2018-2026. doi:10.1001/jama.295.17.2018
275. Lange-Maia B, Strotmeyer E, Harris T, Glynn N, Simonsick E, Brach J, Cauley J, Richey P, Schwartz A, Newman A (In Press, 2015) Physical Activity and Change in Long Distance Corridor Walk Performance in the Health, Aging and Body Composition Study. J Am Geriatr Soc
276. Bilal N, Erdogan M, Ozbek M, Cetinkalp S, Karadeniz M, Ozgen A, Saygili F, Yilmaz C, Tuzun M, Kabalak T (2008) Increasing severity of cardiac autonomic neuropathy is associated with increasing prevalence of nephropathy, retinopathy, and peripheral neuropathy in Turkish type 2 diabetics. Journal of diabetes and its complications 22 (3):181-185. doi:10.1016/j.jdiacomp.2006.12.003
157

277. Xue Q-L, Bandeen-Roche K, Mielenz TJ, Seplaki CL, Szanton SL, Thorpe RJ, Kalyani RR, Chaves PHM, Dam T-TL, Ornstein K, RoyChoudhury A, Varadhan R, Yao W, Fried LP (2012) Patterns of 12-Year Change in Physical Activity Levels in Community-Dwelling Older Women: Can Modest Levels of Physical Activity Help Older Women Live Longer? American Journal of Epidemiology 176 (6):534-543. doi:10.1093/aje/kws125
278. Soares-Miranda L, Sandercock G, Vale S, Santos R, Abreu S, Moreira C, Mota J (2012) Metabolic syndrome, physical activity and cardiac autonomic function. Diabetes/metabolism research and reviews 28 (4):363-369. doi:10.1002/dmrr.2281
279. Bull FC, Bauman AE (2011) Physical inactivity: the "Cinderella" risk factor for noncommunicable disease prevention. Journal of health communication 16 Suppl 2:13-26. doi:10.1080/10810730.2011.601226
280. Centers for Disease Control and P (2013) The State of Aging and Health in America 2013. Centers for Disease Control and Prevention, US Dept of Health and Human Services, Atlanta, GA
158