peripheral challenge by small and medium sized ports (smps ... · abstract this paper focuses on...
TRANSCRIPT

POLISH MARITIME RESEARCH Special Issue 2013 SI (79) 2013 Vol 20; pp. 55-6610.2478/pomr-2013-0027
Peripheral challenge by Small and Medium Sized Ports (SMPs) in M ulti-Port Gateway
Regions: the case study of northeast of China
Lin F en g , Ph.D., Lecturer Dalian Maritime University, China T h eo N o tteb oom , Ph.D., Professor and President ITM M A- University of Antwerp, Belgium
ABSTRACT
This paper focuses on the role o f small and medium-sized ports (SMPs) in enhancing the competitiveness and logistics performance o f multi-port gateway regions and associated inland logistics systems. The concepts developed will be applied to the ports in the northeast o f China, a multi-port gateway region around the Bohai Sea Economic Rim (BER). Port competition is analyzed by multi-variable methodology>
and generalized common characteristics o f SMPs compared to gateway ports, and the similarities o f SMPs and SMEs are also compared. Later in this paper, we analyze the role o f a SMP in such region in different variables: (a) cargo volume and market share; (b) international connectivity; (c) relative cluster position; (d) port city and hinterland connection; and (e) logistics and distribution function. The five-dimension analysis com bined with in-depth cases study o f typical Yingkou port describes a profile o f SMPs in the
BER and provides future study possibility for more SMPs cases worldwide.
Key words: SMPs; BER; Small and medium sized enterprises (SMEs)
1. INTRODUCTION
The new economic background characterized by slower economic growth and highly volatile demand for international trade provides new opportunities for small and m edium sized ports (SMPs) that often are very responsive in dealing with supply chain dynamics and related logistics systems. However, there is no academic work on how SMPs grow and compete in multi-port gateway regions, a concept introduced by Notteboom (2009; 2010). This paper mainly deals with how SMPs can survive and become competitive in multi-port gateway regions by introducing the case study of the northeast o f China.
Defining SMPs demands a multifaceted approach. Often, the scale or size o f a port is measured by the single variable o f the cargo throughput. Thus, small ports usually refer to ports with a total cargo throughput (volume) below a certain threshold value. Feng and Notteboom (2011) defined SMPs by proposing a seven-dimension method which takes into account the port’s competitive position in its port cluster region, and the position is mainly reflected in the following seven aspects: (a) volume/market share, (b) international connectivity, (c) relative cluster position, (d) hinterland capture area, (e) Gross Domestic Product (GDP) o f the port city, (f) GDP o f the hinterland, and (g) logistics and distribution function. This definition will further apply into this paper in describing port competition mechanism in the northeast o f China. But in this paper, we consolidate the variables into five perspectives to
avoid the overlapping o f the indicators: (a) cargo volume and market share; (b) international connectivity; (c) relative cluster position; (d) port city and hinterland connection; (e) logistics and distribution function. This multi-variable method is to provide a complete picture how SMPs survive and compete in a multi-port gateway region. The determents o f (a), (b) and (c) stress the SMPs’ role in ports competition and the main focus is on the investigation o f competition dynamics between SMPs and big ports. The variables o f (d) and (e) will study how SMP s connect with and exert economic impact on the hinterland. The last variable is put SMPs in a logistics system to assess their potential and competitiveness, especially from the perspective o f the inland port and intermodality. Veldman and Btickmann (2003) developed a model on container port competition and port choice in the Antwerp-Hamburg range. The study excluded the ports o f Amsterdam and Zeebrugge due to their smaller market share. In recent models on port system development, SMPs are seen to be instrumental to the ‘'‘peripheral port challenge” (and thus port system déconcentration, see e.g. Slack and Wang, 2002 and Notteboom, 2005). Moreover, SMPs also function more in “port regionalization” processes (Notteboom and Rodrigue, 2005) and are key to the formation o f “multi- port gateway regions” (Notteboom, 2010) characterized by routing flexibility and inter-port competition and coordination. In contrast to bigger ports, small ports show a slightly larger variance in growth rate (Ding, 2005). SMPs develop in an independent way, which requires ports to find their specific competitive advantage, or in a cooperative way, which seeks
P O L IS H M A R IT IM E R E S E A R C H , Special Issue 2013 S1 55

Peripheral challenge by Small and Medium Sized Ports (SMPs) in Multi-Port Gateway Regions:the case study o f northeast o f China
cooperation with neighboring bigger ports o f the same multi- port gateway region. Firstly, SMPs’ strategies can focus on the hinterland connections in competition with bigger ports. Feng and Notteboom (2011) studied the empirical case ofYingkou port in the logistics system o f the Bohai Sea of China, which puts Yingkou port into a more competitive position in contrast to dominant ports in such area. Secondly, SMPs often look for a cost advantage in specific niche markets. Clark et al. (2001) demonstrated how small ports could compete with big ports in specialized markets. Thirdly, SMPs might also secure growth by serving the dominant ports in the multi-port gateway region. Such a strategy demands close cooperation between ports.
The dimensions for SMPs are similar to how we define SMEs. Although different countries have specific definitions on conceptualizing SMEs, certain criteria exist in the following aspects: SMEs by growth and motivation in more traditional categories such as size, market sector or business-to-business or business-to-consumer E-commerce proved to be appropriate for both firms in traditional industries and e-commerce.• Employment: European Union categorizes companies with
fewer than 10 employees as "micro", those with fewer than 50 employees as "small", and those with fewer than 250 as ‘‘medium”. Successful SMEs place greater emphasis on soft issues (people) than hard issues (technology and structure). The management skills and concepts o f the founders are deemed much more important than their technical skills. Employee skills are o f crucial concern and can be most effectively developed in a nurturing working environment. Nevertheless the impact of business founders on organizational success remains the leading factor.
• Organizational structure: compared to large enterprises, most SMEs have simplified organization structure, even without clear labor division in order to decrease human cost and more flexible strategy adoption.
• Percentage o f all production factors in total product cost (or product price): usually, production factors o f SMEs are more localized with high marginal cost. Among the production factors, the weight of technology innovation is comparatively low while labor costs and marketing costs are high.
• Niche market: SMEs are in subordinating position o f an industrial chain dominated by big firms and most SMEs engage in perfectly competitive market with low entry barrier. Some SMEs can be competitive in niche market.
When comparing SMEs and SMPs, the benchmarking ground should also be paid attention to. SMEs are defined more generally covering all industries and all forms of firms, thus it’s similar to how we define SMPs. Flowever, SMPs are specifically referred to ports industry. If we look at how a port is organized, we may find there are two forms; either a small port composed o f small and big companies or a big port combined with small companies. Therefore, analyzing SMPs in a big port is more prone to referring to the SMEs cluster while SMPs of a small port are more like individual SME. Currently, globally SMEs account for 99% of business numbers and 40% to 50% o f GDP, while in port industry, big ports contribute more to the global freight.
There are several reasons why the role o f SMPs in multi- port gateway regions might be somewhat overlooked. First, most SMPs have a close connection with the local port city and the direct hinterland. This implies that the supply chain perspective o f SMPs is often wrongly considered as only of local importance. Second, large ports are often facing a more visible array of local constraints that impair their growth and efficiency (Notteboom and Rodrigue, 2005). Most SMPs
typically have easier access to the (local) inland ports or relevant logistics system. The development issues in SMPs receive far less attention in the specialized press and therefore might seem less pressing. Traditionally, SMPs are regarded as being in a disadvantageous position compared to large ports in terms o f the available resources supporting their development. Flowever, we argue that most SMPs play an indispensable role in the development of multi-port gateway regions around the world. The development of SMPs depends on either location advantages or their contribution in improving the logistics network o f the multi-port gateway region. As SMPs typically have a smaller scale, they are often more agile and flexible in dealing with new market-based challenges, e.g. by redefining the strategic mission o f the port toward a specialized/niche port complementing the wider multi-port gateway region. There are several reasons why the role o f SMPs in multi-port gateway regions might be somewhat overlooked. First, most SMPs have a close connection with the local port city and the direct hinterland. This implies that the supply chain perspective of SMPs is often wrongly considered as only o f local importance. Second, large ports are often facing a more visible array o f local constraints that impair their growth and efficiency (Notteboom and Rodrigue, 2005). Most SMPs typically have easier access to the (local) inland ports or relevant logistics system. The development issues in SMPs receive far less attention in the specialized press and even might be ignored. Traditionally, SMPs are regarded as ones in a disadvantageous position compared to large ports in terms o f the available resources supporting their development. Flowever, we argue that most SMPs play an indispensable role in the development of multi- port gateway regions around the world. The development o f SMPs depends on either location advantages or their contribution in improving the logistics network of the multi- port gateway region. As SMPs typically have a smaller scale, they are often more agile and flexible in dealing with new market-based challenges. Thus, it is necessary to complement the wider multi-port gateway region by redefining the strategic mission o f the port toward a specialized/niche port.
The above discussion suggests that the study o f SMPs is not only relevant but also necessary in order to improve the competitiveness of multi-port gateway regions and to strengthen their role in facilitating network-based supply chain.
In August 2006, the Chinese State Council discussed and released the National Seaports Layout Plan, where Chinese seaports were classified into five port regions: the Bohai Sea Economic Rim (BER), Yangtze River Delta (YRD), Southeastern Coastal Ports Cluster, Pearl River Delta (PRD) and Southwestern Coastal Port Cluster. In all five port regions sharing some common characteristics, each one is composed o f more than one gateway port (also conceived as hub ports or centrality) and most gateway ports in China serve high dependence on foreign trade. Within the same port region, gateway ports are usually considered to compete with each other directly owing to adjacent geographical locations. Other peripheral ports act as assisting ports and serve their gateway ports. Flowever, this classification blurred port relationship w ithin the same port region w ith more peripheral ports springing up. The anticipated networking between hubs and assisting ports didn’t form, but fast increase of these “assisting” ports put new competition pressure on hub ports. Flence, we introduce the concept o f SMPs in this paper to re-construct the competition mechanism in multi-port gateway region. To verify the application o f SMPs, we assume this concept can only be employed to explain the port in the same port region, i.e. Yingkou port with 225.01 million tons o f cargo volume in 2010, the 10th large seaport in China, ranks the sixth place in
56 P O L IS H M A R IT IM E R E S E A R C H , Special Issue 2013 S1

Peripheral challenge by Small and Medium Sized Ports (SMPs) in Multi-Port Gateway Regions:the case study o f northeast o f China
the BER. In other words, a large port nationwide is measured as a medium sized port in the BER context. In current China port statistics, ports o f ‘‘above Designated Size” are included but definition o f “designated sized” is not specified. In this paper, we introduced definition o f SMPs by classifying ports into three levels: big, medium-sized and small ports according to the five-dimension method discussed above. In Sections III, IV and IIV, we provide an in-depth description o f ports with similar characteristics and draw more academic attention to SMPs. In this paper we mainly discuss the role o f SMPs in enhancing the competitiveness and hinterland identification o f multi-port gateway regions.
2. GENERAL PROFILE OF MULTI-PORT GATEWAY REGION IN THE BER
The multi-port gateway region in the northeast o f China (defined as Bohai Sea Economic rim, BER) has seen a strong growth in recent years partly as a result o f the efforts o f the Chinese government to promote the region as a third major growth pole after PRD and YRD regions. The ports in the BER are becoming more important in the worldwide spoke-and-hub system as well. Major gateways o f Dalian, Tianjin and Qingdao climbed in the world ranking and growth in Yingkou port even reached by 25% in 2009 (Table 1). Previous port competition analysis usually emphasized gateway port and the rest ports were conceived as assisting ports that couldn’t form direct competition over these hub ports. With the rapid increase of SMPs, original port competition hierarchy has been blurred, and the periphery challenge by Yingkou ports, as well as other SMPs puts competitive pressure on the BER port system.
The BER is interpreted as the economic area around the Bohai Sea and a part o f the coastal areas along the South Sea, which are also named as the Golden Coastline. The BER includes Beijing (Jing), Tianjin (Jin, Municipality), Liaoning (Liao), Hebei (Ji), Shanxi (Jin), Shandong (Lu) and eastern Inner Mongolia, covering 1.12 m illion square kilometers totally. More than 60 ports are dispersed along 5,319 kilometers o f coastline in the BER. According to the data availability, we include 11 ports in this paper as our research objectives (Figure 1).
The BER is divided into three subordinate m ulti-port gateway regions in terms o f geographical locations (Table 2): Liaoning, Jin-Ji and Shandong Bay. In contrast to other port clusters in China, the BER port group is more evenly distributed. Four ports o f Dalian, Yingkou, Jinzhou and Dandong constitute the Liaoning port group, occupying 25.4% of total cargo volume in the BER in 2 010. Comparatively, ports o f Tianjin, Qinhuangdao, Tangshan and Huanghua are in the center o f the BER, with 44.3% of market share, and the rest o f ports serve Shandong bay.
Port competition in the BER can be re-identified if we include more ports, and the Pusan Port in the South Korea is exemplified as a typical case. The Pusan port deals with most transshipment importing from and exporting to China, Japan and other areas, and has formed direct competition over load centers (Dalian, Tianjin and Qingdao) o f the BER. These gateway ports are mainly driven by foreland and compete with each other for international trade cargoes. The Pusan Port and three gateways ports o f China have no cooperation and in between these ports direct competition exists. Direct competition in question covers two meanings: Above all
Tab. 1. Ports o f BER in the world top container ports rank in 2009
Rank in 2008
Rank in 2009 Port Throughput in 2008
(TEU)Throughput in 2009
(TEU) Change
59 41 Yingkou 2 036 400 2 537 000 25%75 70 Yantai 1 510 000 1 401 100 -7%24 22 Dalian 4 500 495 4 550 000 1%14 11 Tianjin 8 500 000 8 700 000 2%10 9 Qingdao 10 320 000 10 260 000 -1%
Source: author’s elaboration on China port yearbook
Tab. 2. Multi-port gateway regions in the BER - key characteristics
Port region Gatewayport
Positioning of gateway
port
Assistingports
Cargocategory Hinterland
Liaoning Dalian
NortheasternAsian
InternationalShipping
Center
YingkouJinzhou
Dandong
Petroleum, grain, ore,
steel
Liaoning\Jilin\Heilongjian Provinces, eastern Inner
Mongolia
ShandongBay Qingdao
NortheasternAsian
InternationalShipping
Center
YantaiRizhaoWeihai
Coal, petroleum,
ore, container
Shandong Bay, Henang Provinces
Jin-Ji Tianjin
Northern Shipping and
Logistics Center o f
China
QinhuangdaoTangshan
coal and derivatives,
steel, ore
Beijing, Tianjin, Hebei, Shanxi
Note: Positioning of gateway ports: the role and of these gateway ports outlined by central Chinese government
P O L IS H M A R IT IM E R E S E A R C H , Special Issue 2013 S1 57

Peripheral challenge by Small and Medium Sized Ports (SMPs) in Multi-Port Gateway Regions:the case study o f northeast o f China
aaomngC h i n a J in z h o u
Jin-Ji (B) Y in g k o j N O R T HKOREADardorgI Liaodong
B a y yQinhuangdao1
Tangshan # P 'yöngyangannp'oT a n g g y
Bohaid a y
Qingdao
Mofcpo »Shandong Bay (C)
.SeoulIncheon %
¿ S O U T HK O R E A
Fig. 1. Multi-port gateway regions in the BER
three Chinese hub ports face challenge from the Pusan Port due to cost factor, and it means cargos previously handled by these ports are now transported to the Pusan Port and then to other foreign ports, say Longbeach, etc. In the Pusan port, the Terminal Handling Charge (THC) is about $ 40 per container in contrast to average $ 88 in Chinese gateway ports in the BER. Besides, in between three Chinese gateways ports, competition also becomes intense because all these ports are driven by foreland and depend on international trade. The port competition in between one big transshipment port (Pusan) and three hub ports (Tianjin, Qingdao and Dalian) in the BER is similar to the PRD region in the south of China with existence o f Hong Kong, Shenzhen and Guangzhou ports. In the PRD, the Hong Kong Port bears most transshipment, Shenzhen holds high percentage of international trade cargoes and Guangzhou serves more for domestic trade.
3. SMPS FEATURESAND PORT COMPETITION
3.1 Volume/market share
In order to identify port categories in the BER, we integrate data in total cargo volume, cargo traffic in the international trade and container traffic as measurement. All data are available exactly in the China Port Yearbook. Accordingly, we calculate the data of cargo traffic and container traffic and corresponding share (Table 3).
By two dimensions (X axis as total cargo volume, Y axis as container traffic), we classify ports in the BER into three categories: big, medium sized and small ports. Qingdao, Tianjin and Dalian are as big ports, with 46.25% o f total market share.
Tab. S. Port ranking, cargo volume and container traffic in the BER (2010)
Rank Port (City/ region)
Total cargo volume in million tons (A)
Container traffic TEUs in thousands (B)
Market share (A/total A)
Centralizationdegree
1 Tianjin 400.45 9439.92 17.44%46.25%2 Qingdao 360.42 11848.51 15.69%
3 Dalian 301.31 5060.88 13.12%4 Qinhuangdao 257.14 340.04 11.20%
46.62%5 Tangshan 250.62 244.52 10.91%6 Yingkou 225.01 2679.48 9.80%7 Rizhao 188.00 1061.01 8.19%8 Yantai 150.00 1527.31 6.53%9 Jinzhou 60.08 754.79 2.62%
7.13%10 Dandong 55.05 319.72 2.40%11 Weihai 48.66 441.73 2.12%
Total 2296.74 33717.90 100.00% 100.00%
Source: author’s elaboration on China port year book 2011. Total cargo volumes include transshipment and transit volumes.
58 P O L IS H M A R IT IM E R E S E A R C H , Special Issue 2013 S1

Peripheral challenge by Small and Medium Sized Ports (SMPs) in Multi-Port Gateway Regions:the case study o f northeast o f China
14000
12000
¿5 10000 UJH.S 8000y £ 6000
C 4000ScoO 2000
■ Q in g d a o
■ T ianjin
Big ports
■ D alianMedium sized ports
Small portsY anta i ■ Y in gkou
J in zh ouD a n d o n ^ /e¡h a ¡
® g R iz a h o T a n g sh a n
Q in h u a n g d a o 01 1 1 1 -----------150 350
6000
5000
4000
3000
20001000
0
Liaoning (A)
100 150 200 250 300
Total cargo volume in thousand tonsFig. 2. Port hierarchy in terms o f total cargo volume and container traffic
Jin-Ji (B)
400 450
Shandong Bay (C)
» Palian
♦ Yingkou
♦ Jinzhou♦ Dandong
10000
8000
6000
4000
2000
0
♦ Tianjin
TangshanQ'n*1uan T— ♦ ,gdao ,
100 200 300 400 500
14000 12000
10000
8000 6000 4000 2000
0
Qingdao♦
+ Weihai
Yantai ♦ ♦ Rizhao
100 200 300 400 *
Fig. S. Port hierarchy distribution in terms o f total cargo volume.Note: X axis in thousand tons and Y axis container traffic in TEU. Note di fferent scales on the Y axis
200 300 400
Qinhuangdao, Tangshan, Yingkou, Rizhao and Yantai are medium sized ports, with 46.62% o f total market share, while Jinzhou, Dandong and Weihai are defined as small ports, weighing 7.13% o f total market shares (Figure 2). The fierce competition is present among medium sized ports.
If we have a deeper look at port competition mechanism in each separate port cluster, we’ll find subtle difference (Figure 3 ). In the Liaoning port group, the gap between big port (Dalian ports) and medium sized one (Yingkou port) is narrowed to the hilt, so as for two small ports o f Jinzhou and Dandong. Therefore, in Liaoning, ports competition exists between big port and medium sized ports, and the port ‘‘inbetweeness” competition phenomenon is obvious. In contrast, we get to know more competition in between medium sized ports in the Jin-Ji and the Shandong bay, while the difference between big ports and medium sized ports are too far to be defined as direct competition.
To better measure port competition and position o f SMPs, we introduce Herfindahl-Hirschman Index (HHI index) to measure market concentration.
N
in BER shows a high degree, but HHI index can’t measure the future uncertainty and to what extent the rise o f SMPs can threaten dominance o f hub port. Thus we introduce three definitions here: centralization degree (ij), average centralization degree (Arj¡ •) and variance (5).
Tab. 4. Average centralization degree and variance o f ports in the BER
H = 5 >i = 1
Where s¡ is the market share of port i in the market, and N is the number o f ports.
H(A)= 0.4412H(B)= 0.3567H(C)= 0.4007 (calculated from table 4)
HHI index o f the three regions are above 0.25, indicating a high concentration. The Liaoning with 0.4412 means the highest concentration degree in the BER. Market concentration
Port/Aijjj, öjj A % i «ULiaoning (A)
Dalian 60.30% 0.0952Yingkou 25.88% 0.0337Jinzhou 9.22% 0.0006
Dandong 4.60% 0.0167Jin-Ji (B)
Tianjin 45.54% 0.0093Qinhuangdao 35.11% 0.0549
Tangshan 10.54% 0.0453Huanghua 8.80% 0.0281
Shandong Bay (C)Qingdao 56.78% 0.0428Rizhao 22.65% 0.0155Yantai 15.67% 0.0089Weihai 4.90% 0.0007
Tjj • = cargo volume o f port i/cargo volume o f port cluster j. Measures the market share o f a port in corresponding port cluster. We adopt this figure to analyze port competition intensity. (2.1)
P O L IS H M A R IT IM E R E S E A R C H , Special Issue 2013 S1 59

Peripheral challenge by Small and Medium Sized Ports (SMPs) in Multi-Port Gateway Regions:the case study o f northeast o f China
A i l , = ( i j - 1 • • -n ) (2-2)1J 10
Average market share in 10 years.
5.J = £(T!i0 - Ä tlij)2. (¡J = 1 . . . 10) (2.3)
Measure what extent the position o f a port will be changed, the higher value o f 5, the high risk that a port’s position could be changed.
If we compare r|;j and Ai]lj values of Liaoning (A), we’ll find more market shares are centralized among Dalian and Yingkou, and variance (5) o f Dalian is 0.0952, highest among all ports in the BER, which indicates the most possible peripheral challenge by medium-sized ports in Liaoning port competition structure. By contrast, variances (5) in Tianjin and Qingdao are 0.0093
and 0.0428 respectively, illustrating a relatively stable port hierarchy. Decrease o f the underlying change factors means the threat from SMPs in these two regions declines (Tables 2, 3 and 4). Therefore, the future port competition mechanism in Liaoning contains more uncertainties and changes while relations between hubs and SMPs in the other two regions keep relatively stable. The change factor involved in this paper has excluded the change possibility from external ports. If we include more adjacent ports in other nations, such stability may contain more changing factors.
3.2. International port connectivity in the BER
Beyond considering the size o f ports to differentiate them, we classify ports into three categories depending on the cargo source only associated with container traffic (Table 7). Through
Tab. 5. Total cargo volume in the BER 2001-2010
Port/Volume 2001 2002 2003 2004 2005 2006 2007 2008 2009 2010Liaoning (A) 136.77 153.82 183.18 239.49 291.25 368.80 406.46 476.46 544.15 641.45
Dalian 100.47 108.51 126.02 115.16 170.85 200.46 222.86 245.88 272.03 301.31Yingkou 25.20 31.27 40.09 59.78 75.37 94.77 122.07 150.85 176.03 225.01Jinzhou 11.10 14.04 17.07 24.55 30.03 31.57 35.15 47.23 52.59 60.08
Dandong 10.00 15.00 42.00 26.38 32.50 43.50 55.05Jingji (B) 238.29 255.72 339.77 428.57 510.97 595.65 707.51 796.58 889.86 1004.21
Tianji 113 69 129.06 161 82 206.19 240.69 257.60 309.46 355.93 381.11 400.45Qinhuangdao 113.02 111.67 125.62 150.37 169.00 204.89 248.93 252.31 249.42 257.14
Tangshan 11.02 14.65 20.83 26.02 33.65 51.71 65.79 108.54 175.59 250.62Huanghua 0.56 0.34 31.50 45.99 67.63 81.45 83.33 79.80 83.74 96.00
Shandong Bav (C) 162.48 189.84 226.64 261.46 331.37 413.01 517.89 585.26 661.46 747.08
Qingdao 103,98 122.13 140,90 162,65 186.78 224.15 265,02 300.29 315,46 360.42Rizhao 29.33 31,36 45.07 51.08 84.21 110.07 130,63 151.02 181.31 188.00Yantai 21.90 26,89 29.36 34,31 45,06 60,76 101,29 I I 1.89 12.3.51 150.00Weihai 7.27 9.46 11,31 13,42 15,32 18,03 20.95 22,06 41.18 48,66
Total ( A+B+C) 537,54 599.38 749,59 929,52 1133.59 1377.46 1631.86 1858.30 2095.47 2392.74Note: million tons except noted. Since 2007, the data for Yantai includes Yantai port and Longkou port.
Source: author’s elaboration on year book 2001-2010.
Tab. 6. Centralization degree o f the ports in the BER
Port/1] 2001 2002 2003 2004 2005 2006 2007 2008 2009 2010
Liaoning (A)Dalian 73.46% 70.54% 68.80% 60.61% 58.66% 54.35% 54.83% 51.61% 49.99% 46.97%
Yingkou 18.43% 20.33% 21.89% 24.96% 25.88% 25.70% 30.03% 31.66% 3235% 35.08%Jinzhou 8.12% 9,13% 9,32% 10.25% 10.31% 8.56% 8.65% 9.91% 9.66% 9.37%
Dandong 0,00% 0,00% 0,00% 4.18% 5.15% 11.39% 6.49% 6.82% 7.99% 8.58%
Jin-Ji (B)
Tianjin 47.71% 50.47% 47.63% 48.11% 47.10% 43.25% 43.74% 44.68% 42.83% 39.88%Qinhuangdao 47.43% 43.67% 36.97% 35.09% 33.07% 34.40% 35.18% 31.67% 28.03% 25.61%
Tangshan 4.62% 5.73% 6.13% 6.07% 6.59% 8.68% 9.30% 13.63% 19.73% 24.%%Huanghua 0.24% 0.13% 9.27% 10.73% 13.24% 13.67% 11.78% 10.02% 9.41% 9.56%
Shandong Bay (C)
Qingdao 64.00% 64.33% 62.17% 62.21% 56.37% 54.27% 51.17% 51.31% 47.69% 48.24%Rizhao 18.05% 16.52% 19.89% 19.54% 25.41% 26.65% 25.22% 25.80% 27.41% 25.16%Yantai 13.48% 14.16% 12.95% 13.12% 13.60% 14.71% 19.56% 19.12% 18.67% 20.08%Weihai 4.47% 4.98% 4.99% 5.13% 4.62% 4.37% 4.05% 3.77% 6.23% 6.51%
60
Source: author’s elaboration on China port year book 2011.
P O L IS H M A R IT IM E R E S E A R C H , Special Issue 2013 S1

Peripheral challenge by Small and Medium Sized Ports (SMPs) in Multi-Port Gateway Regions:the case study o f northeast o f China
Tab. 7. International connectivity o f the ports in the BER 2010
Rank Port(City/region)
Container cargo traffic TEUs in
thousands (B+C)
Container Cargo traffic in
international trade TEUs in thousands (B)
Share of int. trade traffic
(B/(B+C)*100%)
Container Cargo traffic in domestic
trade TEUs in thousands (C)
Share of domestic trade traffic
(C/(B+C)*100%)
1 Qingdao 11848.51 10046.05 84.79% 1802.46 15.21%2 Dalian 5060.88 4065.79 80.34% 995.09 19.66%3 Tianjin 9439.92 5422.86 57.45% 4003.42 42.41%4 Weihai 441.73 221.07 50.05% 222.30 50.33%5 Qinhuangdao 340.04 122.83 36.12% 217.21 63.88%6 Yantai 1527.31 366.39 23.99% 1160.91 76.01%7 Dandong 319.72 54.94 17.18% 264.79 82.82%8 Tangshan 244.52 23.09 9.44% 221.43 90.56%9 Rizhao 1061.01 29.39 2.77% 1031.62 97.23%10 Yingkou 2679.48 48.08 1.79% 2631.41 98.21%11 Jinzhou 754.79 10.98 1.45% 743.81 98.55%
Source: author’s elaboration on China port yearbook 2010.
assessment o f international trade cargo percentage, Tianjin, Qingdao, Dalian and Weihai are o f high degree o f connection with international trade, i.e., highest of Qingdao with 84.79% and com paratively low o f W eihai 50.05%. However, we need to draw attention that the Weihai port in this category is a special case because its small total volume and part o f volume derives from transshipment of Qingdao. Therefore, even with high degree o f international connectivity, Weihai can’t be defined as a hub port. Port competition in the Shandong Bay is decentralized in terms o f international port connectivity. We consider the second category of ports as domestic trade driven ports with medium degree o f international connectivity. Three ports in this category, Qinhuangdao, Yantai and Dandong are located in three different port clusters. Furthermore in the third category, Yingkou, Tangshan, Rizhao and Jinzhou ports are domestic trade driven ports with comparatively low degree of international connectivity (Figure 4).
By analysis in port size and cargo classification, we therefore define hub ports in the BER as the ports o f Qingdao,
Tianjin and Dalian. Port competition in the BER has the following characteristics: first, hub port competition is more intense as all three ports are similarly highly international trade driven. Second, Hub port and SMPs competition has reduced in Liaoning and Jin-Ji port cluster because Dalian and Yingkou are driven by international trade and domestic trade respectively, and similar to Tianjin and Qinhuangdao. Even closely located, SMPs and hub ports serve prominent roles. In comparison, the port competition in the Shandong Bay is more fierce, and the ports o f Qingdao, Weihai and Yantai share high degree international trade dependence. In general, competition in between SMPs and central ports in the BER confines to regional area. For instance, Yingkou po rt’s growth can challenge dominant position of Dalian port but there is no evidence that it has threat over Tianjin or Qingdao port. Some mediumsized ports in the BER are becoming regional centers as most SMPs in this region are hinterland-driven that requires more for accessibility to hinterland. The process o f strengthening consecutiveness to hinterland speeds up their increasing role as
90.00%
80.00%
70.00%
60.00%
50.00%
40.00%
30.00%
20 .00%
10 .00%
0 .00%
♦ Qingdao♦ Tianjin
Int. trade-driven ports (high degree)
♦ Dalian
♦ Wethat
> Qinhuangdao
♦ Yantai n̂t' tra^e'^riven Ports 0 OH> degree)
Dandong
Tangshant R i z h a o W e i h a i Domestic trade-driven ports
Yingkou2UUU 4UUU bUUl) “8000 10000 12000
Fig. 4. Poti category according to foreign trade cargo traffic
P O L IS H M A R IT IM E R E S E A R C H , Special Issue 2013 S1 61
Peripheral challenge by Small and Medium Sized Ports (SMPs) in Multi-Port Gateway Regions:the case study o f northeast o f China
a regional center that requires more sophisticated functions in logistics system. Third, there is no clue that SMPs in different port clusters have direct competition. The fourth analysis on the port competition is developed among small and medium-sized ports in the BER. In contrast to direct competition between medium-sized and hub ports, this category contains more cooperation, and merger & acquisition cases are more prevalent among these ports. For example, in 2005, Yingkou port acquired Jinzhou port by taking its advantage o f oil transportation, and in 2012 Yingkou was negotiating with Dandong port for further merger. Similar to the third category, competition among these ports is also restricted to the same region.
3.3. The role o f SMPs in the relative port clusterThe role o f SMPs in a multi-port gateway region varies in
the whole supply chain. Some ports transship cargoes from hub ports and function as complements or assisting ports, while in contrast, other ports challenge the dominant position o f centrality ports as substitutes with their rapid expansion in market competition. In the BER, ‘'‘substituting” SMPs can be found in Liaoning and Jin-Ji ports region, and relationship between Dalian and Yingkou (Liaoning) as well as Tianjin and Qinhuangdao (Jin-Ji) is described as direct competition between incumbent hub ports and new emerging sub-hub ports. The possibility o f dual-hub ports in specific regions receives attention from academic concerns (Wang, 2012). Though dual-hub ports can attract more cargoes and enhance overall competitiveness o f such region, new risks may undermine this plausible blooming picture. On the one hand, the rise of sub-hub ports, conceived as medium-sized ports in this paper, will put more competition on hub ports. On the other hand, hub ports
need to either expand port size or improve efficiency to maintain port attractiveness. Some hub ports choose to construct new berth in a location near those sub-hub ports or accelerate pace in acquiring more small ports to enhance their competitive positions, i.e. in 2010 Dalian port acquired Lvshun ports which is closer to Yingkou and inland port o f Shenyang in order to compete with adjacent Yingkou port. Counter measures of Yingkou port was taken such as expanding scale and acquiring the Dandong Port in 2012. This round o f escalating ports consolidation restructured Liaoning ports cluster and dualhub ports pattern in this region is going to emerge. However, expanding port size does not guarantee increasing attractiveness and in the background of volatile economy, both ports are facing problem o f over capacity.
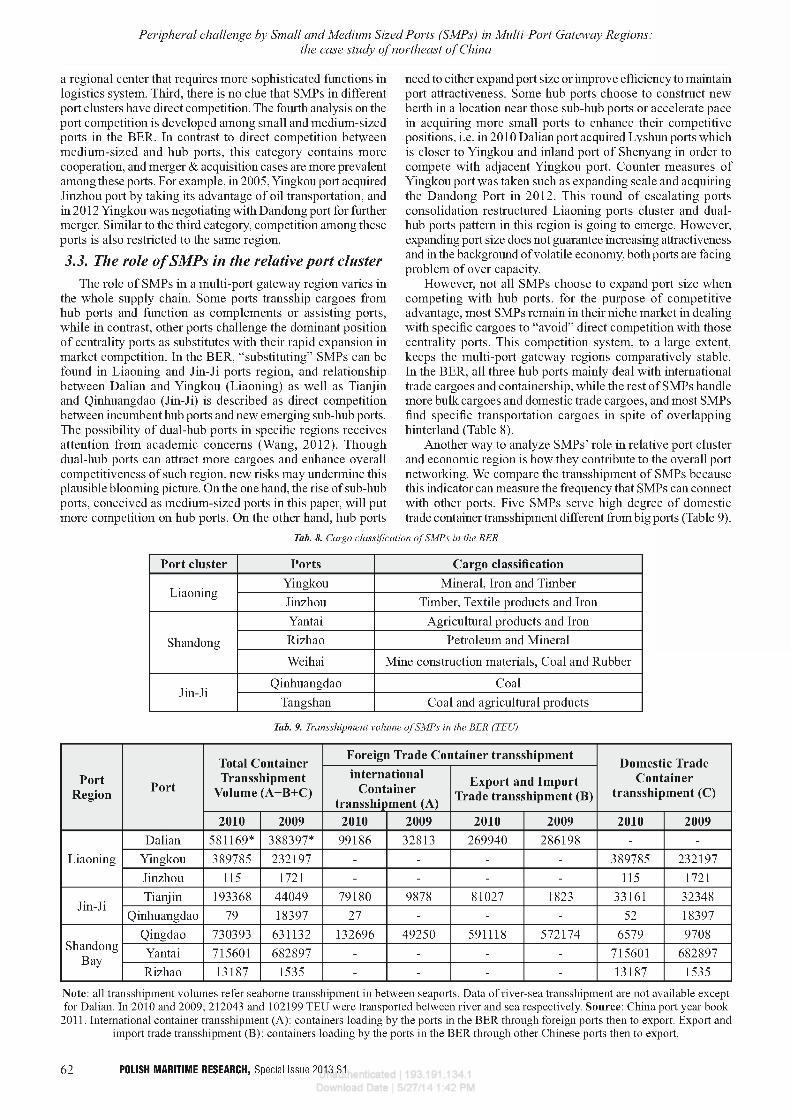
However, not all SMPs choose to expand port size when competing with hub ports, for the purpose o f competitive advantage, most SMPs remain in their niche market in dealing with specific cargoes to “avoid” direct competition with those centrality ports. This competition system, to a large extent, keeps the multi-port gateway regions comparatively stable. In the BER, all three hub ports mainly deal with international trade cargoes and containership, while the rest o f SMPs handle more bulk cargoes and domestic trade cargoes, and most SMPs find specific transportation cargoes in spite o f overlapping hinterland (Table 8).
Another way to analyze SMPs’ role in relative port cluster and economic region is how they contribute to the overall port networking. We compare the transshipment o f SMPs because this indicator can measure the frequency that SMPs can connect with other ports. Five SMPs serve high degree o f domestic trade container transshipment different from big ports (Table 9).
Tab. 8. Cargo classification o f SMPs in the BER
Port cluster Ports Cargo classification
LiaoningYingkou Mineral, Iron and TimberJinzhou Timber, Textile products and Iron
Shandong
Yantai Agricultural products and IronRizhao Petroleum and Mineral
Weihai Mine construction materials, Coal and Rubber
Jin-JiQinhuangdao Coal
Tangshan Coal and agricultural products
Tab. 9. Transshipment volume o f SMPs in the BER (TEU)
PortRegion Port
Total Container Transshipment
Volume (A+B+C)
Foreign Trade Container transshipmentDomestic Trade
Container transshipment (C)
international Container
transshipment (A)
Export and Import Trade transshipment (B)
2010 2009 2010 2009 2010 2009 2010 2009
LiaoningDalian 581169* 388397* 99186 32813 269940 286198 - -
Yingkou 389785 232197 - - - - 389785 232197Jinzhou 115 1721 - - - - 115 1721
Jin-JiTianjin 193368 44049 79180 9878 81027 1823 33161 32348
Qinhuangdao 79 18397 27 - - - 52 18397
ShandongBay
Qingdao 730393 631132 132696 49250 591118 572174 6579 9708Yantai 715601 682897 - - - - 715601 682897Rizhao 13187 1535 - - - - 13187 1535
Note: all transshipment volumes refer seaborne transshipment in between seaports. Data of river-sea transshipment are not available except for Dalian. In 2010 and 2009, 212043 and 102199 TEU were transported between river and sea respectively. Source: China port year book
2011. International container transshipment (A): containers loading by the ports in the BER through foreign ports then to export. Export and import trade transshipment (B): containers loading by the ports in the BER through other Chinese ports then to export.
62 P O L IS H M A R IT IM E R E S E A R C H , Special Issue 2013 S1

Peripheral challenge by Small and Medium Sized Ports (SMPs) in Multi-Port Gateway Regions:the case study o f northeast o f China
Their role in connecting domestic transshipm ents within a multi-port gateway region is more prominent compared to international connectivity. SMPs in the regions o f Liaoning and Shandong undertake high ratio o f transshipment compared to their adjacent hub ports. While in contrast, in the Jin-Ji region, the gateway port o f Tianjin undertakes more than 90% o f total transshipment volumes. In other words, SMPs in Liaoning and Shandong are more dynamic in the relative port clusters. Their role in transiting domestic containers compensates the shortcoming o f adjacent gateways ports; in a result, less intense competition in transshipment market promotes SMPs for the fast growth. The ‘'‘complement relations” between SMPs and gateway ports in the transshipment market reinforce.
In general, most SMPs in the BER are competitive in niche segment markets and fonction as a “complement” to hub ports, and the rise o f SMPs also makes a port networking complex in such regions. Some SMPs choose to cooperate with the hub ports, for example, in Shandong Bay, a new port system is planned by positioning Qingdao as a gateway port, Yantai and Rizhao as assisting ports (medium sized ports) and Weihai as feeding ports (small ports). Assisting ports will develop more international shipping lines while feeding ports engage in domestic markets. Some SMPs with the rapid increases can form direct competition over the big ports and relations between these ports are more like “substitutes”, such as the port o f Dalian and Yingkou. The new emerging SMPs, like Yingkou ports, will implement more mergers and acquisitions for port expansion to gain more competitive advantage in competing with ports much larger than its size.
4. PORT CITY AND HINTERLAND CHARACTERISTICS OF SMPS
In this section, we analyze the interactions between SMPs and their hinterland capture. A distinction is made between the direct hinterland o f the port and the more distant/extended hinterland. Hinterland access is one o f the important factors that influence the competitiveness of a seaport when it competes with other ones.
The direct hinterland refers to the port city region and the extended hinterland is the coverage of a port where cargoes are transported from and to. Port cities were settlements, where cargoes were interfaced between land and ocean and where related businesses emerged about fifty years ago. However, correlation between ports and cities has changed a lot, i.e., a large city does not necessarily have a large port (e.g., London)
and vice versa (Talley 2009). Some big cities may have a small port (e.g., the U.S. cities San Diego, Philadephia, Boston, etc.). The rationale is that the case for the cities can emerge “through agglomeration forces generated by the interaction o f increasing returns and transport costs” (Fujita and Mori 1996).
In the BER, all three gateways ports (big ports) are accompanied with big cities and GDPs from these port cities rank in a sequent order that accords with corresponding port cargo volumes (Table 10). This correlation has been enhanced through institutional and policy effects, Tianjin expands its city area to the Binhai new city and Dalian port benefits from an economic revitalization policy issued in 2006. However, ports have no too direct relation with cities in a group o f the medium-sized ports. For instances, GDP ofYantai city ranked the sixth position with 435.85 billion Yuan in 2011, while the cargo volumes ofYantai port were the eighth in the BER, and is the smallest port among all medium-sized ports. The production output o f port city seems to be no impact on port freight expansion. Similarly, large size ofYingkou port doesn’t generate quasi big city because the GDP ofYingkou city is the smallest o f all eleven study samples. This inconsistence also applies into small ports, such as Jinzhou port.
From the perspective of port cities, the industrial distribution and transportation demand will affect port attractiveness for cargoes. Like Jinzhou, the city close to Beijing with convenient rail and road connection with the adjacent big cities and most generated transportation demand can be satisfied through land transportation. On the other side, the extended hinterland yields more crucial effect on SMPs’ freight, and next, w e’ll take the Yingkou Port for example for an in-depth analysis on how the extended hinterland affects SMPs.
We collect data from the inside o f the Yingkou Port that is classified in terms o f two dimensions: inbound and outbound cargo volumes through Yingkou port. Connecting ports and cargoes with few volumes are ignored in this paper (Table 11). In composing o f outbound cargo volume, the Yingkou port exerts a moderate effect on the BER economy, and cargo volume exported from Yingkou port to the rest BER ports accounts for 12.3% o f total cargo volumes, in comparison, more cargoes are imported to Yingkou port through the BER ports and corresponding figure reaches to 27.5%. The main demand for the Yingkou port is distributed in the south of China, for example, two regions o f Guangdong and Shanghai make up the largest proportion ofYingkou port cargo volumes. The extended hinterland supports Yingkou port’s freight more than the port city does. In other words, niche market for SMPs
Tab. 10. Port cargo volume and port city GDP rank in 2011
Port cargo volume rank in the BER
Port cargo volume rank Nation wide
Port(City/region)
Total cargo volume in
million tons
Port City GDP in Billion Yuan
(RMB)
Port city GDP Rank in the
BER
Port city GDP rank Nation
wide
1 3 Tianjin 451.00 910.88 1 62 5 Qingdao 375.00 566.62 2 103 6 Dalian 338.00 515.8 3 144 7 Qinhuangdao 287.00 93.05 9 1275 8 Tangshan 308.00 446.9 4 196 9 Yingkou 261.00 100.24 8 1197 10 Rizhao 250.00 102.51 7 1158 12 Yantai 180.00 435.85 5 209 - Jinzhou 72.00 90.26 10 13310 - Dandong 76.37 72.89 11 17511 - Weihai 55.01 194.47 6 60
P O L IS H M A R IT IM E R E S E A R C H , Special Issue 2013 S1 63

Peripheral challenge by Small and Medium Sized Ports (SMPs) in Multi-Port Gateway Regions:the case study o f northeast o f China
Tab. 11. Inbound and outbound cargo volumes ofYingkou port 2010
RankOuthound Inbound
PortTotal cargo
volumePort
Total cargo volume
1 Guangdong 24217.18 Guangdong 16453.112 Shanghai 17237.64 Shanghai 12540.213 Jiangsu 15900.89 Fujian 9440.324 Fujian 10346.64 Jin-Ji 7891.28
5 Zhejiang 5862.32 Shandong Bay 7799.36
6 Shandong Bay 4109.32 Zhejiang 6010.427 Liaoning 3822.14 Jiangsu 5347.51
8 Jin-Ji 2570.53 Liaoning 3373.87
9 Guangxi 829.38 Guangxi 273.5210 Anhui 710.76 Anhui 90.4211 Hainan 28.68 Hubei 85.1312 Hubei 7.17 Hainan 20.0213 Jiangxi 11.37
Total 85642.65 69336.53
Thousand tons except noted.Source: authors’ elaboration on Yingkou port annual report 2010.
not only refers to cargo classification as introduced above, but also their attractiveness to transport cargoes to further regions in order to avoid intense competition over overlapping hinterland. However, individual case can’t represent all cases o f SMPs and further research into more cases can justify how extensive hinterland can enhance the role o f SMPs in multi- port gateway regions.
5. LOGISTICS AND DISTRIBUTION FUNCTION OF SMPS
A seaport is a logistic and industrial node in the global transport system with a strong maritime character and in which a functional and spatial clustering o f activities takes place. Activities that are directly or indirectly linked to seamless transportation and transformation process within the logistic chains (OECD, 2000). But seaports are complex and dynamic entities, often dissim ilar from each other, where various activities are carried out by and for the account o f different actors and organizations. Such a multifaceted situation has led to a variety o f operational, organizational and strategic management approaches to port systems (Bichou and Gray, 2005). The current logistics nodes overlap in terms of function resulting in weak scale economies, so as to the role of SMPs and gateway ports in the same logistics system. A variety of methods in evaluating ports logistics and distribution functions have been applied, such as DEA (data envelopment analysis) method. Qi and Han (2006) assessed port logistics function efficiency by using DEA and drew a conclusion that Dalian port is more efficient than Yingkou, Dandong and Jinzhou. However, such conclusion is based on infra structure as an input and cargo volumes as an output, such as yard area and berth length, while ignoring the inland port connection and multimodal transportation. The whole logistics industry in the BER is characterized by small scale businesses which offer basic logistics services such as warehousing and transportation. The inland port facilities and optimized logistics nodes should conform to three criteria: direct link to a seaport; high capacity transport link(s) and availability o f services found in a seaport
(Roso and Lévçque, 2002). To enhance ports’ role in logistics system, gateways ports o f Tianjin, Qingdao and Dalian chose to establish logistics parks and container logistics center that are located close to ports by providing warehousing and other value added services. For instances, three logistics centers were set up in the Dalian port, and Shenyang and Harbin serving for containers pick-up and loading business. Compared to selfestablished logistics infrastructures, SMPs seek to cooperate with inland cities by co-setting up inland ports to attract more cargoes from inland areas. Yingkou port utilizes inland port in Shenyang to expand its intermodal transportation and function in the whole logistics system. Whereas, inland connection among SMPs is less stressed in the Jin-Ji region and the Shandong Bay, and the main reason is that in these two regions, SMPs haven’t formed direct competition over gateways ports. As a result, the logistics function o f SMPs has been ignored. The dominant difference between logistics park and inland port in the BER lies in governance. Logistics parks are usually solely invested by port authority, where inland ports usually are launched by inland city governments and port authorities by agreement to invest or take share in part o f infrastructures. Therefore, in the BER region the logistics system lacks the scale and the sophistication in order to cope with the increasing demand for modem logistics concepts. The role o f SMPs in the whole logistics system or vice versa hasn’t been improved in accord with their throughput growth.
Besides, intermodal transportation is another indicator in assessing the SMPs’ logistics function. Intermodal connectivity and landside access to Chinese ports are not approached differently or in a more sophisticated way than in the United States or European Union. Many new built port facilities are located in large urban areas, and the access to and from these ports involves traversing mixed-use roadways (ITSP, 2008). In China, rail access to seaborne port hasn’t gained enough investment, and railroad-sea (mainly containers) shipment accounts for more than 95% o f total intermodal transportation. However, due to the increasing pressure from volatile oil price and demand for less emission, the intermodal transportation for rail-sea containers (RSC) receives more attention from
64 P O L IS H M A R IT IM E R E S E A R C H , Special Issue 2013 S1

Peripheral challenge by Small and Medium Sized Ports (SMPs) in Multi-Port Gateway Regions:the case study o f northeast o f China
policym akers and practitioners. From international port experience, such transportation methods with high efficiency occupy high weight in a mature port, for example, about 13% of cargoes are transported from RSC in the port o f Rotterdam and 11% in the New Jersey port respectively. While in contrast, the ratio is relatively low to average 2% in China, 84% o f cargoes are transported through road-sea, and 14% are in between waterway and even lower in SMPs. In the BER, medium-sized ports bear less RSC transportation shares except for Yingkou port, and it came to 170,000 TEU containers through RSC, accounting for 7.6% oftotal container freight in 2009. The rest of SMPs only take up less than 0.5% of RSC cargoes. In contrast, in the adjacent gateways ports, the Dalian port has transported 250,000 TEU containers through RSC, accounting for more than 5% of total container freight. Tianjin and Qingdao are next to these ports, making up 2% and 0.8% respectively. SMPs in the BER are in a low ratio in terms o f RSC transportation. One reason is that most SMPs in the BER handle much less containers compared to their bulk cargo volumes. The other reason is that most cargoes now are manufactured in coastal areas that are close to ports, with less need for long distance of railway transportation. However, with increasing labor and land costs, parts o f manufacturing factories are transferred to more inland areas. RSC transportation could be another niche market for SMPs. Some SMPs in the BER are already committed to exploring this market to develop containerships. For example, in Yingkou, three newly-developed sea-rail express routes with two days a shift are operated by COSCO, while the neighboring gateway ports o f Dalian manage two routes and one o f them is in a daily shift. Besides, Rizhao port also tries to develop such intermodal transportation to seek a more competitive position in logistics system o f the BER.
Overall, we can conclude some typical characteristics in describing the profile o f SMPs in the BER, and ports with annual cargo volume of less than 150 million tons are defined as SMPs (Table 12). Most SMPs in the BER are driven by domestic trade cargoes and competitive in bulk cargo market. Consequently, the less dependence on the world spoke & hub system retains SMPs to niche markets. Compared to the gateway ports, the market shares o f those SMPs are increasing rapidly, and in specific regions, this fast market expansion even challenges the dominant position of neighboring gateway ports. To enhance or maintain the competitive position, some SMPs may choose agglomerations that contribute to port networking in such regions and we found more cooperation in between SMPs. When studying correlations between SMPs and port city/ hinterland, we found less connection between ports city GDP growth and throughput, and the freight o f SMPs may depend more on extensive hinterland and connection with inland ports.
However, the medium-sized ports differ from small ports. The peripheral challenge by SMPs refers to medium-sized ports only as there is no evidence that small ports can form direct competition on medium-sized port or gateways ports.
6. CONCLUSION
Difference between SMPs and gateway ports concerns not only the size of a port but endogenous heterogeneity. Every big port has experienced the start-up stage and evolves into the centrality position but not all the SMPs can grow into large ports. The main reason is how SMPs survive and maintain their competitive advantage in the highly competitive multi-port gateway regions. Some SMPs retain their capacity in specific niche markets or undertake transshipment to avoid competition from the hub ports. While other SMPs that intend to challenge the dominant position o f gateway ports dem onstrate the similarities. Firstly, port classification regarding part o f SMPs and gateway ports is o f clear divisional function. And they are either international trade or domestic commerce driven. In other words, relation between SMPs and gateway ports is more like ‘■‘complements”. Moreover, this relationship contributes to the relatively stable status in a multi-port gateway region and leaves enough space for development o f SMPs. Secondly, with the rise o f individual SMPs, this “complements” relation evolves into “substitutes”, and gateway ports capture cargoes previously predominated by SMPs. This competition, to some extent, may result in vicious circle and overcapacity as both competitors are expanding port sizes rapidly when they seek the economies o f scale. The other risk is that this escalating competition will undermine the complete logistics system and reduce the whole region’s competitiveness in terms o f logistics efficiency in confronting with the external challenges. The rest SMPs will choose to either maintain in their niche markets or cooperate with leading ports that will trigger the port consolidation and bring synergy effect. Therefore, the competition system in such multi-port gateway regions will evolve into a more dynamic and growing port cluster, in which, SMPs act like nodes connecting relevant stakeholders.
The three-level port classification by employing m ultidimension variable methods provides an in-depth analysis into the ports categories, and can be employed to describe the profile o f SMPs, m ainly from the role o f SMPs in a competitive context. The further research will focus more on internal operation management o f SMPs, for example, how to evaluate SMPs’ performance, institutional factor on their developments, SMPs’ role on enhancing multi-port gateway region’s competiveness, etc. The purpose is to find a compound research method to assess SMPs. Another issue concerned is
Tab. 12. Characteristics o f SMPs and hub ports in the BER
Characteristics SMPs gateway ports
Port size Medium size: cargo volume o f 150-300 million tons Small size: cargo volume o f less than 150 million tons Cargo volume o f over 300 million tons
Port classification Domestic trade driven International trade drivenCargo Bulk Container
Market share Increasing Stable to decreasingWorld spoke & hub system Less connected Connected
Port-city Less correlated Correlatedlogistics system Inland port connection Logistics parkPort networking Co-petition Competition
Intermodality Less connected connected
P O L IS H M A R IT IM E R E S E A R C H , Special Issue 2013 S1 65

Peripheral challenge by Small and Medium Sized Ports (SMPs) in Multi-Port Gateway Regions:the case study o f northeast o f China
the generalized application study on more SMPs worldwide that needs exploring more cases studies, especially in more extremely different regions.
The above characteristics for SMPs in the BER may change because o f two factors: decrease o f international trade due to volatile global economy and future free trade zone between Korea, Japan and China. The decline o f international trade may force hub ports to switch to domestic trade and competition between hub ports and SMPs will change as well. The other factor is the proceeding o f the free trade zone (FTZ) between neighboring three countries of China, South Korea and Japan. If FTZ is established, on the one hand, all ports will receive more cargoes and benefit from more convenient cargoes transferring. In other words, the overall throughput and port attractiveness in the north o f Asia will improve, but both SMPs and hub ports in the north o f China will face competition from Korea and Japan so that the previous port relations will be broken and the competition will surpass the current boundary restriction.
REFERENCES
1. Bichou, K. and Gray, R. (2005) ‘A critical review of conventional terminology for classifying seaports’, Transportation Research A , Vol. 39 No. 1, pp.75-92
2. De Langen, P. (2004) ‘Governance in Seaport Clusters’,Maritime Economics & Logistics,Vol. 6, pp.141-156
3. Ding, D., Koay, P. Y., and Teo, C.-P. (2009) ‘Port’s growth:Does size matter? 'Proceedings o f the Asia Pacific Maritime Conference Presentation, Singapore, pp. 1-33
4. Feng, L., and Notteboom, T. (2011), Small and Medium-Sized Ports (SMPs) in Multi-Port Gateway Regions:the Role of Yingkou in the Logistics System of the Bohai Sea, Current Issues in Shipping, Ports and Logistics, ASP: Brussels, pp.543- 563
5. Freight mobility and intermodal connectivity in China, International technology scanning program, ITSP, U.S. Department of Transportation, 2008
6. Fujita, M. and Mori, T. (1996) “the role of ports in the making of major cities: self-agglomeration and hub-effect”, Journal o f development economics, 49:93-120
7. Guo, S.H., Lin, Z.J., Hong, X.Q., She, R.X. (2009) ‘On the application of composite index method based on entropy authority to the water quality evaluation’ .Environmental Science and Management, Vol. 34 No. 12, pp.165-167
8. Li, Y.H., Hu, Y.Q. (2006) ‘A model of multilevel fuzzy comprehensive evaluation for investment risk of high and new technology project’, Proceedings o f2006International Conference on Machine Learning and Cybernetics, China, pp.1942-1947
9. Liang, Z.H., Yang, K., Sim, Y.W., Yuan, J. H„ Zhang, H.W. and Zhang, Z. H. (2006)‘Decision support for choice optimal power generation projects: Fuzzy comprehensive evaluation model based on the electricity market’. Energy Policy, Vol. 34, pp.3359-3364
10.Lini, T. C., Thanopoulou, H. A., Beynon, M. J., Beresford,A. K. C. (2004) ‘An application of AHP on transhipment port selection: a global perspective’, MaritimeEconomics & Logistics, Vol. 6, pp.70-91
11.Nijdam, M. (2010) ‘Leader finns: the value of companies for the competitiveness of the Rotterdam seaport cluster ’ ,ERLMPhD Series in Research in Management, No. 216, EUR:Rotterdam
12.Notteboom, T. (2005) ‘The peripheral port challenge in container port systems’, in Leggate, H., Mcconville, J.,Morvillo, A. (Eds.), International Maritime Transport: Perspectives, Routledge, London, pp.173-188
13.Notteboom, T. (2010) ‘Concentration and the fonnation of multi-port gateway regions in the European container port system: an update’. Journal o f Transport Geography, Vol. 18 No. 4, pp.567-583
14.Notteboom, T. (2011) ‘An application of multi-criteria analysis (MCA) to the location of a container hub port in South Africa’, Maritime Policy and Management, Vol. 38, No. 1, pp. 51-79
15.Notteboom, T., Rodrigue, J.-P. (2005) ‘Port regionalization: towards a new phase in port development’, Maritime Policy and Management, Vol. 32 No. 3, pp.297-313
lô.Notteboom, T., Rodrigue, J.-P. (2009) ‘Inland terminals within North American and European supply chains’, Transport and Communications Bulletin for Asia and the Pacific, UN ESCAP, No. 78, pp. 1-39
17.Notteboom, T., Winkelmans, W. (2001) ‘Structural changes in logistics: how will port authorities face the challenge?’ Jrfaritime Policy and Management, Vol. 28 No. 1, pp. 71-89
18.Pallis, A., Vitsoimis, T., De Langen, P., Notteboom, T.(2011) ‘Port Economics, Policy and Management: Content Classification and Survey’, Transport Reviews, Vol. 31 No. 4, pp.445-471
19.QÍ, X., and Han, Z. L., (2005), “Major ports logistics efficiency analysis in Liaoning, China”, Ocean Development and Management, pp.22-26
20.Robinson, R. (2002) ‘Ports as elements in value-driven chain systems: the new paradigm’. Maritime Policy and Management, Vol. 29 No. 3, pp. 241-255
21.Roso, V., and Lévçque, P. (2002), ‘dry port concept for seaport inland access with intermodal solutions,’ master thesis,Chalmers University of Technology, Gothenburg
22.Slack, B., Wang, J.J. (2002) ‘The challenge of peripheral ports: an Asian perspective’, Geojournal, Vol. 65 No. 2, pp.159-166
23.Talley, W.K, (2009), ‘Port Economics’, Routledge, Oxon, UK, pp. 136-143
24.Wang, C.J., WANG J., and Ducret, C. (2012), Peripheral Challenge in Container Port System: A Case Study of Pearl River Delta, Clini. Geogra. Sei., pp. 97-108
25.Wilmsmeier, G., Bergqvist, R., Cullinane, K. (2011),‘Special Issue: Ports and hinterland - Evaluating and managing location splitting’, Research in Transportation Economics, Vol. 33 No. 1, pp.1-5
26.Zhang, A. (2009) ‘The Impact of Hinterland Access: Conditions on Rivalry between Ports’, inOECD/ITF (Ed.), Port Competition and Hinterland Connections, Round Table no. 143, OECD - International Transport Forum (ITF), Paris, pp.129-160
27.Zhao, Y.F., Chen, J.F. (2004) ‘Analytic hierarchy process and its application in power system’, Electric Power Automation Equipment, Vol. 24 No. 9, pp.85-88
CONTACT WITH THE AUTHORS
Lin Feng*, Ph.D., Lecturer Dalian Maritime University (China)
1#, Linghai Road, Hi-tech zone, Dalian, China, 116023 and
ITMMA - University o f Antwerp (Belgium) e-mail: [email protected]
Theo Notteboom, Ph.D., Professor and President, ITMMA - University o f Antwerp (Belgium)
Kipdorp 59, BE-2000 Antwerp, Belgium and
Antwerp Maritime Academy (Belgium) e-mail: [email protected]
* Corresponding author
66 P O L IS H M A R IT IM E R E S E A R C H , Special Issue 2013 S1