peripheral arterial disease education and abi training for vascular nurses presented by the society...
TRANSCRIPT

Peripheral Arterial Disease Education and ABI Training for Vascular NursesPresented by The Society for Vascular Nursing
Comprehensive In-Service Lecture Kit Supported by an educational grant from
Bristol-Myers Squibb/Sanofi Partnership

PERIPHERAL ARTERIAL DISEASE Education and ABI Training for Vascular Nurses A Train the Trainer Program
The Ankle Brachial Index: The Key to Early Detection and Management of Peripheral Arterial Disease

Acknowledgements
Course Development– ABI Registry Task Force
Diane Treat-Jacobson, Ph.D., R.N.Carolyn Robinson MSN, RN, CNP,CVNMarge Lovell RN, CCRC, CVN, BEdPatricia Lewis, MS, FNP, CVNM. Kate Schmidt, BSN, RN, CVN
Contact InformationSociety for Vascular Nursing203 Washington St., PMB 311Salem, MA 01970888-536-4786; 978-744-5005; Fax: 978-744-
5029

Peripheral Arterial Diseaseand Claudication
Peripheral Arterial Disease (PAD)A disorder caused by atherosclerosis that limits blood flow to the limbs
Claudication A symptom of PAD characterized by pain, aching, or fatigue in working skeletal muscles. Claudication arises when there is insufficient blood flow to meet the metabolic demands in leg muscles of ambulating patients
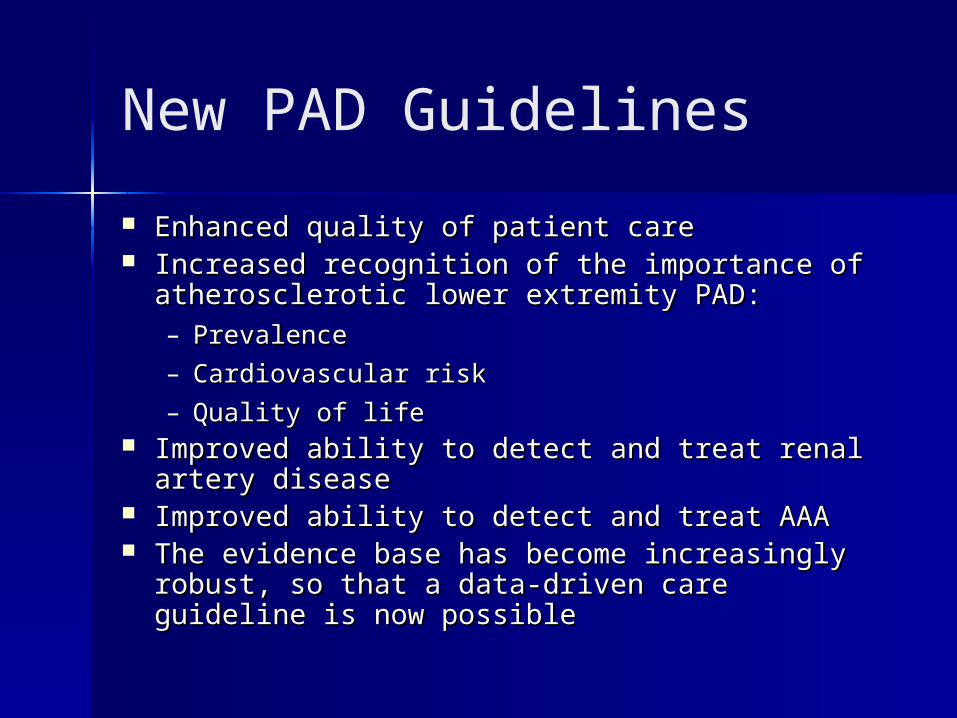
New PAD Guidelines
Enhanced quality of patient careEnhanced quality of patient care Increased recognition of the importance of Increased recognition of the importance of
atherosclerotic lower extremity PAD:atherosclerotic lower extremity PAD:– PrevalencePrevalence
– Cardiovascular riskCardiovascular risk
– Quality of lifeQuality of life Improved ability to detect and treat renal artery Improved ability to detect and treat renal artery
diseasedisease Improved ability to detect and treat AAAImproved ability to detect and treat AAA The evidence base has become increasingly The evidence base has become increasingly
robust, so that a data-driven care guideline is robust, so that a data-driven care guideline is now possiblenow possible
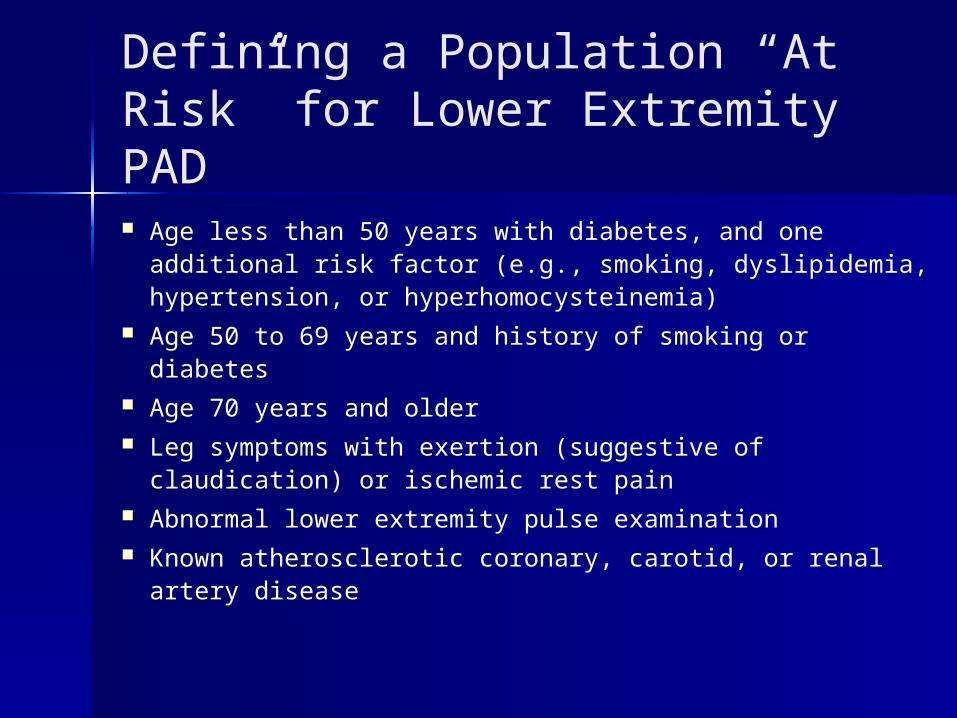
Defining a Population “At Risk” for Lower Extremity PAD
Age less than 50 years with diabetes, and one additional risk factor (e.g., smoking, dyslipidemia, hypertension, or hyperhomocysteinemia)
Age 50 to 69 years and history of smoking or diabetes Age 70 years and older Leg symptoms with exertion (suggestive of
claudication) or ischemic rest pain Abnormal lower extremity pulse examination Known atherosclerotic coronary, carotid, or renal
artery disease
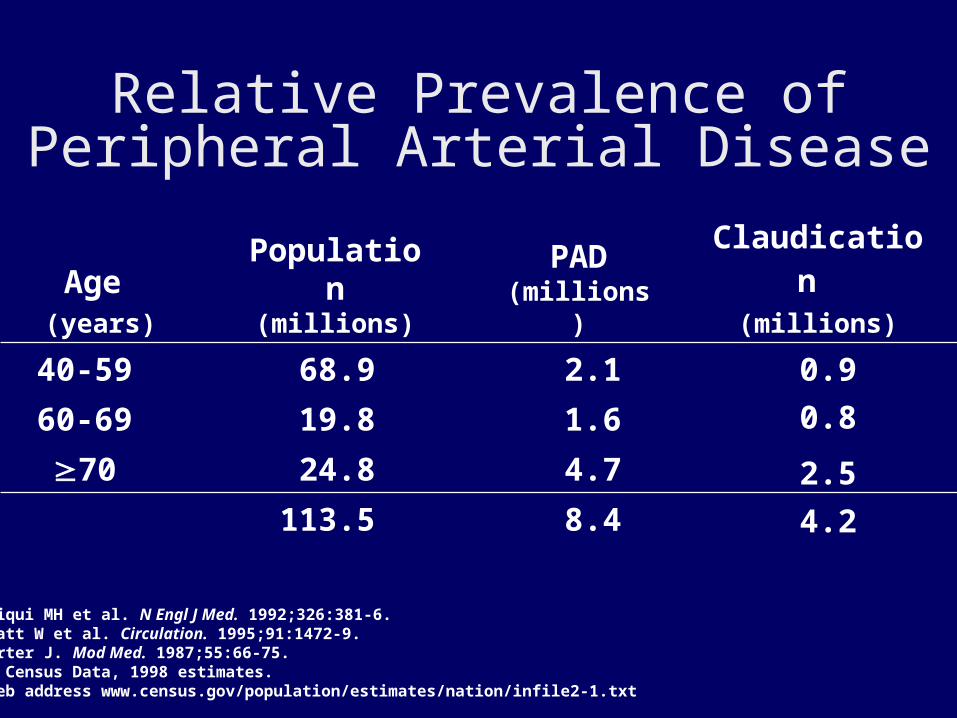
Relative Prevalence of Peripheral Arterial Disease
Criqui MH et al. N Engl J Med. 1992;326:381-6.Hiatt W et al. Circulation. 1995;91:1472-9.Porter J. Mod Med. 1987;55:66-75.US Census Data, 1998 estimates. Web address www.census.gov/population/estimates/nation/infile2-1.txt
4.28.4113.52.54.724.870
0.81.619.860-69
0.92.168.940-59
Claudication
(millions)PAD
(millions)
Population (millions)
Age
(years)

Systemic Manifestations of Atherosclerosis
•TIA• Ischemic stroke
• Claudication
• Critical limb ischemia, rest pain, gangrene, amputation
• Renovascular hypertension
• Erectile dysfunction
•TIA• Ischemic stroke•TIA• Ischemic stroke
• Myocardial Infarction• Unstable angina pectoris

0% 5% 10% 15% 20% 25% 30% 35%
29%
11.7%
19.8%
19.1%
14.5%
4.3%
Prevalence of PADPrevalence of PAD
PARTNERS5
Aged >70 years, or 50–69 years with a history diabetes or smoking
San Diego2
Mean age 66 years
Diehm4
Aged 65 years
Rotterdam3
Aged >55 years
NHANES1
Aged 70 years
NHANES1
Aged >40 years
NHANES=National Health and Nutrition Examination Study; PARTNERS=PAD Awareness, Risk, and Treatment: New Resources for Survival [program].1. Selvin E, Erlinger TP. Circulation. 2004;110:738-743.2. Criqui MH et al. Circulation. 1985;71:510-515.3. Diehm C et al. Atherosclerosis. 2004;172:95-105. 4. Meijer WT et al. Arterioscler Thromb Vasc Biol. 1998;18:185-192. 5. Hirsch AT et al. JAMA. 2001;286:1317-1324.
In a primary care population defined by age and common risk
factors, the prevalence of PAD was
approximately one in three patients
1. Meijer WT, et al. Arterioscler Thromb Vasc Biol. 1998;18:185-192. 2. Criqui MH, et al. Circulation. 1985;71:510-515.
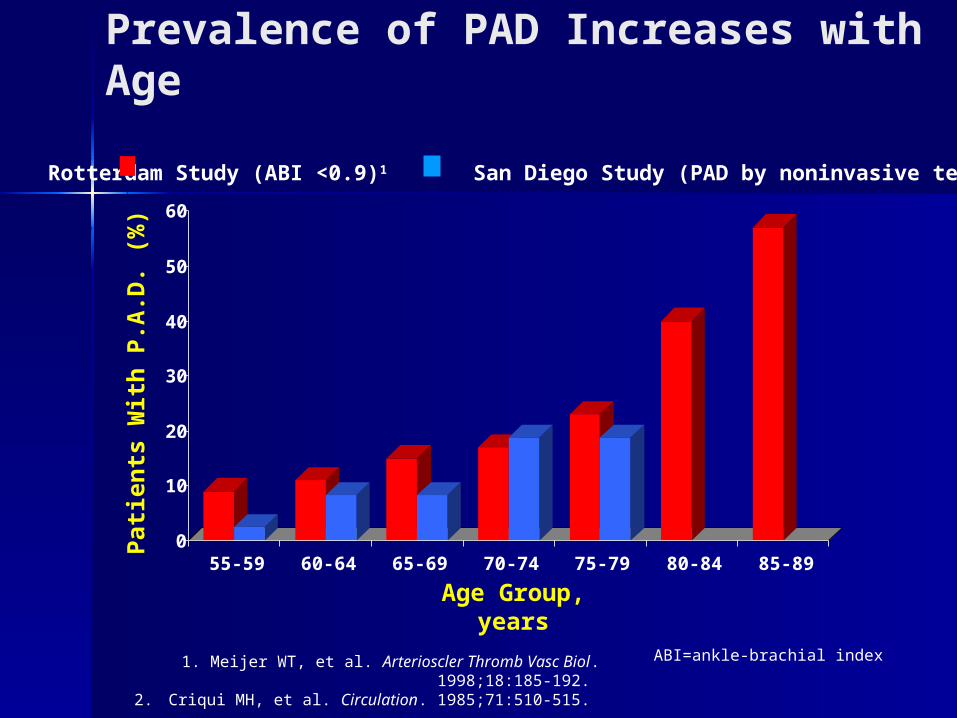
Prevalence of PAD Increases with Age
Rotterdam Study (ABI <0.9)1 San Diego Study (PAD by noninvasive tests)2
0
10
20
30
40
50
60
Pat
ien
ts W
ith
P.A
.D.
(%)
55-59 60-64 65-69 70-74 75-79 80-84 85-89
Age Group, years
ABI=ankle-brachial index
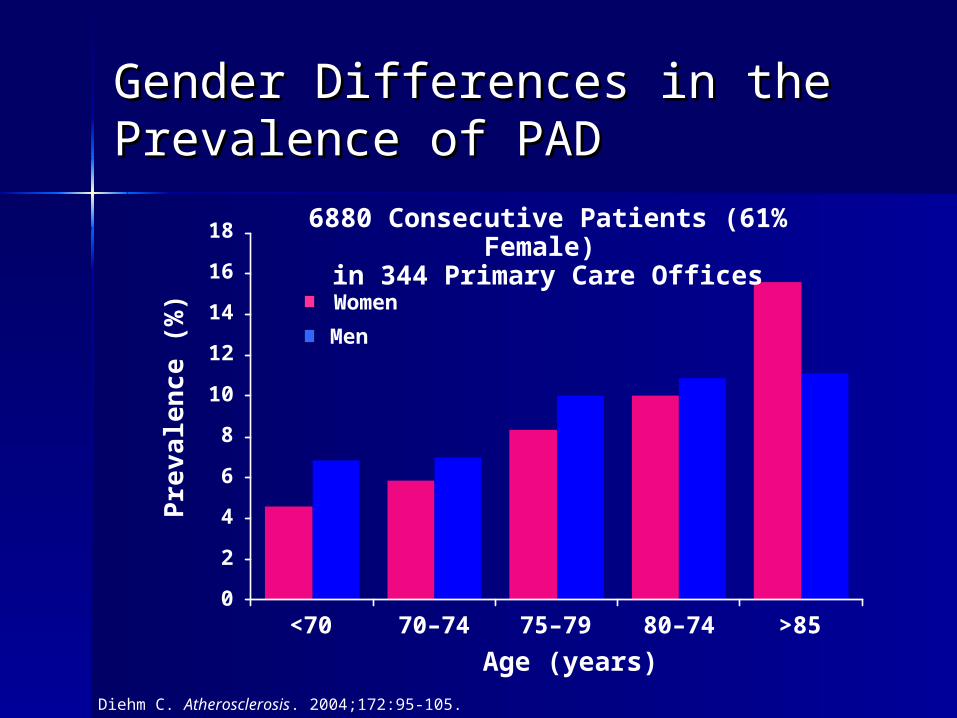
Gender Differences in the Gender Differences in the Prevalence of PADPrevalence of PAD
Diehm C. Atherosclerosis. 2004;172:95-105.
Pre
vale
nce (
%) Women
Men
6880 Consecutive Patients (61% Female)
in 344 Primary Care Offices
<700
2
4
6
8
10
12
14
16
70–74 75–79 80–74 >85
Age (years)
18

Diabetes Increases Risk of PADDiabetes Increases Risk of PAD
22.4*19.9*
12.5
0
5
10
15
20
25
Normal glucosetolerance
Impaired glucose tolerance
Diabetes
Pre
vale
nce o
f P
AD
(%
)
Impaired Glucose Tolerance was defined as oral glucose tolerance test value ≥140 mg/dL but <200 mg/dL.*P.05 vs normal glucose tolerance. Reprinted with permission from Lee AJ et al. Br J Haematol. 1999;105:648-654. www.blackwell-synergy.com

Ethnicity and PAD:Ethnicity and PAD:The San Diego Population StudyThe San Diego Population Study
NHW Black Hispanic Asian0
1
2
3
4
5
6
7
8
9
10
% P
AD
NHW = Non-hispanic white Criqui et al. Circulation. 2005: 112: 2703-2707.
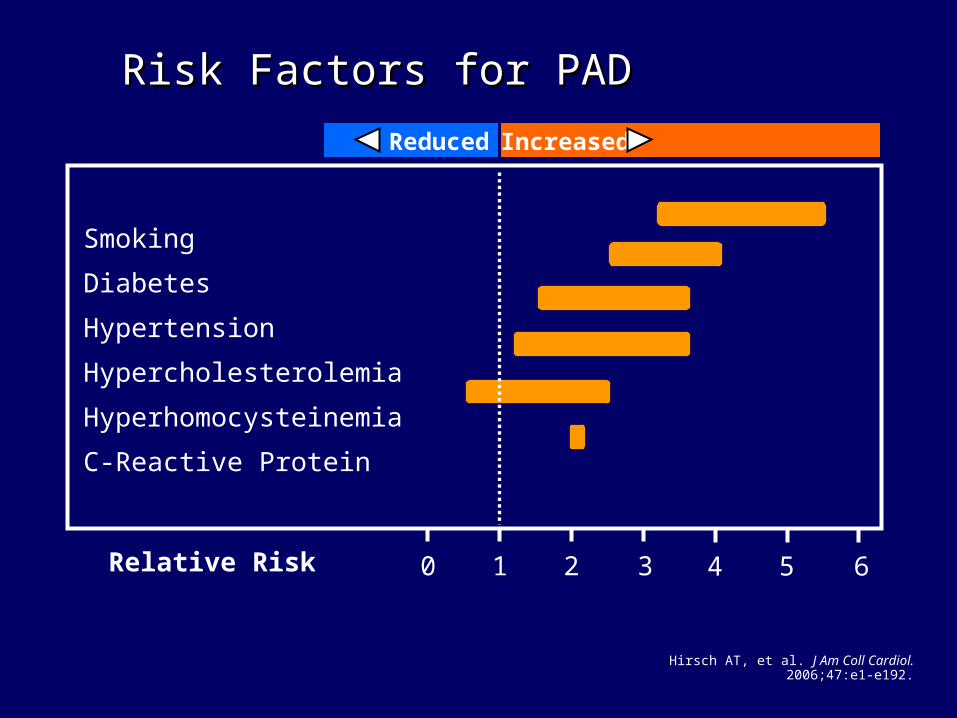
Hirsch AT, et al. J Am Coll Cardiol. 2006;47:e1-e192.
Relative Risk
Smoking
Diabetes
Hypertension
Hypercholesterolemia
Hyperhomocysteinemia
C-Reactive Protein
Reduced Increased
Risk Factors for PADRisk Factors for PAD
1 2 3 4 5 60
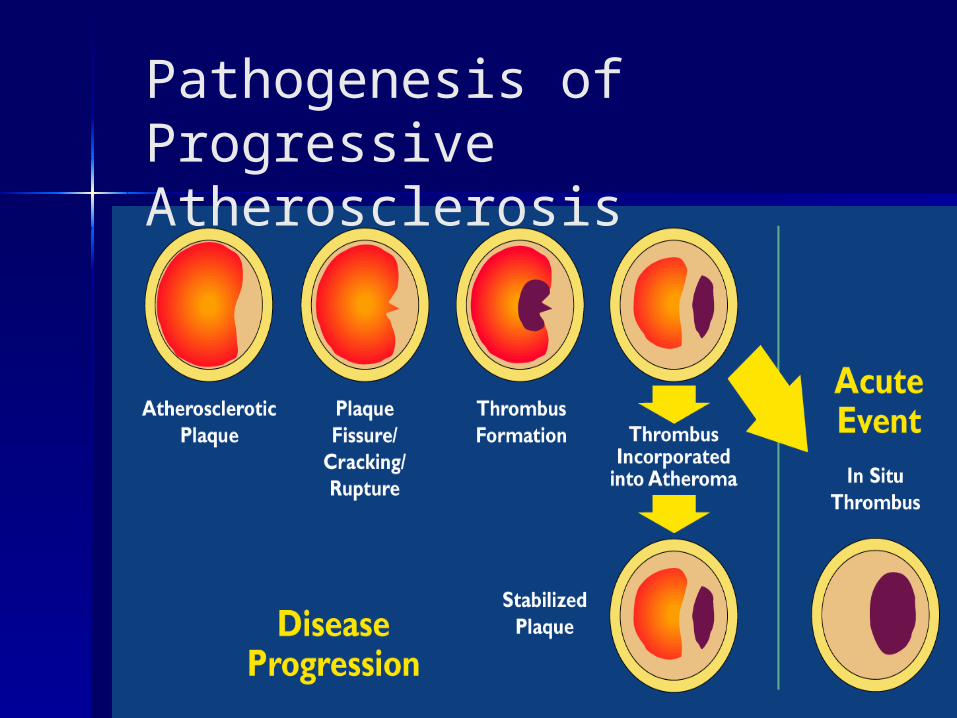
Pathogenesis ofProgressive Atherosclerosis
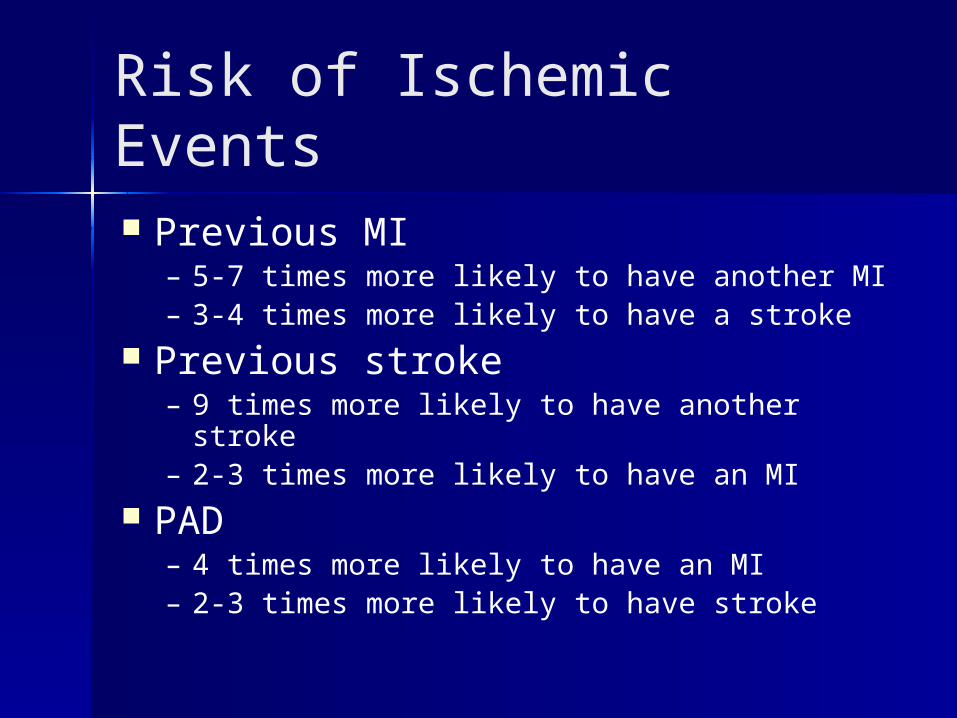
Risk of Ischemic Events
Previous MI – 5-7 times more likely to have another MI– 3-4 times more likely to have a stroke
Previous stroke– 9 times more likely to have another stroke– 2-3 times more likely to have an MI
PAD– 4 times more likely to have an MI– 2-3 times more likely to have stroke

Long-term Survival in Patients With Long-term Survival in Patients With PADPAD
Criqui MH et al. N Engl J Med. 1992;326:381-386. Copyright © 1992 Massachusetts Medical Society. All rights reserved.
Normal subjects
Asymptomatic PAD
Symptomatic PAD
Severe symptomatic PAD
100
75
50
25
0 2 4 6 8 10 12
Su
rviv
al (%
)
Year

Contemporary PADContemporary PADRates of Myocardial Infarction and Rates of Myocardial Infarction and DeathDeath
0
10
20
30
40
50
MI Death
No PAD Asymptomatic PAD Symptomatic PAD
%
Hooi JD, et al. J Clin Epid. 2004;57:294–300.
3649 subjects (average age 64 yrs) followed up for 7.2 years
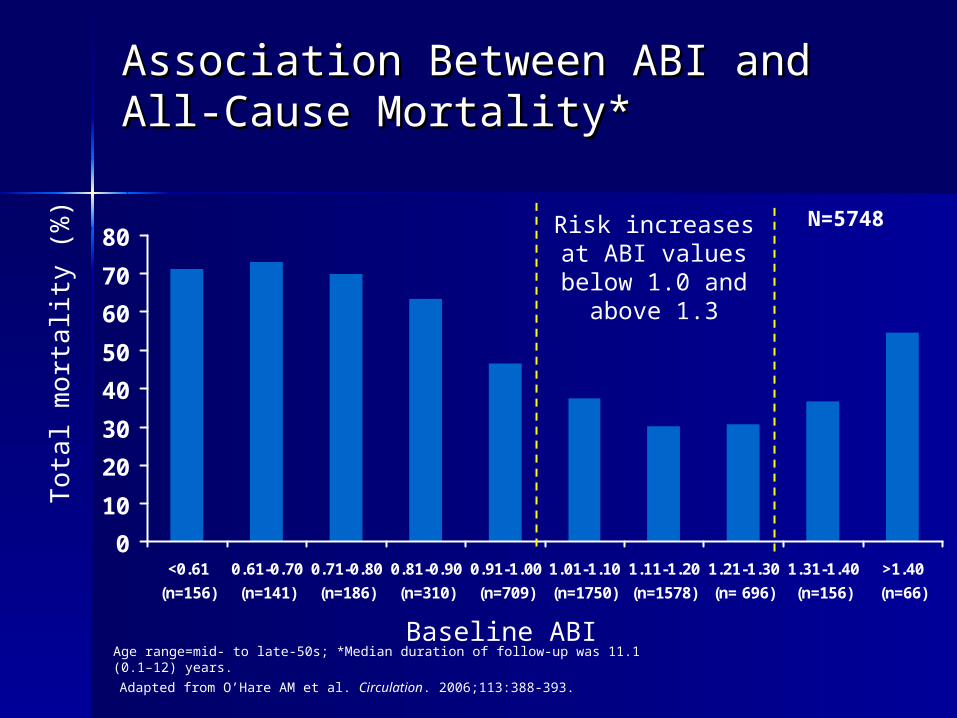
Association Between ABI and Association Between ABI and All‑Cause Mortality*All‑Cause Mortality*
0
10
20
30
40
50
60
70
80
<0.61
(n=156)
0.61-0.70
(n=141)
0.71-0.80
(n=186)
0.81-0.90
(n=310)
0.91-1.00
(n=709)
1.01-1.10
(n=1750)
1.11-1.20
(n=1578)
1.21-1.30
(n= 696)
1.31-1.40
(n=156)
>1.40
(n=66)
Baseline ABI
Tota
l m
ort
alit
y (
%)
Age range=mid- to late-50s; *Median duration of follow-up was 11.1 (0.1–12) years.
Adapted from O’Hare AM et al. Circulation. 2006;113:388-393.
N=5748Risk increases at ABI values below 1.0 and above 1.3
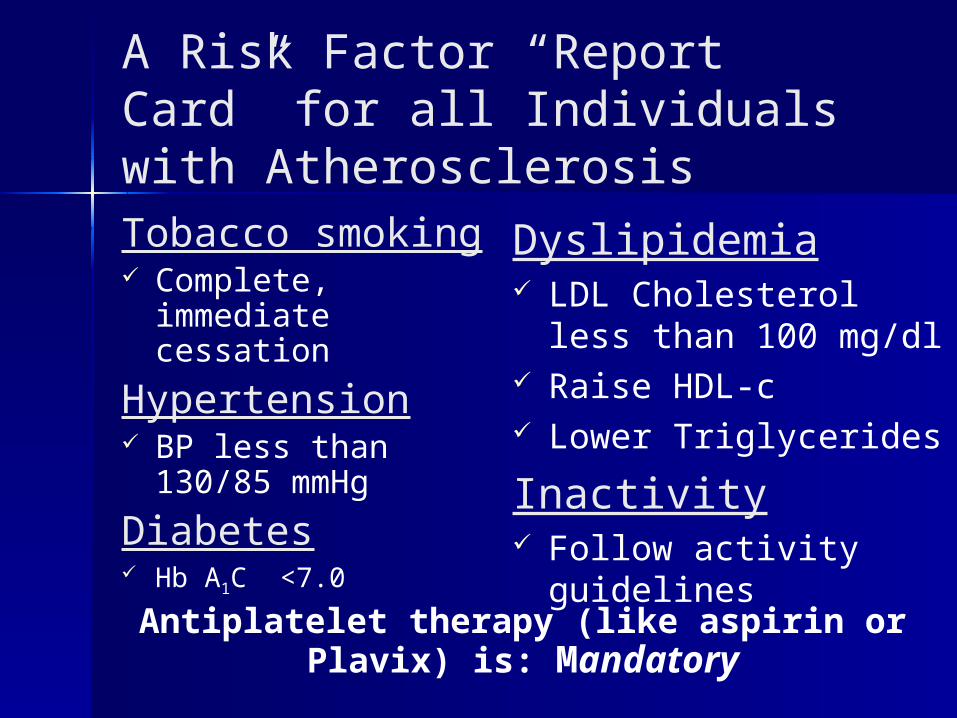
A Risk Factor “Report Card” for all Individuals with AtherosclerosisTobacco smoking Complete,
immediate cessation
Hypertension BP less than 130/85
mmHg
Diabetes Hb A1C <7.0
Dyslipidemia LDL Cholesterol less
than 100 mg/dl Raise HDL-c Lower Triglycerides
Inactivity Follow activity
guidelinesAntiplatelet therapy (like aspirin or Plavix) is:
Mandatory
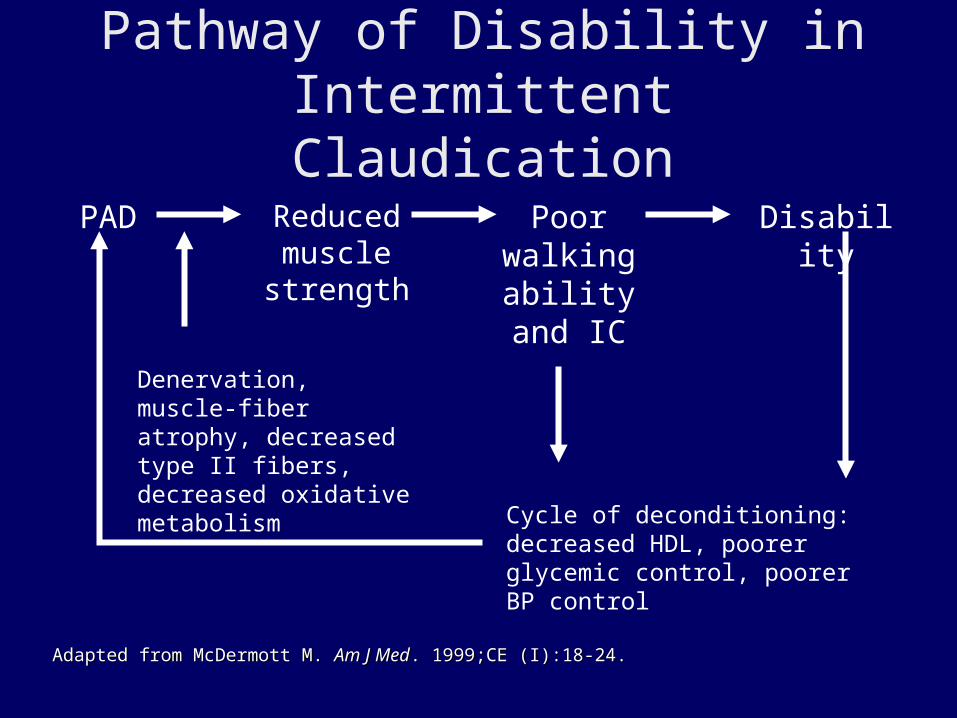
Pathway of Disability in Intermittent Claudication
Adapted from McDermott M. Adapted from McDermott M. Am J MedAm J Med. 1999;CE (I):18-24. . 1999;CE (I):18-24.
PAD Reduced muscle
strength
Poor walking ability and IC
Disability
Denervation, muscle-fiber atrophy, decreased type II fibers, decreased oxidative metabolism
Cycle of deconditioning: decreased HDL, poorer glycemic control, poorer BP control

Impact of PAD on Quality of Life
PAD Diagnosis and Management Symptom Experience Limitation in Physical Functioning Limitation in Social Functioning Compromise of Self Uncertainty Adaptation

No. of people
30 34 38 40 50 55
CHFChronic
lung disease
Average adult
Average well adult
36
Intermittent claudication
Physical Component Summary Score
SF-36 Scores in Health and Disease

Location of Obstruction Influences Symptoms
Buttock, hip,Buttock, hip,thighthigh
Thigh, Thigh, calfcalf
Calf, ankle,Calf, ankle,footfoot
Obstruction in:Aorta orAorta oriliac arteryiliac artery
Femoral arteryFemoral arteryor branchesor branches
PoplitealPoplitealarteryartery
Claudication in:

Claudication: A Symptom of Peripheral Arterial Disease
Exertional aching pain, cramping, tightness, fatigue
Occurs in muscle groups, not joints (buttocks, hips, legs, calves)
Reproducible from one day to the next on similar terrain
Resolves completely with rest Occurs again at the same distance once
activity has been resumed
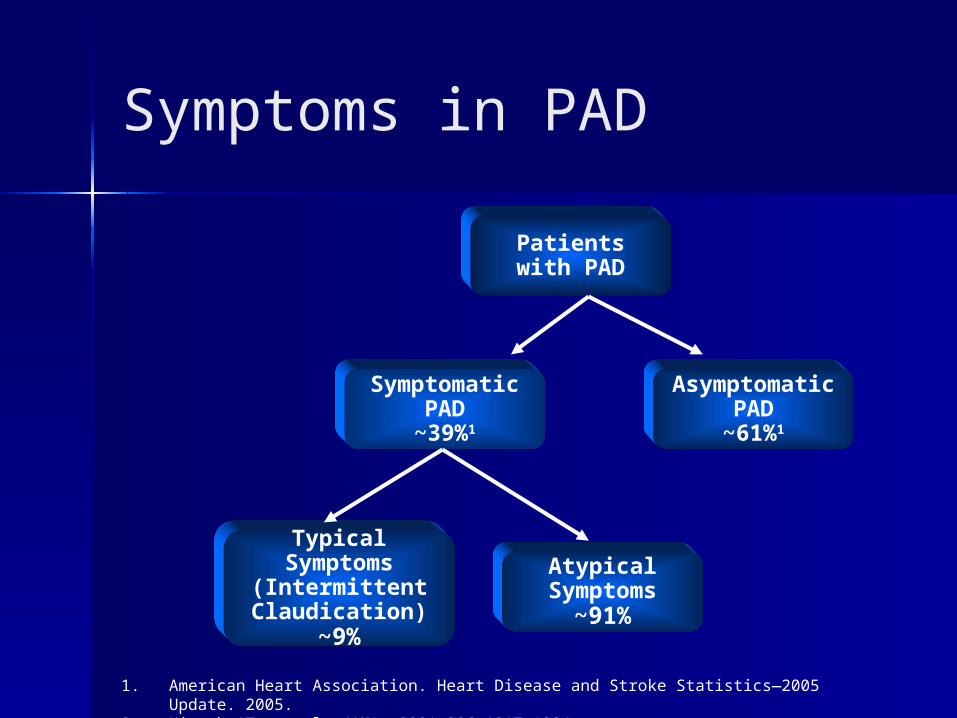
Symptoms in PAD
Patients with PAD
Symptomatic PAD
~39%1
Asymptomatic PAD
~61%1
Typical Symptoms(Intermittent Claudication)
~9%
Atypical Symptoms
~91%
1. American Heart Association. Heart Disease and Stroke Statistics—2005 Update. 2005.2. Hirsch AT, et al. JAMA. 2001;286:1317-1324.

Clinical Assessment of Peripheral Arterial Disease

Components of Clinical Assessment Complete history
– Risk factor assessment– Activity assessment
Review of medications Physical examination
– Inspection of lower extremities– Pulse exam
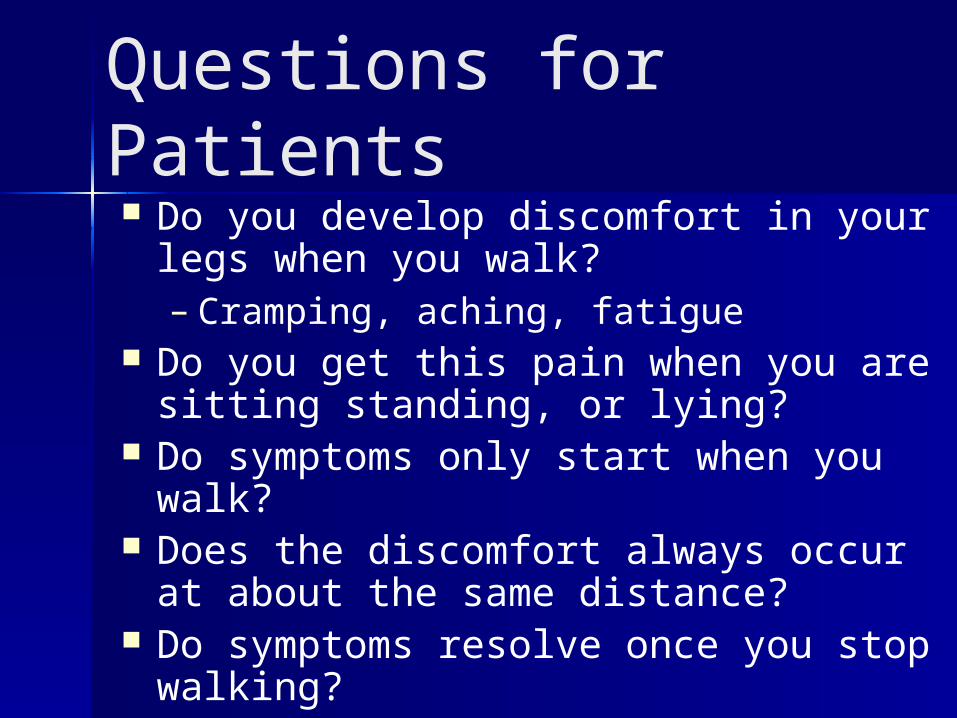
Questions for Patients Do you develop discomfort in your
legs when you walk? – Cramping, aching, fatigue
Do you get this pain when you are sitting standing, or lying?
Do symptoms only start when you walk?
Does the discomfort always occur at about the same distance?
Do symptoms resolve once you stop walking?
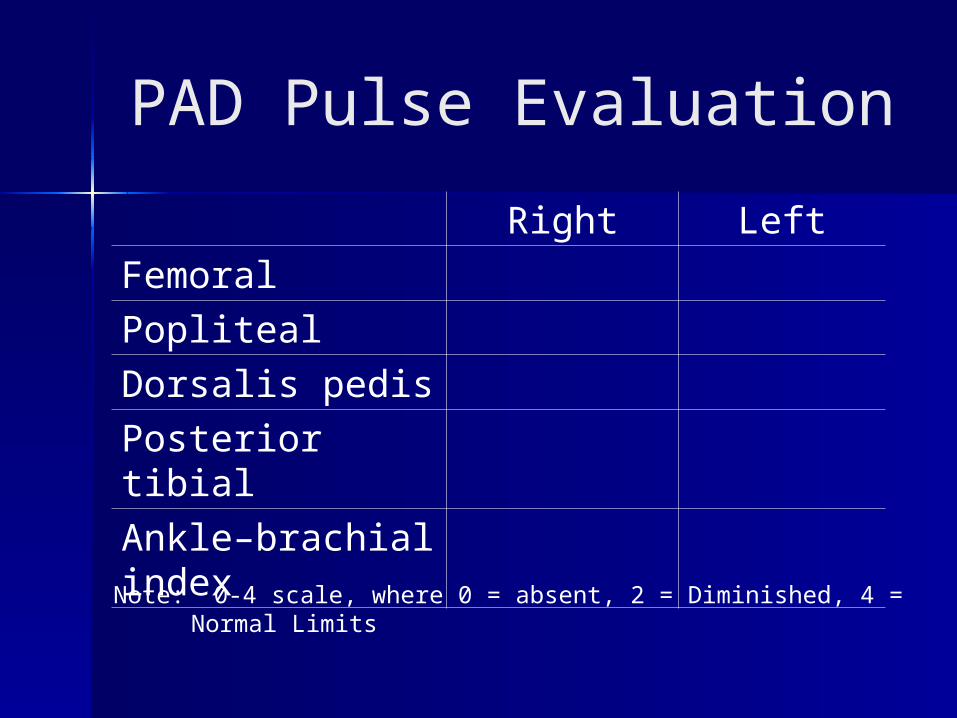
PAD Pulse Evaluation
Right Left
Femoral
Popliteal
Dorsalis pedis
Posterior tibial
Ankle–brachial index
Note: 0-4 scale, where 0 = absent, 2 = Diminished, 4 = Normal Limits
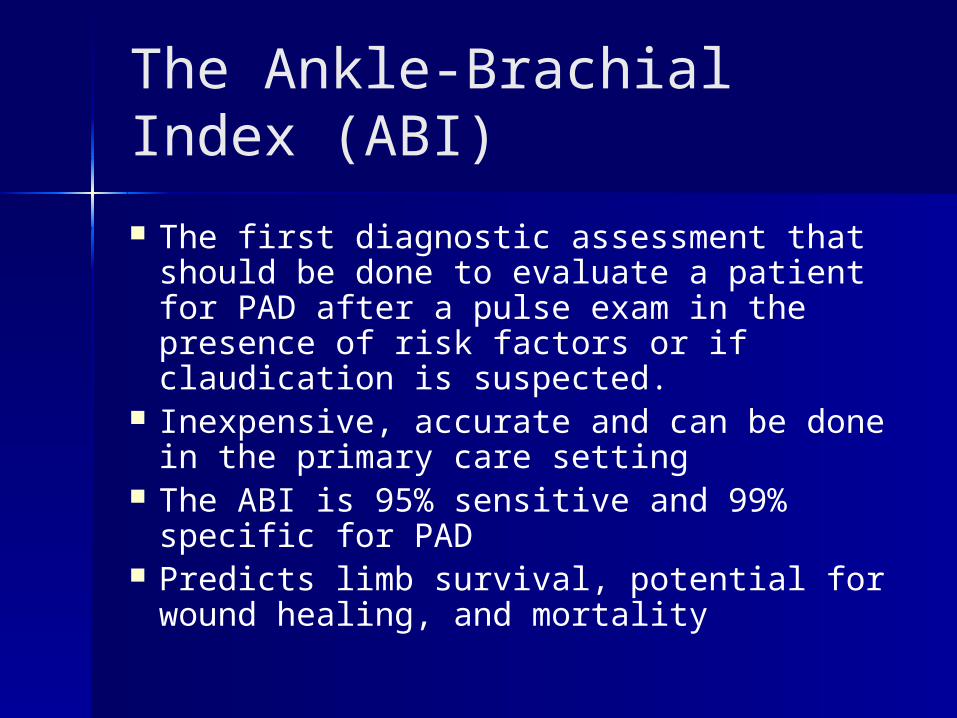
The Ankle-Brachial Index (ABI)
The first diagnostic assessment that should be done to evaluate a patient for PAD after a pulse exam in the presence of risk factors or if claudication is suspected.
Inexpensive, accurate and can be done in the primary care setting
The ABI is 95% sensitive and 99% specific for PAD
Predicts limb survival, potential for wound healing, and mortality

The Ankle-Brachial Index (ABI)
Indicated– In the absence of palpable pulses,
or if pulses are diminished– In the presence or suspicion of
claudication, foot pain at rest, or a non-healing foot ulcer
– Age greater than 70 years of age, >50 years with risk factors (diabetes, smoking)

Concept of ABIConcept of ABI
ABI has been found to be 95% sensitive and 99% specific for angiographically diagnosed PAD.
The systolic blood pressure in the leg should be approximately the same as the systolic blood pressure in the arm.
Therefore, the ratio of systolic blood pressure in the leg vs the arm should be approximately 1 or slightly higher.
Adapted from Weitz JI, et al. Circulation. 1996;94:3026-3049.
Arm pressure
Leg pressure
÷ ≈ 1
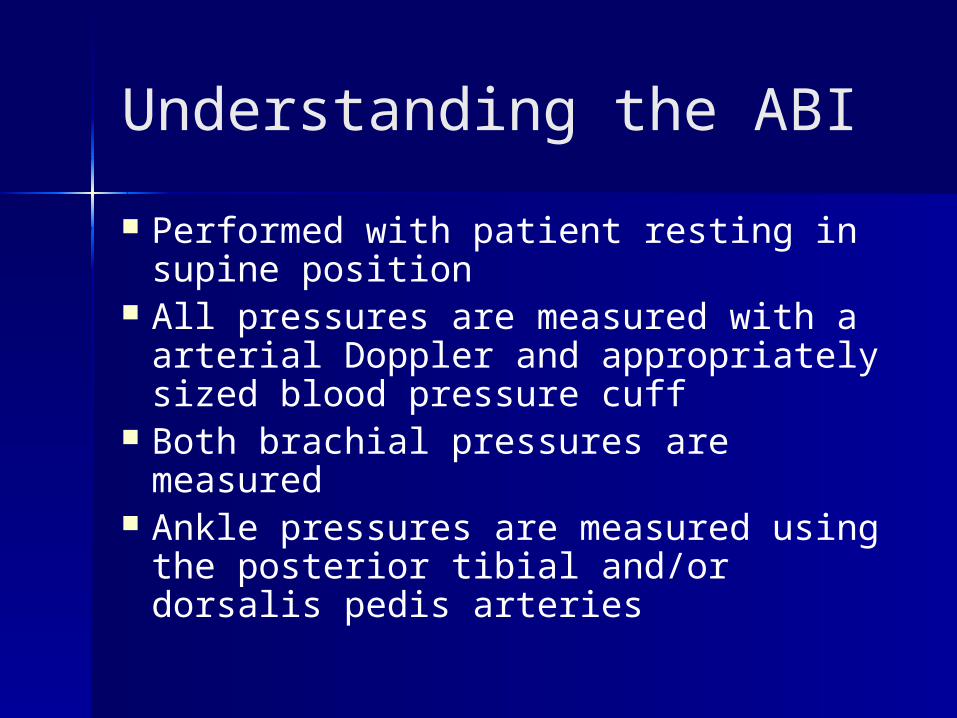
Performed with patient resting in supine position
All pressures are measured with a arterial Doppler and appropriately sized blood pressure cuff
Both brachial pressures are measured Ankle pressures are measured using
the posterior tibial and/or dorsalis pedis arteries
Understanding the ABI
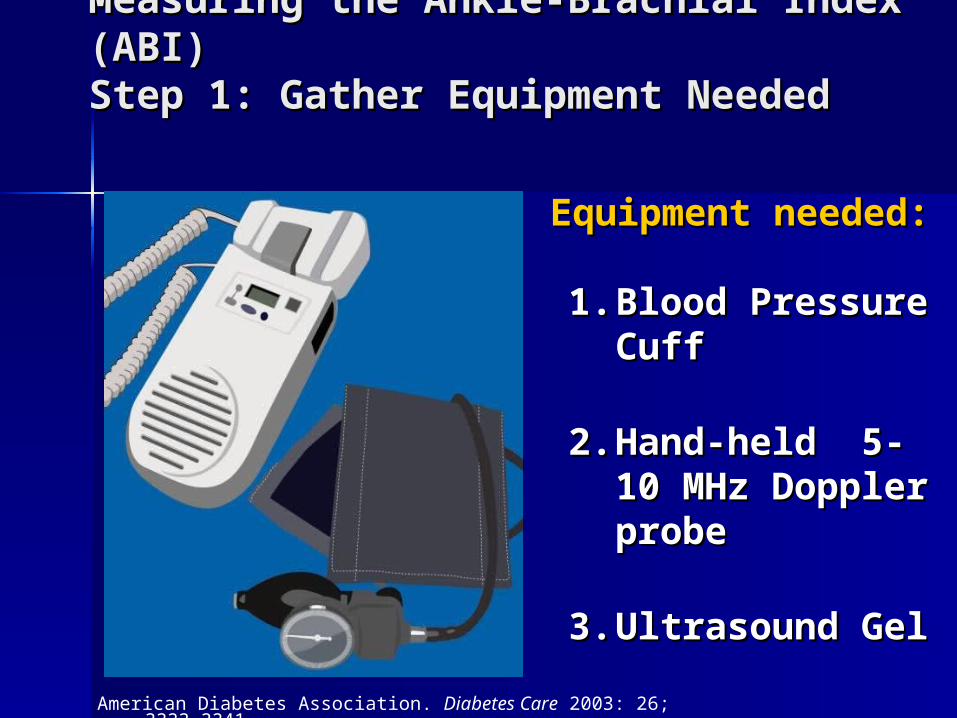
Equipment needed:Equipment needed:
1.1. Blood Pressure Blood Pressure CuffCuff
2.2. Hand-held 5-10 Hand-held 5-10 MHz Doppler MHz Doppler probeprobe
3.3. Ultrasound GelUltrasound Gel
American Diabetes Association. Diabetes Care 2003: 26; 3333–3341.
Measuring the Ankle-Brachial Index Measuring the Ankle-Brachial Index (ABI)(ABI)Step 1: Gather Equipment NeededStep 1: Gather Equipment Needed

Measuring the Ankle-Brachial Index Measuring the Ankle-Brachial Index (ABI)(ABI)Step 2: Position the PatientStep 2: Position the Patient
Place patient Place patient in supine in supine position for position for 5 – 10 minutes 5 – 10 minutes minutesminutes
American Diabetes Association. Diabetes Care 2003: 26; 3333–3341.
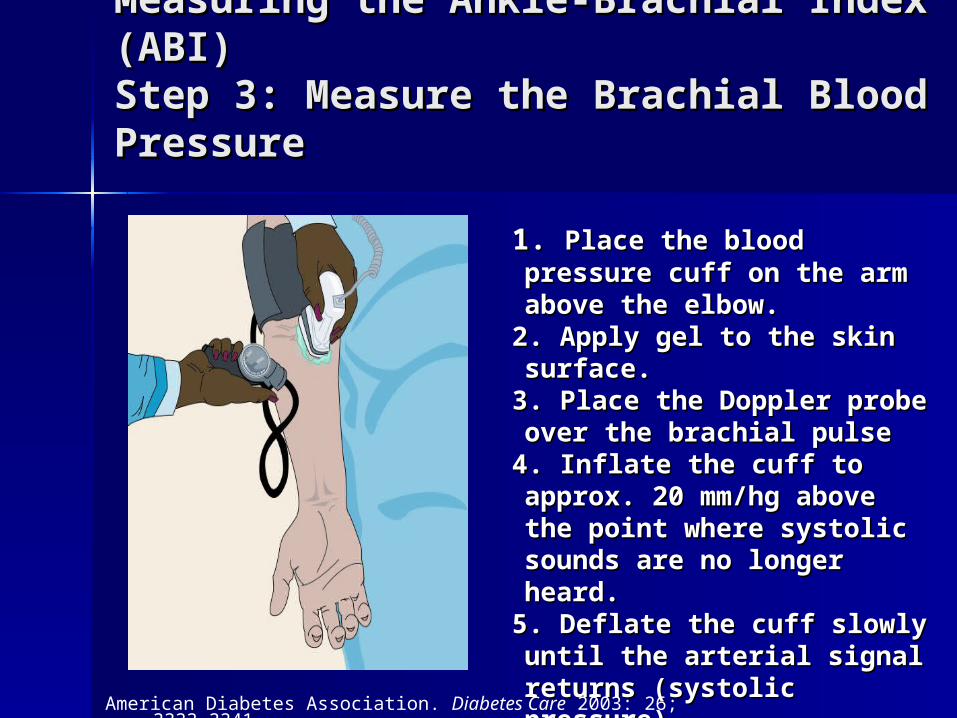
Measuring the Ankle-Brachial Index Measuring the Ankle-Brachial Index (ABI)(ABI)Step 3: Measure the Brachial Blood Step 3: Measure the Brachial Blood PressurePressure
1.1. Place the blood pressure cuff Place the blood pressure cuff on the arm above the elbow. on the arm above the elbow.
2.2. Apply gel to the skin surface.Apply gel to the skin surface.3.3. Place the Doppler probe over Place the Doppler probe over the brachial pulsethe brachial pulse
4.4. Inflate the cuff to approx. 20 Inflate the cuff to approx. 20 mm/hg above the point where mm/hg above the point where systolic sounds are no longer systolic sounds are no longer heard. heard.
5.5. Deflate the cuff slowly until Deflate the cuff slowly until the arterial signal returns the arterial signal returns (systolic pressure)(systolic pressure)
6.6. Repeat in the other armRepeat in the other arm
American Diabetes Association. Diabetes Care 2003: 26; 3333–3341.

Measuring the Ankle-Brachial Index Measuring the Ankle-Brachial Index (ABI)(ABI)Step 4: Position the Cuff Above the Step 4: Position the Cuff Above the AnkleAnkle
Place blood Place blood pressure cuff pressure cuff just above the just above the ankle of one leg, ankle of one leg, apply gel over apply gel over the area of the the area of the dorsalis pedis dorsalis pedis arteryartery
Dormandy JA et al. J Vasc Surg. 2000;31:S1-S296.
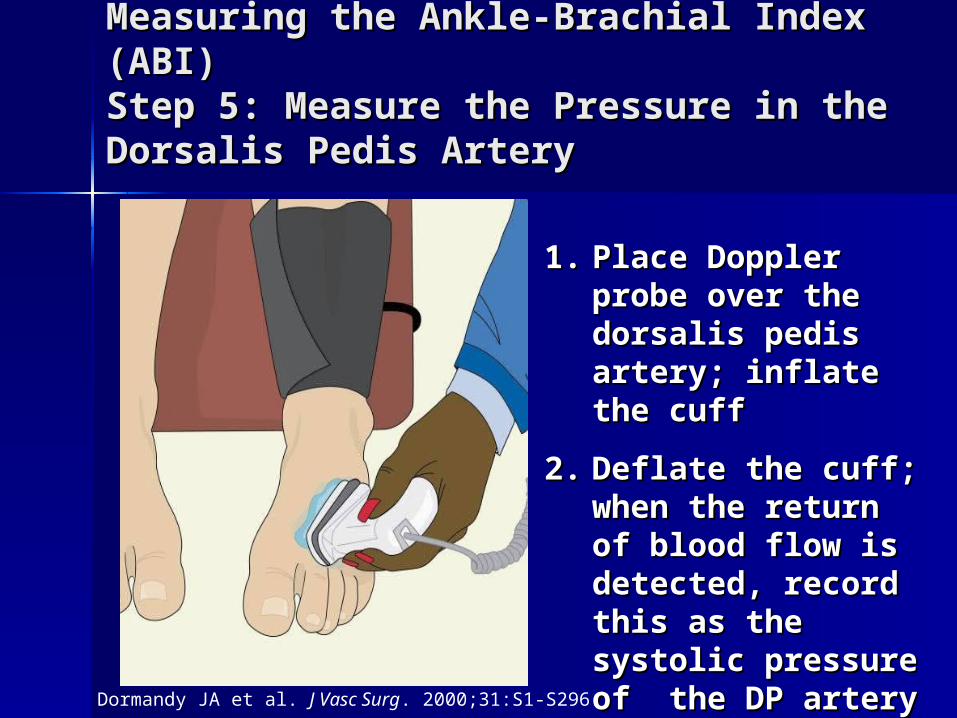
Measuring the Ankle-Brachial Index Measuring the Ankle-Brachial Index (ABI)(ABI)Step 5: Measure the Pressure in the Step 5: Measure the Pressure in the Dorsalis Pedis ArteryDorsalis Pedis Artery
Dormandy JA et al. J Vasc Surg. 2000;31:S1-S296.
1.1. Place Doppler probe Place Doppler probe over the dorsalis over the dorsalis pedis artery; inflate pedis artery; inflate the cuffthe cuff
2.2. Deflate the cuff; when Deflate the cuff; when the return of blood the return of blood flow is detected, flow is detected, record this as the record this as the systolic pressure of systolic pressure of the DP artery of that the DP artery of that legleg

Measuring the Ankle-Brachial Index Measuring the Ankle-Brachial Index (ABI)(ABI)Step 6: Measure the Pressure in the Step 6: Measure the Pressure in the Posterior Tibial ArteryPosterior Tibial Artery
1.1. Place gel and Place gel and Doppler probe over Doppler probe over the posterior tibial the posterior tibial artery (below the artery (below the cuff)cuff)
2.2. Measure the Measure the pressure, record as pressure, record as posterior tibial posterior tibial pressure for that pressure for that legleg
Dormandy JA et al. J Vasc Surg. 2000;31:S1-S296.

Measuring the Ankle-Brachial Index Measuring the Ankle-Brachial Index (ABI)(ABI)Step 7: Repeat the Process in the Step 7: Repeat the Process in the Opposite LegOpposite Leg
Repeat the same Repeat the same process in the process in the other leg and other leg and record the record the pressures of the pressures of the dorsalis pedis dorsalis pedis and posterior and posterior tibial arteriestibial arteries
Dormandy JA et al. J Vasc Surg. 2000;31:S1-S296.
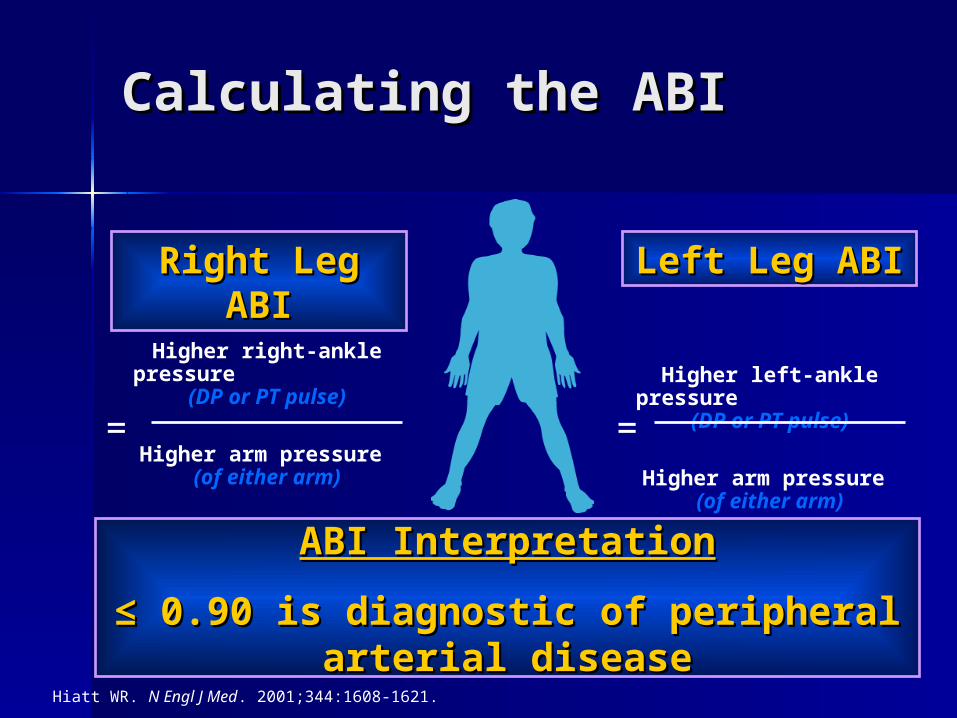
Calculating the ABICalculating the ABI
ABI InterpretationABI Interpretation
≤ ≤ 0.90 is diagnostic of peripheral arterial 0.90 is diagnostic of peripheral arterial diseasedisease
Hiatt WR. N Engl J Med. 2001;344:1608-1621.
Higher right-ankle pressure (DP or PT pulse)
Higher arm pressure (of either arm)
=
Right Leg ABIRight Leg ABI
Higher left-ankle pressure
(DP or PT pulse)
Higher arm pressure (of either arm)
=
Left Leg ABILeft Leg ABI

Calculating the ABIExample Calculation
Hiatt WR. N Engl J Med. 2001;344:1608-1621.
60 mm Hg
120 mm Hg=
Right Leg ABIRight Leg ABI
66 mm Hg
120 mm Hg=
Left Leg ABILeft Leg ABI

Calculating the ABICalculating the ABIExample CalculationExample Calculation
66 mm Hg
120 mm Hg
Hiatt WR. N Engl J Med. 2001;344:1608-1621.
= 0.50 = 0.55
Left Leg ABILeft Leg ABI
60 mm Hg
120 mm Hg
Right Leg ABIRight Leg ABI
ABI InterpretationABI Interpretation
≤ ≤ 0.90 is diagnostic of peripheral arterial 0.90 is diagnostic of peripheral arterial diseasedisease

ABI Limitations
Possible false negatives in patients with noncompressible arteries, such as some diabetics and elderly individuals
Insensitive to very mild occlusive disease and iliac occlusive disease
Not well correlated with functional ability and should be considered in conjunction with activity history or questionnaires

Interpreting the Ankle–Brachial Index
Adapted from Hirsch AT. Family Practice Recertification. 2000;22:6-12.
ABI Interpretation
0.90–1.30
Normal
0.70–0.89
Mild
0.40–0.69
Moderate
0.40 Severe
>1.30 Noncompressible vessels

Referring to the Vascular Lab
Caveats for referral to vascular labCaveats for referral to vascular lab
• Assessment of the location and severity is desired
• Patients with poorly compressible vessels • Normal ABI where there is high suspicion of
PAD
Vascular Lab EvaluationVascular Lab Evaluation
•Segmental pressures •Pulse volume recordings•Treadmill
PAD DiagnosisPAD Diagnosis

Indications for Referral for Vascular Specialty Care
Lifestyle-disabling claudication (refractory to exercise or pharmacotherapy)
Rest pain Tissue loss
Severity
of
ischemia

Summary
PAD is a common atherosclerotic disease associated with risk of cardiovascular ischemic events and significant functional disability
PAD can be effectively assessed in the primary care setting by primary care nurses
The ankle brachial index is an effective and efficient measurement tool for diagnosis of PAD
Early detection of PAD allows for appropriate disease management and decreased likelihood of ischemic events and disease progression


The Graying of U.S. Society
Seniors 12.4 percent of the population
Baby boomers will number 75 million
2030– 20 percent will be over age 65– 1/2 population > age 40

Nurse Competence in Aging Imperatives Moving to an aging society 85+ population > 8.9 million in
2030 Older adults
– Utilize 50% of hospital days – 45% of the direct care – primary patient population of most
specialty nurses. Geriatric preparation significantly
improve health care to older adults.

Classifying the Elderly
ages 65 to 74 - the young old ages 75 to 84 - the middle old ages 85 and older - the old old

Impact of Aging
↑risk of health ↑co-morbidities ↑ disabilities ↑dementia ↑seniors with chronic illness
requiring care ↓quality of life
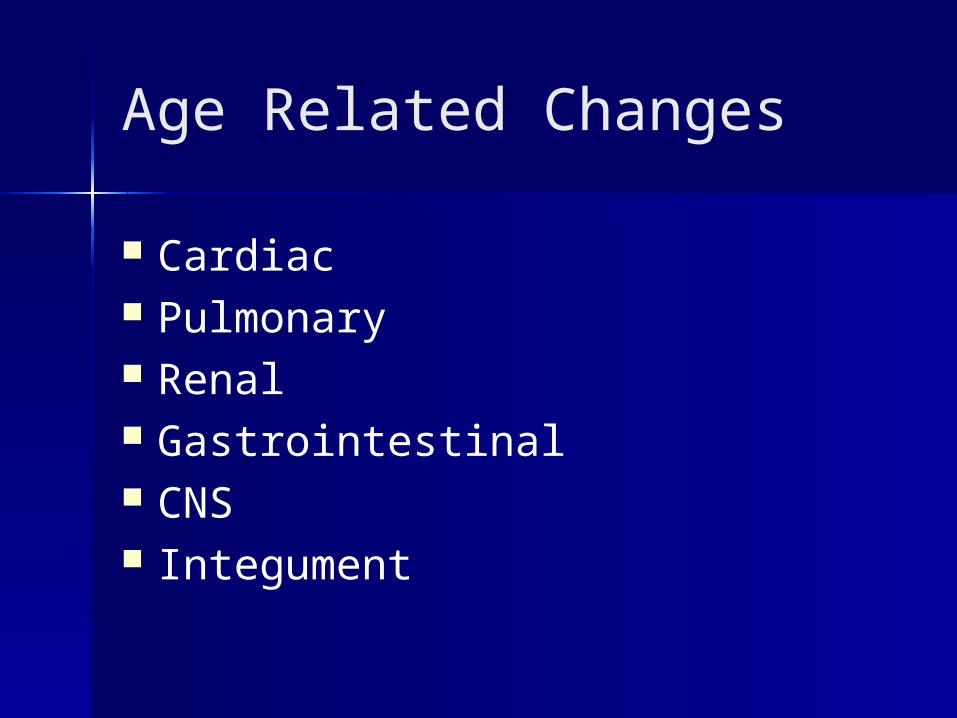
Age Related Changes
Cardiac Pulmonary Renal Gastrointestinal CNS Integument

Cardiac Function
Coronary artery blood flow – decreases 35% between ages 20
and 60. Cardiac output decreases Systolic and diastolic murmurs There is a decrease in cardiac
responsiveness rate with exercise.
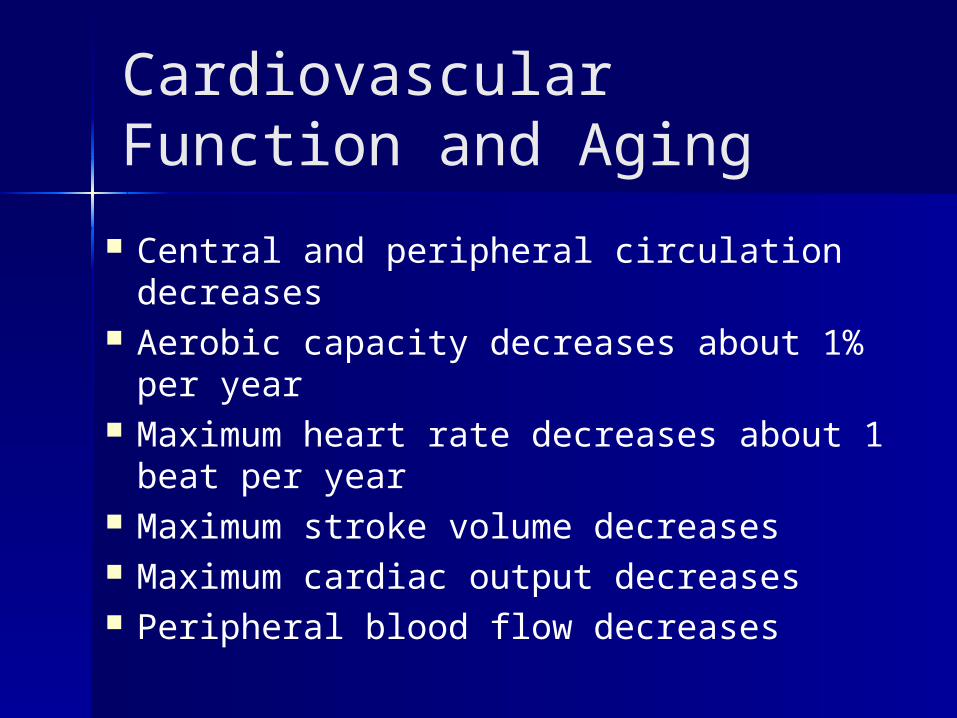
Cardiovascular Function and Aging
Central and peripheral circulation decreases
Aerobic capacity decreases about 1% per year
Maximum heart rate decreases about 1 beat per year
Maximum stroke volume decreases Maximum cardiac output decreases Peripheral blood flow decreases

Physiological Changes to the Body with Aging
Heart muscle– Contractile strength and efficiency decreases – Left ventricular wall thickens
Heart valves – fibrotic and sclerotic
SA node and AV tracts – Infiltrated by fibrous tissue.
Aortic and mitral valves– Calcify

Changes in Blood Vessels
Veins and arteries – dilate and stretch – decreased strength and elasticity.
Peripheral arteries – Tortuous – Less resilient.
Aorta and large arteries – stiffen
Aorta – may lengthen and become tortuous.
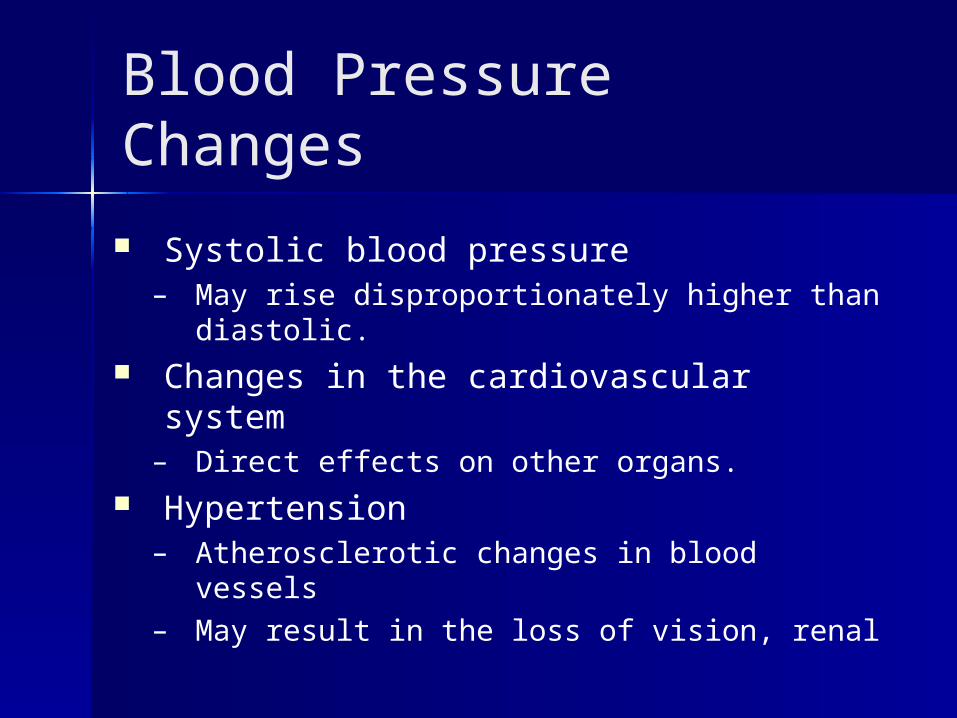
Blood Pressure Changes
Systolic blood pressure – May rise disproportionately higher than
diastolic. Changes in the cardiovascular system
– Direct effects on other organs. Hypertension
– Atherosclerotic changes in blood vessels – May result in the loss of vision, renal
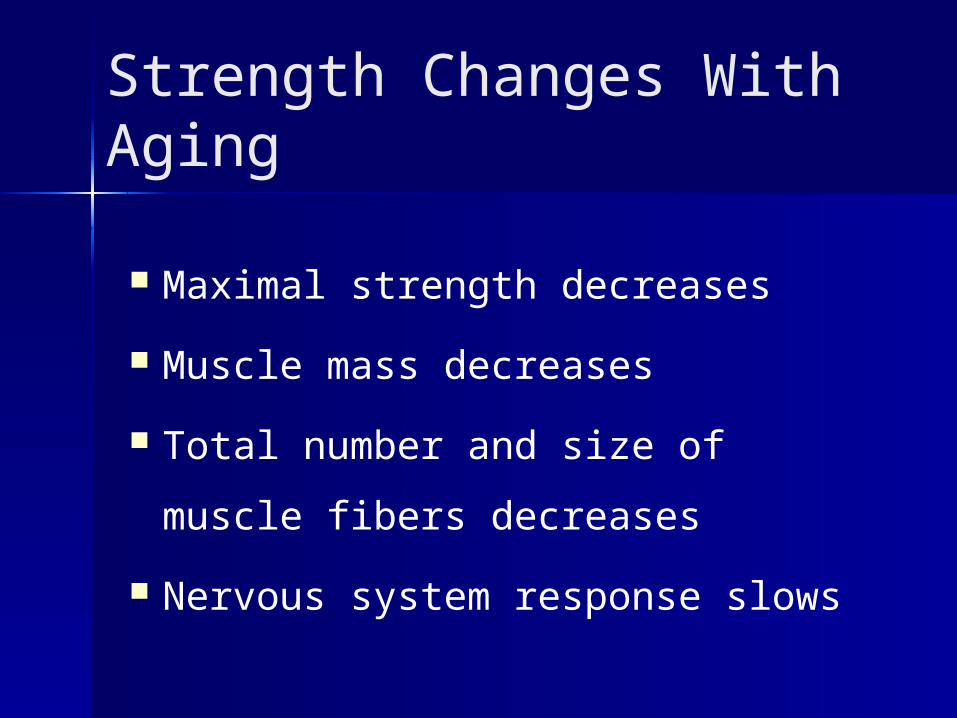
Strength Changes With Aging
Maximal strength decreases
Muscle mass decreases
Total number and size of
muscle fibers decreases
Nervous system response slows

Exercise and the Elderly
1996 report 30% of the elderly exercise regularly.
Results in decreased risk for a number of chronic and debilitating illnesses.
US Department of Health and Human Services
Assess– Motivation. – Level of activity that a person is capable of
doing,– Help him/ her to understand how to change

Health Care for the Elderly
Include– health promotion, – disease prevention, – health maintenance
Anatomical and physiological changes – cardiovascular respiratory– Genitourinary endocrine – Neurological skin– musculoskeletal