perinatal outcomes for extremely preterm babies in ... · in this paper, an antenatal transfer was...
TRANSCRIPT

Perinatal outcomes for extremely preterm babiesin relation to place of birth in England:the EPICure 2 studyN Marlow,1 C Bennett,1 E S Draper,2 E M Hennessy,3 A S Morgan,1 K L Costeloe4,5
▸ Additional material ispublished online only. To viewplease visit the journal online(http://dx.doi.org/10.1136/archdischild-2013-305555).1Academic Neonatology, UCLInstitute for Women’s Health,London2Department of HealthSciences, University ofLeicester, Leicester, UK3Wolfson Institute of PreventiveMedicine, Queen MaryUniversity of London, London,UK4Centre For Paediatrics, BlizardInstitute, Barts and the LondonSchool of Medicine andDentistry, Queen MaryUniversity of London, London,UK5Homerton University Hospital,NHS Foundation Trust, London,UK
Correspondence toProfessor Neil Marlow, UCLEGA Institute for Women’sHealth, 74 Huntley Street,London WC1E 6AU, UK;[email protected]
Received 27 October 2013Revised 19 January 2014Accepted 26 January 2014Published Online First6 March 2014
▸ http://dx.doi.org/10.1136/archdischild-2014-306020▸ http://dx.doi.org/10.1136/archdischild-2014-306021
To cite: Marlow N,Bennett C, Draper ES, et al.Arch Dis Child FetalNeonatal Ed 2014;99:F181–F188.
ABSTRACTBackground Expertise and resources may be importantdeterminants of outcome for extremely preterm babies.We evaluated the effect of place of birth and perinataltransfer on survival and neonatal morbidity within aprospective cohort of births between 22 and 26 weeksof gestation in England during 2006.Methods We studied the whole population of 2460births where the fetus was alive at the admission of themother to hospital for delivery. Outcomes to dischargewere compared between level 3 (most intensive) andlevel 2 maternity services, with and without transfers,and by activity level of level 3 neonatal unit; ORs wereadjusted for gestation at birth and birthweight forgestation (adjusted ORs (aOR)).Findings Of this national birth cohort, 56% were bornin maternity services with level 3 and 34% with level 2neonatal units; 10% were born in a setting withoutongoing intensive care facilities (level 1). Whencompared with level 2 settings, risk of death in level 3services was reduced (aOR 0.73 (95% CI 0.59 to 0.90)),but the proportion surviving without neonatal morbiditywas similar (aOR 1.27 (0.93 to 1.74)). Analysis byintended hospital of birth confirmed reduced mortality inlevel 3 services. Following antenatal transfer into a level3 setting, there were fewer intrapartum or labour warddeaths, and overall mortality was higher for thoseremaining in level 2 services (aOR 1.44 (1.09 to 1.90)).Among level 3 services, those with higher activity hadfewer deaths overall (aOR 0.68 (0.52 to 0.89)).Interpretation Despite national policy, only 56% ofbirths between 22 and 26 weeks of gestation occurredin maternity services with a level 3 neonatal facility.Survival was significantly enhanced following birth inlevel 3 services, particularly those with high activity; thiswas not at the cost of increased neonatal morbidity.
INTRODUCTIONSurvival and later neurological and developmentaloutcomes for extremely premature babies remain ofconcern because of significant mortality and mor-bidity.1 2 In the UK, neonatal care services havedeveloped largely in response to local needs,3 incontrast to practice in many other countries, wherehighly regionalised systems have developed.4 In2003, there was a nationally commissioned review5
that subsequently led to the development ofmanaged neonatal clinical networks in England andincreased centralisation of care for babies born at26 weeks of gestation or less. However, there hasbeen a paucity of data from the UK examining therelationship of birth at extremely low gestationalages to the expertise in the hospital of birth and a
continuing reluctance among practitioners tosupport the principle that centralisation of specialistservices will improve outcomes for this groupwithin the UK model of care.6 Thus, it is importantto assess the impact that the development of neo-natal networks may have had on outcome for thisparticular group.In 2006, we carried out a national population
study of births in England between 22 and 26 com-pleted weeks of gestation (EPICure 2), from whichsurvival and short-term morbidity data andoutcome at 3 years of age have been published.1 2
This report evaluates the hypothesis that birth in,or transfer to, designated referral centres is accom-panied by lower rates of mortality and morbidityamong survivors.
POPULATIONDetails of all births reported between 22 and26 weeks’ gestation were collected prospectively inall 182 maternity hospitals in England during2006. Births to mothers not usually resident inEngland were excluded. This study was based on
Open AccessScan to access more
free content
What is already known on this topic
▸ International data suggest that survival forbabies admitted for neonatal intensive care isimproved in regional centres.
▸ Previous data are difficult to interpret becauseof the confounding effect of antenatal andpostnatal transfer.
What this study adds
▸ Survival is greater in specialist hospitals inEngland providing neonatal intensive care andis further improved in higher activity services.
▸ This improvement is primarily achieved by areduction in fetal deaths before delivery, andneonatal deaths in the delivery room and overthe first week.
▸ Women who book for their care at specialisthospitals have lower mortality compared withthose booking at local (non-specialist)hospitals, although antenatal transfer doesresult in a group of babies with improvedsurvival chances.
Marlow N, et al. Arch Dis Child Fetal Neonatal Ed 2014;99:F181–F188. doi:10.1136/archdischild-2013-305555 F181
Original articlecopyright.
on 17 March 2019 by guest. P
rotected byhttp://fn.bm
j.com/
Arch D
is Child F
etal Neonatal E
d: first published as 10.1136/archdischild-2013-305555 on 6 March 2014. D
ownloaded from
the complete population of mothers with a live fetus at thepoint of the hospital admission that led to delivery.
METHODOLOGYInformation was collected on place of maternal booking anddelivery for all births, together with details for all livebirths ofneonatal transfers and major neonatal morbidities to dischargefrom hospital. Further details on the neonatal data collectionprocess and population outcomes have been reportedpreviously.1
For this report, a ‘service’ comprises the maternity service andits associated neonatal unit, categorised by level of neonatalunit, using the agreed local designation of each neonatal unit(level 1, 2 or 3), based on guidance in the 2003 national review.Level 1 services were hospitals with a level 1 neonatal unit andwould aim to transfer out any woman whose baby was expectedto need intensive care; level 2 services would generally aim totransfer out women expected to deliver before 27 weeks of ges-tation; level 3 services would provide the whole range ofmedical neonatal intensive care.
We further categorised level 3 neonatal units based on activitydata collected by questionnaire, based on that of the UnitedKingdom Neonatal Staffing Study (UKNSS),7 sent during theautumn of 2006 to named EPICure contacts in each hospital.The EPICure perinatal steering group categorised units intohigh activity (≥2000 days respiratory support (ventilation orcontinuous positive airways pressure) per year and more thanfour consultants with more than 50% of their time dedicated toneonatology), medium activity (500–1999 days of respiratorysupport and at least one consultant with more than 50% oftheir time dedicated to neonatology) and low activity(<500 days and no dedicated neonatal consultant). Only level 3services with units categorised as ‘high’ or ‘medium’ activityservices were used in our analysis.
In this paper, an antenatal transfer was defined as any transferinto a level 3 service between booking and delivery; neonataltransfers were defined as those occurring within 24 h of birth.Later transfers, primarily for surgery or back transfer to themother’s local hospital, were not considered. Neonatal morbid-ity was defined as one or more of retinopathy of prematurityrequiring retinal surgery, moderate or severe bronchopulmonary
dysplasia (oxygen or respiratory support at 36 weeks’ post-menstrual age), a severe brain injury (haemorrhagic parenchymalinfarct, cystic changes or hydrocephalus on cerebral ultrasound)or necrotising enterocolitis managed by laparotomy.
Statistical analysisThe principal aim of this study was to determine the effect ofthe categorisation of the service providing care at birth and theinfluence of transfer before and after delivery. Only gestationand weight for gestation at birth, which are the most importantdeterminants of survival,8 were used as confounders, unlessotherwise stated.
The case mix of transferred mothers or babies is likely to bedifferent from those who are not transferred. We addressedpotential bias accruing from this in the following ways: analysiswas first carried out comparing all babies born in level 3 serviceswith all those born in level 2 services. This comparison wasrepeated after excluding births to women transferred antenatallyto a level 3 service. We then compared the population of ante-natal transfers to a level 3 service to the population born andremaining in level 2 or 3 services, respectively. This wasrepeated for neonatal transfers comparing all transfers to babiesadmitted to level 2 or 3 neonatal units but not transferred. Wealso considered outcomes for babies based on the hospital atwhich the woman first booked to have her care, which approxi-mates to level 2 births plus antenatal transfers and may be con-sidered to be a ‘intention to deliver’ analysis. For these analyses,crude and adjusted ORs and their 95% CIs were calculatedusing logistic regression.
Time-specific mortality outcomes were assessed to determinewhether the risk/benefits were similar at all stages of the clinicalpathway. Using logistic regression, we calculated adjusted ORs(aORs) divided into deaths before delivery, delivery roomdeaths, deaths after neonatal unit admission before 7 days,between 7 and 28 days and after 28 days but before discharge.In each case, the aOR is based on the population still alive atthe beginning of the time period under consideration. Theseanalyses were structured as described in the previous paragraph.
We then evaluated bias that might occur from preferentialtreatment of multiple births by analysing only singleton preg-nancies and the pattern of important determinants of perinatal
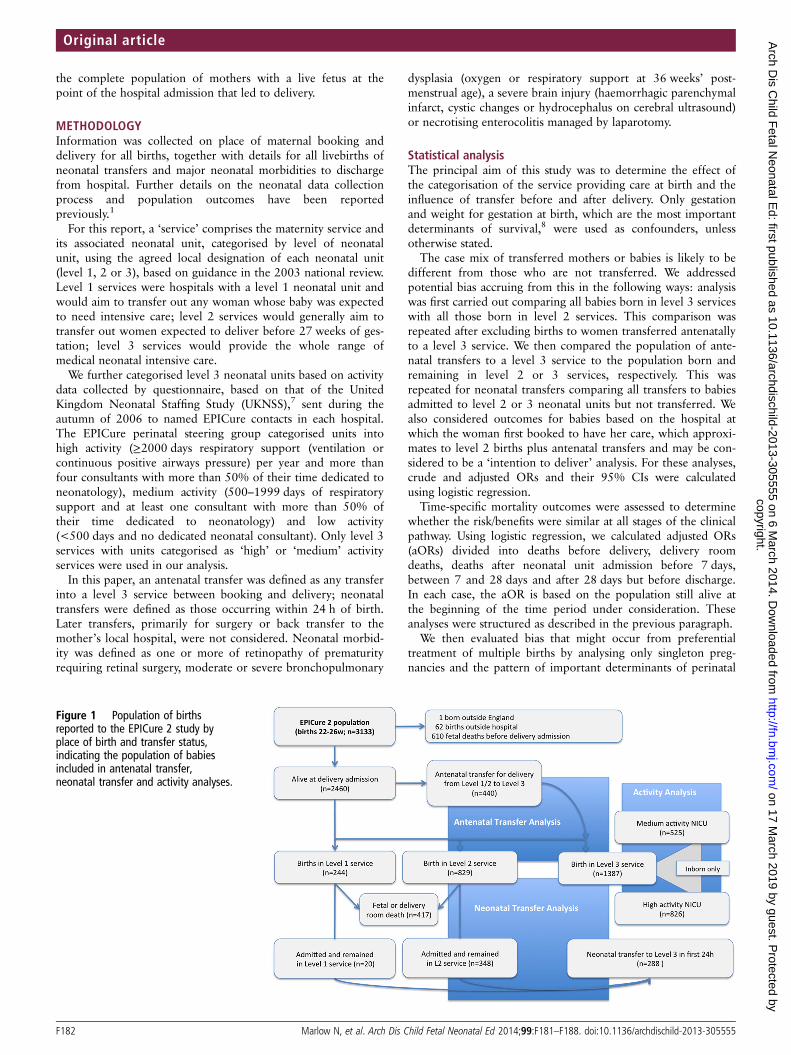
Figure 1 Population of birthsreported to the EPICure 2 study byplace of birth and transfer status,indicating the population of babiesincluded in antenatal transfer,neonatal transfer and activity analyses.
F182 Marlow N, et al. Arch Dis Child Fetal Neonatal Ed 2014;99:F181–F188. doi:10.1136/archdischild-2013-305555
Original articlecopyright.
on 17 March 2019 by guest. P
rotected byhttp://fn.bm
j.com/
Arch D
is Child F
etal Neonatal E
d: first published as 10.1136/archdischild-2013-305555 on 6 March 2014. D
ownloaded from

outcome: administration of antenatal steroids in order to reduceneonatal lung disease, no active intervention for the baby afterbirth, being alive with heart rate >100 at 5 min (excludingthose with no active intervention), admission for neonatal careand (for admissions) the Clinical Risk Index for Babies II(CRIB-II) score.9
For each analysis, we also report the p value for a Wald testof the overall significance of place of birth, activity level, ante-natal or postnatal transfer as appropriate. All statistical analyseswere performed using Stata V.12 (StataCorp LP, College Station,Texas, USA).
RESULTSAmong the 182 hospitals with consultant-led obstetric services,46 were reported to have level 3, 84 level 2 and 52 level 1
neonatal units. Using the staffing and activity data collected forthis study, 24 of the level 3 neonatal units were categorised ashigh activity, 21 as medium activity and 1 as low activity.
There were 2460 births at 22–26 weeks of gestation wherethe fetus was alive when the mother presented to hospital in herdelivery admission, of which 244 (9.9%) occurred in level 1 ser-vices, 829 (33.7%) in level 2 services and 1387 (56.4%) in level3 services. In total, 382 women were transferred to level 3services before birth (440 fetuses) and 288 babies were neonataltransfers within 24 h of birth (figure 1).
MortalityPlace of birth: Survival differed significantly by place of birth(p<0.0001). The proportion of stillbirths and delivery roomdeaths was lowest in level 3 services (23%) and highest in level
Table 1 Time-specific mortality and morbidity to discharge from hospital for all births in England in 2006 between 22 and 26 weeks ofgestation
Outcome
Level 1services(n=244)
Level 2services(n=829)
Level 3services(n=1387) p Value*
Adjusted OR (95% CI) based on populationalive at start of time period
Antenatal death 77 32% 174 21% 208 15% <0.0001 0.81 (0.63 to 1.04)Delivery room deaths 43 18% 143 17% 148 11% <0.001 0.55 (0.39 to 0.77)Neonatal unit deaths <7 days 38 16% 116 14% 168 12% <0.0001 0.65 (0.49 to 0.86)All early neonatal deaths 81 33% 259 31% 316 23% <0.0001 0.59 (0.46 to 0.75)Late neonatal death (7–28 days) 12 5% 56 7% 122 9% 0.999 0.94 (0.66 to 1.33)Death 29 days to discharge 6 2% 35 4% 86 6% 0.976 1.11 (0.72 to 1.72)All deaths 176 72% 524 63% 732 53% <0.0001 0.73 (0.59 to 0.90)
Alive on admission Live births Admission to Neonatal unitSurvivors without morbidity† 19 8% 70 8% 157 11% 0.017 1.27 (0.93 to 1.74) 1.25 (0.91 to 1.71) 1.24 (0.90 to 1.71)Survivors onlyPercent without morbidity† 28% 23% 24% 0.769 1.13 (0.81 to 1.57)
OR (95% CI) for births in level 3 versus level 2 services adjusted for gestational age and birthweight for gestation.Heterogeneity of effect of unit level across gestational age found for late neonatal deaths only (p=0.037).*Significance of χ2 for trend of unadjusted ORs.†As defined in methods: retinopathy, bronchopulmonary dysplasia, brain injury, necrotising enterocolitis.
Figure 2 Mortality by place of birth,perinatal transfer and high andmedium activity level 3 services forbabies born in England in 2006 at 26completed weeks of gestation or less.GA, gestational age in weeks; BW,birthweight for gestation as ‘z’ score;L2/L3, level of service; ANT, antenataltransfer; NNT, neonatal transfer; CRIB,clinical risk index for babies II score9;ANS, any antenatal steroid given tomother.
Marlow N, et al. Arch Dis Child Fetal Neonatal Ed 2014;99:F181–F188. doi:10.1136/archdischild-2013-305555 F183
Original articlecopyright.
on 17 March 2019 by guest. P
rotected byhttp://fn.bm
j.com/
Arch D
is Child F
etal Neonatal E
d: first published as 10.1136/archdischild-2013-305555 on 6 March 2014. D
ownloaded from

1 services (42%; table 1). The median age of death among neo-natal unit admissions was earlier for births in level 1 services(median 2 days) compared with level 2 services (5 days) or level3 services (10 days). Births in level 1 services were excludedfrom further analysis.
Overall mortality was lower in level 3 compared with level 2services (OR 0.65 (95% CI 0.55 to 0.78)), and following adjust-ment for gestational age and birthweight for gestation was onlymarginally attenuated (aOR 0.73 (0.59 to 0.90)). There werealso few differences when babies that were transferred eitherantenatally or postnatally were excluded. Considering all babiesbut including transfer status (antenatal or postnatal) as a covari-ate in the model does not materially alter the mortality risk(figure 2).
Antenatal transfer: The transferred population had lowermortality compared with those who booked and were born ineither level 3 or level 2 services (crude ORs 1.48 (1.26 to 1.75)and 2.21(1.87 to 2.61), respectively; p<0.0001 for both). Afteradjustment, babies born to mothers who were not transferredfrom a level 2 service had an increased odds of death comparedwith those who were transferred (aOR 1.44 (1.09 to 1.90)).However, there was no difference in survival between thosetransferred antenatally into and those booked and born in level3 services (aOR 1.08 (0.83 to 1.41); figure 2).
Hospital of booking: As the women who are transferred outmay represent those with the highest chance of good outcomes,we considered the same population but allocated to the categoryof hospital where each woman booked for maternity care, asopposed to the hospital where delivery occurred. Babies ofwomen booked in level 3 services still had reduced mortality
compared with babies of women booked in level 2 services(aOR 0.79 (0.63 to 0.98)).
Neonatal transfer: No differences were found in survival forbabies postnatally transferred compared with those who wereborn and remained in level 2 or level 3 services.
Time-specific mortality outcomesPlace of birthDifferences in survival for babies born in level 3 services occurearly in the perinatal period (table 1 and figure 3). There werefewer deaths antenatally, in the delivery room and during thefirst 7 days after birth in level 3 compared with level 2 services;reflected in the proportions surviving to hospital discharge:36.8% in level 2 services, and 47.2% in level 3 services. Afteradjustment, only fetal and early neonatal deaths (aOR 0.59(0.46 to 0.75)) and overall mortality remained statisticallysignificant.
Antenatal transferFor women who were not transferred into a level 3 service, theadjusted odds for the fetus of antenatal death (aOR 1.52 (1.03to 2.26)), overall early neonatal deaths (aOR 1.49 (1.10 to2.02)) and deaths to discharge were significantly higher than forthose who were transferred (table 2). There were no significantdifferences in outcomes for the transferred cases compared withthose booked and delivered in hospitals with level 3 services.
Postnatal transferThe results for postnatal transfer show few differences inmortality between neonatal transfer (NNT) and babies not
Figure 3 Kaplan–Meier plots of survival by gestational week for babies born at 23–26 weeks of gestation in level 3 and level 2 centres inEngland in 2006. Antenatal deaths are plotted as t=1 and delivery room outcomes care as t=2, with admission to neonatal unit as t=3 andsubsequently postnatal age in days to 40 weeks postmenstrual age.
F184 Marlow N, et al. Arch Dis Child Fetal Neonatal Ed 2014;99:F181–F188. doi:10.1136/archdischild-2013-305555
Original articlecopyright.
on 17 March 2019 by guest. P
rotected byhttp://fn.bm
j.com/
Arch D
is Child F
etal Neonatal E
d: first published as 10.1136/archdischild-2013-305555 on 6 March 2014. D
ownloaded from

transferred (table 3). Of note early neonatal deaths are morecommon in non-transferred babies admitted to level 2, implyingperhaps that the sickest babies are not transferred.
Survival without morbidityIn contrast to mortality, neonatal morbidity does not appear tovary significantly with place of birth (table 1). The proportionsof survivors without morbidity are similar for those born in hos-pitals with level 3 services (11%) compared with those withlevel 2 (8%), either considering the whole population (11% vs8%, respectively) or only those who survived (23% vs 24%,respectively).
There was no evidence of an association between antenataltransfer and survival without morbidity compared with babiesborn in either level 2 or level 3 services, although the ORs wereof a similar order in favour of antenatal transfer in each com-parison (table 2). In contrast, babies born in centres with level 3neonatal facilities have significantly higher odds of survivalwithout morbidity compared with babies transferred in afterbirth (OR 1.92 (1.02 to 3.60)).
There was no evidence of significant variation in specific mor-bidities between groups (not shown).
Activity in level 3 servicesFor all mortality outcomes, unadjusted ORs were lower in high-activity units compared with medium activity, and the differencewidened after adjustment for gestation and birthweight for ges-tation (table 4 and figure 2). There was no evidence for differ-ences in time-specific mortality, nor was there any difference insurvival without morbidity in high-throughput units comparedwith low-throughput units (aOR 0.79 (0.55 to 1.14)) or in theproportion surviving without morbidity among survivors (aOR0.69 (0.47 to 1.02)).
Further analysesUsing data only from singleton pregnancies reflected the wholepopulation analysis and did not alter our conclusions (see onlinesupplementary tables S1 and S2).
We next investigated whether there were differences in pre-specified determinants of outcome.
Table 2 Mortality and morbidity to discharge for babies of women transferred antenatally and for those who delivered in level 2 and level 3services without transfer for births in England in 2006 between 22 and 26 weeks of gestation
OutcomeLevel 2(n=829)
Antenataltransfer(n=440)
Level 3(n=947) p Value*
aORL3 vs L2
aORLevel 2 v ANT
aORLevel 3 vs ANT
Antenatal death 174 21% 45 10% 163 17% 0.104 0.86 (0.66 to 1.13) 1.52 (1.03 to 2.26) 1.31 (0.89 to 1.93)Delivery room deaths† 143 17% 30 7% 118 12% 0.002 0.53 (0.37 to 0.77) 1.67 (1.02 to 2.72) 0.89 (0.54 to 1.46)Neonatal unit deaths <7 days 116 14% 50 11% 118 12% 0.005 0.69 (0.51 to 0.94) 1.80 (1.23 to 2.63) 1.25 (0.86 to 1.81)All early neonatal deaths 259 31% 80 18% 236 25% 0.0001 0.61 (0.47 to 0.79) 1.85 (1.33 to 2.57) 1.12 (0.81 to 1.56)Late neonatal death (7–28 days)† 56 7% 43 10% 79 8% 0.932 0.94 (0.64 to 1.38) 1.08 (0.69 to 1.68) 1.01 (0.67 to 1.53)Death 29 days to discharge 35 4% 32 7% 54 6% 0.853 1.08 (0.68 to 1.73) 0.86 (0.50 to 1.46) 0.93 (0.57 to 1.51)All deaths 524 63% 200 45% 532 56% 0.014 0.75 (0.59 to 0.95) 1.44 (1.09 to 1.90) 1.08 (0.83 to 1.41)
Survival without morbidity 70 8% 65 15% 92 10% 0.086 1.14 (0.80 to 1.61) 0.65 (0.44 to 0.96) 0.74 (0.51 to 1.06)Survivors onlyNo morbidity 70 23% 65 27% 92 22% 0.166 0.99 (0.69 to 1.43) 0.72 (0.48 to 1.08) 0.71 (0.49 to 1.04)
Perinatal factorsAntenatal steroid (any) 531/824 64% 412/436 95% 656/936 70% <0.0001 1.15 (0.90 to 1.47) 0.20 (0.12 to 0.31) 0.23 (0.14 to 0.36)Resuscitation withheld 89/653 14% 12/395 3% 61/784 8% 0.002 0.41 (0.25 to 0.66) 1.25 (0.62 to 2.55) 0.51 (0.24 to 1.09)Alive with HR>100 at 5 m 463/551 84% 342/379 90% 610/710 86% 0.243 1.16 (0.84 to 1.60) 0.70 (0.46 to 1.06) 0.81 (0.53 to 1.22)Admitted to NNU 511/829 62% 365/440 83% 664/947 70% 0.014 1.41 (1.09 to 1.81) 0.69 (0.50 to 0.96) 0.98 (0.70 to 1.35)
*p Value for overall significance of transfer adjusted for gestational age and birthweight for gestation.†Heterogeneity of effect of antenatal transfer across gestational age for two outcomes (p=0.048 for delivery room and p=0.039 for late neonatal deaths).ANT, antenatal transfer; aOR, OR adjusted for gestational age and birthweight for gestation based on population alive at start of time period.
Table 3 Mortality and morbidity to discharge for neonatal unit admissions for babies who were transferred to a level 3 service after admission(NNT) compared with babies who remained in their hospital of birth, for births in England in 2006 between 22 and 26 weeks of gestation
OutcomeLevel 2(n=348) (%)
Neonataltransfer(n=261)
Level 3(n=1028) p Value* aOR L3 vs L2 aOR L2 vs NNT aOR L3 vs NNT
Neonatal unit deaths <7 days 80 23% 35 21% 166 16% 0.002 0.56 (0.41 to 0.78) 1.50 (0.93 to 2.42) 0.85 (0.55 to 1.30)Late neonatal death (7–28 days) 34 10 22 14% 122 12% 0.935 0.93 (0.61 to 1.43) 1.01 (0.55 to 1.86) 0.94 (0.56 to 1.58)Death 29 days to discharge 22 6 13 8% 86 8% 0.831 1.05 (0.63 to 1.76) 1.16 (0.54 to 2.49) 1.22 (0.64 to 2.34)All deaths 136 39% 70 43% 374 36% 0.156 0.76 (0.58 to 1.00) 1.25 (0.82 to 1.89) 0.95 (0.66 to 1.37)Survival without morbidity 58 17% 12 7% 157 15% 0.124 1.09 (0.77 to 1.54) 1.76 (0.90 to 3.46) 1.92 (1.02 to 3.60)Survivors only
No morbidity 58 27% 12 13% 157 24% 0.172 0.97 (0.67 to 1.40) 1.88 (0.94 to 3.78) 1.83 (0.96 to 3.50)
No heterogeneity was detected for any outcome in the effect of neonatal transfer at different gestational ages.*p Value for overall significance of transfer adjusted for gestational age and birthweight for gestation.aOR, OR adjusted for gestational age and birthweight for gestation based on population alive at start of time period; NNT, neonatal transfer.
Marlow N, et al. Arch Dis Child Fetal Neonatal Ed 2014;99:F181–F188. doi:10.1136/archdischild-2013-305555 F185
Original articlecopyright.
on 17 March 2019 by guest. P
rotected byhttp://fn.bm
j.com/
Arch D
is Child F
etal Neonatal E
d: first published as 10.1136/archdischild-2013-305555 on 6 March 2014. D
ownloaded from

Overall, antenatal steroid was administered to 45% of birthsin hospitals with level 1, 64% in hospitals with level 2 and 78%in hospitals with level 3 services. The odds of receiving steroidare 2.5 times higher for each week of gestational age (OR 2.50(95% CI 2.29 to 2.72)), controlling for service category, and1.83 times (95% CI 1.58 to 2.12) higher for each increase inservice level, controlling for gestational age.
Planned no active intervention was recorded in 15% of birthsin level 1, 14% in level 2 and 6% in level 3 services. The oddsof there being no active intervention are 0.62 (95% CI 0.47 to0.82) for each change in service category, controlling for gesta-tional age.
When comparing births in level 2 services with those trans-ferred antenatally, mothers less frequently received steroid, aplan for no active intervention was more frequent and the babywas less likely to have a heart rate >100 bpm at 5 min (table 2).Antenatal transfers were also more likely to receive steroid com-pared with non-transferred level 3 births. CRIB-II scores werenot significantly different between groups (not shown), indicat-ing similarity of the condition of the babies on admission forneonatal care.
When we considered hospital of booking, babies of womenbooked in level 3 services were less likely to have resuscitationwithheld (aOR 0.48 (0.29 to 0.79)) and more likely to beadmitted for neonatal intensive care (aOR 1.31 (1.02 to 1.68)),but they had similar rates of steroid administration and similarchances of being alive with a heart rate >100 bpm at 5 min(aOR 0.97 (0.76 to 1.24) and 1.08 (0.79 to 1.48), respectively).
DISCUSSIONThese national data represent the first study of outcomes for theentire perinatal service since neonatal care in England was reor-ganised into managed clinical networks. Within this reorganisa-tion there has been much local debate as to the appropriatesetting in which to care for extremely preterm infants. We havedemonstrated that in 2006 only 56.4% of extremely pretermbirths occurred in the recommended setting of level 3 servicesand that birth in such a service was associated with reducedmortality, particularly among deaths occurring around deliveryand during the first 7 days after birth. Considering the popula-tion of women booked in level 3 services, greater survival is alsoapparent, suggesting that service differences may be important.Furthermore, differences in survival between high and medium
neonatal activity levels in level 3 services emphasise the import-ance of the setting in which care takes place.
Whereas survival increased between 1995 and 2006 in babiesborn between 22 and 25 weeks of gestation, neonatal morbidity,in terms of brain injury, bronchopulmonary dysplasia, retinop-athy and severe necrotising enterocolitis, was unchanged.1 Inthis study, the place of birth and perinatal transfer had littleimpact on the proportion with morbidities in any setting. Itappears likely that reducing morbidity in this population mayrequire different strategies from those that have successfullyenhanced survival.
Potential limitationsComparisons such as this are fraught with difficulty. In particu-lar, the data may be confounded by differences in case mix,mainly of gestational age and birthweight for gestation, conse-quent on local demography, women’s choice of place of birthand both antenatal and postnatal transfers. For this reason, wehave reported comparisons adjusted for gestation and weight forgestation at birth and, while we have no information aboutwhether women with health problems or previous adverse preg-nancy outcomes preferentially ‘booked’ in level 3 services,because of the detail in the EPICure database we are able toaccount for all transfers thereafter. Because we had recorded theplace of booking in the pregnancy, we were also able to correctfor bias that may occur with the transfer out of good prognosispregnancies and confirm reduced mortality for babies whosemothers booked in level 3 services.
It was not possible to determine how many of the births inlevel 1 or level 2 services could have been avoided if there hadbeen a more active approach to the initiation of corticosteroidtherapy and arranging antenatal transfer as soon as extremelypreterm birth was expected. Some births in level 2 servicesoccurred either because the mother arrived in hospital at tooadvanced a stage of labour, with a complication preventing hersafe transfer, or because at 22 or 23 weeks prognosis was con-sidered too poor to warrant active intervention. Women whopresent to the labour ward and rapidly deliver are likely to bethose who receive least steroid and thus have worse neonatalearly lung disease and worse outcomes. Using outcomes basedon hospital of booking, we see no differences in the rate ofsteroid use between women booked in level 2 and level 3services, confirming the bias for those not transferred.
Table 4 Mortality and morbidity to discharge for babies cared for in level 3 services categorised by medium and high-activity levels (see text)
OutcomeHigh activity(n=826)
Medium activity(n=525) aOR high vs medium activity p Value*
Antenatal death 121 15% 85 16% 0.92 (0.66 to 1.27) 0.600Delivery room deaths* 82 10% 65 12% 0.78 (0.49 to 1.22) 0.274Neonatal unit deaths <7 days 94 11% 68 13% 0.82 (0.58 to 1.17) 0.275All early neonatal deaths 176 21% 133 25% 0.78 (0.58 to 1.06) 0.119Late neonatal death (7–28 days)* 69 8% 50 10% 0.72 (0.47 to 1.08) 0.115Death 29 days to discharge 49 6% 35 7% 0.65 (0.40 to 1.06) 0.086All deaths 415 50% 303 58% 0.68 (0.52 to 0.89) 0.005Survival without neonatal morbidity 86 10% 65 12% 0.79 (0.55 to 1.14) 0.205Survivors only
No neonatal morbidity 86 21% 65 29% 0.69 (0.47 to 1.02) 0.063
No heterogeneity (of effect of throughput level) was found across gestational age for any outcome.*Test for significance of effect of throughput, adjusted for gestational age and birthweight for gestation; further adjustment for antenatal transfer did not materially change the ORs orCIs for any of the outcomes.aOR, OR adjusted for gestational age and birthweight for gestation based on population alive at start of time period.
F186 Marlow N, et al. Arch Dis Child Fetal Neonatal Ed 2014;99:F181–F188. doi:10.1136/archdischild-2013-305555
Original articlecopyright.
on 17 March 2019 by guest. P
rotected byhttp://fn.bm
j.com/
Arch D
is Child F
etal Neonatal E
d: first published as 10.1136/archdischild-2013-305555 on 6 March 2014. D
ownloaded from

Furthermore, management was more active following antenataltransfer, perhaps because there was sufficient time for safe trans-fer and there were higher expectations of a good outcome. Ourdata support the safety of antenatal transfer for the baby.
Comparisons with other studiesMost published comparisons,4 including data from the UK,6 7
use neonatal unit admissions as their denominator population,thereby effectively ignoring policy and competency concerningperinatal and immediate delivery room care. In these compari-sons, many use case mix correction strategies, such as CRIB-II,9
to correct for different practices and outcomes in the deliveryroom. In our study, for babies admitted to neonatal units,CRIB-II scores are not significantly different between babiesadmitted in level 2 and level 3 neonatal units. In contrast, ourfindings suggest that care in the perinatal period is particularlyimportant in reducing mortality and are consistent with ourreported observation that improvements in mortality of admit-ted babies between 1995 and 2006 relate to improved mortalityaround delivery and during the first week after birth.1
An analysis of routinely collected data from neonatal admis-sions in England has shown increased postnatal transfers ofbabies born at 27 and 28 weeks of gestation in 2009 and 2010compared with data for babies of the same gestation bornbetween 1998 and 2000 before regionalisation of services.10 Itwas notable when comparing the 2006 EPICure cohort ofadmissions born before 26 weeks with the previous cohort bornin 1995,1 that there had been an increase in the proportiontransferred within 24 h of birth. However, postnatal transfer in2006 was not associated with increased morbidity as it had beenin 1995, probably associated with the introduction of network-based dedicated neonatal transfer teams.
In different health services outside the UK, there is evidencethat centralised services produce better survival outcomes forbabies requiring neonatal intensive care. A recent systematicreview used data from the USA (22 studies) and from the rest ofthe world (15 studies, including studies from Canada, Israel,Australia and Europe, but not the UK). Overall the odds of sur-vival in level 3 compared with level 2 services were 1.60 (1.33to 1.92), slightly higher in studies of babies <1000 g birth-weight (1.80 (1.31 to 2.46)) than in very preterm infants (1.42(1.06 to 1.88)).4
Our study is based upon the population for whom such trans-fer is recommended in current guidance.11 Even after excludingbirths at 22 weeks, at which gestation active intervention is notrecommended under current guidance,12 and at 26 weeks, forwhom currently transfer is not universal, still only 59% ofbirths at 23–25 weeks of gestation are born in recommendedsettings. In contrast, among liveborn babies born in the Parisianregion of France between 24 and 31 weeks of gestation,between 1997 and 2003, 77% of births occurred in level 3centres; inpatient mortality and the prevalence of intraventricu-lar haemorrhage were significantly lower in such centres, whilethe rate of periventricular leucomalacia and bronchopulmonarydysplasia remained constant.13
CONCLUSIONSIn this whole population study, we have demonstrated improvedneonatal survival for babies born between 22 and 26 weeks ofgestation and managed in level 3 services in England, andfurther improvements in survival for those babies managed inlevel 3 intensive care units with higher levels of activity. Thesedata support the concept that hospital expertise and activity areimportant factors in improved outcomes for high-risk
pregnancies with threatened extremely preterm birth.14 15
Recent UK data confirm that neonatal nurse staffing levels con-tinue to be associated with quality of care,16 but many of ourlevel 3 services are smaller than those associated with improvedoutcomes.17 Despite this, our successful networks are currentlyat risk in the reorganisation of the NHS.18 We speculate thatfurther development of these structures with larger and appro-priately staffed neonatal services integrated with maternity net-works is required if survival for extremely preterm babies is tocontinue to improve.
Acknowledgements The EPICure outcome studies were sponsored by theUniversity of Nottingham (till September 2008) and subsequently by UniversityCollege London. NM receives part funding from the Department of Health’s NIHRBiomedical Research Centre’s funding scheme at UCLH/UCL
Contributors NM and KLC formulated the hypothesis and NM, EMH, ASM and CBthe design of the analysis. CB analysed the data under supervision from EMH andNM. Perinatal data were collated by KLC, ESD and EMH. NM wrote the first draftand coordinated the manuscript. All authors were involved in interpretation of thedata and writing the report. All have seen and approved the final version.
Oversight EPICure Studies Steering Committee Independent Members: ProfessorPeter Brocklehurst (Chairman), Mrs Jane Abbott, Professor Andrew Bush, ProfessorRichard Cooke, Mrs Noreen Maconochie, Mrs Alison Matthews, Mr David Matthews,Dr Richard Morton, Dr Maggie Redshaw, Professor David Taylor, Mr Nigel Turner,Mrs Diane Turner and Mr Patrick Walsh.
Research governance The Medical Research Council funded the study in full(G0401525) and had no role in study design, data collection, data analysis, datainterpretation, or writing of the report. City and East London REC 3 granted ethicalapproval for the EPICure 2 study (05/Q0605/107).
Funding Medical Research Council.
Competing interests None.
Ethics approval City and East London REC 3.
Provenance and peer review Not commissioned; externally peer reviewed.
Data sharing statement The EPICure Studies have a formal data sharing policyavailable from http://www.epicure.ac.uk
Open Access This is an Open Access article distributed in accordance with theCreative Commons Attribution Non Commercial (CC BY-NC 3.0) license, whichpermits others to distribute, remix, adapt, build upon this work non-commercially,and license their derivative works on different terms, provided the original work isproperly cited and the use is non-commercial. See: http://creativecommons.org/licenses/by-nc/3.0/
REFERENCES1 Costeloe KL, Hennessy EM, Haider S, et al. Short term outcomes after extreme
preterm birth in England: comparison of two birth cohorts in 1995 and 2006 (theEPICure studies). BMJ 2012;345:e7976.
2 Moore T, Hennessy EM, Myles J, et al. Neurological and developmental outcome inextremely preterm children born in England in 1995 and 2006: the EPICure studies.BMJ 2012;345:e7961.
3 Marlow N, Bryan Gill A. Establishing neonatal networks: the reality. Arch Dis ChildFetal Neonatal Ed 2007;92:F137–42.
4 Lasswell SM, Barfield WD, Rochat RW, et al. Perinatal regionalization for verylow-birth-weight and very preterm infants: a meta-analysis. JAMA 2010;304:992–1000.
5 Department of Health. Report of DH Expert Working Group on neonatal intensivecare services. London: Department of Health, 2003.
6 Selinger M. Benefits of reorganising neonatal and obstetric services are unclear.BMJ 2012;344:e3203.
7 Tucker J, Tarnow-Mordi W, Gould C, et al. UK neonatal intensive care services in1996. On behalf of the UK Neonatal Staffing Study Collaborative Group. Arch DisChild Fetal Neonatal Ed 1999;80:F233–4.
8 Tyson JE, Parikh NA, Langer J, et al. Intensive care for extreme prematurity—moving beyond gestational age. NEJM 2008;358:1672–81.
9 Parry G, Tucker J, Tarnow-Mordi W, et al. CRIB II: an update of the clinical riskindex for babies score. Lancet 2003;361:1789–91.
10 Gale C, Santhakumaran S, Nagarajan S, et al. Impact of managed clinical networkson NHS specialist neonatal services in England: population based study. BMJ2012;344:e2105.
11 Department of Health. Toolkit for High Quality Neonatal Services. London:Department of Health, 2009.
Marlow N, et al. Arch Dis Child Fetal Neonatal Ed 2014;99:F181–F188. doi:10.1136/archdischild-2013-305555 F187
Original articlecopyright.
on 17 March 2019 by guest. P
rotected byhttp://fn.bm
j.com/
Arch D
is Child F
etal Neonatal E
d: first published as 10.1136/archdischild-2013-305555 on 6 March 2014. D
ownloaded from

12 Wilkinson AR, Ahluwalia J, Cole A, et al. Management of babies born extremelypreterm at less than 26 weeks of gestation: a framework for clinical practice at thetime of birth. Arch Dis Child Fetal Neonatal Ed 2009;94:F2–5.
13 Zeitlin J, Ancel PY, Delmas D, et al. Changes in care and outcome of very pretermbabies in the Parisian region between 1998 and 2003. Arch Dis Child FetalNeonatal Ed 2010;95:F188–93.
14 Chung JH, Phibbs CS, Boscardin WJ, et al. Examining the effect of hospital-levelfactors on mortality of very low birth weight infants using multilevel modeling.J Perinatol 2011;31:770–5.
15 Finnstrom O, Olausson PO, Sedin G, et al. The Swedish national prospective studyon extremely low birthweight (ELBW) infants. Incidence, mortality, morbidity andsurvival in relation to level of care. Acta Paediatrica 1997;86:503–11.
16 Pillay T, Nightingale P, Owen S, et al. Neonatal nurse staffing and delivery of clinicalcare in the SSBC Newborn Network. Arch Dis Child Fetal Neonatal Ed 2012;97:F174–8.
17 Phibbs CS. Managed clinical networks in neonatal care. BMJ 2012;344:e2423.18 Boyle R. Clinical networks are effective, work in patients’ interests, and shouldn’t
be disbanded. BMJ 2013;346:f565.
F188 Marlow N, et al. Arch Dis Child Fetal Neonatal Ed 2014;99:F181–F188. doi:10.1136/archdischild-2013-305555
Original articlecopyright.
on 17 March 2019 by guest. P
rotected byhttp://fn.bm
j.com/
Arch D
is Child F
etal Neonatal E
d: first published as 10.1136/archdischild-2013-305555 on 6 March 2014. D
ownloaded from