performing arts on campus - northwestern universitychristopher o’riley,paco peña,menahem...
TRANSCRIPT


Northwestern University 2005 Financial Report |Performing Arts on Campus


1
Fall 2005 was a special season for the performing
arts at Northwestern. Was, the first production
in our exciting new American Music Theatre
Project, played to packed houses — including
major newspaper critics who don’t usually
review college productions.
While Was and AMTP were attracting
considerable attention, we insiders were re-
minded that our talented faculty and students
make Northwestern a special place for the per-
forming arts day in and day out, year after year.
With its long tradition of strength in the
performing arts, Northwestern is the perfect
place to mount so ambitious and far-reaching
a project as AMTP (see story on page 7).
The Schools of Communication and Music
were the first two schools to be established at
Northwestern after the original liberal arts
college, and each has a long history of excel-
lence in performance as well as in the classroom.
The School of Communication was born
in 1878 as a school of oratory and added faculty
in drama in the early 20th century. During the
1920s the University Theatre developed out
of several existing theatrical organizations on
campus.The first Waa-Mu Show, Northwestern’s
student-written revue, hit the stage in 1929.
By the 1940s the theater department already
enjoyed a national reputation.The ranks of
1
Message from the President
Message from the President 1
Report of the Senior Vice President 9
for Business and Finance
Investment Report 10
Report of Independent Auditors 14
Consolidated Statements 15
of Financial Position
Consolidated Statements 16
of Activities
Consolidated Statements 17
of Cash Flows
Notes to the Consolidated 18
Financial Statements
Administration and Trustees 29
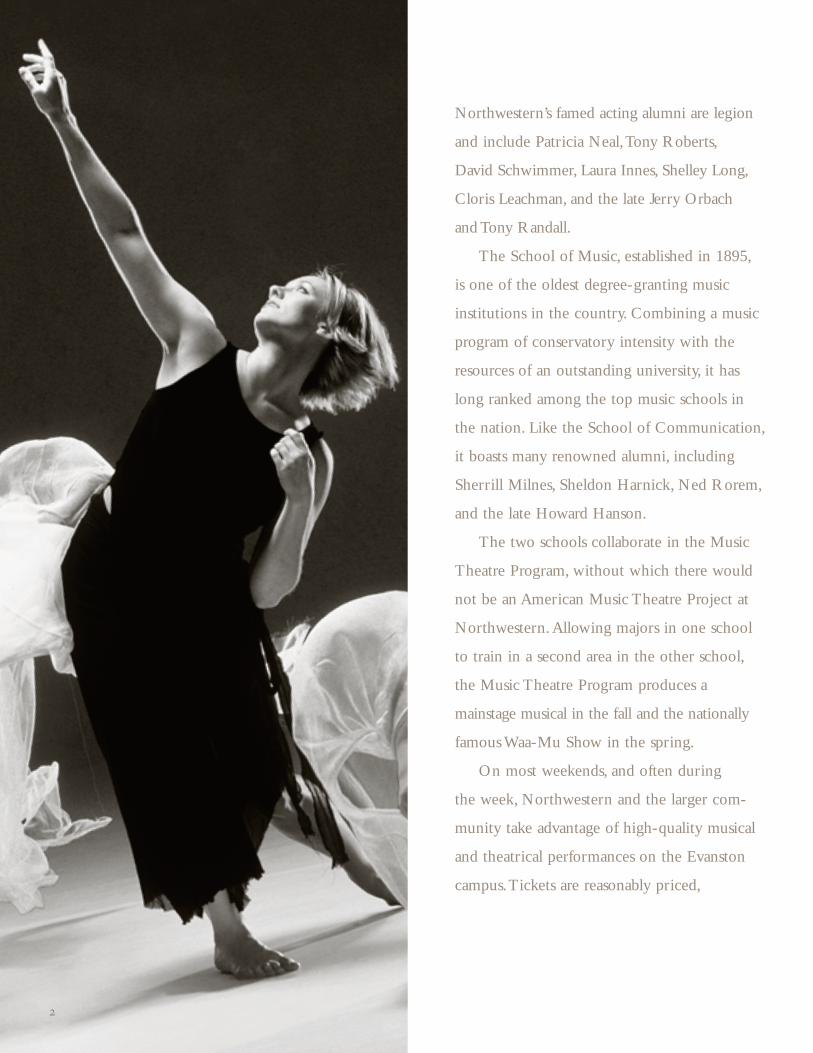
Northwestern’s famed acting alumni are legion
and include Patricia Neal,Tony Roberts,
David Schwimmer, Laura Innes, Shelley Long,
Cloris Leachman, and the late Jerry Orbach
and Tony Randall.
The School of Music, established in 1895,
is one of the oldest degree-granting music
institutions in the country. Combining a music
program of conservatory intensity with the
resources of an outstanding university, it has
long ranked among the top music schools in
the nation. Like the School of Communication,
it boasts many renowned alumni, including
Sherrill Milnes, Sheldon Harnick, Ned Rorem,
and the late Howard Hanson.
The two schools collaborate in the Music
Theatre Program, without which there would
not be an American Music Theatre Project at
Northwestern. Allowing majors in one school
to train in a second area in the other school,
the Music Theatre Program produces a
mainstage musical in the fall and the nationally
famous Waa-Mu Show in the spring.
On most weekends, and often during
the week, Northwestern and the larger com-
munity take advantage of high-quality musical
and theatrical performances on the Evanston
campus.Tickets are reasonably priced,
22

33
endowment, presents three fully staged opera
productions annually.
In the Theatre and Interpretation Center’s
multiple professional-level performance spaces
and the 1,000-seat Cahn Auditorium, faculty,
staff, and students collaborate to produce as
many as 40 theater and dance performances
a year.The mainstage season offers seven fully
mounted productions, including a dance pro-
gram, and other annual productions include a
play for children and experimental presentations.
At Northwestern opportunities to perform
are open to students across campus, not just to
majors in music and theater. Students continue to
develop their artistic talents even if they’re prepar-
ing for a career in other fields.A student who
plays an instrument can find an orchestra, band,
or other ensemble in which to perform. Choirs,
chorales, and a cappella groups offer opportunities
to sing.Any student can audition for a theater
production — or launch an independent project
(many campus productions result from student
initiatives). Our goal is to give all members of the
community what they need to develop fully, no
matter what career goal they choose.
Opportunities to participate in theater are
also available through University organizations
outside the theater department.These include
parking is free, and the facilities are the equal
of professional concert halls and theaters.
The jewel of the campus music performance
venues is the 1,003-seat Pick-Staiger Concert
Hall.With its splendid acoustics and intimate
ambience, Pick-Staiger is one of the Midwest’s
finest concert halls and an ideal location for hear-
ing great musicians.Among its annual offerings
are the Segovia Classical Guitar Series, the three-
week Winter Chamber Music Festival, and a
spring festival. Luminaries heard at Northwestern
in recent years include Daniel Barenboim,
Leon Fleisher,Von Freeman, Lynn Harrell, Sharon
Isbin, Christopher O’Riley, Paco Peña, Menahem
Pressler, Marcus Roberts, Gil Shaham, Janos
Starker, and Pinchas Zukerman.While on
campus, many of these artists also give master
classes, offering their expertise and insights to
our student performers.
In addition, the School of Music annually
presents more than 250 solo and chamber
music recitals by students and faculty and some
90 performances by the Northwestern Uni-
versity Symphony Orchestra, Symphonic Wind
Ensemble, Contemporary Music Ensemble,
University Chorale, and other major ensembles.
The Edith Mason and William E. Ragland
Opera Theater, supported by a generous

44
Arts Alliance, the largest student-run theatrical
producing organization in the United States, and
the Mee-Ow Show, an improvisational comedy
revue whose alumni include Julia Louis-Dreyfus
and Ana Gasteyer.
Besides myriad opportunities to perform,
the Evanston campus offers opportunities to
observe and learn from renowned practitioners
through visiting artists programs.The School of
Communication attracts nationally prominent
actors, directors, producers, and dancers who
visit classes and offer open question-and-answer
sessions. Recent visitors have included Pulitzer
Prize–winning playwright Tony Kushner, Oscar-
winning actress Meryl Streep, acclaimed lighting
designer Jennifer Tipton, Disney Channel creator
and president James Jimirro, and celebrated
alumni actors Harry Lennix and Zach Braff.
The School of Music has an illustrious
history of bringing world-renowned composers
to campus, including Sir Michael Tippett,Aaron
Copland, and Dmitri Shostakovich.This tradi-
tion continues with the recently inaugurated
Michael Ludwig Nemmers Prize in Musical
Composition, which includes a $100,000 cash
award and a performance by the Chicago
Symphony Orchestra.The first winner, John
Adams, was an ideal choice for a new prize
intended for the best of the best.Winner of

55

66
the 2003 Pulitzer Prize in Music for On the
Transmigration of Souls, Adams spent two separate
weeks in residence at Northwestern in 2005 and
then returned in January 2006 for a visit that
included the Chicago Symphony’s performance
of his Naïve and Sentimental Music. He returns
for a final residency this May in conjunction
with Chicago Opera Theater’s production of
his Nixon in China.
Much as Northwestern’s performing-arts
activities benefit the entire University and the
broader community, above all they serve our
primary mission — educating our students.
Our outstanding classroom and studio training
in music and theater complements what happens
on the concert and theatrical stage so that theory
and practice enrich each other, and the broad and
deep conceptual knowledge we provide to our
student performers is strengthened and enhanced
by opportunities to learn through direct experi-
ence.The result is a complete education in the
arts that equips our graduates to pursue their
dreams — wherever they may lead.
Henry S. Bienen, President

7
The American Music Theatre Project seeks to become a
permanent center for American musical theater on the
Northwestern campus. AMTP will develop and produce
new musicals by leading artists in collaboration with
Northwestern faculty and students, thereby serving as an
incubator for a new generation of writers for the musical
stage. The project was launched in May 2005 by the
School of Communication in collaboration with the School
of Music, J. L. Kellogg School of Management, Judd A.
and Marjorie Weinberg College of Arts and Sciences, and
Graduate School.
Multitalented students, state-of-the-art facilities, and
the Waa-Mu Show’s storied history have long made musical
theater one of Northwestern’s greatest strengths. Under
the leadership of theater professor Dominic Missimi, the
Music Theatre Program has equipped countless performers,
directors, and writers for successful careers on the musical
stage. As AMTP executive director, Missimi is now building
on this legacy in collaboration with Stuart Oken, former
executive vice president of Disney Theatrical, who brings
his commercial theater expertise to Northwestern as the
project’s artistic director.
Over a three-year period AMTP aims to develop and
produce five cutting-edge works by leading American
creative artists. The inaugural production, Was, opened the
Theatre and Interpretation Center’s 25th-anniversary season
last October 28. Based on the novel by Geoff Ryman and
with book and lyrics by Barry Kleinbort and music by
Northwestern graduate Joseph Thalken, Was interweaves
the stories of an 1870s orphan named Dorothy Gael and a
Building on an Already Stellar Musical Theater Tradition
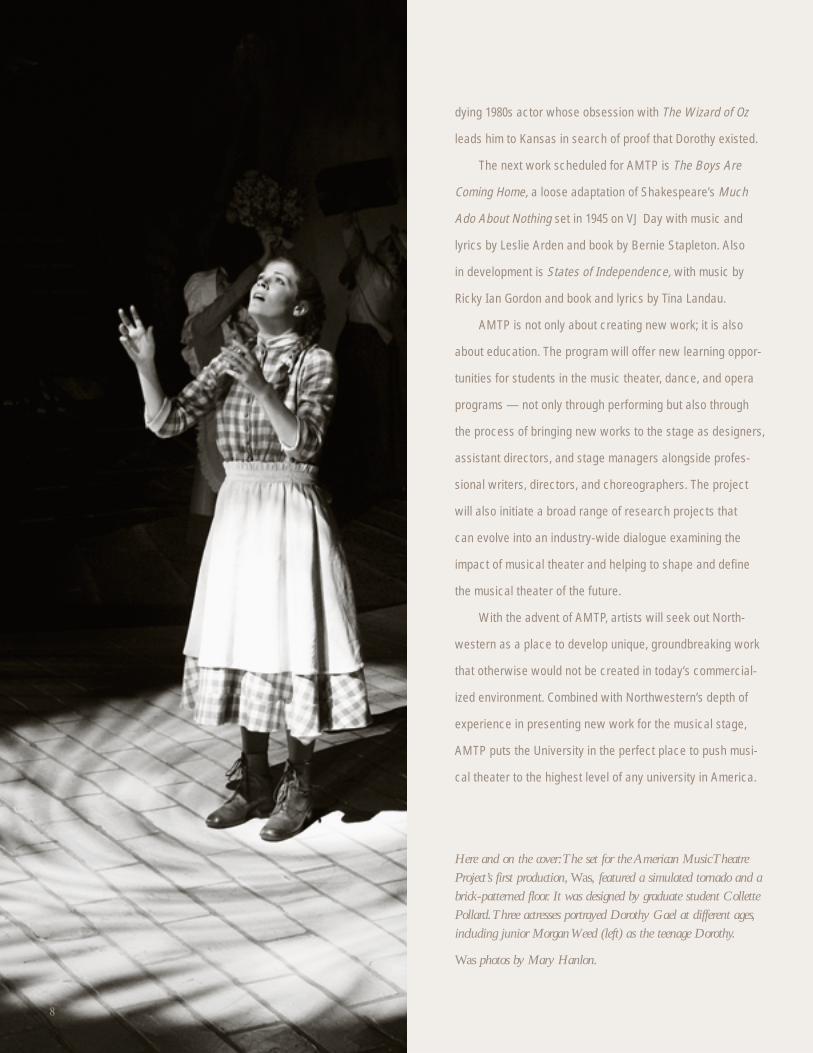
dying 1980s actor whose obsession with The Wizard of Oz
leads him to Kansas in search of proof that Dorothy existed.
The next work scheduled for AMTP is The Boys Are
Coming Home, a loose adaptation of Shakespeare’s Much
Ado About Nothing set in 1945 on VJ Day with music and
lyrics by Leslie Arden and book by Bernie Stapleton. Also
in development is States of Independence, with music by
Ricky Ian Gordon and book and lyrics by Tina Landau.
AMTP is not only about creating new work; it is also
about education. The program will offer new learning oppor-
tunities for students in the music theater, dance, and opera
programs — not only through performing but also through
the process of bringing new works to the stage as designers,
assistant directors, and stage managers alongside profes-
sional writers, directors, and choreographers. The project
will also initiate a broad range of research projects that
can evolve into an industry-wide dialogue examining the
impact of musical theater and helping to shape and define
the musical theater of the future.
With the advent of AMTP, artists will seek out North-
western as a place to develop unique, groundbreaking work
that otherwise would not be created in today’s commercial-
ized environment. Combined with Northwestern’s depth of
experience in presenting new work for the musical stage,
AMTP puts the University in the perfect place to push musi-
cal theater to the highest level of any university in America.
Here and on the cover:The set for the American Music TheatreProject’s first production, Was, featured a simulated tornado and abrick-patterned floor. It was designed by graduate student CollettePollard.Three actresses portrayed Dorothy Gael at different ages,including junior Morgan Weed (left) as the teenage Dorothy.
Was photos by Mary Hanlon.
88

99
Strong investment performance propelled increases in the University’s net assets and
total assets for the year ending August 31, 2005. Net assets increased 14.7 percent, to
more than $5.4 billion. Unrestricted net assets, which allow Northwestern to achieve
strategic goals despite external uncertainties, increased 17.9 percent, to nearly $4.5 billion,
and accounted for nearly 83 percent of the University’s total net assets.Total assets grew
12.8 percent and amounted to nearly $7.1 billion at August 31.
Investments totaled more than $4.5 billion, as detailed in the accompanying Investment
Report.The Long-Term Balanced Pool, the investment vehicle for the University’s perma-
nent and quasi-endowment assets, performed particularly well, returning nearly 20 percent.
A restructuring made the variable rate debt portfolio less costly to administer and
generated a new source of construction and renovation funds for the next few years.
In 2005 the University issued variable rate debt totaling $135 million while prepaying a
similar amount of variable rate debt from various older issuances.Total liabilities increased
only 7.1 percent, to less than $1.7 billion.
Increases in net tuition revenue, federal grants, and unrestricted private gifts helped
boost operating revenue sources 9.1 percent, to more than $1.2 billion. Operating
expenses rose more than 10 percent, to over $1.1 billion, due largely to facilities
depreciation, plant maintenance, and interest on indebtedness. Expenditures allocated
to institutional support, including an increase in insurance and fringe benefits expenses,
increased by $34 million.
The University takes a responsible approach to budgeting and investments. Our
goal is to manage finances so that the ability to fund academic programs and research
remains strong long-term.
Eugene S. Sunshine, Senior Vice President for Business and Finance
Report of the Senior Vice President for Business and Finance
10
Investment Report
The recovery in global economies boosted financial markets in fiscal year 2005. The broad domestic stock marketrose 15.3 percent, while foreign equities gained significantly more. Increased merger and acquisition activity provided a positive impetus to private investments and real estate. Sharp increases in the prices of commodities,particularly oil, drove returns in real assets such as commodity and energy investments. Increased demand fromemerging market economies, including China and India, also played a role in price increases.
Benefiting from this continued recovery, Northwestern registered solid portfolio growth. When the fiscal yearended on August 31, 2005, the University’s investment assets totaled $4.98 billion, including cash and intra-University investments, an increase of $644 million from August 31, 2004. It was the second year in a row of asset growth of more than $500 million.
The University’s Total Investment Pools The University maintains three primary investment pools: the Long-Term Balanced Pool, treasury pool funds, andseparately invested assets. Each investment pool has a specific set of objectives.
The Long-Term Balanced Pool, the primary fund, is managed with the objective of long-term total return. Becauseof its size and long-term orientation, performance data and investment strategy information in the discussion thatfollows relate to the Long-Term Balanced Pool.
Treasury pool funds are money market funds used for cash reserves and to preserve principal and maintain liquidity; intermediate-term bond investments; and working capital funds held by the University, which are gener-ated through the temporary differences between operating receipts and disbursements. These funds are not unitized.The income from investing them is used for general operating purposes. Working capital investments are held in avariety of money market instruments and guaranteed student loans or, if not needed within 90 days, are invested inthe Long-Term Balanced Pool.
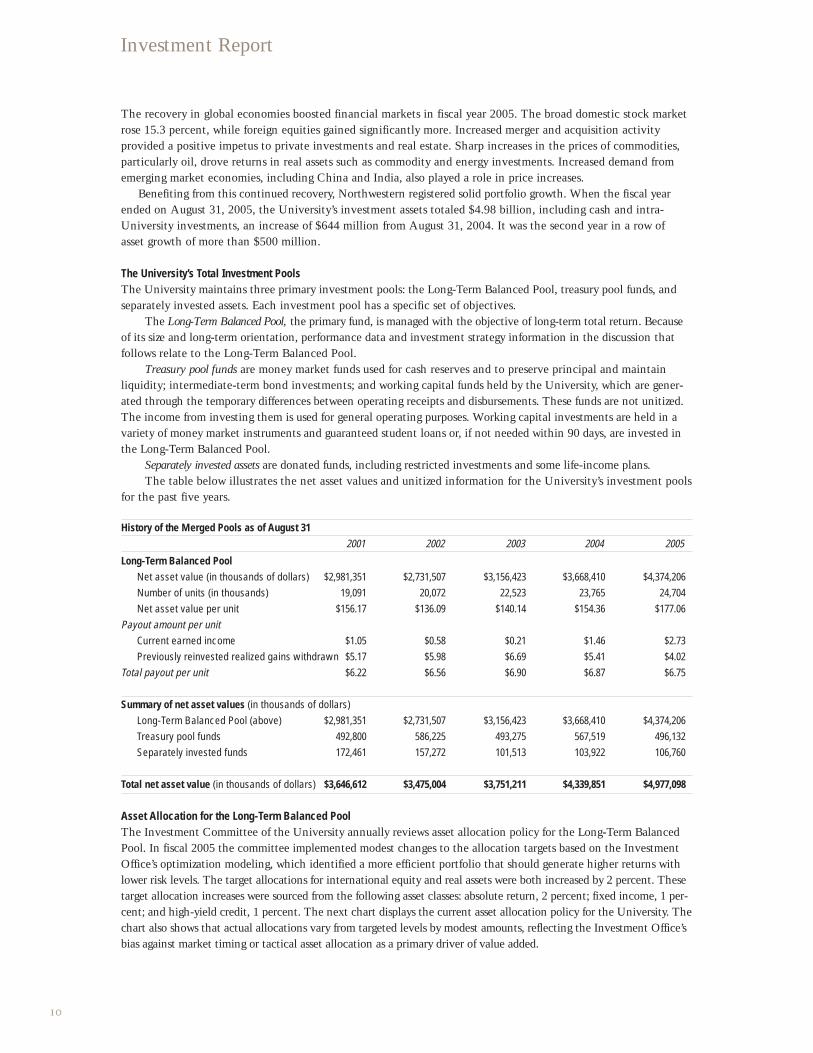
Separately invested assets are donated funds, including restricted investments and some life-income plans. The table below illustrates the net asset values and unitized information for the University’s investment pools
for the past five years.
History of the Merged Pools as of August 312001 2002 2003 2004 2005
Long-Term Balanced PoolNet asset value (in thousands of dollars) $2,981,351 $2,731,507 $3,156,423 $3,668,410 $4,374,206 Number of units (in thousands) 19,091 20,072 22,523 23,765 24,704 Net asset value per unit $156.17 $136.09 $140.14 $154.36 $177.06
Payout amount per unitCurrent earned income $1.05 $0.58 $0.21 $1.46 $2.73Previously reinvested realized gains withdrawn $5.17 $5.98 $6.69 $5.41 $4.02
Total payout per unit $6.22 $6.56 $6.90 $6.87 $6.75
Summary of net asset values (in thousands of dollars)Long-Term Balanced Pool (above) $2,981,351 $2,731,507 $3,156,423 $3,668,410 $4,374,206Treasury pool funds 492,800 586,225 493,275 567,519 496,132Separately invested funds 172,461 157,272 101,513 103,922 106,760
Total net asset value (in thousands of dollars) $3,646,612 $3,475,004 $3,751,211 $4,339,851 $4,977,098
Asset Allocation for the Long-Term Balanced PoolThe Investment Committee of the University annually reviews asset allocation policy for the Long-Term BalancedPool. In fiscal 2005 the committee implemented modest changes to the allocation targets based on the InvestmentOffice’s optimization modeling, which identified a more efficient portfolio that should generate higher returns withlower risk levels. The target allocations for international equity and real assets were both increased by 2 percent. Thesetarget allocation increases were sourced from the following asset classes: absolute return, 2 percent; fixed income, 1 per-cent; and high-yield credit, 1 percent. The next chart displays the current asset allocation policy for the University. Thechart also shows that actual allocations vary from targeted levels by modest amounts, reflecting the Investment Office’sbias against market timing or tactical asset allocation as a primary driver of value added.

11
Policy Portfolio Targets and RangesRange Target At August 31, 2005 Difference
U.S. equity securities 16–24% 20% 19.1% -.9% International equity securities 12–18% 15% 16.3% 1.3%Fixed-income securities 11–17% 14% 12.2% -1.8% High-yield credit 2–8% 5% 4.8% -.2%Absolute return 12–20% 16% 17.9% 1.9% Private investments 12–20% 16% 17.2% 1.2% Real assets 10–18% 14% 12.5% -1.5%Cash 0% 0% 0%
Investment Performance Objective: Preserving Purchasing Power and Growing IncomeThe principal objective for Northwestern’s Long-Term Balanced Pool is to preserve purchasing power and to provide a growing stream of income to fund University programs. On average, the pool seeks to achieve an annual total rate of return (i.e., actual income plus appreciation) equal to inflation plus actual spending. This objective of preserving purchasing power emphasizes the need for a long-term perspective in formulating both spending and investment policies. A more detailed look at the University’s spending guideline is on page 13 of this report.
The University’s investments historically have grown at a rate exceeding the objective. As of August 31, 2005, the Long-Term Balanced Pool’s assets were $4.37 billion, up approximately $706 million from last year. For the 12-month period ending August 31, 2005, the portfolio increased 19.81 percent, which was 12.18 percent abovethe objective. For the 3-, 10-, and 15-year periods ending August 31, 2005, the objective was exceeded by 7.42 percent,5.2 percent, and 4.9 percent, respectively. Only for the 5-year period did the pool perform below the objective, reflectingthe post–tech bubble difficulties of the late 1990s.
Annualized Returns: Exceeding the Objective
1-year 3-year 5-year 10-year 15-yearAnnual total return* 19.81% 14.71% 5.19% 11.42% 11.39%
– Spending 3.99% 4.47% 4.29% 3.82% 3.88%– Inflation 3.64% 2.81% 2.67% 2.4% 2.61%= Above objective 12.18% 7.42% -1.77% 5.2% 4.9%
*Total returns are net of fees and are calculated on annual changes in net asset value. They may differ from payout distributions.
Investment Performance Objective: Benchmark ComparisonsThe pool’s 19.8 percent gain for the 12-month period exceeded the 14.6 percent return of the composite benchmark,a blend of the benchmark returns for each asset class weighted by the policy allocation targets. Outperformance resulted primarily from the strong performance of the various portfolios relative to their respective benchmarks. In particular, real assets and international equities enjoyed outstanding absolute and relative performance. Thefollowing charts show returns and benchmarks for all asset classes for the fiscal year and for the five-year periodended August 31, 2005, when the pool also outperformed the composite benchmark (5.2 percent versus 1.2 per-cent). A more detailed explanation of activity and performance follows the second chart.
Long-Term Balanced Pool: Fiscal 2005 Net Performance Relative to Benchmarks (in percentages)
Real assets International U.S. equity Private High-yield Absolute Fixed-income Totalequity securities securities investments credit return securities performance
■ Northwestern ■ Benchmark
12.99.7
1922.6
31
26.6
20.3
15.3
3.7 3.9
18.2
9.3
34
11.9
▲ ▲
19.8
14.6
12
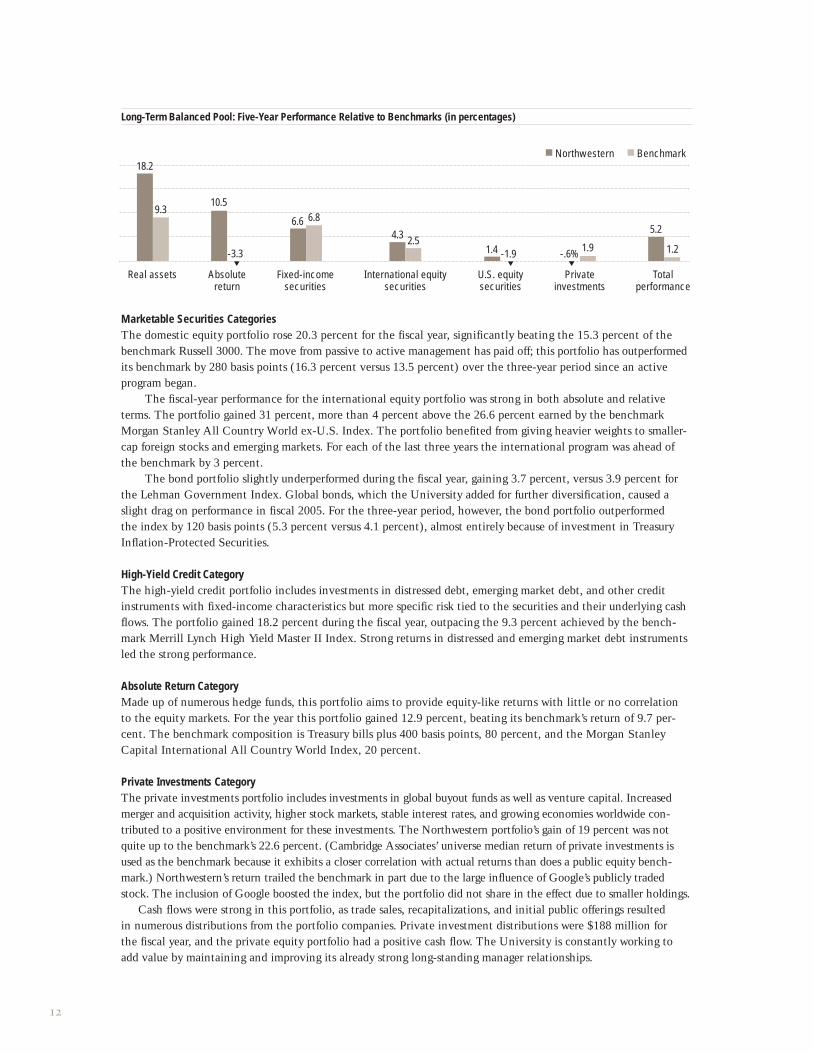
Long-Term Balanced Pool: Five-Year Performance Relative to Benchmarks (in percentages)
Marketable Securities CategoriesThe domestic equity portfolio rose 20.3 percent for the fiscal year, significantly beating the 15.3 percent of thebenchmark Russell 3000. The move from passive to active management has paid off; this portfolio has outperformedits benchmark by 280 basis points (16.3 percent versus 13.5 percent) over the three-year period since an active program began.
The fiscal-year performance for the international equity portfolio was strong in both absolute and relativeterms. The portfolio gained 31 percent, more than 4 percent above the 26.6 percent earned by the benchmarkMorgan Stanley All Country World ex-U.S. Index. The portfolio benefited from giving heavier weights to smaller-cap foreign stocks and emerging markets. For each of the last three years the international program was ahead ofthe benchmark by 3 percent.
The bond portfolio slightly underperformed during the fiscal year, gaining 3.7 percent, versus 3.9 percent forthe Lehman Government Index. Global bonds, which the University added for further diversification, caused aslight drag on performance in fiscal 2005. For the three-year period, however, the bond portfolio outperformed the index by 120 basis points (5.3 percent versus 4.1 percent), almost entirely because of investment in TreasuryInflation-Protected Securities.
High-Yield Credit CategoryThe high-yield credit portfolio includes investments in distressed debt, emerging market debt, and other credit instruments with fixed-income characteristics but more specific risk tied to the securities and their underlying cashflows. The portfolio gained 18.2 percent during the fiscal year, outpacing the 9.3 percent achieved by the bench-mark Merrill Lynch High Yield Master II Index. Strong returns in distressed and emerging market debt instrumentsled the strong performance.
Absolute Return CategoryMade up of numerous hedge funds, this portfolio aims to provide equity-like returns with little or no correlation to the equity markets. For the year this portfolio gained 12.9 percent, beating its benchmark’s return of 9.7 per-cent. The benchmark composition is Treasury bills plus 400 basis points, 80 percent, and the Morgan StanleyCapital International All Country World Index, 20 percent.
Private Investments CategoryThe private investments portfolio includes investments in global buyout funds as well as venture capital. Increasedmerger and acquisition activity, higher stock markets, stable interest rates, and growing economies worldwide con-tributed to a positive environment for these investments. The Northwestern portfolio’s gain of 19 percent was notquite up to the benchmark’s 22.6 percent. (Cambridge Associates’ universe median return of private investments isused as the benchmark because it exhibits a closer correlation with actual returns than does a public equity bench-mark.) Northwestern’s return trailed the benchmark in part due to the large influence of Google’s publicly tradedstock. The inclusion of Google boosted the index, but the portfolio did not share in the effect due to smaller holdings.
Cash flows were strong in this portfolio, as trade sales, recapitalizations, and initial public offerings resulted in numerous distributions from the portfolio companies. Private investment distributions were $188 million for the fiscal year, and the private equity portfolio had a positive cash flow. The University is constantly working toadd value by maintaining and improving its already strong long-standing manager relationships.
■ Northwestern ■ Benchmark
Real assets Absolute Fixed-income International equity U.S. equity Private Totalreturn securities securities securities investments performance
10.5
5.2
1.24.3 2.5
1.4 -1.9
6.6 6.8
-.6% 1.9
18.2
9.3
▲
-3.3
▲ ▲

13
Real Assets CategoryThe real assets portfolio includes the University’s investments in energy, timber, real estate, and other commodities.This portfolio was the strongest asset category in fiscal 2005, gaining 34 percent. Rising energy prices, increasingglobal demand for commodities and energy-related substances, and improving real estate fundamentals all contributedto the returns. Cash distributions of $203 million from energy and real estate partnerships were particularly strong.
Long-Term Balanced Pool Spending Guideline After reviewing the Long-Term Balanced Pool’s spending guideline, the University’s Investment and BudgetCommittees recommended changing the market value calculation from the average of the prior two years to theaverage of the latest 12 months of a unit in the pool. The Board of Trustees ratified the change in fiscal 2005. The revised spending guideline blends two elements:• The market element adjusts annual endowment spending to the long-term sustainable target spending of 4.1 percent
of the average actual market value of the endowment for the latest 12 months. This component of the spendingrate receives a 30 percent weighting in the spending rate calculation.
• The spending element increases the previous year’s spending rate by a factor for inflation (3.5 percent) plus budgetgrowth (1.5 percent). This element of the spending rate receives a weight of 70 percent.
The actual spending rate per unit for fiscal year 2005 was $6.75; it will be $6.81 for fiscal year 2006. The payoutrate for fiscal year 2005 was 3.91 percent.
Payout Determined by Spending Guideline 2001 2002 2003 2004 2005
Spending per unit $6.22 $6.56 $6.90 $6.87 $6.75Net asset value per unit $156.17 $136.09 $140.14 $154.36 $177.06Payout rate* 3.56% 4.3% 4.76% 4.46% 3.91%Total (in millions of dollars) $117.20 $130.20 $150.69 $160.44 $161.44Growth in spending per unit 17.36% 5.47% 5.18% -.43% -1.75%
*Payout rate is calculated as spending per unit divided by the two-year average net asset value per unit before distribution of the annual contribution to the budget.
The Long-Term Balanced Pool: In ConclusionIn summary, the Long-Term Balanced Pool continues to recover from the difficult post–tech bubble environment,attaining new highs in asset value. Its diversified nature was enhanced by the addition of numerous uncorrelatedstrategies. The portfolio is well positioned to perform over long time horizons in order to meet investment objectives.
Securities LendingDuring the prior fiscal year Northwestern initiated a securities lending program with its bank custodian, NorthernTrust. The agreement allows the investment custodian to lend University securities to approved brokers in exchangefor a fee. At August 31, 2005, investment securities with an aggregate market value of $655 million were loaned to various brokers and are returnable on demand. In exchange, the University received cash collateral of $562 millionand noncash collateral of $105 million at August 31, 2005. The University earned $1.2 million on securities lending activities through the end of fiscal 2005.
William H. McLean, Vice President and Chief Investment Officer

14
Report of Independent Auditors
To the Board of Trustees of Northwestern University:
We have audited the accompanying consolidated statements of financial position of
Northwestern University and subsidiaries (the “University”) as of August 31, 2005 and
2004, and the related statements of activities and cash flows for the years then ended.
These financial statements are the responsibility of the management of the University. Our
responsibility is to express an opinion on these financial statements based on our audits.
We conducted our audits in accordance with auditing standards generally accepted
in the United States of America.Those standards require that we plan and perform the
audit to obtain reasonable assurance about whether the financial statements are free of
material misstatement.An audit includes consideration of internal control over financial
reporting as a basis for designing audit procedures that are appropriate in the circum-
stances, but not for the purpose of expressing an opinion on the effectiveness of the
University’s internal control over financial reporting. Accordingly, we express no such
opinion. An audit also includes examining, on a test basis, evidence supporting the
amounts and disclosures in the financial statements, assessing the accounting principles
used and significant estimates made by management, as well as evaluating the overall
financial statement presentation.We believe that our audits provide a reasonable basis
for our opinion.
In our opinion, such financial statements present fairly, in all material respects,
the financial position of the University as of August 31, 2005 and 2004, and the
changes in its net assets and the cash flows for the years then ended in conformity
with accounting principles generally accepted in the United States of America.
Chicago, Illinois
January 6, 2006
15
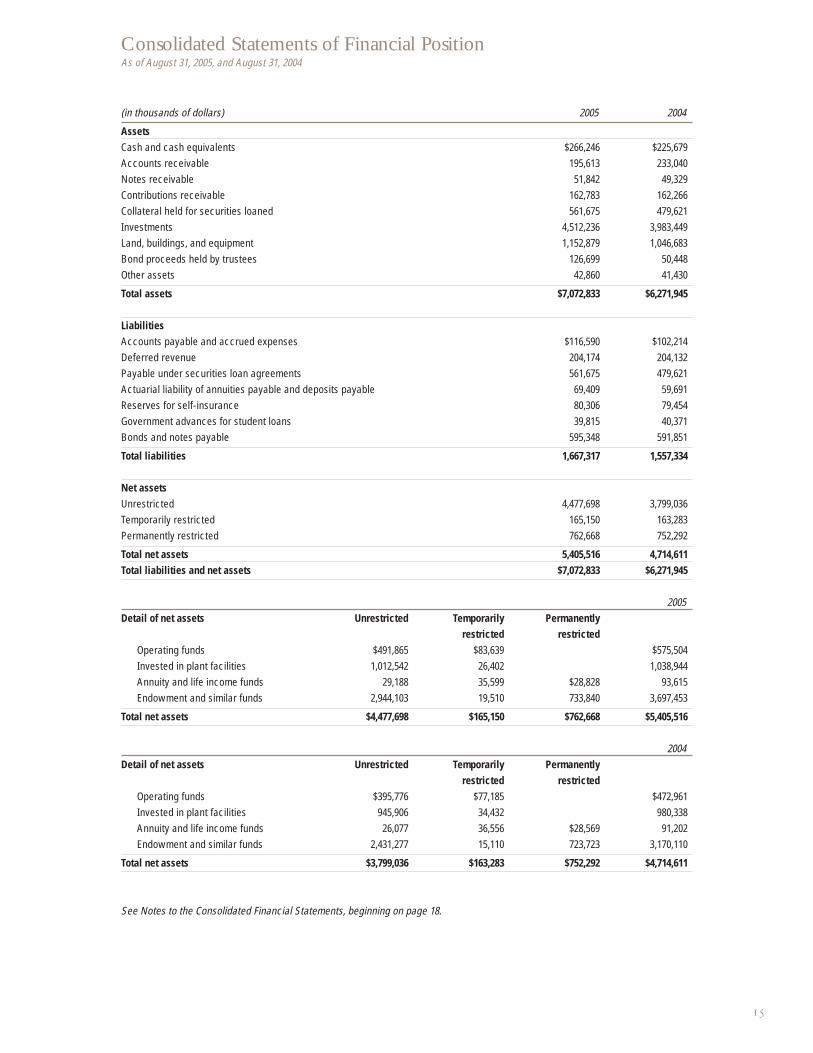
Consolidated Statements of Financial PositionAs of August 31, 2005, and August 31, 2004
(in thousands of dollars) 2005 2004
AssetsCash and cash equivalents $266,246 $225,679Accounts receivable 195,613 233,040Notes receivable 51,842 49,329Contributions receivable 162,783 162,266Collateral held for securities loaned 561,675 479,621Investments 4,512,236 3,983,449Land, buildings, and equipment 1,152,879 1,046,683Bond proceeds held by trustees 126,699 50,448Other assets 42,860 41,430
Total assets $7,072,833 $6,271,945
LiabilitiesAccounts payable and accrued expenses $116,590 $102,214Deferred revenue 204,174 204,132Payable under securities loan agreements 561,675 479,621Actuarial liability of annuities payable and deposits payable 69,409 59,691Reserves for self-insurance 80,306 79,454Government advances for student loans 39,815 40,371Bonds and notes payable 595,348 591,851
Total liabilities 1,667,317 1,557,334
Net assetsUnrestricted 4,477,698 3,799,036Temporarily restricted 165,150 163,283Permanently restricted 762,668 752,292
Total net assets 5,405,516 4,714,611Total liabilities and net assets $7,072,833 $6,271,945
2005Detail of net assets Unrestricted Temporarily Permanently
restricted restrictedOperating funds $491,865 $83,639 $575,504Invested in plant facilities 1,012,542 26,402 1,038,944Annuity and life income funds 29,188 35,599 $28,828 93,615Endowment and similar funds 2,944,103 19,510 733,840 3,697,453
Total net assets $4,477,698 $165,150 $762,668 $5,405,516
2004Detail of net assets Unrestricted Temporarily Permanently
restricted restrictedOperating funds $395,776 $77,185 $472,961Invested in plant facilities 945,906 34,432 980,338Annuity and life income funds 26,077 36,556 $28,569 91,202Endowment and similar funds 2,431,277 15,110 723,723 3,170,110
Total net assets $3,799,036 $163,283 $752,292 $4,714,611
See Notes to the Consolidated Financial Statements, beginning on page 18.

16
(in thousands of dollars) 2005 2004
Changes in unrestricted net assetsOperating revenues
Tuition and fees $527,864 $496,484(less scholarships and fellowships) (153,205) (145,171)Net tuition and fees 374,659 351,313Auxiliary services 63,579 65,626Grants and contracts 349,215 333,154Private gifts 68,561 18,869Investment return designated for operations 219,023 210,290Professional fees 27,735 27,502Sales and services 109,536 103,716Other income 5,372 5,144
Total operating revenues $1,217,680 $1,115,614
Operating expensesInstruction 416,302 392,186Research 291,478 275,430Academic support 144,830 124,953Student services 94,891 82,998Institutional support 123,463 88,831Auxiliary services 98,692 99,191
Total operating expenses 1,169,656 1,063,589Excess of operating revenues over expenses 48,024 52,025NonoperatingPrivate gifts and grants for buildings and equipment 30,826 28,751Investment gains reinvested 560,401 338,618Change in unrestricted net assets from 591,227 367,369nonoperating activitiesNet assets released from restrictions 39,411 50,331Change in unrestricted net assets 678,662 469,725
Changes in temporarily restricted net assetsPrivate gifts 40,503 10,293Net (loss) gain on annuity obligation (1,410) 7,017Investment returns 2,185 41,278 2,126 19,436Net assets released from restrictions (39,411) (50,331)Change in temporarily restricted net assets 1,867 (30,895)Changes in permanently restricted net assetsPrivate gifts 10,297 38,998Net gain on annuity obligation 79 10,376 1,041 40,039Change in permanently restricted net assets 10,376 40,039
Change in net assets 690,905 478,869
Beginning net assets $4,714,611 $4,235,742Ending net assets $5,405,516 $4,714,611
See Notes to the Consolidated Financial Statements, beginning on page 18.
Consolidated Statements of ActivitiesFor the fiscal years ended August 31, 2005, and August 31, 2004

17
(in thousands of dollars) 2005 2004
Cash flows from operating activitiesChange in net assets $690,905 $478,869
Adjustments to reconcile change in net assets to net cash provided by operating activities
Depreciation 62,426 52,890 Loss on retirement of equipment 869 749 Net realized and unrealized gains on investments (658,145) (464,959) Private gifts and grants for long-term investments (30,826) (28,751)
Changes in assets and liabilities Accounts receivable 37,422 (36,876)Contributions receivable (517) 30,118 Other assets (1,430) (6,284)Accounts payable and accrued expenses (6,607) (7,777)Deferred revenue 42 13,984 Reserves for self-insurance 852 18,064 Government advances for student loans (556) (731)
Net cash provided by operating activities 94,435 49,296
Cash flows from (used in) investing activitiesPurchases of investments (1,907,909) (1,830,837)Proceeds from sales of investments 2,040,278 1,759,569 (Increase) decrease in trusts held by others 5 (22)Increase in investments held for others (3,011) (3,385)Acquisitions of land, buildings, and equipment (148,508) (139,906) Student loans disbursed (106,833) (101,957) Principal collected on student loans 104,320 102,571
Net cash used in investing activities (21,658) (213,967)
Cash flows from financing activitiesNet proceeds from issuance of notes payable and bonds payable 135,800 185,010 Net principal payments on notes and bonds payable (132,377) (48,332)Amortization of discount on bonds payable 74 1,210 Increase in bond proceeds held by trustees (76,251) (48,687)Proceeds from private gifts and grants for long-term investments 30,826 28,751 Increase in annuities and deposits payable 9,718 765
Net cash (used in) provided by financing activities (32,210) 118,717
Increase (decrease) in cash and cash equivalents 40,567 (45,954)Cash and cash equivalents at beginning of year 225,679 271,633
Cash and cash equivalents at end of year $266,246 $225,679
Supplemental disclosure of cash flow informationAccrued liabilities for construction in progress $20,983 $19,174Cash paid for interest 21,114 18,884
See Notes to the Consolidated Financial Statements, beginning on page 18.
Consolidated Statements of Cash FlowsFor the fiscal years ended August 31, 2005, and August 31, 2004

18
1. Summary of Significant Accounting PoliciesOperationsNorthwestern University is a major private research university with more than 17,000 students enrolled in 11 academic divisions on two lakefront campuses.
Basis of AccountingThe University maintains its accounts and prepares its consolidated financial statements on the accrual basis of accounting. These statements include all wholly owned subsidiaries. All significant intercompany transactions andaccounts have been eliminated.
The University prepares its financial statements in accordance with Statement of Financial Accounting Standards(SFAS) No. 116, “Accounting for Contributions Received and Contributions Made,” and SFAS No. 117, “FinancialStatements of Not-for-Profit Organizations.” SFAS No. 116 requires that contributions received, including uncondi-tional promises to give (pledges), be recognized as revenues at their fair values. SFAS No. 117 establishes standardsfor external financial reporting by not-for-profit organizations and requires that net assets and the flow of those assetsbe classified in three net asset categories according to the existence or absence of donor-imposed restrictions.
The category Unrestricted Net Assets describes funds that are legally available for any purpose and have no donor-imposed restrictions. All revenues, expenses, gains, and losses are classified as unrestricted net assets unlessthey are changes in temporarily or permanently restricted net assets.
The category Temporarily Restricted Net Assets includes gifts for which donor-imposed restrictions have not been met (these are primarily future capital projects) and trust activity and pledges receivable whose ultimate use is not permanently restricted.
The category Permanently Restricted Net Assets applies to gifts, trusts, and pledges whose donors required that the principal be held in perpetuity and that only the income be available for stipulated program operations. This category includes gifts stipulated for student loans.
Nonoperating activities primarily reflect transactions of a long-term investment or capital nature, including contributions to be invested for the support of future operations, contributions to be used for facilities and equipment, and certain unrealized gains or losses.
Income from temporarily restricted sources is reclassified as unrestricted income when the circumstances of the restriction have been fulfilled. Donor-restricted revenues whose restrictions are met within the same fiscal year are reported as unrestricted income. All expenditures are reported in the unrestricted class of net assets, sincethe use of restricted contributions in accordance with the donor’s stipulations causes the release of the restriction.
InvestmentsInvestments are recorded at fair value, determined on the following basis:• Equity securities with readily determinable fair values and debt securities are valued at the last sale price (if quota-
tions are readily available) or at the closing bid price in the principal market in which such securities are normallytraded (if no sale price is available). Certain fixed-income securities are valued based on dealer-supplied valuations.
• The estimated fair values of equity securities that do not have readily determined fair values, and of other investments, are based on estimates provided by external investment managers and are examined through a valuation review process performed by management. After this review, management may determine that an adjustment to the external managers’ valuations is appropriate in recording the securities’ fair value atAugust 31. The aggregate carrying value of such investments was $2,062.2 million and $1,951.8 million atAugust 31, 2005, and 2004, respectively. A range of possible values exists for these securities, and therefore the estimated values may differ from the values that would have been used had a ready market for these securities existed. In the absence of another basis, management has determined that cost represents an approximation of thefair value of such investments.
The University continually monitors the difference between the cost and the estimated fair value of its invest-ments. If any of the investments experiences a decline in value that the University believes is other than temporary,the University recognizes a realized loss in investment income in the consolidated statements of activities.
Investment income is recorded on the accrual basis, and purchases and sales of investment securities are reflected on a trade-date basis.
Derivative Financial InstrumentsThe University uses various financial instruments to hedge the risk of decline in fair value of certain equity securi-ties. Equity options and equity-indexed options are used to reduce the primary market risk exposure (e.g., equity price risk) of the hedged item in conjunction with the specific hedged strategy; if applicable, these have a reference
Notes to the Consolidated Financial StatementsFor the fiscal years ended August 31, 2005, and August 31, 2004

19
index (e.g., S&P 500) that is the same, or highly correlated with, the reference index of the hedged item. Similarly,the University also enters into swap agreements to hedge public real estate equity exposure and obtain S&P 500 equity index exposure, and it uses futures contracts on an equity index. Such equity instruments are not designated as hedges for accounting purposes and are recorded at fair value.
Fair Values of Financial Instruments Other than InvestmentsThe fair values of financial instruments other than investments are based on a variety of factors. In some cases, fairvalues represent quoted market prices for identical or comparable instruments. In other cases, fair values have been estimated based on assumptions about the amount and timing of estimated future cash flows and assumed discount ratesreflecting varying degrees of risk. Accordingly, the fair values may not represent actual values that could have been realized at year-end or that will be realized in the future. At August 31, 2005, the fair values of the University’s fixedrate debt of $385 million exceeded the carrying value of $360 million by $25 million. At August 31, 2004, the fairvalues of the University’s fixed rate debt of $384 million exceeded the carrying value of $362 million by $22 million.
Accounts and Notes ReceivableAccounts receivable arising from tuition and fees are carried net of an allowance for doubtful accounts of $332,000and $286,000 as of August 31, 2005, and 2004, respectively. Notes receivable resulting from student loans are carriednet of an allowance for doubtful accounts of $253,000 and $271,000 as of August 31, 2005, and 2004, respectively.
Receivables from Northwestern Medical Faculty Foundation (NMFF), a related party (see next page), arising out of operational activities totaled $15.6 million and $25.7 million as of August 31, 2005, and 2004, respectively.
Land, Buildings, and EquipmentThe value of land, buildings, and equipment is recorded at cost or, if received as gifts, at fair market value at the dateof the gift. Significant renewals and replacements are capitalized. The cost of repairs and maintenance is expensedas incurred. Purchases of library books are also expensed.
Depreciation is calculated using the straight-line method over the useful lives of the buildings and equipment,which are estimated to be 3 to 20 years for equipment and a maximum of 40 years for buildings. The University follows SFAS No. 144, “Accounting for the Impairment or Disposal of Long-Lived Assets.” The provisions underthis statement include a requirement that long-lived assets be reviewed for impairment by comparing the futurecash flows expected from the asset to the carrying value of the asset. If the carrying value of an asset exceeds the sum of estimated undiscounted future cash flows, an impairment loss is recognized for the difference between estimated fair value and carrying value. In management’s opinion, no impairment existed as of August 31, 2005.
Charitable Remainder TrustsCharitable remainder trusts are classified as permanently restricted net assets if, upon termination of the trust, the donorpermanently restricts the remaining trust assets. If the remainder is temporarily restricted or unrestricted by the donor,the charitable remainder trust assets are recorded as temporarily restricted net assets.
Annuities PayableAnnuities payable consist of annuity payments currently due and the actuarial amount of annuities payable. The actuarialamount of annuities payable is the present value of the aggregate liability for annuity payments over the expectedlives of the beneficiaries (based on the mortality tables in the Internal Revenue Code, Publication 939, April 2003).
Self-Insurance ReservesThe University maintains a self-insurance program for general liability, professional liability, and certain employeeand student insurance coverages. This program is supplemented with commercial excess insurance above theUniversity’s self-insurance retention.
Revenue RecognitionRevenues from tuition and fees are reported in the fiscal year in which educational programs are predominantly conducted. Fiscal year 2006 fall-quarter tuition and fees, billed in fiscal year 2005, are reported as deferred revenue in fiscal year 2005. Similarly, fiscal year 2005 fall-quarter tuition and fees, billed in fiscal year 2004, are reported as deferred revenue in fiscal year 2004.
Grants and contracts revenue is recognized as expenses are incurred on the project. Private gifts, including unconditional promises to give, are recognized as revenues in the period received. Conditional promises to give are not included in revenue until the conditions are substantially met. Pledges receivable due in more than

20
one year are recorded at the present value of the estimated future cash flows. The expiration of a donor-imposed restriction on a contribution is recognized in the period in which the restriction expires, and the related resourcesthen are classified as unrestricted net assets.
Income TaxesThe University is exempt from income taxes under Section 501(c)(3) of the U.S. Internal Revenue Code, exceptwith regard to unrelated business income, which is taxed at corporate income tax rates.
Related PartiesNorthwestern Medical Faculty Foundation is a multispecialty physician organization committed to providing clinicalcare to patients and to supporting the research and academic endeavors of Northwestern’s Feinberg School of Medicine.An independent not-for-profit organization, NMFF is governed by a board of directors. NMFF physicians are full-timefaculty members or researchers at Feinberg and attending physicians at Northwestern Memorial Hospital. Under theterms of an agreement with Northwestern University, NMFF contributes a percentage of its revenue to a research andeducation fund, medical education programs, basic and applied biomedical research facilities and programs, and researchand educational support services. NMFF also contributes funds to Feinberg’s teaching and research activities on a discre-tionary basis. These contributions totaled $25.9 million in fiscal year 2005 and $21.9 million in fiscal year 2004.
Uses of Estimates in the Preparation of Financial StatementsThe preparation of financial statements in conformity with accounting principles generally accepted in the UnitedStates of America requires management to make estimates and assumptions that affect the reported amounts of assetsand liabilities; the disclosure of contingent assets and liabilities at the date of the financial statements; and the re-ported amounts of revenues and expenses during the relevant period. Actual results could differ from those estimates.
At August 31, 2005, and 2004, reserves were established for uncollectible accounts, student loans, andpledges receivable. These reserves were estimated based on historical collection and allowance practices as well as on management’s evaluation of current trends.
The reserves for self-insurance and postretirement medical and life insurance benefits were based on actuarial studies. The University believes that the methods and assumptions used in computing these reserves and liabilities
are appropriate.
Accounting PronouncementsIn May 2003 the Financial Accounting Standards Board (FASB) issued SFAS No. 150, “Accounting for CertainFinancial Instruments with Characteristics of Both Liabilities and Equity.” SFAS 150 modifies the accounting and financial statement disclosures for instruments with characteristics of both liabilities and equity that an issuer previ-ously could account for as equity in its statement of financial position. In FASB Staff Position No. 150-3, “EffectiveDate, Disclosures, and Transition for Mandatorily Redeemable Financial Instruments of Certain Nonpublic Entitiesand Certain Mandatorily Redeemable Noncontrolling Interests under FASB Statement No. 150,” issued November2003, the FASB deferred the effective date of SFAS 150 for nonpublic entities until the first fiscal period begin-ning after December 15, 2004, or, for the University, for the fiscal year ending August 31, 2006. The Universitybelieves that the adoption of SFAS 150 during the fiscal year ending August 31, 2006, will not have a material effecton the consolidated financial statements.
In March 2005 the FASB issued FASB Interpretation No. 47, “Accounting for Conditional Asset RetirementObligations — an Interpretation of FASB Statement No. 143.” FIN 47 clarifies that the term “conditional asset retirement obligation” used in SFAS No.143 refers to an entity’s legal obligation to perform an asset retirement activity whose timing and/or method of settlement depend on a future event the entity does not necessarily control.Accordingly, the entity is required to recognize a liability for the fair value of a conditional asset retirement obliga-tion if the fair value can be reasonably estimated. The fair value should be recognized when incurred — generallyupon acquisition, construction, or development and/or through the normal operation of the asset.
FIN 47 will be effective for the 2006 fiscal year, and the University plans to adopt it then. The University is reviewing and analyzing the impact that adopting FIN 47 will have on the consolidated financial statements.
ReclassificationsCertain prior-year amounts have been reclassified to conform to current-year presentation of investments held by theUniversity. In addition, the prior-year cash flow has been modified to reflect a change in the presentation of accruedliabilities for construction in progress. The amount reclassified, totaling $19,174, is reflected as a decrease in net cashprovided by operating activities and a decrease in net cash used in investing activities.

21
2. Bonds and Notes PayableThe University had $100 million and $135.8 million placed in commercial paper at August 31, 2005, and 2004, respectively.
Bonds payable are as follows:
(in thousands of dollars) August 31, 2005 August 31, 2004
Demand revenue bondsIFA–Series 1985 varying adjustable interest rates $0 $35,300IFA–Series 1985 University Pooled Financing Program,
variable rate 0 4,000IFA–Series 1985 Cultural Pooled Financing Program,
variable rate 0 9,992IFA–Series 1988, variable rate 0 45,100 IFA–Series 1993, fixed rate 25,195 27,420Less unamortized discount on IFA–Series 1993 (657) (731)IFA–Series 1997, fixed rate 150,000 150,000IFA–Series 2003, fixed rate 185,010 185,010
IFA–Series 2004, variable rate 135,800 Total $495,348 $456,091
Total obligations including commercial paper at August 31, 2005, are scheduled to mature through August 31 ofeach period as follows:
(in thousands of dollars)
2006 $107,2372007 12,3172008 12,4072009 17,5072010 17,6022011–2015 90,9382016–2020 41,4052021–2025 10,1352026–2030 0Thereafter 285,800Total $595,348
In fiscal year 2005 the University elected to prepay the IFA–Series 1985 and 1988 Adjustable Demand RevenueBonds in whole, without premium. The Series 1985 bond, whose principal amounted to $35.3 million, was redeemedon September 25, 2004. The Series 1988 bond, whose principal amounted to $45.1 million, was redeemed onSeptember 10, 2004.
At the option of the University and upon compliance with certain conditions, the IFA–Series 1985 and 1988Adjustable Demand Revenue Bonds may operate in one of four variable-interest-rate modes or may be converted to a fixed rate until maturity or earlier redemption. At September 8, 2004, $35.3 million of the Series 1985 and all of the Series 1988 bonds operated in the weekly variable modes, under which the interest rate is adjusted weeklybased on prevailing market rates for similar securities. The weekly interest rate at September 8, 2004, was 1.3 percent.
Also in fiscal year 2005, the University elected to prepay the IFA–Series 1985 Cultural Pooled FinancingProgram bond in whole, without premium; its promissory note; and the underabsorbed financing costs onSeptember 15, 2004, which amounted to $9.99 million in principal costs.
Under the IFA–Series 1985 Cultural Pooled Financing Program, the University assumed an additional liability representing its prorated share of underabsorbed financing costs that at September 2, 2004, amounted to $255,000. The University Pooled Financing Program and Cultural Pooled Financing Program may operate inthe weekly variable-interest-rate mode or may be converted to a fixed rate until maturity. The fixed-rate conversion requires the consent of all participants in the pools. At September 8, 2004, the bonds operated in the weekly variable mode and bore interest at 1.3 percent. The bonds are collateralized by certificates of deposit held by thetrustee in amounts equal to 1.67 percent of the bonds outstanding.

22
The IFA–Series 1993 Revenue Refunding Bonds operate in a fixed mode until maturity, bearing interest atfixed rates ranging from 3 percent to 5.55 percent (weighted average rate at August 31, 2005, of 5.3 percent) andmaturing from December 1, 2005, to December 1, 2013. Proceeds of the refunding bonds were invested in UnitedStates government securities with a cost of $75.4 million and placed in escrow to satisfy scheduled payments of $66.4 million of the IFA–Series 1985 bonds and related interest until maturity. In 1993 this transaction was accounted for as an in-substance defeasance. In October 2003, $35 million of the outstanding IFA–Series 1993bonds were refunded with the issuance of the IFA–Series 2003 revenue bonds.
The IFA–Series 1976 and 1977 Demand Revenue Bonds were defeased on June 1 and July 1, 1996, respectively,through the issuance of commercial paper through the IFA–Series 1995 Pooled Financing Program. Principal paymenton the 1985 demand revenue bond is also included in the program. The commercial paper, totaling $35.8 million in aggregate principal, was prepaid in whole, without premium, on September 2, 2004. In addition, on July 15, 2005,the University began placing commercial paper under a new $200 million commercial paper program.
The IFA–Series 1997 Adjustable Medium-Term Revenue Bonds operate in a fixed mode until maturity, bear-ing interest at fixed rates ranging from 4.7 percent to 5.25 percent (weighted average rate at August 31, 2005, of 5.07 percent) and maturing from November 1, 2005, to November 1, 2015. The bonds are subject to mandatorytender at the stated dates and may be reissued in one of several permissible modes described in the agreements. The bonds will ultimately mature on November 1, 2032.
The IFA–Series 2003 Fixed-Rate Revenue Bonds totaling $185 million were issued on October 29, 2003. The bonds were issued to acquire, construct, or renovate certain University facilities and to bring about the current refunding of $35 million of the University’s outstanding IFA–Series 1993 bonds, subject to conditions setforth in a trust indenture and loan agreement between the University and the Illinois Facilities Authority. Thebonds were issued at a fixed rate of 5 percent and will mature from December 1, 2014, to December 1, 2038.
The IFA–Series 2004 Adjustable Rate Revenue Bonds, totaling $135.8 million, were issued on September 9,2004. The bonds were issued to acquire, construct, renovate, remodel, improve, and equip capital projects on both theEvanston and Chicago campuses, subject to conditions set forth in a trust indenture and loan agreement between theUniversity and the Illinois Facilities Authority. The bonds may operate in a daily, weekly, adjustable, or auction ratemode. In fiscal year 2005 the revenue bonds operated in a weekly rate mode, determined by the remarketing agents.The weekly interest rates at August 31, 2005, were 2.36 and 2.32 percent. The bonds will mature December 1, 2034.
The lending agreements covering the IFA demand revenue bond issues also provide that the third-partylender may purchase bonds, at a rate not exceeding the third-party lender’s corporate base rate or prime rate (asdefined), for which a demand has been made.
The lending agreements covering the demand revenue bond issues contain covenants that, among other things,require the University to maintain prescribed amounts of working capital (as defined). The covenants place certainlimits on indebtedness and require holding investments in prescribed minimum amounts and maintaining certainfinancial ratios related to debt service, net assets to indebtedness, and assets to indebtedness. The University was incompliance with the covenants at August 31, 2005.
3. Contributions ReceivableContributions receivable consisted of the following:
(in thousands of dollars) August 31, 2005 August 31, 2004
Unconditional promises expected to be collected inLess than one year $49,431 $47,239One year to five years 116,874 121,536More than five years 43,986 47,285
Less discount to present value and other reservesDiscount to present value (40,842) (43,698)Other reserves (6,666) (10,096)
Total $162,783 $162,266
4. InvestmentsThe University’s investments are overseen by the Investment Committee of the Board of Trustees. Guided by thepolicies established by the Investment Committee, the University’s Investment Office manages the investment of endowment and trust assets, certain working capital, temporarily invested expendable funds, and commercial real estate. These assets are also managed either by Northwestern or by external equity investment managers, externaland internal fixed-income and cash managers, and various limited partnership managers.
23
Substantially all these assets are merged into internally managed investment pools on a market-value basis. Each holder of units in the investment pools subscribes to or disposes of units on the basis of the market value per unit at the beginning of each month.
Endowment Payout/Spending GuidelineThe Board of Trustees adopted a revised guideline effective in fiscal year 2005 for the annual spending rate from theLong-Term Balanced Pool. The calculation blends market and spending elements for the total annual spending rate.
The market element is an amount equal to 4.1 percent of the market value of a unit in the pool, averaged for thelatest 12 months. It is weighted at 30 percent in determining the total. The spending element is an amount equal tothe current fiscal year’s spending amount increased by 5 percent. It is weighted at 70 percent in determining the total.
If endowment income received is not sufficient to support the total-return objective, the balance is providedfrom realized and unrealized gains. If income received is in excess of the objective, the balance is reinvested in theLong-Term Balanced Pool on behalf of the unit holders.
The University’s policy is to allocate the current income of all other investment pools.
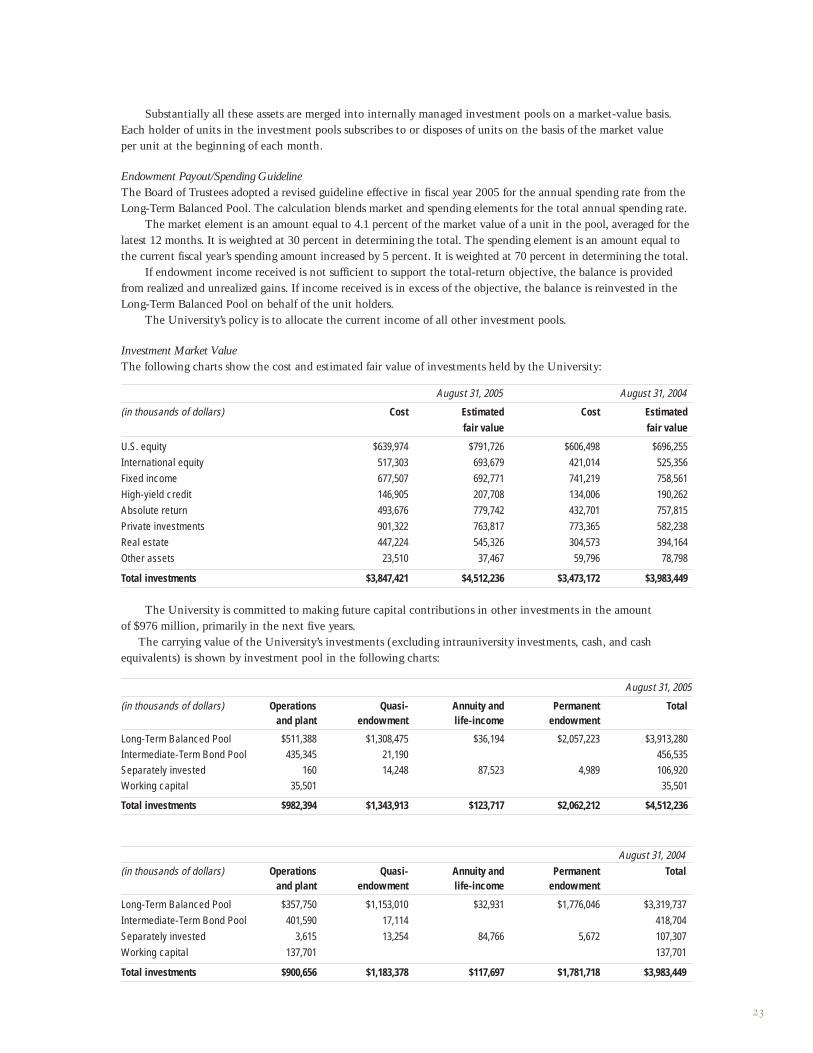
Investment Market ValueThe following charts show the cost and estimated fair value of investments held by the University:
August 31, 2005 August 31, 2004
(in thousands of dollars) Cost Estimated Cost Estimatedfair value fair value
U.S. equity $639,974 $791,726 $606,498 $696,255International equity 517,303 693,679 421,014 525,356Fixed income 677,507 692,771 741,219 758,561High-yield credit 146,905 207,708 134,006 190,262Absolute return 493,676 779,742 432,701 757,815Private investments 901,322 763,817 773,365 582,238Real estate 447,224 545,326 304,573 394,164Other assets 23,510 37,467 59,796 78,798
Total investments $3,847,421 $4,512,236 $3,473,172 $3,983,449
The University is committed to making future capital contributions in other investments in the amount of $976 million, primarily in the next five years.
The carrying value of the University’s investments (excluding intrauniversity investments, cash, and cash equivalents) is shown by investment pool in the following charts:
August 31, 2005
(in thousands of dollars) Operations Quasi- Annuity and Permanent Totaland plant endowment life-income endowment
Long-Term Balanced Pool $511,388 $1,308,475 $36,194 $2,057,223 $3,913,280Intermediate-Term Bond Pool 435,345 21,190 456,535Separately invested 160 14,248 87,523 4,989 106,920Working capital 35,501 35,501
Total investments $982,394 $1,343,913 $123,717 $2,062,212 $4,512,236
August 31, 2004 (in thousands of dollars) Operations Quasi- Annuity and Permanent Total
and plant endowment life-income endowment
Long-Term Balanced Pool $357,750 $1,153,010 $32,931 $1,776,046 $3,319,737Intermediate-Term Bond Pool 401,590 17,114 418,704Separately invested 3,615 13,254 84,766 5,672 107,307Working capital 137,701 137,701
Total investments $900,656 $1,183,378 $117,697 $1,781,718 $3,983,449
24
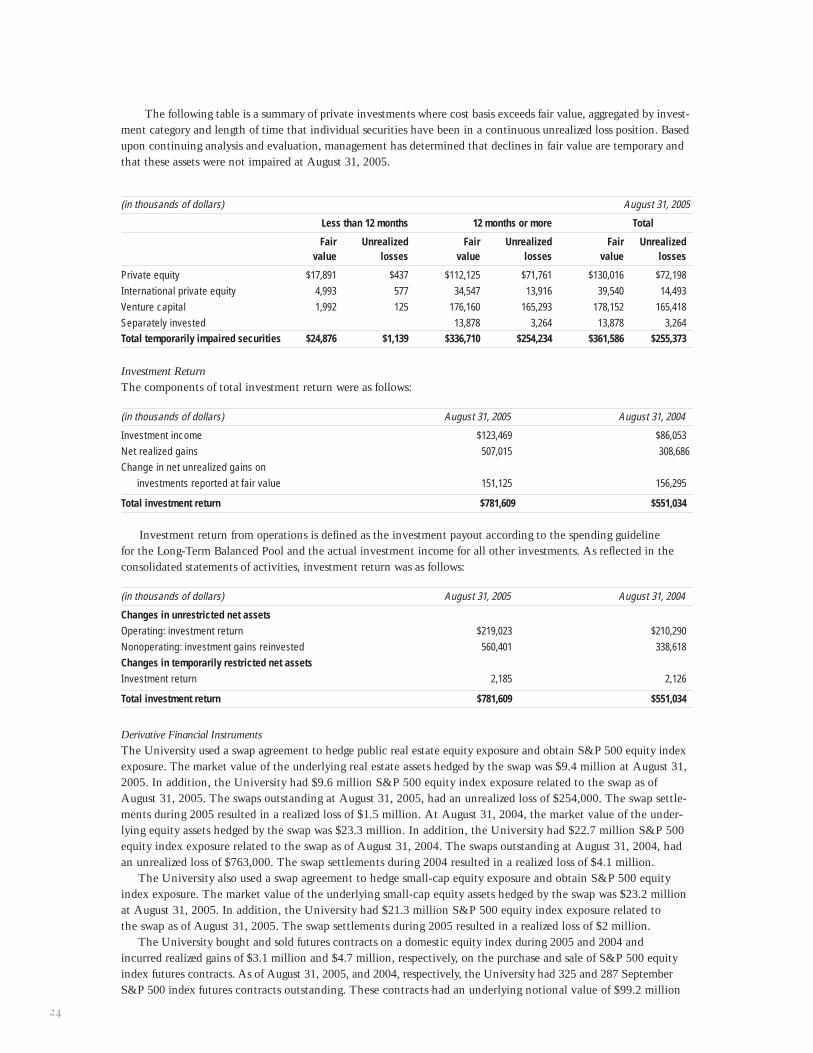
The following table is a summary of private investments where cost basis exceeds fair value, aggregated by invest-ment category and length of time that individual securities have been in a continuous unrealized loss position. Basedupon continuing analysis and evaluation, management has determined that declines in fair value are temporary andthat these assets were not impaired at August 31, 2005.
(in thousands of dollars) August 31, 2005
Less than 12 months 12 months or more Total
Fair Unrealized Fair Unrealized Fair Unrealizedvalue losses value losses value losses
Private equity $17,891 $437 $112,125 $71,761 $130,016 $72,198International private equity 4,993 577 34,547 13,916 39,540 14,493Venture capital 1,992 125 176,160 165,293 178,152 165,418Separately invested 13,878 3,264 13,878 3,264Total temporarily impaired securities $24,876 $1,139 $336,710 $254,234 $361,586 $255,373
Investment ReturnThe components of total investment return were as follows:
(in thousands of dollars) August 31, 2005 August 31, 2004
Investment income $123,469 $86,053Net realized gains 507,015 308,686Change in net unrealized gains on
investments reported at fair value 151,125 156,295
Total investment return $781,609 $551,034
Investment return from operations is defined as the investment payout according to the spending guideline for the Long-Term Balanced Pool and the actual investment income for all other investments. As reflected in theconsolidated statements of activities, investment return was as follows:
(in thousands of dollars) August 31, 2005 August 31, 2004
Changes in unrestricted net assetsOperating: investment return $219,023 $210,290Nonoperating: investment gains reinvested 560,401 338,618Changes in temporarily restricted net assetsInvestment return 2,185 2,126
Total investment return $781,609 $551,034
Derivative Financial InstrumentsThe University used a swap agreement to hedge public real estate equity exposure and obtain S&P 500 equity indexexposure. The market value of the underlying real estate assets hedged by the swap was $9.4 million at August 31,2005. In addition, the University had $9.6 million S&P 500 equity index exposure related to the swap as ofAugust 31, 2005. The swaps outstanding at August 31, 2005, had an unrealized loss of $254,000. The swap settle-ments during 2005 resulted in a realized loss of $1.5 million. At August 31, 2004, the market value of the under-lying equity assets hedged by the swap was $23.3 million. In addition, the University had $22.7 million S&P 500equity index exposure related to the swap as of August 31, 2004. The swaps outstanding at August 31, 2004, hadan unrealized loss of $763,000. The swap settlements during 2004 resulted in a realized loss of $4.1 million.
The University also used a swap agreement to hedge small-cap equity exposure and obtain S&P 500 equity index exposure. The market value of the underlying small-cap equity assets hedged by the swap was $23.2 millionat August 31, 2005. In addition, the University had $21.3 million S&P 500 equity index exposure related to the swap as of August 31, 2005. The swap settlements during 2005 resulted in a realized loss of $2 million.
The University bought and sold futures contracts on a domestic equity index during 2005 and 2004 and incurred realized gains of $3.1 million and $4.7 million, respectively, on the purchase and sale of S&P 500 equityindex futures contracts. As of August 31, 2005, and 2004, respectively, the University had 325 and 287 SeptemberS&P 500 index futures contracts outstanding. These contracts had an underlying notional value of $99.2 million

25
and $81.4 million, respectively; an unrealized gain of $777,000 at August 31, 2005; and an unrealized loss of $2.1 million at August 31, 2004.
Credit exposure represents the University’s potential loss if all the counterparties fail to perform under the terms of the contracts, and if all collateral, if any, becomes worthless. This exposure is measured by the fair value of contracts with a positive fair value at the reporting date.
The University manages its exposure to credit risk by utilizing highly rated counterparties, establishing risk control limits, and obtaining collateral where appropriate. As a result, the University has limited credit risk. To date,the University has not incurred any losses on derivative financial instruments due to counterparty nonperformance.
The University regularly reviews the use of derivative financial instruments by each of the managers of alter-native investment funds in which it participates. While these outside managers generally use such instruments for hedging purposes, derivative financial instruments are employed for trading purposes by 11 independent assetmanagers of Northwestern University funds totaling approximately $520 million and $362 million at August 31,2005, and 2004, respectively.
Valuation of Permanent Endowment FundsThe University is monitoring endowment accounts in which historical cost was more than market value as of August 31, 2005. Historical cost and market value totals for these accounts were approximately $3.9 million and $2.2 million, respectively. In 2004 historical cost and market value totals for these accounts were approximately $83 million and $65.7 million, respectively. Associated unrealized losses are recorded in the unrestricted net assetsclassification.
5. Retirement PlansThe University maintains two contributory retirement plans for its eligible faculty and staff. The plans offer employees the choice of two investment company options, Teachers Insurance and Annuity Association (TIAA)and College Retirement Equities Fund (CREF), and the mutual funds offered by Fidelity Investments. Partici-pating employee and University contributions are immediately vested. The University contributed $32.2 million and $30.1 million to the two plans in 2005 and 2004, respectively. It expects to contribute $34.2 million to the twoplans in 2006.
The University currently sponsors a health care plan permitting retirees to continue participation on a “pay-all”basis, which requires a retiree contribution based on the average per capita cost of coverage for the entire plan groupof active employees and retirees rather than the per capita cost for retirees only. Retirees are also eligible to participatein certain tuition reimbursement plans and may receive a payment for sick days accumulated at retirement. The accruedcost for postemployment benefits was $8.7 million and $6.1 million at August 31, 2005, and 2004, respectively, and isincluded in accounts payable and accrued expenses on the consolidated statements of financial position.
The University funds the benefit costs as they are incurred. The accumulated postretirement benefit obligation(APBO) was as follows:
(in thousands of dollars) August 31, 2005 August 31, 2004
Active employees not yet eligible $3,299 $2,767Active employees eligible 3,149 2,506Retirees 539 676
Total $6,987 $5,949
The following table sets forth the plan’s change in benefit obligation:
(in thousands of dollars) August 31, 2005 August 31, 2004
Benefit obligation at beginning of year $5,949 $8,035Service cost (benefits attributed to employee
service during the year) 412 469Interest cost on accumulated postretirement
benefit obligation 352 517Actuarial loss (gain) 437 (2,716)Benefits paid (1,138) (1,308)Contributions from participants 975 952
Benefit obligation at end of year $6,987 $5,949

26
During fiscal year 2005 postretirement benefit payments (net of retirees’ contributions) were approximately$163,000.
The following table sets forth the plan’s funded status:
(in thousands of dollars) August 31, 2005 August 31, 2004
Funded status ($5,771) ($5,061)Unrecognized net actuarial loss (505) (68)Unrecognized prior service cost (711) (820)
Total ($6,987) ($5,949)
The accrued benefit cost recognized in the consolidated statements of financial position, which is included in accounts payable and accrued expenses, was $7 million and $5.9 million at August 31, 2005, and 2004, respectively.
The components of the net periodic postretirement benefit cost were as follows:
(in thousands of dollars) August 31, 2005 August 31, 2004
Service cost (benefits attributed to employee service during the year) $412 $469
Interest cost on accumulated postretirement benefit obligation 352 517
Amortization of prior service cost 109 109Amortization of unrealized loss 0 195
Total $873 $1,290
The discount rate used in determining the APBO was 5 percent and 6 percent as of August 31, 2005, and 2004,respectively. The assumed health care cost trend rate used in measuring the APBO in 2005 and 2004 was a gradedtable starting at 9 and 10 percent, respectively, and decreasing 1 percent each year to an ultimate rate of 5 percent.
August 31, 2005 August 31, 2004
Health care cost trend rate assumed 9% 10%Rate to which the cost trend rate is assumed to ultimately decline 5% 5%Year that rate will reach the ultimate trend rate 2009 2009
A one percentage point change in assumed health care cost trend rates would have had the following effects infiscal year 2005:
1% increase 1% decrease
Increase (decrease) in total of service and interest cost $114 ($98)Increase (decrease) in postretirement benefit obligation 614 (523)
Estimated future benefit payments reflecting anticipated service, as appropriate, are expected to be paid as follows:
(in thousands of dollars)
2006 $1432007 2142008 3022009 3502010 4372011–2015 3,308Total $4,754
The University offers a deferred compensation plan under Internal Revenue Code 457(b) to a select group of management and highly compensated employees. There is no University contribution related to this deferredcompensation plan.

27
In May 2004 the FASB issued FASB Staff Position SFAS No. 106-2, “Accounting and Disclosure RequirementRelated to the Medicare Prescription Drug, Improvements, and Modernization Act of 2003.” This FASB staff positionrequires that the University disclose, effective with the year ended August 31, 2005, the effects of the act and assess the impact of the Medicare Part D subsidy on the accumulated postretirement benefit obligation and net periodic postretirement benefit cost. Measures of the APBO or net periodic postretirement benefit cost do not reflect any amount associated with the subsidy because the University does not expect to qualify. In the future,should the University qualify, it may elect to pursue the subsidy.
6. Land, Buildings, and EquipmentLand, buildings, and equipment consisted of the following:
(in thousands of dollars) August 31, 2005 August 31, 2004
Land and improvements $27,950 $27,951Buildings 1,480,270 1,337,525Equipment 220,634 199,270Accumulated depreciation (575,975) (518,063)
Total $1,152,879 $1,046,683
At August 31, 2005, the University had under construction buildings that will cost approximately $209.7 million.The estimated cost to complete this construction is $100.3 million. Costs incurred through August 31, 2005, of $109.4 million are included in land, buildings, and equipment. These buildings are being funded by loans, gifts(received or pledged), and grants.
7. Allocation of Expenses The University allocated depreciation, plant maintenance expenditures, and interest on indebtedness to the variousfunctional expense categories in the consolidated statements of activities for the fiscal years ended August 31, 2005,and 2004. Those expenses have been distributed to the functional areas of the University as follows:
(in thousands of dollars) August 31, 2005
Depreciation Plant maintenance Interest on indebtednessInstruction $9,114 $14,984 $3,083Research 12,797 21,040 4,328Academic support 13,796 22,682 4,666Student services 5,806 9,545 1,964Institutional support 3,870 6,363 1,309Auxiliary services 17,043 28,018 5,764
Total $62,426 $102,632 $21,114
(in thousands of dollars) August 31, 2004
Depreciation Plant maintenance Interest on indebtednessInstruction $8,568 $14,573 $3,059Research 11,160 18,981 3,985Academic support 8,357 14,213 2,984Student services 4,972 8,456 1,775Institutional support 3,967 6,747 1,416Auxiliary services 15,866 26,987 5,665
Total $52,890 $89,957 $18,884
The allocations were based on the functional use of space on the University’s campus.
8. Self-Insurance Reserves and Other ContingenciesReserves for losses under the University’s self-insurance program, aggregating $80.3 million and $79.5 million at August 31, 2005, and 2004, respectively, include reserves for known losses and for losses incurred but not
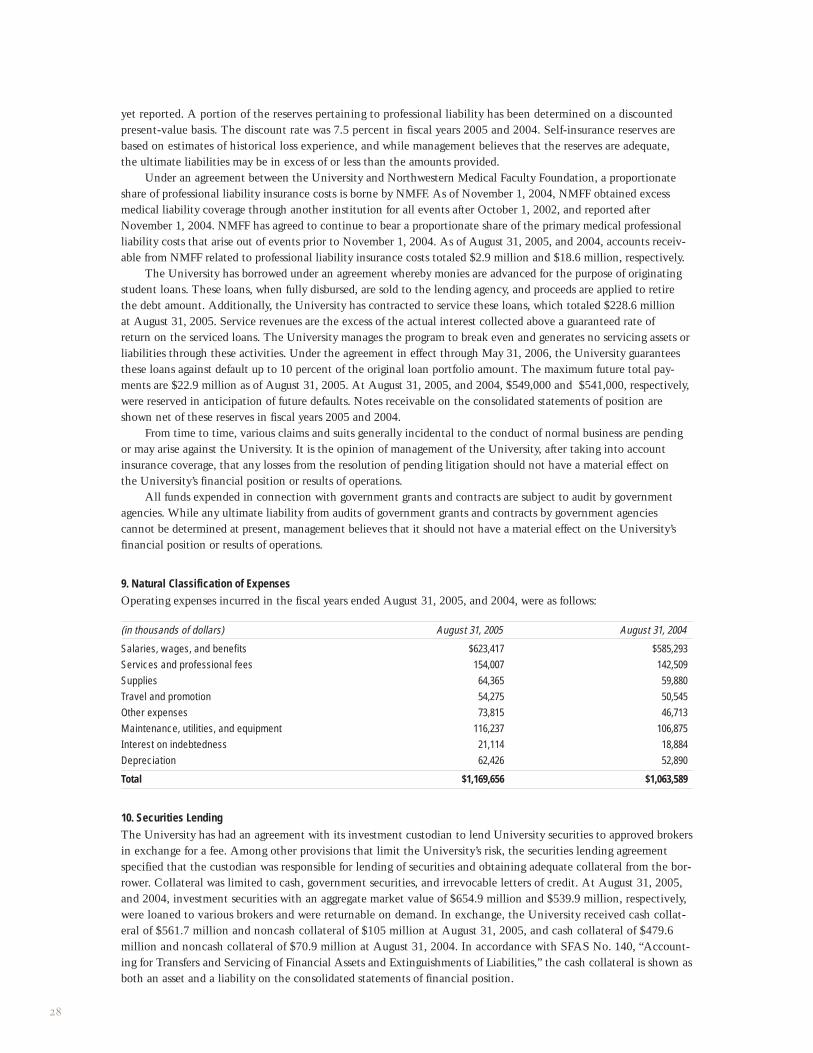
28
yet reported. A portion of the reserves pertaining to professional liability has been determined on a discounted present-value basis. The discount rate was 7.5 percent in fiscal years 2005 and 2004. Self-insurance reserves arebased on estimates of historical loss experience, and while management believes that the reserves are adequate, the ultimate liabilities may be in excess of or less than the amounts provided.
Under an agreement between the University and Northwestern Medical Faculty Foundation, a proportionateshare of professional liability insurance costs is borne by NMFF. As of November 1, 2004, NMFF obtained excessmedical liability coverage through another institution for all events after October 1, 2002, and reported afterNovember 1, 2004. NMFF has agreed to continue to bear a proportionate share of the primary medical professionalliability costs that arise out of events prior to November 1, 2004. As of August 31, 2005, and 2004, accounts receiv-able from NMFF related to professional liability insurance costs totaled $2.9 million and $18.6 million, respectively.
The University has borrowed under an agreement whereby monies are advanced for the purpose of originatingstudent loans. These loans, when fully disbursed, are sold to the lending agency, and proceeds are applied to retirethe debt amount. Additionally, the University has contracted to service these loans, which totaled $228.6 million at August 31, 2005. Service revenues are the excess of the actual interest collected above a guaranteed rate of return on the serviced loans. The University manages the program to break even and generates no servicing assets orliabilities through these activities. Under the agreement in effect through May 31, 2006, the University guaranteesthese loans against default up to 10 percent of the original loan portfolio amount. The maximum future total pay-ments are $22.9 million as of August 31, 2005. At August 31, 2005, and 2004, $549,000 and $541,000, respectively,were reserved in anticipation of future defaults. Notes receivable on the consolidated statements of position areshown net of these reserves in fiscal years 2005 and 2004.
From time to time, various claims and suits generally incidental to the conduct of normal business are pendingor may arise against the University. It is the opinion of management of the University, after taking into account insurance coverage, that any losses from the resolution of pending litigation should not have a material effect on the University’s financial position or results of operations.
All funds expended in connection with government grants and contracts are subject to audit by governmentagencies. While any ultimate liability from audits of government grants and contracts by government agencies cannot be determined at present, management believes that it should not have a material effect on the University’sfinancial position or results of operations.
9. Natural Classification of ExpensesOperating expenses incurred in the fiscal years ended August 31, 2005, and 2004, were as follows:
(in thousands of dollars) August 31, 2005 August 31, 2004
Salaries, wages, and benefits $623,417 $585,293Services and professional fees 154,007 142,509Supplies 64,365 59,880Travel and promotion 54,275 50,545Other expenses 73,815 46,713Maintenance, utilities, and equipment 116,237 106,875Interest on indebtedness 21,114 18,884Depreciation 62,426 52,890
Total $1,169,656 $1,063,589
10. Securities Lending The University has had an agreement with its investment custodian to lend University securities to approved brokersin exchange for a fee. Among other provisions that limit the University’s risk, the securities lending agreement specified that the custodian was responsible for lending of securities and obtaining adequate collateral from the bor-rower. Collateral was limited to cash, government securities, and irrevocable letters of credit. At August 31, 2005,and 2004, investment securities with an aggregate market value of $654.9 million and $539.9 million, respectively,were loaned to various brokers and were returnable on demand. In exchange, the University received cash collat-eral of $561.7 million and noncash collateral of $105 million at August 31, 2005, and cash collateral of $479.6million and noncash collateral of $70.9 million at August 31, 2004. In accordance with SFAS No. 140, “Account-ing for Transfers and Servicing of Financial Assets and Extinguishments of Liabilities,” the cash collateral is shown asboth an asset and a liability on the consolidated statements of financial position.

AdministrationHenry S. Bienen, PhD
President
Lawrence B. Dumas, PhD
Provost
Eugene S. Sunshine, MPA
Senior Vice President for
Business and Finance
William J. Banis, PhD
Vice President for
Student Affairs
Thomas G. Cline, JD
Vice President and
General Counsel
Alan K. Cubbage, JD
Vice President for
University Relations
Lewis Landsberg, MD
Vice President for
Medical Affairs and
Dean, Feinberg School
of Medicine
Marilyn McCoy, MPP
Vice President for
Administration and Planning
William H. McLean, MBA
Vice President and
Chief Investment Officer
C. Bradley Moore, PhD
Vice President for Research
Sarah R. Pearson, MFA
Vice President for
University Development
and Alumni Relations
Morteza A. Rahimi, PhD
Vice President and Chief
Technology Officer
Financial Operations StaffJames E. Elsass
Associate Vice President
for Budget Planning,
Analysis, and Allocation
Guy E. Miller
Associate Vice President
for Human Resources
Ronald Nayler
Associate Vice President
for Facilities Management
Ingrid S. Stafford
Associate Vice President
for Finance and Controller
Betty L. McPhilimy
Assistant Vice President for
Auditing and Compliance
Brian S. Peters
Director of
University Services
Karl E. Turro
Senior Associate Controller
Cynthia L. O’Connor
Associate Controller and
Director of Cost Studies
Nancy L. Pinchar
Director of Accounting
Services
Administration and Trustees
2005–06 Board of TrusteesMark A. Angelson
Peter J. Barris
Judith S. Block
Neil G. Bluhm
Deborah Hartsough Brady
John A. Canning Jr.
Nicholas D. Chabraja
Dennis H. Chookaszian
Christopher B. Combe
A. Steven Crown
William M. Daley
William L. Davis
Richard H. Dean
Deborah L. DeHaas
Charles W. Douglas
D. Cameron Findlay
Dennis J. FitzSimons
T. Bondurant French
Barbara Gaines
Christopher B. Galvin
David H. Gersh
J. Douglas Gray
Herbert W. Gullquist
Philip L. Harris
Thomas Z. Hayward Jr.
Jay C. Hoag
David G. Kabiller
Nancy Trienens Kaehler
Ellen Philips Katz
William S. Kirsch
Lester B. Knight
David N. Kragseth
Timothy K. Krauskopf
Bill G. Lambert
Lawrence F. Levy
Edward M. Liddy
John Jeffry Louis
Ann Lurie
Martha Grimes Mabie
John W. Madigan
J. Landis Martin
R. Eden Martin
Blair Collins Maus
W. James McNerney Jr.
Lee M. Mitchell
Wendy M. Nelson
William A. Osborn
Dale Park Jr.
Jerry K. Pearlman
Jane DiRenzo Pigott
J. B. Pritzker
Henry B. Reiling
M. Jude Reyes
Christine O. Robb
Alexander I. Rorke
Patrick G. Ryan
Patrick G. Ryan Jr.
Paul L. Sagan
William E. Sagan
Robert P. Saltzman
Charles E. Schroeder
D. Gideon Searle
Gordon I. Segal
Andrew E. Senyei
Benjamin W. Slivka
Julia A. Uihlein
John R. Walter
Sona Wang
Wayne D. Watson
David B. Weinberg
Miles D. White
William J. White
William Wrigley Jr.
Ava Harth Youngblood
Life Trustees William F. Aldinger
Thomas G. Ayers
Warren L. Batts
Lee Phillip Bell
Charles M. Bliss
Charles T. Brumback
Patricia Holmes Buehler
Duane L. Burnham
Donald C. Clark
George A. Cohon
Franklin A. Cole
Philip M. Condit
Stanton R. Cook
John W. Croghan
Lester Crown
Raymond F. Farley
W. James Farrell
William E. Fay Jr.
James L. Garard Jr.
Lavern N. Gaynor
J. Ira Harris
George E. Johnson
James R. Kackley
Morris A. Kaplan
James L. Ketelsen
Martin J. Koldyke
Harry M. Jansen Kraemer Jr.
Duane R. Kullberg
Alan M. Leventhal
Frank W. Luerssen
Robert A. Lurie
Garry K. Marshall
Arthur C. Martinez
James R. McManus
Michael A. Miles
Newton N. Minow
Graham J. Morgan
Leo F. Mullin
James J. O’Connor
Harry J. Pearce
Donald S. Perkins
Bryan S. Reid
Jerry M. Reinsdorf
Don H. Reuben
John M. Richman
John W. Rowe
John S. Runnells II
James P. Schadt
John B. Schwemm
D. C. Searle
Arthur R. Seder Jr.
Charles H. Shaw
Harold B. Smith
William D. Smithburg
Judith A. Sprieser
E. Norman Staub
Edward F. Swift
Thomas C. Theobald
Richard L. Thomas
Howard J. Trienens
Betty A. Van Gorkom
Lawrence A. Weinbach
Judd A. Weinberg
Stephen M. Wolf
Blaine J. Yarrington
Northwestern University is an equal opportunity, affirmative action educator and employer. © 2006 Northwestern University. All rights reserved. Produced by University Relations. 2-06/1.6M/MG-HC/10470