performance tuning best pracitces and performance ... · pdf fileperformance tuning best...
TRANSCRIPT

Performance Tuning best pracitces
and performance monitoring with
ZabbixAndrew NelsonSenior Linux Consultant
May 28, 2015NLUUG Conf, Utrecht, Netherlands

RED HAT | Andrew Nelson2/47
Overview
● Introduction
● Performance tuning is Science!
● A little Law and some things to monitor
● Let's find peak performance
● Conclusion
● Source code availability● Test environment information

RED HAT | Andrew Nelson3/47
$ whoami
● Andrew Nelson
● Senior Linux Consultant with Red Hat North America
● Active in the Zabbix community for approximately 10 years
● Known as “nelsonab” in forums and IRC
● Author of the Zabbix APIRuby library zbxapi

Performance Tuningand SCIENCE!
RED HAT | Andrew Nelson5/47
Performance tuning and the Scientific Method
● Performance tuning is similar to the Scientific method● Define the problem● State a hypothesis● Prepare experiments to test the hypothesis● Analyze the results● Generate a conclusion

RED HAT | Andrew Nelson6/47
Understanding the problem
● Performance tuning often involves a multitude of components
● Identifying problem areas is often challenging
● Poorly defined problems can be worse than no problem at all
These are not (necessarily) the solutions you want.

RED HAT | Andrew Nelson7/47
Understanding the problem
● Why?● Better utilization of resources● Capacity Planning and scaling
● For tuning to work, you must define your problem● But don't be defined by the problem.
You can't navigate somewhere when you don't know where you're going.

RED HAT | Andrew Nelson8/47
Defining the problem
● Often best when phrased as a declaration with a reference
● Poor Examples● “The disks are too slow”● “It takes too long to log in”● “It's Broken!”
● Good Examples● “Writes for files ranging in size from X to Y must take less than
N seconds to write.”● “Customer Login's must take no longer than .5 seconds”● “The computer monitor is dark and does not wake up when
moving the mouse”

RED HAT | Andrew Nelson9/47
Define your tests
● Define your tests and ensure they are repeatable● Poor Example (manually run tests)
1 $ time cp one /test_dir
2 $ time cp two /test_dir
● Good Example (automated tests with parsable output)$ run_test.sh
Subsystem A write tests
Run Size Time (seconds)
1 100KB 0.05
2 500KB 0.24
3 1MB 0.47

RED HAT | Andrew Nelson10/47
Define your tests
● A good test is comprised to two main components
a)It is representative of the problem
b)It has easy to collate and process output.● Be aware of external factors
● Department A owns application B which is used by group C but managed by department D.
● Department D may feel that application B is too difficult to support and may not lend much assistance placing department A in a difficult position.

RED HAT | Andrew Nelson11/47
Perform your tests
● Once the tests have been agreed upon get a set of baseline data
● Log all performance tuning changes and annotate all tests with the changes made
● If the data is diverging from the goal, stop and look closer
● Was the goal appropriate?● Where the tests appropriate?● Were the optimizations appropriate?● Are there any external factors impacting the effort?

RED HAT | Andrew Nelson12/47
Perform your tests and DOCUMENT!
● When the goal is reached, stop● Is there a need to go on?● Was the goal reasonable?● Were the tests appropriate?● Were there any external issues not accounted for or
foreseen?
● DOCUMENT DOCUMENT DOCUMENT
If someone ran a test on a server, but did not log it, did it really happen?

RED HAT | Andrew Nelson13/47
When testing, don't forget to...
DOCUMENT!

RED HAT | Andrew Nelson14/47
Story time!
● Client was migrating from Unix running on x86 to RHEL5 running on x86
● Client claimed the middleware stack they were using was “slower” on RHEL
● Some of the problems encountered● Problem was not clearly defined
● There were some external challenges observed
● Tests were not representative and mildly consistent● End goal/performance metric “evolved” over time● Physical CPU clock speed was approximately 10%
slower on newer systems

RED HAT | Andrew Nelson15/47
More Story time!
● Client was migrating an application from zOS to RHEL 6 with GFS2
● Things were “slow” but there was no consistent quantification of “slow”.
● Raw testing showed GFS2 to be far superior to NFS, but Developers claimed NFS was faster.
● Eventually GFS2 was migrated to faster storage, developers became more educated about performance and overall things are improved.
● Developers are learning to quantify the need for something before asking for it.

A little Law and some things to monitor

RED HAT | Andrew Nelson17/47
Little's Law
● L=λh● L = Queue length● h = Time to service a request● λ=arrival rate
● Networking provides some good examples of Little's Law in action.
● MTU (Maximum Transmission Unit) and Speed can be analogous to lambda.
● The Bandwidth Delay Product (BDP) is akin to L, Queue length

RED HAT | Andrew Nelson18/47
Little's Law
● BDP is defined as: Bandwidth * End_To_End_Delay (or latency)
● Example● 1GB/s Link with 2.24ms Round Trip Time (RTT)● 1Gb/s * 2.24ms = 0.27MB● Thus, a buffer of at least 0.27MB is required to buffer all
of the data on the wire.

RED HAT | Andrew Nelson19/47
Little's Law
● What happens when we alter the MTU?
● 9000● 6,000 Packets per second● 939.5MB/s
● 1500● 6,000 Packets per second● 898.5MB/s
● 150● 22,000 Packets per second● 493MB/s
9000
1500
150
Outbound Packets
InboundPackets

RED HAT | Andrew Nelson20/47
Little's law in action.
● There are numerous ways to utilize Little's law in monitoring.
● IO requests in flight for disks● Network buffer status● Network packets per second.● Processor load● Time to service a request

RED HAT | Andrew Nelson21/47
Little's law in action.
● Apache is the foundation for many enterprise and SAS products, so how can we monitor it's performance in Zabbix?
● Normal approaches involved parsing log files, or parsing the status page
● The normal ways don't tend to work well with Zabbix, however we can use a script to parse the logs in realtime from Zabbix and use a file socket for data output.

RED HAT | Andrew Nelson22/47
Little's law in action.
● Two pieces are involved in pumping data from Apache into Zabbix.
● First we build a running counter via a log pipe to a script# YYYYMMDD-HHMMSS Path BytesReceived BytesSent TimeSpent MicrosecondsSpent
LogFormat "%{%Y%m%d-%H%M%S}t %U %I %O %T %D" zabbix-log
CustomLog "|$/var/lib/zabbix/apache-log.rb >>var/lib/zabbix/errors" zabbix-log
● This creates a file socket:$ cat /var/lib/zabbix/apache-data-out
Count Received Sent total_time total_microsedonds
4150693 573701315 9831930078 0 335509340

RED HAT | Andrew Nelson23/47
Little's law in action.
● Next we push that data via a client side script using Zabbix_sender$ crontab -e
*/1 * * * * /var/lib/zabbix/zabbix_sender.sh
● And import the template

Let's see if we can find the peak performance with Zabbix

RED HAT | Andrew Nelson25/47
The test environment
Storage Server
Physical System(desktop)
Infiniband
GigE
Router/Firewall100Mbit
Hypervisor 1(Terry)
Hypervisor 2(Sherri)
Zabbix Server NOTE: See last slides for more details

RED HAT | Andrew Nelson26/47
What are we looking for
● It is normal to be somewhat unsure initially, investigative testing will help shape this.
● Some form of saturation will be reached, hopefully on the server.
● Saturation will take one or both of the following forms● Increased time to service
● Request queues (or buffers) are full, meaning overall increased time to service the queue
● Failure to service● Queue is full and the request will not be serviced. The server
will issue an error, or the client will time out.

RED HAT | Andrew Nelson27/47
Finding Peak Performance, initial test
● Tests were run from system “Desktop”
● Apache reports 800 connections per second.
● Processor load is light.
Test Window
RED HAT | Andrew Nelson28/47
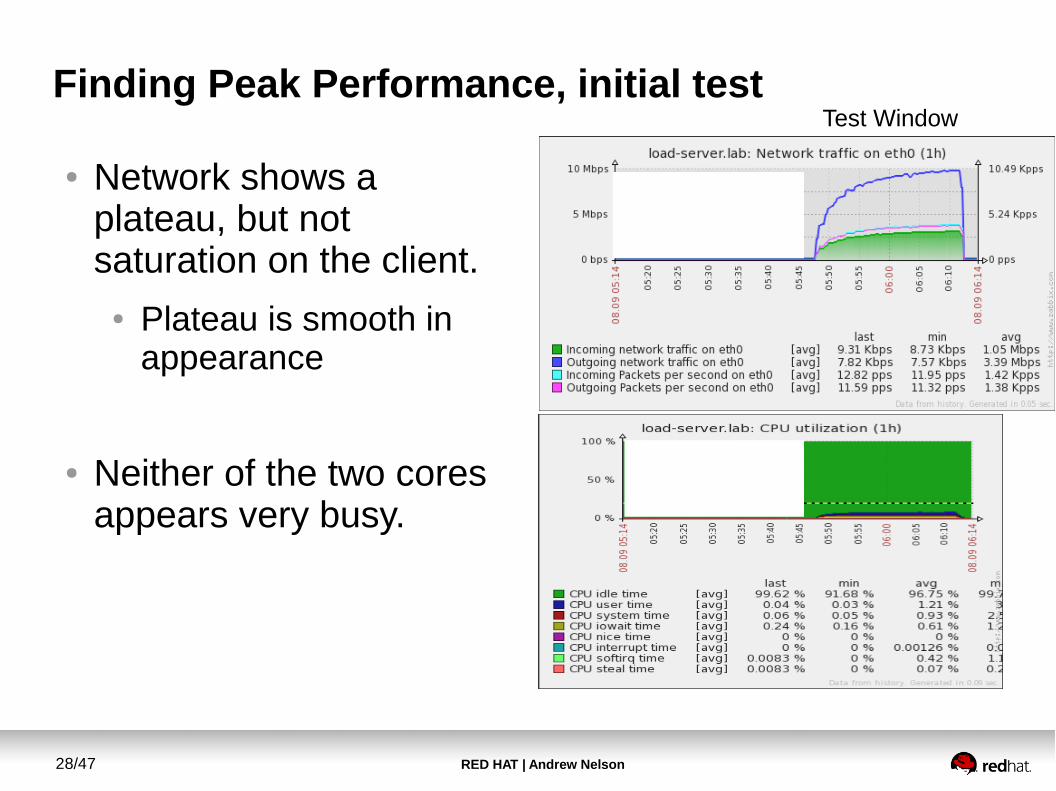
Finding Peak Performance, initial test
● Network shows a plateau, but not saturation on the client.
● Plateau is smooth in appearance
● Neither of the two cores appears very busy.
Test Window

RED HAT | Andrew Nelson29/47
Finding Peak Performance, initial test
● Apache server seems to report that it responds faster with more connections
● Zabbix web tests show increased latency
Test Window
RED HAT | Andrew Nelson30/47
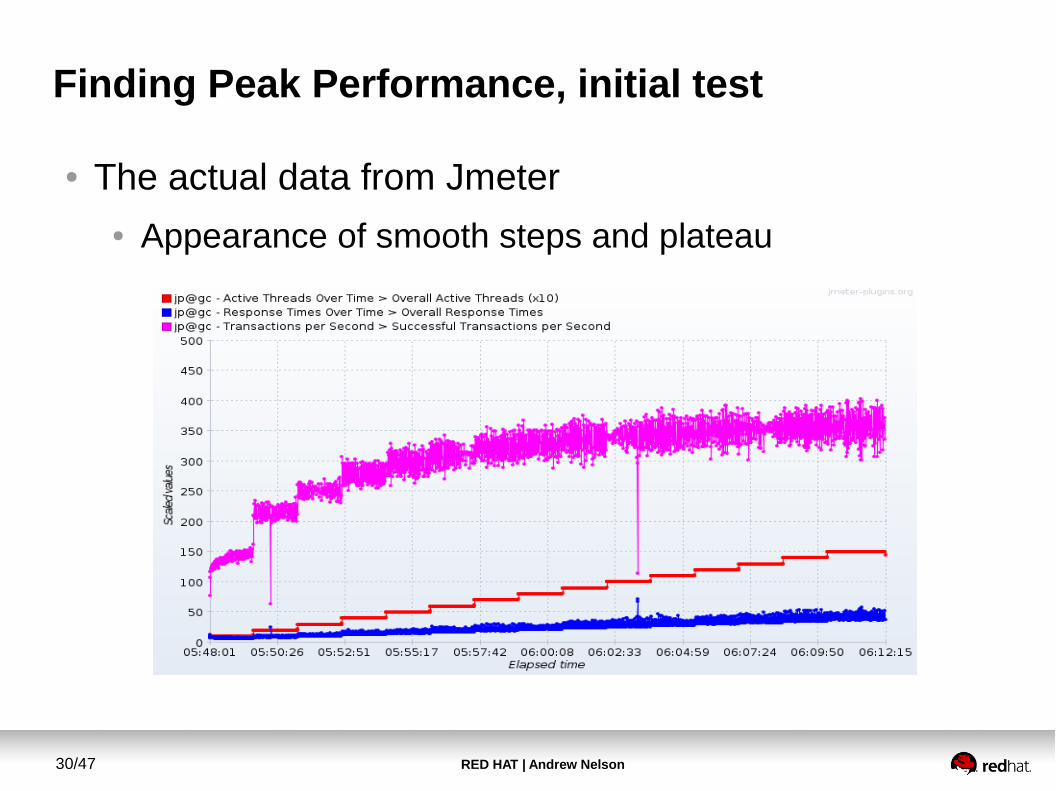
Finding Peak Performance, initial test
● The actual data from Jmeter● Appearance of smooth steps and plateau

RED HAT | Andrew Nelson31/47
Finding Peak Performance, Initial analysis
● Reduced response latency may be due to processor cache.
● Connections are repetitive potential leading to greater cache efficiency.
● Network appears to be the bottleneck.● During tests some Zabbix checks were timing out to the
test server and other systems behind the firewall/router● Router showed very high CPU utilization.
● Jmeter does not show many connection errors.● Network layer is throttling connections

RED HAT | Andrew Nelson32/47
Finding Peak Performance, Initial analysis
● More testing needed● Tests need to come from a system on the same VLAN
and switch as the server and not traverse the router.● A wise man once said:
I need a little more Cowbell (aka testing)

RED HAT | Andrew Nelson33/47
Finding Peak Performance, second test
● Testing from another VM with full 1Gb links to test server
● Based on concurrent connections count, it seems an upper limit has again been found.
● Graph is not smooth at plateau
● CPU exhibits greater load, but overall still low
Test Window

RED HAT | Andrew Nelson34/47
Finding Peak Performance, second test
● Network no longer appears to be the bottleneck
● Rough “saw-tooth” plateau noted
● CPU Utilization follows picture of load, but it would seem there is still CPU capacity left.
Test Window

RED HAT | Andrew Nelson35/47
Finding Peak Performance, second test
● Apache again appears to respond faster under load than when idle
● Reduced latency shows smooth appearance
● Zabbix tests do not show any change in Apache performance. The router is back to “normal” load.
Test Window
RED HAT | Andrew Nelson36/47
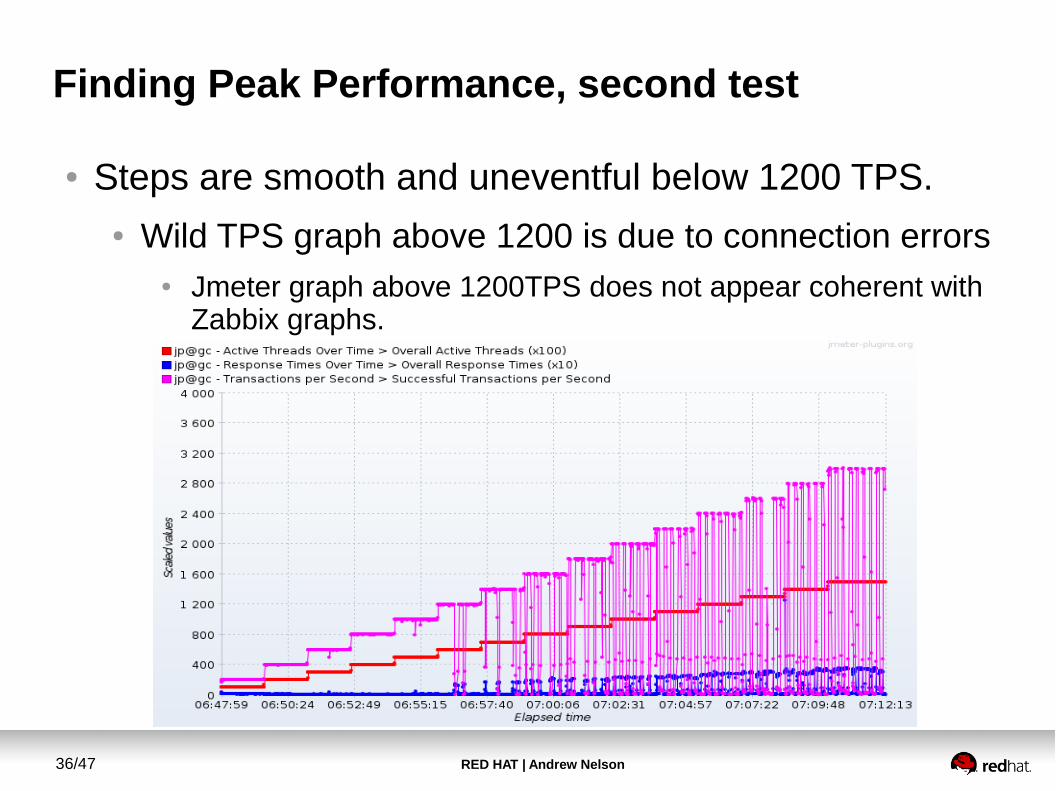
Finding Peak Performance, second test
● Steps are smooth and uneventful below 1200 TPS.● Wild TPS graph above 1200 is due to connection errors
● Jmeter graph above 1200TPS does not appear coherent with Zabbix graphs.

RED HAT | Andrew Nelson37/47
Finding Peak Performance, Second analysis
● It would appear reduced response latency is likely due to to processor cache as noted before.
● Increased rate of repetitiveness reduced latency further.● Network did not appear to be the bottleneck
● Connection errors were noted in Jmeter tests as would be expected for a saturated server.
● Based on Jmeter and Zabbix data peak performance for this server with the test web page is about 1,200 pages per second
● What if we couldn't max out performance, are there other ways to find it?

Conclusion

RED HAT | Andrew Nelson39/47
One more story...
● Host was a member of a 16 node GFS2 Cluster
● Java containers were running on the host which pre-allocated memory.
● vm.swappiness was set to 0
● OS had about 200MB of memory available for itself and appeared to spend 100% of one core's time in IO wait.

RED HAT | Andrew Nelson40/47
One more story...

RED HAT | Andrew Nelson41/47
One more story...

RED HAT | Andrew Nelson42/47
Conclusion
● Clearly define the problem
● Understand what the tests are before testing
● It is possible to use similar techniques to tuning for long term monitoring
● Sometimes the results you get are not what you expected.
● Software developers are bad at exposing performance metrics for use by external software.
● DOCUMENT, DOCUMENT, DOCUMENT!

RED HAT | Andrew Nelson43/47
Questions
Fragenjautājumi
質問pytania
vragen
kysymykset
питаннявопросы
spørgsmål domande
preguntas
otázky

RED HAT | Andrew Nelson44/47
Source Code
● Scripts and template used are available on GitHub● https://github.com/red-tux/zbx-apache

RED HAT | Andrew Nelson45/47
The test environment (More details)
Storage Server
Physical System(desktop)
Infiniband
GigE
Router/Firewall100Mbit
Hypervisor 1(Terry)
Hypervisor 2(Sherri)
Zabbix Server

RED HAT | Andrew Nelson46/47
The test environment (More details)
● Hypervisors are Red Hat Virtualization 3.3 (RHEV)● Guests are RHEL6
● Test server is configured with 2GB of RAM and 2 CPU cores
● Storage for guests is via iSCSI over Infiniband
● Switch and Firewall are small Enterprise grade Juniper equipment.
● Main Router/Firewall has 100Mbit interfaces● All networks are VLANed● Hypervisors are LACP bonded to the internal network

RED HAT | Andrew Nelson47/47
The test environment (More details)
● Test page is a simple “Hello world” with a small embedded graphic. Two connections equals one page load.
● Apache was configured to use the aforementioned logging script
● JMeter was used to generate the client test loads
● Zabbix was configured perform a web test as well to track response times from the Zabbix server.