performance optimization of domestic refrigerator...
TRANSCRIPT

EFFECT OF ELECTRICAL DISCHARGE MACHINING PROCESS PARAMETER
ON SURFACE TOPOGRAHY
LEE WAI LOON
Report submitted in partial fulfillment of the requirements for the award of the degree of
Bachelor of Mechanical Engineering
Faculty of Mechanical Engineering
UNIVERSITI MALAYSIA PAHANG
DECEMBER 2010

ii
SUPERVISOR’S DECLARATION
I hereby declare that I have checked this project and in my opinion, this project is
adequate in terms of scope and quality for the award of the degree of Bachelor of
Mechanical Engineering with Manufacturing
Signature : ……………………………
Name of Supervisor : DR MD MUSTAFIZUR RAHMAN
Position : Associate Professor
Date : 6th
DECEMBER 2010

iii
STUDENT’S DECLARATION
I hereby declare that the work in this project is my own except for quotations and
summaries which have been duly acknowledged. The project has not been accepted for
any degree and is not concurrently submitted for award of other degree.
Signature : ……………………………
Name : LEE WAI LOON
ID Number : ME07047
Date : 6 DECEMBER 2010

v
ACKNOWLEDGEMENTS
I am grateful and would like to express my sincere gratitude to my supervisor
Prof Madya Dr Md Mustafizur Rahman for his germinal ideas, invaluable guidance,
continuous encouragement and constant support in making this project possible. He has
always impressed me with his outstanding professional conduct, his strong conviction
for refrigeration system, and his belief that a Degree of Bachelor program is only a start
of a life-long learning experience. I appreciate his consistent support from the first day I
applied to graduate program to these concluding moments. I am truly grateful for his
progressive vision about my final year project in refrigeration system, his tolerance of
my naive mistakes, and his commitment to my future career.
My sincere thanks go to all my labmates and members of the staff of the
Mechanical Engineering Department, Universiti Malaysia Pahang, UMP, who helped
me in many ways and made my stay at UMP pleasant and unforgettable. Many special
thanks go to my colleagues in my section and other section who had been helping me all
this while in doing the project. Many special thanks also go to my panels, who had
given me many suggestions and advices in helping to improve the quality of this project
and lead me to the success in this project. Their excellent co-operation, inspirations and
supports will be part of the impetus to this project. Many extra thanks go to all my
friends especially those from Electrical Engineering Department, UMP, who helped me
in tools preparation and allowed my project going smoothly.
I acknowledge my sincere indebtedness and gratitude to my parents for their
love, dream and sacrifice throughout my life. I acknowledge the sincerity of all my
family members, who consistently encouraged me to carry on my higher studies in
UMP. I cannot find the appropriate words that could properly describe my appreciation
for their devotion, support and faith in my ability to attain my goals. Special thanks
should be given to my committee members. I would like to acknowledge their
comments and suggestions, which was crucial for the successful completion of this
project.

vi
ABSTRACT
This paper was developed the mathematical modelling of EDM process parameters to
predict the surface roughness of Ti-6Al-4V. The process is used in situations where
intricate complex shapes need to be machined in very hard materials such as titanium
alloy. However, the process generates surfaces that have poor properties such as high
surface roughness, slow machining removal rate and moderate electrode wear rate.
These properties vary with different levels of the main process parameters such as peak
current, servo voltage, pulse on-time and pulse off-time. The aim of this paper is to
perform experimental work that has been done in order to explore the relationships
between input and output parameters. Response surface design is used because the input
and output parameter were suspect have curvature relationships. A mathematical model
develops base on response surface method. The significant coefficients were obtained
by performing Analysis of Variance (ANOVA) at 95% level of significance. Adequacy
test was carried out to check the fitting of the models. It found that the peak current,
servo voltage and pulse on time are significant in material removal rate and surface
roughness. Peak current has the greater impact on surface roughness and material
removal rate. Finally, a metallurgical microscope is carried to observe the surface
topography.
‘

vii
ABSTRACT
Tujuan untuk project ini adalah mengembangkan model metamatik bagi EDM proses
parameter untuk memprediksi kekasaran permukaan. EDM proses biasanya digunakan
dalam situasi di mana bentuk kompleks rumit perlu memotong bahan yang sangat keras
seperti gabungan titanium. Namun, proses tersebut menghasilkan permukaan yang
memiliki sifat buruk seperti kekasaran permukaan tinggi, tahap enjin removal yang
lambat dan laju kehausan elektrod. Property ini berbeza dengan tahap yang berbeza dari
parameter proses utama seperti tegangan arus puncak, servo, pulsa pada waktu dan
pulsa off-bila masa. Tujuan makalah ini adalah untuk melakukan kerja eksperimen yang
telah dilakukan untuk mengeksplorasi hubungan antara parameter input dan output.
Respon design surface digunakan kerana parameter input dan output disyaki
mempunyai hubungan kelengkungan. Tiga model matematik mengembangkan
pangkalan pada kaedah response surface method. Pekali signifikan diperolehi dengan
melakukan Analisis Varian (ANOVA) pada peringkat 95% signifikansi. Adequate test
dilakukan untuk memeriksa pemasangan model. Didapati bahawa puncak saat ini,
voltan servo dan pulsa pada waktu yang signifikan pada angka removal material dan
kekasaran permukaan. Puncak saat ini mempunyai kesan yang lebih besar pada
kekasaran permukaan dan tahap bahan penghapusan. Akhirnya, mikroskop metalurgi
dilakukan untuk mengamati topografi permukaan.
viii
TABLE OF CONTENTS
Page
SUPERVISOR’S DECLARATION ii
STUDENT’S DECLARATION iii
EXAMINERS APPROVAL LETTER iv
DEDICATION v
ACKNOWLEDGEMENTS vi
ABSTRACT vii
TABLE OF CONTENTS ix
LIST OF TABLES x
LIST OF FIGURES xii
LIST OF SYMBOLS xiii
LIST OF ABBREVIATIONS xiv
CHAPTER 1 INTRODUCTION
1.1 Introduction 1
1.3 Problem Statement 3
1.3 Objectives 4
1.4 Scopes 4
1.5 Organization of Report 4
CHAPTER 2 LITERATURE REVIEW
2.1 Introduction 5
2.2 Titanium Alloy 5
2.3 Die-sinking EDM 6
2.4 Machining Parameter 7
2.5 Response Surface Methodology 9
2.6 Analysis of Variance (ANOVA) 11
2.7 Relationship Between Parameters
2.7.1 Material Removal Rate
2.7.2 Electrode Wear Rate
12
13
13

ix
2.7.3 Surface Roughness 13
2.8 Conclusion 14
CHAPTER 3 METHODOLOGY
3.1 Introduction 15
3.2 Flow Diagram and Flow Chart 15
3.3 Design of Experiment 17
3.4 Machining of Work Piece 19
3.5 Output Parameters Evaluation 21
3.6 Response Surface Analysis 23
3.8 Conclusion 23
CHAPTER 4 RESULTS AND DISCUSSION
4.1 Introduction 24
4.2 Experimental Result 24
4.3
4.4
Surface Topography
Conclusion
35
36
CHAPTER 5 CONCLUSION AND RECOMMENDATIONS
REFERENCES 39
APPENDICES
A1 Electric discharge duration for EDM AQ 55L machining manual 41
A2 Electric discharge pulse control system 42
A3 Electric discharge Off pulse EDM AQ55L machining manual 43
5.1 Introduction 37
5.2 Conclusions 37
5.3 Recommendations 38

x
LIST OF TABLES
Table No. Title Page
2.1 The chemical composition by weight for Ti-6Al-4V 6
2.2 Typical physical properties for Ti6Al4V 6
2.3 Machining parameter 8
3.1 Input and output parameters 17
3.2 Level of independence variables 18
3.3 Design of the block and design of the experiment 18
3.4 Composition for Ti6Al4V 19
3.5 Wire-cut setup 19
3.6 Experimental setting 21
4.1 Experimental data 25
4.2 Analysis of variance for Sa(quadratic) 26
4.3 Analysis of variance for Sa(linear) 26
4.4 Fit summary for Sa 27
4.5 Analysis of variance for MRR(full quadratic) 27
4.6 Analysis of variance for MRR(linear and square) 28
4.7
Fit summary for MRR
28
4.8
4.9
Analysis of variance for EWR
Fit summary for EWR
29
30
4.10 Optimum prediction results 34
4.11
Analysis of the confirmation experiments for MRR
35

xi
LIST OF FIGURES
Figure No. Title Page
2.1 Polarity 8
3.1 Flow chart of the project 16
3.2
Wire-cut EDM process
19
3.3 Work piece and electrode dimension 20
3.4 Analytical Balance and Perthometer 23
4.1 Normal probability plot for Sa 26
4.2 Normal probability plot for MRR 28
4.3 Normal probability plot for EWR 29
4.4 Sa, MRR, EWR versus IP, SV, On time, Off time 30
4.5 Surface roughness vs servo voltage, peak current 32
4.6 Material removal rate vs peak current, servo voltage 32
4.7 Electrode wear rate vs peak current, pulse on time 33
4.8 Surface topography 35

xii
LIST OF SYMBOLS
A Ampere
V
Voltage
ms-1
Meter per second
µ Micro
1wW Weight of work piece after machining
wW 2 Weight of work piece before machining
eW Weight difference of electrode
1W Weight of electrode after machining
2W Weight of electrode before machining
T Time
ρe Density of copper

xiii
LIST OF ABBREVIATIONS
EDM Electric Discharge Machine
Sa Surface roughness
EWR Electrode Wear Rate
MRR Material Removal Rate
RSM Response Surface Methodology
CCD Central Composite Design
MMCs Metal Matrix Composites
Ti6Al4V Titanium alloy Grade 5
IP
SV
ON
OFF
DOE
Peak Current
Servo voltage
Pulse on time
Pulse off time
Design of Experiment
UMP University Malaysia Pahang

CHAPTER 1
INTRODUCTION
1.1 INTRODUCTION
Nowadays, the application of advanced machining processes in manufacturing
industry is become more important for company to produce the better or good product
the better or good products that happened such as in machining high hardness and the
strength of the material, creating complex shape, obtains the better surface finish and
dimensional tolerances. Electric discharge machining (EDM) is one of the most popular
non-traditional material removal processes and has became a basic machining method
for the manufacturing industries of aerospace, automotive, nuclear, medical and die-
mold production. The theory of the process was established by a Soviet scientist,
Lazarenko, in the middle of 1940s. They invented the relaxation circuit and a simple
servo controller tool that helped to maintain the gap width between the tool and the
work piece. This reduced arcing and made EDM machining more profitable and
produced first EDM machine in 1950s. Major development of EDM was observed when
computer numerical control systems were applied for the machine tool industry. Thus,
the EDM process became automatic and unattended machining method . (Kiyak and
Kakir, 2007)
The process uses thermal energy to generate heat that melts and vaporizes the
work piece by ionization within the dielectric medium. The electrical discharges
generate impulsive pressure by dielectric explosion to remove the melted material. Thus,
the amount of removed material can be effectively controlled to produce complex and
precise machine components. However, the melted material is flushed away
incompletely and the remaining material resolidifies to form discharge craters. As a

2
result, machined surface has micro cracks and pores caused by high temperature
gradient which reduces surface finish quality. There have been many published studies
considering surface finish of machined materials by EDM. It was noticed that various
machining parameters influenced surface roughness and setting possible combination of
these parameters was difficult to produce optimum surface quality. The influences of
some machining parameters such as pulsed current, pulse time, pulse pause time,
voltage, dielectric liquid pressure, electrode material. (Kiyak and Kakir, 2007).
Titanium has been recognized as an element (Symbol Ti; atomic number 22; and
atomic weight 47.9) for at least 200 years. However, commercial production of titanium
did not begin until the 1950’s. At that time, titanium was importance because it has very
high strength and light weight, extraordinary to corrosion resistance. These
characteristics made it as efficient as metal for critical, high-performance aircraft, such
as jet engine and airframe components. The worldwide production of this originally
exotic, “Space Age” metal and its alloys has since grown to more than 50 million
pounds annually. Increased metal sponge and mill product production capacity and
efficiency, improved manufacturing technologies, a vastly expanded market base and
demand have dramatically lowered the price of titanium products. Today, titanium
alloys are common, readily available engineered metals that compete directly with
stainless and specialty steels, copper alloys, nickel based alloys and composites. As the
ninth most abundant element in the Earth’s Crust and fourth most abundant structural
metal, the current worldwide supply of feedstock ore for producing titanium metal is
virtually unlimited. Significant unused worldwide sponge, melting and processing
capacity for titanium can accommodate continued growth into new, high-volume
applications. In addition to its attractive high strength-to-density characteristics for
aerospace use, titanium’s exceptional corrosion resistance derived from its protective
oxide film has motivated extensive application in seawater, marine, brine and
aggressive industrial chemical service over the past fifty years. Today, titanium and its
alloys are extensively used for military applications, aircraft, spacecraft, medical
devices, connection rods on expensive sports cars and some premium sports equipment
and consumer electronics. Auto manufacturers Porsche and Ferrari also use titanium
alloys in engine components due to its durable properties in these high stress engine
environments.

3
In statistics, response surface methodology (RSM) explores the relationships
between several explanatory variables and one or more response variables. The method
was introduced by Box and Wilson in 1951. (Bhattacharyya et al. 2007). A sequence of
designed experiments generated by RSM use to obtain an optimize response. Box and
Wilson suggest using a second-degree polynomial model to do this. They acknowledge
that this model is only an approximation, but use it because such a model is easy to
estimate and apply, even when little is known about the process.
.
1.2 PROBLEM STATEMENT
Traditionally electric discharge machining process carried out by relying heavily
on the operator’s experience or conservative technological data provided by the EDM
equipment manufacturers, which produced inconsistent machining performance. The
parameter settings given by the manufacturers are only applicable for the common steel
grades. The settings for new materials such as titanium alloys, aluminum alloys, special
steels, advanced ceramics and metal matrix composites (MMCs) have to be further
optimized experimentally. Optimization of the EDM process often proves to be difficult
task owing to the many regulating machining variables. A single parameter change will
influence the process in a complex way. Thus the various factors affecting the process
have to be understood in order to determine the trends of the process variation. The
selection of best combination of the process parameters for an optimal surface
roughness involves analytical and statistical methods. Once the optimum parameter is
obtain, it reduces the machining cost and improved product’s quality.
1.3 OBJECTIVES
The objectives of this project are as following:
1. To develop mathematical models for predicting the material removal rate,
electrode wear rate and surface roughness.
2. To optimize the machining parameters using RSM method.
3. In addition, this study was generated more knowledge and experience during
operating EDM.

4
1.4 SCOPES
This study mainly focuses on machining of titanium alloys, which will be
carried out in die-sinking EDM. MINITAB software is using to design the experiment
by response surface design. Response surface design was used because its suspect has
curvature relationships between input and output parameter. The machining (input)
parameters selected in this project were peak current, servo voltage, pulse on time, pulse
off time; output parameter were material removal rate, electrode wear rate and surface
roughness. Three mathematical models were develops by using response surface
method. Adequate test is necessary to make sure the model is fit. Next, the surface
topography was observed by using metallurgical microscope and integrated software.
.
1.5 ORGANIZATION OF REPORT
Chapter 1 focused on the introduction of EDM die-sinker machine, titanium
alloy grade 5 and Response Surface Method. Chapter 2 was about literature review from
the previous study. Chapter 3 presents the methodology on the progress. Chapter 4
presents the result and discussion and chapter 5 summarize the finding for future work.

CHAPTER 2
LITERATURE REVIEW
2.1 INTRODUCTION
This chapter contents the properties and composition of Ti6Al4V. Besides, it
reviews the history and machining concern of die-sinking EDM. Response surface
method used to develop the mathematical models so can predict the output. In addition,
the previous study of relationship between input and output parameters.
2.2 TITANIUM ALLOYS
Titanium alloys are replacing traditional aluminum alloys in many aerospace
applications because of their unique high strength to weight ratio that is maintained at
elevated temperatures and their exceptional corrosion resistance. The demand of
titanium alloy was predicted increase gradually at the following years. Titanium alloy is
more difficult to cut than common steel alloys and hence titanium is considered a
difficult-to-machine material. The main concern of titanium alloys is the difficult to cut.
Their low thermal conductivity leads to high cutting temperatures, and their high
chemical reactivity with many tool materials leads to strong adhesion between the tool
and work material. These two factors lead to rapid tool wear during machining of
titanium alloys, which in turn increases the manufacturing cost. Therefore,
unconventional machining, Electrical Discharge Machine is recommended.
Titanium Alloys, Ti6Al4V, sometimes called titanium grade 5 or VT6, is
classified as alpha-beta alloy. Alpha and Beta Alloys, which are metastable and usually
contains some combination of both alpha and beta stabilizers, and which can be heat
6
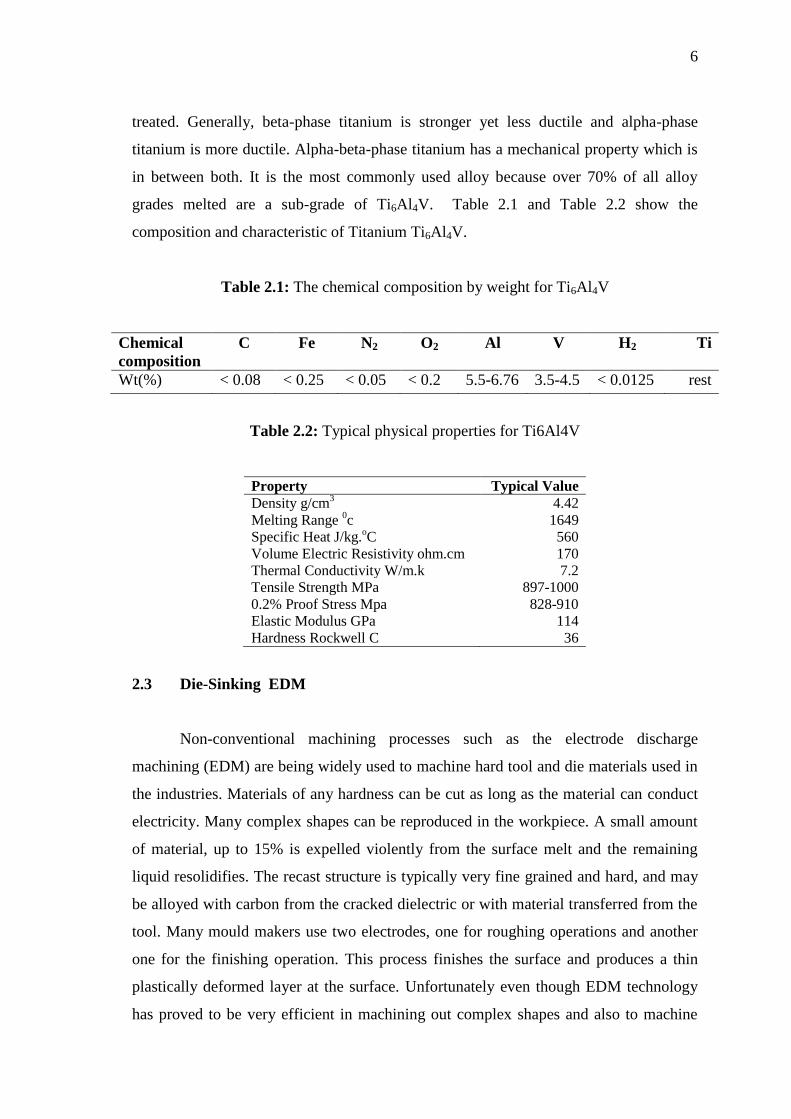
treated. Generally, beta-phase titanium is stronger yet less ductile and alpha-phase
titanium is more ductile. Alpha-beta-phase titanium has a mechanical property which is
in between both. It is the most commonly used alloy because over 70% of all alloy
grades melted are a sub-grade of Ti6Al4V. Table 2.1 and Table 2.2 show the
composition and characteristic of Titanium Ti6Al4V.
Table 2.1: The chemical composition by weight for Ti6Al4V
Chemical
composition
C Fe N2 O2 Al V H2 Ti
Wt(%) < 0.08 < 0.25 < 0.05 < 0.2 5.5-6.76 3.5-4.5 < 0.0125 rest
Table 2.2: Typical physical properties for Ti6Al4V
Property Typical Value Density g/cm
3 4.42
Melting Range 0c 1649
Specific Heat J/kg.oC 560
Volume Electric Resistivity ohm.cm 170 Thermal Conductivity W/m.k 7.2 Tensile Strength MPa 897-1000 0.2% Proof Stress Mpa 828-910 Elastic Modulus GPa 114 Hardness Rockwell C 36
2.3 Die-Sinking EDM
Non-conventional machining processes such as the electrode discharge
machining (EDM) are being widely used to machine hard tool and die materials used in
the industries. Materials of any hardness can be cut as long as the material can conduct
electricity. Many complex shapes can be reproduced in the workpiece. A small amount
of material, up to 15% is expelled violently from the surface melt and the remaining
liquid resolidifies. The recast structure is typically very fine grained and hard, and may
be alloyed with carbon from the cracked dielectric or with material transferred from the
tool. Many mould makers use two electrodes, one for roughing operations and another
one for the finishing operation. This process finishes the surface and produces a thin
plastically deformed layer at the surface. Unfortunately even though EDM technology
has proved to be very efficient in machining out complex shapes and also to machine

7
very hard materials, there are several problems that are associated with this machining
method. The main problem is the formation of a ‘recast’ white layer, which is very hard
and contains many imperfections such as cracks, micro cracks and high tensile residual
stresses. These features are undesirable in most cases since early failure of the
component might result. The severity of the damage in the recast layer depends on the
machining conditions. A roughing condition will entail fast machining (high
productivity) operation but severe damage and high surface roughness. Thus a suitable
process parameter is important so as to improve the productivity of this process and at
the same time getting an optimum surface integrity.
2.4 MACHINING PARAMETER
Basically, there have two types of parameters which were input parameters and
output parameters. Input parameters are help to distribute the output parameters, in
order words, they are interrelated. Various input result various output. One of the
objectives of this study is study the relationship between input and output. After
analysis, then get a set of optimum parameters. In this study, the input parameters were
peak current, pulse-on-time, pulse-off-time and servo voltage. These input parameters
were various for the experiments. Others parameters were remains constant at these
experiments .Constant parameters were included polarity, servo speed, flushing pressure,
main power supply, jump-up time, jump-down machining time, jump speed and so on.
Usually, constant parameter takes a least effect on the output parameter so there was no
investigation needed. The output parameters were material removal rates, electrode
wear rate and surface roughness. Material removal rate is the rate of the Ti6Al4V
removed per second. Electrode wear rate is the rate of copper electrode removed per
second. Surface roughness is the measure if the finer surface irregularities in the surface
texture. These are the result of the manufacturing process employed to create the surface.
Surface roughness Ra is rated as the arithmetic average deviation of the surface valleys
and peaks expressed in micro inches or micro meters Table 2.3 shows all the machining
parameters.

8
Table 2.3: Machining parameter
Parameter Function
PL Polarity ON Electric discharge time OFF Electric discharge off time IP Electric discharge peak current SV Servo voltage S Servo speed UP Jump-up time DN Jump-down machining time JS Jump speed LNS Loran shape STEP Loran orbiting motion distance on one side V Main supply voltage HP Auxiliary power supply current control, pulse control, capacitor,
selection PP PIKADEN pulse, shutoff circuit control C Capacitor ALV Arc detection level OC ON pulse control LF OFF pulse control, HS servo JM Jump mode LS Loren speed and direction LNM Loran mode
Figure 2.1: Polarity
Polarity, PL, determines electric polarity of the electrode and work piece.
Choose ‘positive’ and ‘negative’ for the z-axis. Usually z-axis was referred to electrode.
Polarity selection depending on the machining conditions and the material combination
of the work piece and the electrode, it may be necessary to change the polarity. If wrong
polarity is set, good machining performance may not be obtained. Figure 2.1 show the
polarity.

9
Pulse on-time specifies the duration of an electric discharge and determines the
electric discharge pulse control system. In others words, it was the duration of time the
current is allowed to flow per cycle. Material removal is directly proportional to the
amount of energy applied during this on time. This energy is controlled by the peak
current and the length of the on-time.
Pulse off-time specifies the duration of a stop between electric discharge pulses
off. It is the duration of time between the sparks. This time allows the molten material to
solidify and to be wash out of the arc gap. This parameter is to affect the speed and the
stability of the cut. Therefore, the performance will more stable for the long off-time.
Peak current specifies the peak current for EDM. Peak current is the sum of the
main electric discharge current and the SVC electric discharge current. This is an
important parameter that determines the machining performance such as machining
speed, surface roughness, electrode wear, or discharge gap, in combination of the time.
Servo voltage specifies a reference voltage for servo motions to keep gap
constant. This servo motion control is performed in accordance with gap
voltage .Fluctuation relative to servo voltage when gap voltage is higher than servo
voltage, the electrode advances for machining; when it is lower, the electrode retracts to
open the gap.
2.5 RESPONSE SURFACE METHODOLOGY
Response surface methodology is a collection of mathematical and statistical
techniques that are useful for the modelling and analysis of problems in which a
response of interest is influenced by several variables and the objective is to optimize
this response. When higher order polynomial model is used, the accuracy will be
increase but generally it up to second order only. To provide some context, there is good
commercial software available to help with designing and analyzing response surface
experiments. The most popular include Design-Expert, Minitab and many others.

10
Response-surface method involve some unique experimental-design issues, due
to the emphasis on iterative experimentation and the need for relatively sparse designs
that can be built-up piece-by-piece according to the evolving needs of the experimenter.
Besides, response-surface analysis is not simply regression problem, there are several
intricacies in this analysis and how it is commonly used that are enough different from
routine regression problems that some special help is warranted. These intricacies
include the common use of coded predictor variables; the assessment of the fit; the
different follow-up analyses that are used depending on that type of model is fitted, as
well as the outcome of the analysis; and the importance of visualizing the response
surface. Below is a general overview of response-surface method.
1. Provides functions and data types that provide for the coding and decoding
of factor levels, since appropriate coding is an important element of
response-surface analysis
2. Provides functions for generating standard designs.
3. Extends R’s lm function to simplify the specification of standard response-
surface models, and provide appropriate summaries.
4. Provides means of visualizing a fitted response surface.
5. Provides guidance for further experimentation.
Generally, DOE is used to design a set of experiment by control the variation. In
the design of experiments, the experimenter is often interested in the effect of some
process or intervention on some objects which may be people, parts of people, groups of
people, plants, animals, etc. Response surface designs are types of Experimental Design
that suspect that has the curvature response between input and output. The design matrix
originally used included the limits of the factor settings available to run the process. In
other words, response surface designs achieve this by using a quadratic regression
equation rather than the linear form of the regression equation used in factorial designs.
( Anderson and Whitcomb. 2005.)
Central composite designs consist of factorial points, axial points and central
point. Central composite designs are often recommended when the design plan calls for
sequential experimentation because these designs can incorporate information from a

11
properly planned factorial experiment. The factorial and centre points may serve as a
preliminary stage where you can fit a first-order (linear) model, but still provide
evidence regarding the importance of a second-order contribution or curvature
(Anderson and Whitcomb. 2005). Orthogonally blocked designs allow for model terms
and block effects to be estimated independently and minimize the variation in the
regression coefficients. Rotatable designs provide the desirable property of constant
prediction variance at all points that are equidistant from the design centre, thus
improving the quality of prediction.
2.6 ANALYSIS OF VARIANCE
Analysis of variance (ANOVA) is a powerful statistical tool. It has the function
that quantifying interactions between independent variables and at the same time to
determine their impact on the predicted variables. Besides that, the treatment data must
be normally distributed. ANOVA table lists the sources of variation, their degrees of
freedom, the total sum of squares, and the mean squares. The analysis of variance table
also includes the F-statistics and P-values. Use these to determine whether the
predictors or factors are significantly related to the response ( Healey and Prus 2009 ).
P-value ranges from zero to one. P-value has the function that determines the
probability to rejecting the null hypothesis in hypothesis test. When the P-values is
higher that the α-values, its mean significant. The smaller P-value has higher accuracy.
Because of their indispensable role in hypothesis testing, P-values are used in many
areas of statistics including basic statistics, linear models, reliability, and multivariate
analysis among many others. The key is to understand what the null and alternate
hypotheses represent in each test and then use the P-value to aid in your decision to
reject the null. ( Healey and Prus 2009 )
Lack-of-fit used in regression and DOE, lack-of-fit tests assess the fit of your
model. If the P-value is less than your selected -level, evidence exists that your model
does not accurately fit the data. You may need to add terms or transform your data to
more accurately model the data. Minitab calculates two types of lack-of-fit tests (Ott
and Longnecker 2008).

12
R-square is percentage of response variable variation that is explained by its
relationship with one or more predictor variables. In general, the higher the R2, the
better the model fits your data. R2 is always between 0 and 100%. It is also known as the
coefficient of determination or multiple determinations in multiple regressions (Ott and
Longnecker 2008). Used in regression analysis to indicate how well the model predicts
responses for new observations, whereas R2 indicates how well the model fits your data.
Predicted R2 can prevent over fitting the model and can be more useful than adjusted R
2
for comparing models because it is calculated using observations not included in model
estimation. Over fitting refers to models that appear to explain the relationship between
the predictor and response variables for the data set used for model calculation but fail
to provide valid predictions for new observations. Percentage of response variable
variation that is explained by its relationship with one or more predictor variables,
adjusted for the number of predictors in the model. This adjustment is important
because the R2 for any model will always increase when a new term is added. A model
with more terms may appear to have a better fit simply because it has more
terms. However, some increases in R2
may be due to chance alone.
The adjusted R2
is a useful tool for comparing the explanatory power of models
with different numbers of predictors. The adjusted R2 will increase only if the new term
improves the model more than would be expected by chance. It will decrease when a
predictor improves the model less than expected by chance. (Ott and Longnecker. 2008)
2.7 RELATIONSHIP BETWEEN PARAMETERS
For sure, there were relationships between input and output parameters. If
second order of RSM was used, it can generate up to linear, interaction, or square
relations between parameters. This study was indicated the relationship between peak
current, servo voltage, pulse on-time, pulse off-time with material removal rate,
electrode removal rate and surface roughness.