performance of two 18-story steel moment-frame …authors.library.caltech.edu/6292/1/kries06.pdf ·...
TRANSCRIPT
Performance of Two 18-Story SteelMoment-Frame Buildings in SouthernCalifornia During Two Large SimulatedSan Andreas Earthquakes
Swaminathan Krishnan,a… M.EERI, Chen Ji,b… Dimitri Komatitsch,c…
and Jeroen Trompa…
Using state-of-the-art computational tools in seismology and structuralengineering, validated using data from the Mw=6.7 January 1994 Northridgeearthquake, we determine the damage to two 18-story steel moment-framebuildings, one existing and one new, located in southern California due toground motions from two hypothetical magnitude 7.9 earthquakes on the SanAndreas Fault. The new building has the same configuration as the existingbuilding but has been redesigned to current building code standards. Two casesare considered: rupture initiating at Parkfield and propagating from north tosouth, and rupture propagating from south to north and terminating atParkfield. Severe damage occurs in these buildings at many locations in theregion in the north-to-south rupture scenario. Peak velocities of 1 m.s−1 and2 m.s−1 occur in the Los Angeles Basin and San Fernando Valley, respectively,while the corresponding peak displacements are about 1 m and 2 m,respectively. Peak interstory drifts in the two buildings exceed 0.10 and 0.06 inmany areas of the San Fernando Valley and the Los Angeles Basin,respectively. The redesigned building performs significantly better than theexisting building; however, its improved design based on the 1997 UniformBuilding Code is still not adequate to prevent serious damage. The results fromthe south-to-north scenario are not as alarming, although damage is seriousenough to cause significant business interruption and compromise life safety.�DOI: 10.1193/1.2360698�
INTRODUCTION
The last major earthquake on the southern half of the San Andreas Fault was the FortTejon earthquake that occurred on 9 January 1857 �magnitude originally estimated to be7.9 by Sieh 1978, but subsequently upgraded to approximately 8.25 by the U.S. Geo-logical Survey�. This event was preceded by two estimated-magnitude 7.0 earthquakeson 8 and 21 December 1812. The 1857 event involved several meters of right lateral slipalong the south-central reach of the fault and was widely felt �Sieh 1978�. A majority of
a� Seismological Laboratory, California Institute of Technology, MS 252-21, Pasadena, CA 91125b� Department of Geological Sciences, University of California, Santa Barbara, CA 93106c� Department of Geophysical Modeling and Imaging, CNRS UMR 5212 and Magique 3D INRIA Futurs,
University of Pau, 64013 Pau Cedex, France1035Earthquake Spectra, Volume 22, No. 4, pages 1035–1061, November 2006; © 2006, Earthquake Engineering Research Institute
1036 S. KRISHNAN, C. JI, D. KOMATITSCH, AND J.TROMP
reports indicate that the duration of shaking was between one and three minutes. Basedon paleoseismological evidence, Sieh �1978� reconstructed the slip distribution along thefault for this event. The rupture initiated at Cholame about 25 km south of Parkfield incentral California, grew to a peak slip of about 9.5 m at Wallace Creek �about 67 kmfrom Cholame�, and propagated south past Wrightwood in southern California for a totaldistance of about 330 km. Newspaper accounts following the earthquake point to long-period, large-amplitude, long-duration ground shaking in the Los Angeles Basin and theSan Fernando Valley �Agnew and Sieh 1978, Meltzner and Wald 1998�.
According to Weldon et al. �2005�, even though the current 148-years hiatus in ac-tivity on the San Andreas Fault is not exceptional �although no lull in the past1,600 years appears to have lasted more than about 200 years�, when the current hiatusends a substantial portion of the fault is likely to break, either as a single long rupture or,less likely, as a series of overlapping ruptures over a short time interval. The potential fora large earthquake with a large amount of slip on the San Andreas Fault exists. In orderto prepare for this eventuality, it is critical to quantify the effects of such a scenario. Inthe absence of data, the only option is to use computer simulations for this purpose.
Seismologists have created 3-D Earth models �Magistrale et al. 1996, Magistrale etal. 2000, Kohler et al. 2003, Süss and Shaw 2003� of seismic wave speeds and density,and thanks to the advent of parallel computing now have the ability to study 3-D globaland regional seismic wave propagation using approaches based on Finite Element andFinite Difference methods. Various research groups have simulated ground motions fromearthquakes on faults in southern California �Heaton et al. 1995, Olsen et al. 1995,Graves 1998, Komatitsch et al. 2004, Liu et al. 2004�, and some have studied the 2-Dresponse of tall buildings under these ground motions �Hall et al. 1995, Hall 1998�.
Meanwhile, the field of structural engineering has experienced its own renaissance.The effort by the Structural Engineers Association of California, Applied TechnologyCouncil, and California Universities for Research in Earthquake Engineering �SAC1995a, b, c� to understand the causes of damage to moment-frame buildings during theMw=6.7 January 1994 Northridge earthquake in southern California has given a hugeboost to computationally modeling damage in steel buildings. Many tools have been de-veloped in recent years to perform 3-D nonlinear damage analyses of buildings usingthree-component ground motions �Lobo 1994, Powell and Campbell 1994, Prakash et al.1994, Kunnath 1995, El-Tawil and Deierlein 1996, Lobo et al. 1998, Filippou andRomero 1998, Carlson 1999, Krishnan 2003a, Mazzoni et al. 2005�.
With computational tools in seismology and structural engineering becoming moreaccurate, reliable, and versatile, it is a natural progression to bring the two together in theform of end-to-end simulations to address the risk posed to engineered structures. Theprimary objective of this study is to estimate numerically the damage that would occurin two 18-story steel moment-frame buildings in southern California from large earth-quakes on the San Andreas Fault. The fact that this particular type of building has beenselected for this study does not necessarily mean that this building type is the most vul-nerable; in fact, it probably is not. There are thousands of nonductile concrete buildingsthat are at greater risk. However, this is a prototype study, and in a study such as this it

PERFORMANCE OF 18-STORY STEEL MOMENT-FRAME BUILDINGS IN SOUTHERN CALIFORNIA 1037
is important to target buildings that have already been investigated in detail, and whosebehavior is well understood, so that a proof-of-concept can be established. Steelmoment-frame buildings have been studied extensively since the Northridge earthquake,so this building type is a natural choice for this study. The regions of interest are the SanFernando Valley and the Los Angeles Basin. It was decided to divide the entire regioninto a uniformly spaced grid �with a spacing of 1/32 of a degree or approximately3.5 km each way� consisting of 636 sites shown by solid triangles in Figure 1. The strat-egy was to place structural models of the two buildings at each of these sites on the gridand compute their response under ground motion from the two scenario earthquakes.The results are presented in the form of damage/drift performance maps.
Two scenarios involving the rupture of a 290-km segment of the San Andreas Faultare considered in this study. The first scenario consists of rupture initiating at Parkfieldin central California and propagating in a southeasterly direction, with slip increasinggradually from Parkfield to a maximum value just northwest of the region of interest anddropping off abruptly to zero �Figure 1, inset�. This slip distribution is derived from afinite-source inversion of the 3 November 2002, magnitude 7.9 Denali earthquake inAlaska �Ji et al. 2003�. The second scenario consists of the same source but reversed indirection, with the rupture initiating just north of the region of interest and terminating
Figure 1. Geographical scope of the simulation �The color scheme reflects topography, withgreen denoting low elevation and yellow denoting mountains�: The solid black triangles repre-sent the 636 sites at which seismograms are computed and buildings are analyzed. The whitebox is the surface projection of the Northridge earthquake fault. The red line in the inset is thetrace of the hypothetical 290-km rupture of the San Andreas Fault that is the primary focus ofthis study. The area enclosed by the blue polygon denotes the region covered by the 636 sites.
1038 S. KRISHNAN, C. JI, D. KOMATITSCH, AND J.TROMP
at Parkfield, and the peak slip occurring close to Parkfield. These two scenarios werespecifically chosen to illustrate the effects of directivity and slip distribution on the com-puted ground motions.
Two buildings are considered in this study. The index structure is an existing 18-story steel moment-frame building located on Canoga Avenue in Woodland Hills thatexperienced significant damage �moment-frame connection fractures� during the 1994Northridge earthquake. The second building is similar to the index structure, but thestructural system �i.e., the lateral force–resisting system� has been redesigned accordingto the 1997 Uniform Building Code �UBC 97� �ICBO 1997�. The fundamental differencebetween the two structures is that the new building has been designed for larger earth-quake forces �accounting for near-source effects� and stringent redundancy requirementsin the lateral force–resisting system. This leads to significantly different dynamic char-acteristics. In general, the redesigned building can be expected to perform better than theexisting building in the event of an earthquake. The description of the two structures anda detailed comparison in terms of their dynamic properties, static strength, and ductilityare presented in the next few sections.
EXISTING BUILDING
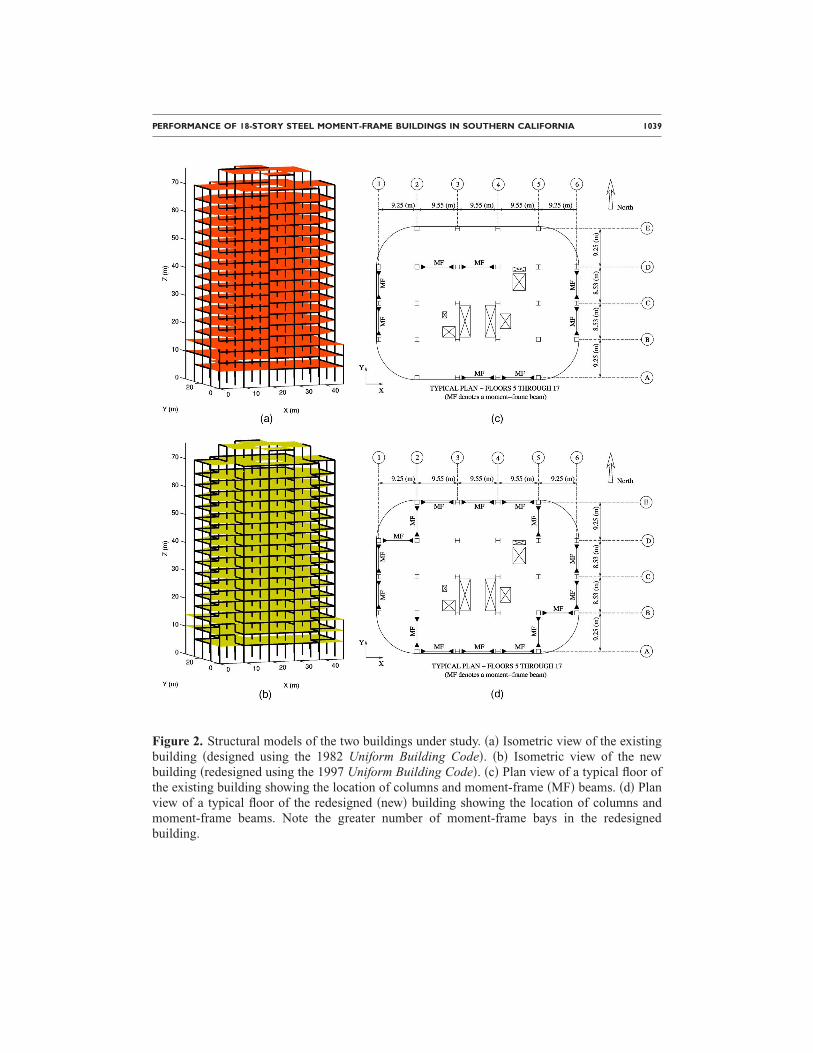
The existing building considered in this study is a modern 18-story welded steelmoment-frame building located within five miles of the epicenter of the 1994Northridge earthquake. It was designed in 1984 according to the lateral force require-ments of the 1982 Uniform Building Code �ICBO 1982� and construction was completedin 1986-87. It has 17 office stories above ground and a mechanical penthouse on top�Figure 2�. There is a single basement. The height of the building above ground is75.7 m �248�4�� with a typical story height of 3.96 m �13�0�� and taller 1st, 17th, andpenthouse stories. The plan configuration of the building is fairly uniform over itsheight. The lateral force–resisting system consists of two-bay welded steel momentframes, two apiece in either principal direction of the building. There are a few setbacksin the building that do not affect the lateral force–resisting system significantly. The east,west, and south moment frames lie on the perimeter of the building, while the northframe is located one bay inside of the perimeter. This gives rise to some torsional ec-centricity. Many moment-frame beam-column connections in the building fractured dur-ing the Northridge earthquake, and the building has been extensively investigated sincethen by many engineering research groups �SAC 1995b, Carlson 1999�. Figure 2a showsan isometric view of a structural model of the building. A typical floor plan is given inFigure 2c. Detailed floor plans, beam and column sizes, and gravity, wind, and seismicloading criteria are given in Krishnan et al. �2005�. A36 steel with nominal yieldstrength of 248.29 MPa �36 ksi� is used for all beams, while A572 Grade 50 steel withnominal yield strength of 344.85 MPa �50 ksi� is used for all columns. The floors con-sist of lightweight concrete slab on metal deck supported by steel beams and girdersframing into gravity and moment-frame columns.
The computed natural periods and the modal directions for the existing building�EB1� are given in Table 1. These are based on the assumption that live load does notcontribute to the seismic mass �UBC 97 guideline�. The modal direction factors identify
PERFORMANCE OF 18-STORY STEEL MOMENT-FRAME BUILDINGS IN SOUTHERN CALIFORNIA 1039
Figure 2. Structural models of the two buildings under study. �a� Isometric view of the existingbuilding �designed using the 1982 Uniform Building Code�. �b� Isometric view of the newbuilding �redesigned using the 1997 Uniform Building Code�. �c� Plan view of a typical floor ofthe existing building showing the location of columns and moment-frame �MF� beams. �d� Planview of a typical floor of the redesigned �new� building showing the location of columns andmoment-frame beams. Note the greater number of moment-frame bays in the redesigned
building.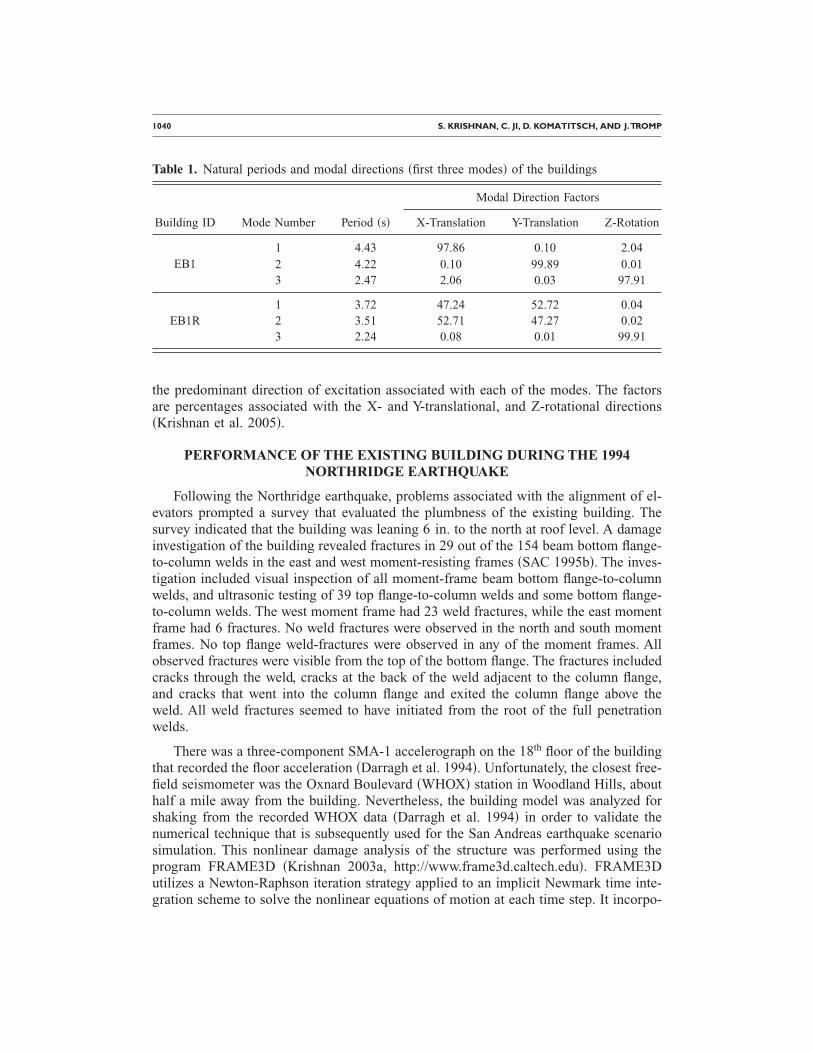
1040 S. KRISHNAN, C. JI, D. KOMATITSCH, AND J.TROMP
the predominant direction of excitation associated with each of the modes. The factorsare percentages associated with the X- and Y-translational, and Z-rotational directions�Krishnan et al. 2005�.
PERFORMANCE OF THE EXISTING BUILDING DURING THE 1994NORTHRIDGE EARTHQUAKE
Following the Northridge earthquake, problems associated with the alignment of el-evators prompted a survey that evaluated the plumbness of the existing building. Thesurvey indicated that the building was leaning 6 in. to the north at roof level. A damageinvestigation of the building revealed fractures in 29 out of the 154 beam bottom flange-to-column welds in the east and west moment-resisting frames �SAC 1995b�. The inves-tigation included visual inspection of all moment-frame beam bottom flange-to-columnwelds, and ultrasonic testing of 39 top flange-to-column welds and some bottom flange-to-column welds. The west moment frame had 23 weld fractures, while the east momentframe had 6 fractures. No weld fractures were observed in the north and south momentframes. No top flange weld-fractures were observed in any of the moment frames. Allobserved fractures were visible from the top of the bottom flange. The fractures includedcracks through the weld, cracks at the back of the weld adjacent to the column flange,and cracks that went into the column flange and exited the column flange above theweld. All weld fractures seemed to have initiated from the root of the full penetrationwelds.
There was a three-component SMA-1 accelerograph on the 18th floor of the buildingthat recorded the floor acceleration �Darragh et al. 1994�. Unfortunately, the closest free-field seismometer was the Oxnard Boulevard �WHOX� station in Woodland Hills, abouthalf a mile away from the building. Nevertheless, the building model was analyzed forshaking from the recorded WHOX data �Darragh et al. 1994� in order to validate thenumerical technique that is subsequently used for the San Andreas earthquake scenariosimulation. This nonlinear damage analysis of the structure was performed using theprogram FRAME3D �Krishnan 2003a, http://www.frame3d.caltech.edu�. FRAME3Dutilizes a Newton-Raphson iteration strategy applied to an implicit Newmark time inte-gration scheme to solve the nonlinear equations of motion at each time step. It incorpo-
Table 1. Natural periods and modal directions �first three modes� of the buildings
Building ID Mode Number Period �s�
Modal Direction Factors
X-Translation Y-Translation Z-Rotation
EB11 4.43 97.86 0.10 2.042 4.22 0.10 99.89 0.013 2.47 2.06 0.03 97.91
EB1R1 3.72 47.24 52.72 0.042 3.51 52.71 47.27 0.023 2.24 0.08 0.01 99.91
PERFORMANCE OF 18-STORY STEEL MOMENT-FRAME BUILDINGS IN SOUTHERN CALIFORNIA 1041
rates geometric nonlinearity, which enables the modeling of the global stability of thebuilding, accounting for P-� effects accurately. The moment-frame beams and columnsare modeled using elastofiber elements that consist of three segments, two nonlinear endsegments that are subdivided in the cross-section into a number of fibers, and an interiorelastic segment �Krishnan and Hall 2006b�. The beam-to-column joints are modeled inthree dimensions using FRAME3D panel zone elements while the gravity columns aremodeled using plastic hinge elements �Krishnan and Hall 2006a�. These elements havebeen shown to simulate damage accurately and efficiently �Krishnan 2003b�.
Material nonlinearity resulting in flexural yielding, strain-hardening and ultimatelyrupturing of steel at the ends of beams and columns, and shear yielding in the joints�panel-zones� is included. The fracture mode of failure is included in connections; how-ever, local flange buckling in beams and columns is not. It is assumed that a fiber that isfractured cannot resist tension but, upon contact, can start resisting compression again.Column splices can be incorporated into the model but are excluded in this study. Floor-framing beams with shear connections used to support gravity loads are not modeled.Their contribution to the strength and stiffness of the building may not be negligible.Soil-structure interaction �SSI� �e.g., Stewart et al. 1998, Trifunac et al. 2001a� is notincluded in the analyses because the required soil information pertaining to each site isnot available. Furthermore, to the authors’ knowledge, software capable of handling non-linear dynamic soil-structure interaction in an efficient manner does not exist at thistime. One of the few real-world examples of extensive SSI research is a 14-story rein-forced concrete storage building in Hollywood constructed in 1925 �Serino 1989, Fenvesand Serino 1990, Trifunac et al. 2001b�. These studies indicate that the change in variousstructural response parameters in this building during the 1 October 1987, magnitude 5.9Whittier Narrows earthquake due to SSI could have been up to 20%. SSI is an activearea of research and should be incorporated into future studies of this kind.
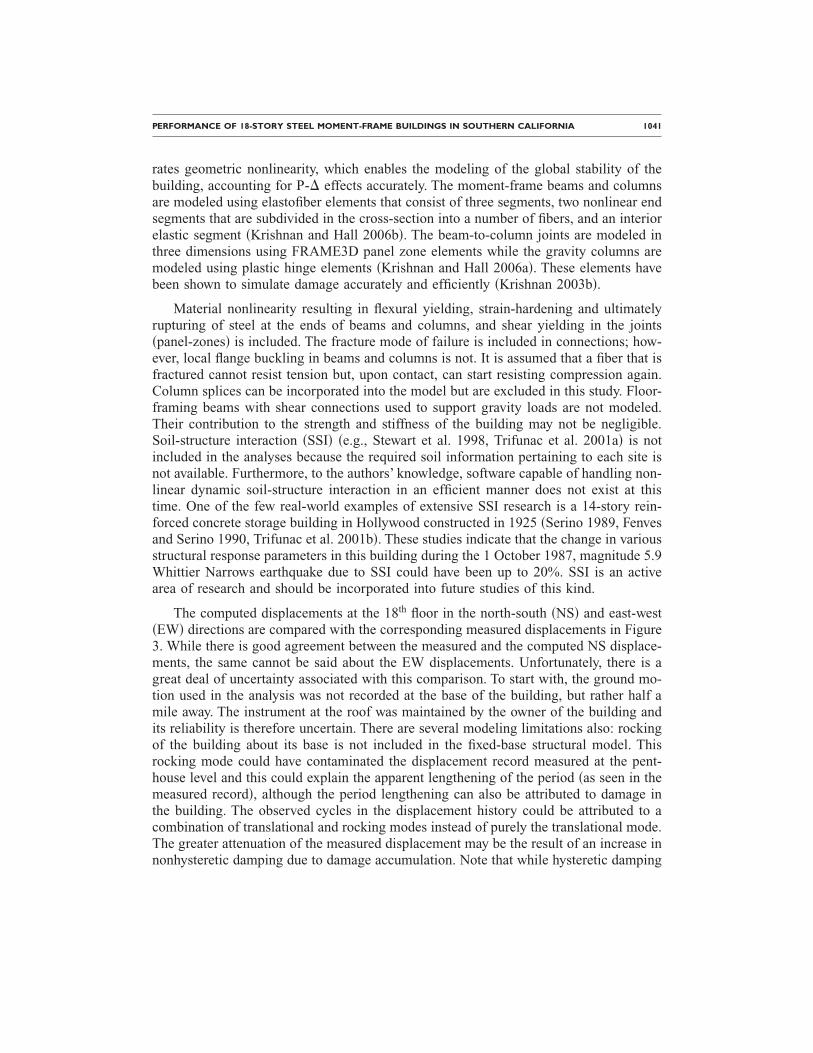
The computed displacements at the 18th floor in the north-south �NS� and east-west�EW� directions are compared with the corresponding measured displacements in Figure3. While there is good agreement between the measured and the computed NS displace-ments, the same cannot be said about the EW displacements. Unfortunately, there is agreat deal of uncertainty associated with this comparison. To start with, the ground mo-tion used in the analysis was not recorded at the base of the building, but rather half amile away. The instrument at the roof was maintained by the owner of the building andits reliability is therefore uncertain. There are several modeling limitations also: rockingof the building about its base is not included in the fixed-base structural model. Thisrocking mode could have contaminated the displacement record measured at the pent-house level and this could explain the apparent lengthening of the period �as seen in themeasured record�, although the period lengthening can also be attributed to damage inthe building. The observed cycles in the displacement history could be attributed to acombination of translational and rocking modes instead of purely the translational mode.The greater attenuation of the measured displacement may be the result of an increase innonhysteretic damping due to damage accumulation. Note that while hysteretic damping
1042 S. KRISHNAN, C. JI, D. KOMATITSCH, AND J.TROMP
is modeled accurately in a nonlinear fashion in the structural model, nonhystereticsupplemental damping is considered to be viscous and linear, and as damage accumu-lates, it does not increase correspondingly.
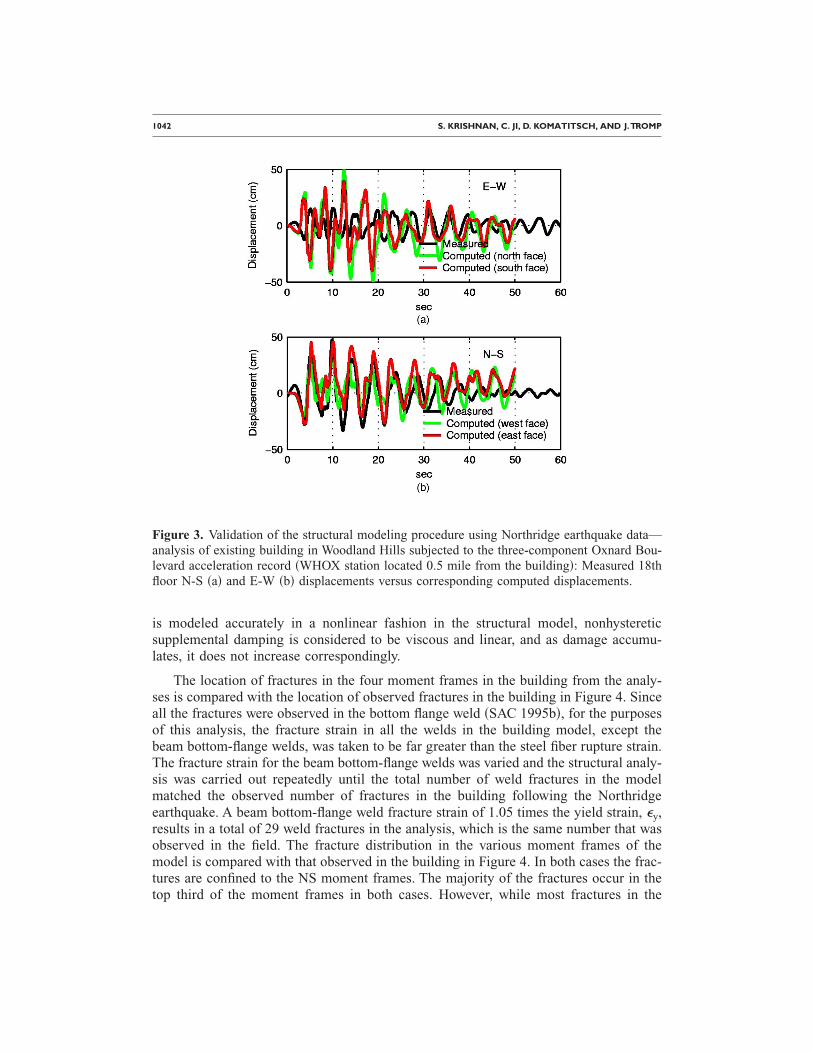
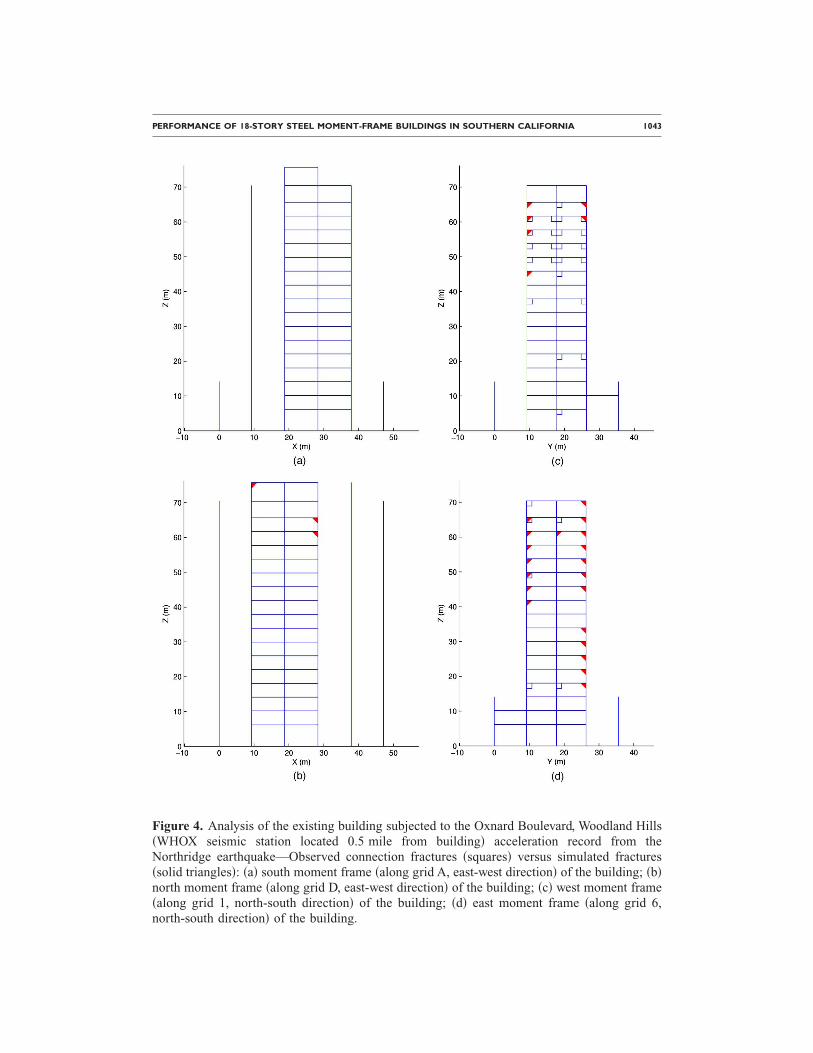
The location of fractures in the four moment frames in the building from the analy-ses is compared with the location of observed fractures in the building in Figure 4. Sinceall the fractures were observed in the bottom flange weld �SAC 1995b�, for the purposesof this analysis, the fracture strain in all the welds in the building model, except thebeam bottom-flange welds, was taken to be far greater than the steel fiber rupture strain.The fracture strain for the beam bottom-flange welds was varied and the structural analy-sis was carried out repeatedly until the total number of weld fractures in the modelmatched the observed number of fractures in the building following the Northridgeearthquake. A beam bottom-flange weld fracture strain of 1.05 times the yield strain, �y,results in a total of 29 weld fractures in the analysis, which is the same number that wasobserved in the field. The fracture distribution in the various moment frames of themodel is compared with that observed in the building in Figure 4. In both cases the frac-tures are confined to the NS moment frames. The majority of the fractures occur in thetop third of the moment frames in both cases. However, while most fractures in the
Figure 3. Validation of the structural modeling procedure using Northridge earthquake data—analysis of existing building in Woodland Hills subjected to the three-component Oxnard Bou-levard acceleration record �WHOX station located 0.5 mile from the building�: Measured 18thfloor N-S �a� and E-W �b� displacements versus corresponding computed displacements.
PERFORMANCE OF 18-STORY STEEL MOMENT-FRAME BUILDINGS IN SOUTHERN CALIFORNIA 1043
Figure 4. Analysis of the existing building subjected to the Oxnard Boulevard, Woodland Hills�WHOX seismic station located 0.5 mile from building� acceleration record from theNorthridge earthquake—Observed connection fractures �squares� versus simulated fractures�solid triangles�: �a� south moment frame �along grid A, east-west direction� of the building; �b�north moment frame �along grid D, east-west direction� of the building; �c� west moment frame�along grid 1, north-south direction� of the building; �d� east moment frame �along grid 6,north-south direction� of the building.
1044 S. KRISHNAN, C. JI, D. KOMATITSCH, AND J.TROMP
building occurred in the west moment frame �23� with fewer fractures in the east mo-ment frame �6�, the opposite is true for the model with 6 fractures in the west momentframe and 20 fractures in the east moment frame. If the sign of the east component ofthe WHOX ground motion record is reversed, then the damage pattern in the model issimilar to the observed pattern. However, the recording instrument was a three-component SMA-1 strong motion accelerograph for which an orientation reversal of oneof the two horizontal components is possible only in conjunction with an orientation re-versal of the other horizontal component. Yet another unexplained observation is that atwin building with the same configuration, design, and orientation had a very differentdamage pattern compared to the building considered here �based on personal communi-cation with one of the authors of the SAC 1995b report�. Unfortunately, the details ofthis building were not included in the report. In any case, the precise location of frac-tures in any building may be quite hard to predict as a result of the inherent randomcharacter of connection fractures owing to such unpredictable factors as variability inweld quality, yield strength of individual beams and columns, and other factors not di-rectly accounted for in the model.
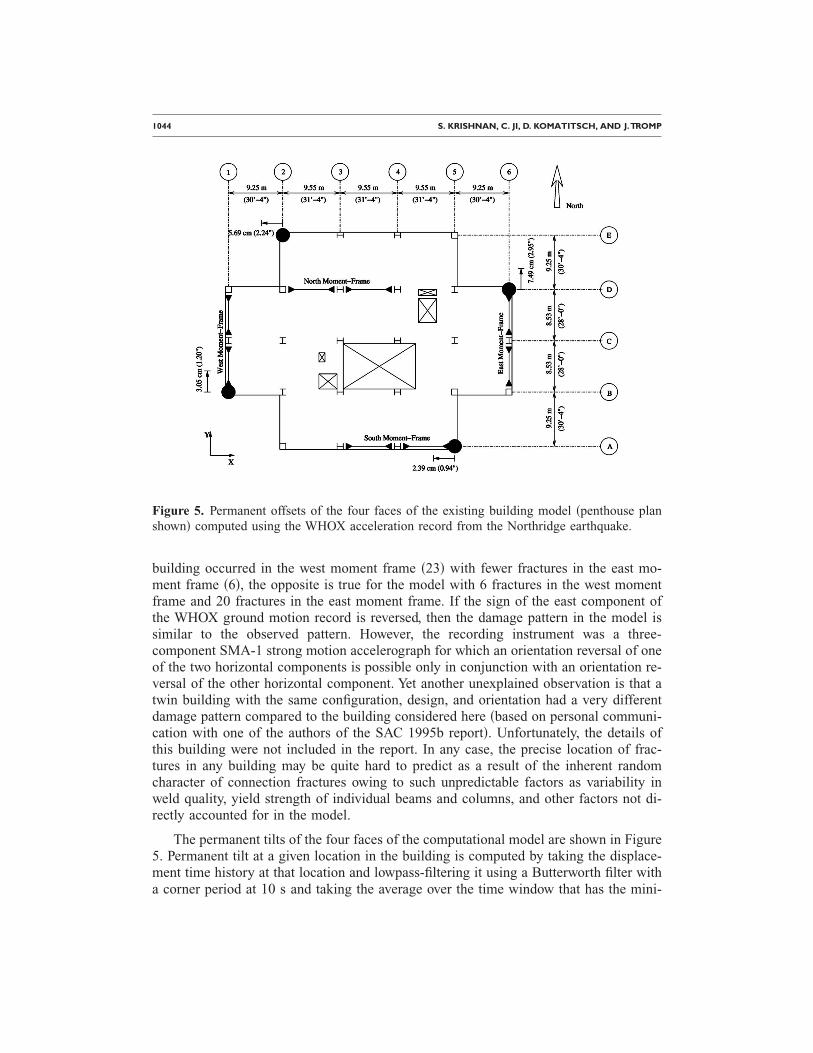
The permanent tilts of the four faces of the computational model are shown in Figure5. Permanent tilt at a given location in the building is computed by taking the displace-ment time history at that location and lowpass-filtering it using a Butterworth filter witha corner period at 10 s and taking the average over the time window that has the mini-
Figure 5. Permanent offsets of the four faces of the existing building model �penthouse planshown� computed using the WHOX acceleration record from the Northridge earthquake.
PERFORMANCE OF 18-STORY STEEL MOMENT-FRAME BUILDINGS IN SOUTHERN CALIFORNIA 1045
mum variance. The length of the time window was taken to be 5 s. Note that this is thetilt in the building relative to the ground. Leaning of the building as a result of a tilt ofthe ground, or differential settlement in the structure foundation following the earth-quake would not be captured by the structural model. Twisting of the model has resultedin a non-uniform pattern of permanent tilting of the four faces. The northeast corner hasa net permanent offset of 3.7 in. in a northwesterly direction. Recall that the observedoffset in the building was 6 in. to the north �SAC 1995b�.
REDESIGNED BUILDING
There have been many improvements in building codes and construction practicessince 1994, and buildings designed according to UBC 97 �ICBO 1997� are required toresist larger earthquake forces if located in regions close to major faults. Their lateralforce–resisting systems are also required to be more redundant, which in the case of mo-ment frames translates to a greater number of bays. In addition, the post-Northridgeframing connections proposed in the wake of failures observed in the 1994 Northridgeearthquake are likely to behave in a ductile fashion. The specifications developed by theFederal Emergency Management Agency �FEMA� for moment-frame construction striveto achieve this in the field �SAC 2000b�. Thus new steel moment-frame buildings areexpected to perform far better than existing buildings in large earthquakes, and it is ofinterest to study the performance of such buildings under the scenario earthquakes con-sidered here. To this end, the existing 18-story building has been redesigned for UBC 97requirements.
The gravity- and wind-loading criteria from the existing building were retained forthe design of the new building. For the seismic static base-shear calculation, near-sourcefactors were computed assuming a Type A seismic source at a distance of 5 km from thebuilding; soil type Sb was assumed as well �ICBO 1997�. The stricter lateral force andredundancy requirements of UBC 97 led to a reconfiguration of the lateral system, re-sulting in a greater number of bays of moment frames in each direction �4 bays on eachface of the building�. A typical floor plan is given in Figure 2d. Detailed floor plans,beam and column sizes, and the gravity-, wind-, and seismic-loading criteria are given inKrishnan et al. �2005�. Note that the moment frame that was located in the interior of theexisting building on grid D has been moved to the perimeter �to grid E�. The two-storyspace required at the lobby of the building precludes moment-frame beams on grid E atthe second floor between grids 1–2, 3–4, and 4–5. This probably prompted the structuralengineers of the existing building to move the frame to the interior of the building togrid D. But since the stiffness demand at the lower levels is not as high, it was concludedthat the frame would be stiff enough with a single beam at the second floor on grid E.Box sections are used for the columns left unsupported laterally for two stories at E-1,E-4, E-5, and E-6, to keep the slenderness ratio governing the design within reasonablelimits. ASTM A572 Grade 50 steel with nominal yield strength of 344.85 MPa �50 ksi�is used for both beam and column sections, as well as for doubler plates that are pro-vided to strengthen panel zones.
1046 S. KRISHNAN, C. JI, D. KOMATITSCH, AND J.TROMP
The computed natural periods and the modal directions for the redesigned building�EB1R� are given in Table 1. Note that the redesigned building is far stiffer than theexisting building.
PUSHOVER ANALYSES OF EXISTING AND REDESIGNED BUILDINGS
To quantify the actual strength and ductility �deformation potential� of the two build-ings in the two principal directions, pushover analyses are performed in each direction.The building is subjected to a slow, ramped, horizontal ground acceleration that in-creases at a constant rate of 0.3 g/minute, and the building response is computed dy-namically using FRAME3D. The structural model is identical to that used in the earth-quake analyses except that masses for the horizontal degrees of freedom are recalculatedsuch that their sum matches the total seismic-design mass, W/g, with a distribution thatis proportional to the UBC 97 �ICBO 1997� seismic static design loads. Thus the lateralloads are essentially proportional to the horizontal seismic design forces over the heightof the structure increasing with time at a slow rate. The ductility of the building can alsobe quantified in terms of its post-yield displacement capacity.
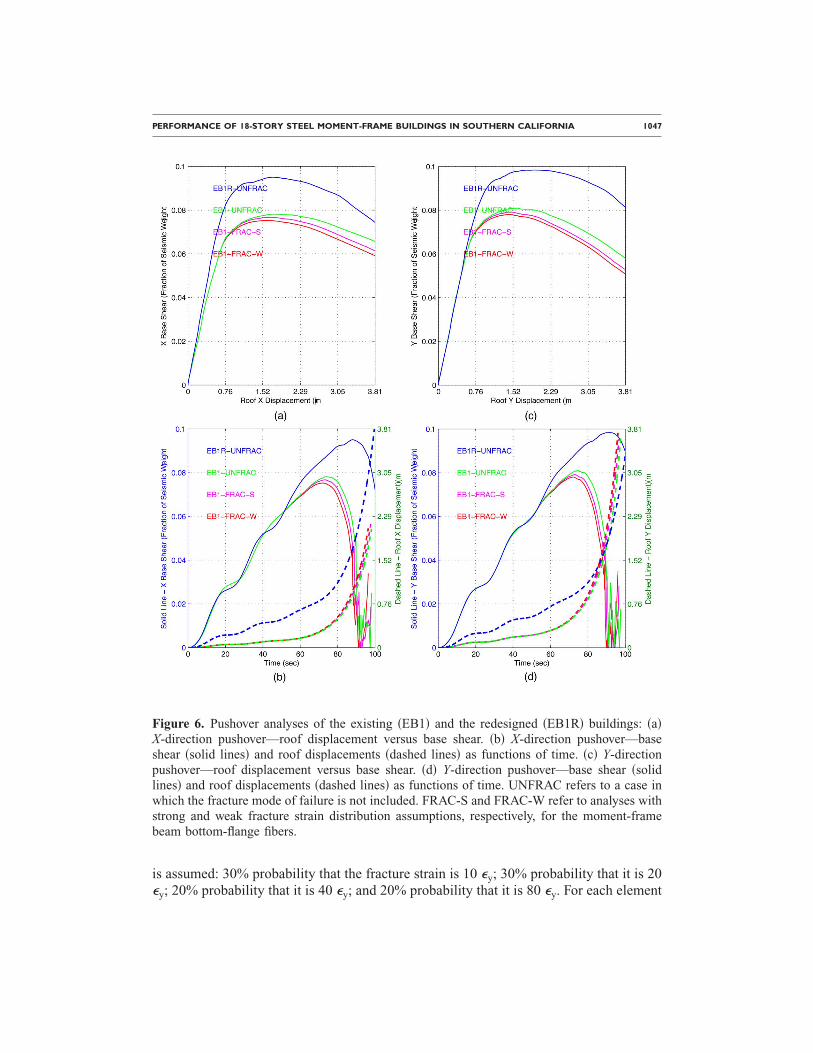
The results of the pushover analyses of both buildings are presented in Figure 6. Thebase shear in the direction of pushing is plotted as a percentage of the seismic weight ofthe building against the displacement at the 18th floor �penthouse level� for the two mod-els of the existing building that include fracture denoted by “EB1-FRAC-S” and “EB1-FRAC-W” and fracture-excluded models of the existing and redesigned buildings de-noted by “EB1-UNFRAC” and “EB1R-UNFRAC,” respectively �Figures 6a and 6c�. Theseismic weights computed according to UBC 97 for the existing and new buildings are12,689 metric tonnes �27,974 Kips� and 12,835 metric tonnes �28,297 Kips�, respec-tively. The ultimate strength of the existing building model in the x direction varies be-tween 7.5% and 7.85% of its seismic weight for the three cases—FRAC-S, FRAC-W,and UNFRAC, while the ultimate strength of the redesigned building model in the x di-rection is 9.5% of its seismic weight. Plotted in Figure 6b are the base shear as a per-centage of the seismic weight �solid lines� and the penthouse displacement �dashedlines� as a function of time for the x direction pushover for each case. The penthouselateral displacement at which the peak base shear is reached in the x direction is about1.73 m �68 in.� for both building models, which corresponds to an average inclinationof 2.3% over the height. Both building models are stronger in the y direction with ulti-mate strengths of about 8% W for the existing building and close to 10% W for the re-designed building. Plotted in Figure 6d are the base shear as a percentage of the seismicweight �solid lines� and the penthouse displacement �dashed lines� as a function of timefor the y direction pushover for each case. The penthouse lateral displacement at whichthe peak base shear is reached in the y direction is about 1.52 m �i.e., 60 in. or 2.0%average inclination� for the existing building model and 1.91 m �i.e., 75 in. or 2.5% av-erage inclination� for the redesigned building model.
The FRAC-W model assumes a constant fracture strain of 0.9 �y �where �y is theyield strain� for all the bottom fibers in the two nonlinear end segments of the elastofiberelements used to model the moment-frame beams �Krishnan and Hall 2006b�. For frac-ture strain of the beam top flange and web fibers, the following probability distribution
PERFORMANCE OF 18-STORY STEEL MOMENT-FRAME BUILDINGS IN SOUTHERN CALIFORNIA 1047
is assumed: 30% probability that the fracture strain is 10 �y; 30% probability that it is 20�y; 20% probability that it is 40 �y; and 20% probability that it is 80 �y. For each element
Figure 6. Pushover analyses of the existing �EB1� and the redesigned �EB1R� buildings: �a�X-direction pushover—roof displacement versus base shear. �b� X-direction pushover—baseshear �solid lines� and roof displacements �dashed lines� as functions of time. �c� Y-directionpushover—roof displacement versus base shear. �d� Y-direction pushover—base shear �solidlines� and roof displacements �dashed lines� as functions of time. UNFRAC refers to a case inwhich the fracture mode of failure is not included. FRAC-S and FRAC-W refer to analyses withstrong and weak fracture strain distribution assumptions, respectively, for the moment-framebeam bottom-flange fibers.
1048 S. KRISHNAN, C. JI, D. KOMATITSCH, AND J.TROMP
a random number is generated, and based on its value a fracture strain consistent withthis probability distribution is assigned to each fiber of the top flange and the web. Forcolumn flange and web fibers, it is assumed that the fracture strains are far greater thanthe rupture strain, thus precluding the occurrence of fractures.
The FRAC-S model makes the same assumptions with regard to the fracture strain asthe FRAC-W model, except that the fracture strain for the bottom-flange fibers of themoment-frame beams is not constant but determined based on the following probabilitydistribution: 20% probability that the fracture strain is 0.9 �y; 20% probability that it is2 �y; 20% probability that it is 5 �y; 20% probability that it is 15 �y; and 20% probabilitythat it is 40 �y.
NUMERICAL SIMULATION OF GROUND MOTION
The numerical simulations of ground motion, accounting for 3-D variations of seis-mic wave speeds and density, topography, and bathymetry �the large model of the LosAngeles region includes a part of the Pacific Ocean, hence the need for bathymetry�, andseismic attenuation, are carried out using our open-source seismic wave propagationpackage SPECFEM3D �http://www.geodynamics.org�. The methodology adoptedtherein has been shown to reliably model ground motion in the Los Angeles region downto a shortest period of approximately 2 s �Komatitsch et al. 2004, Liu et al. 2004�. Heretwo validation exercises are performed.
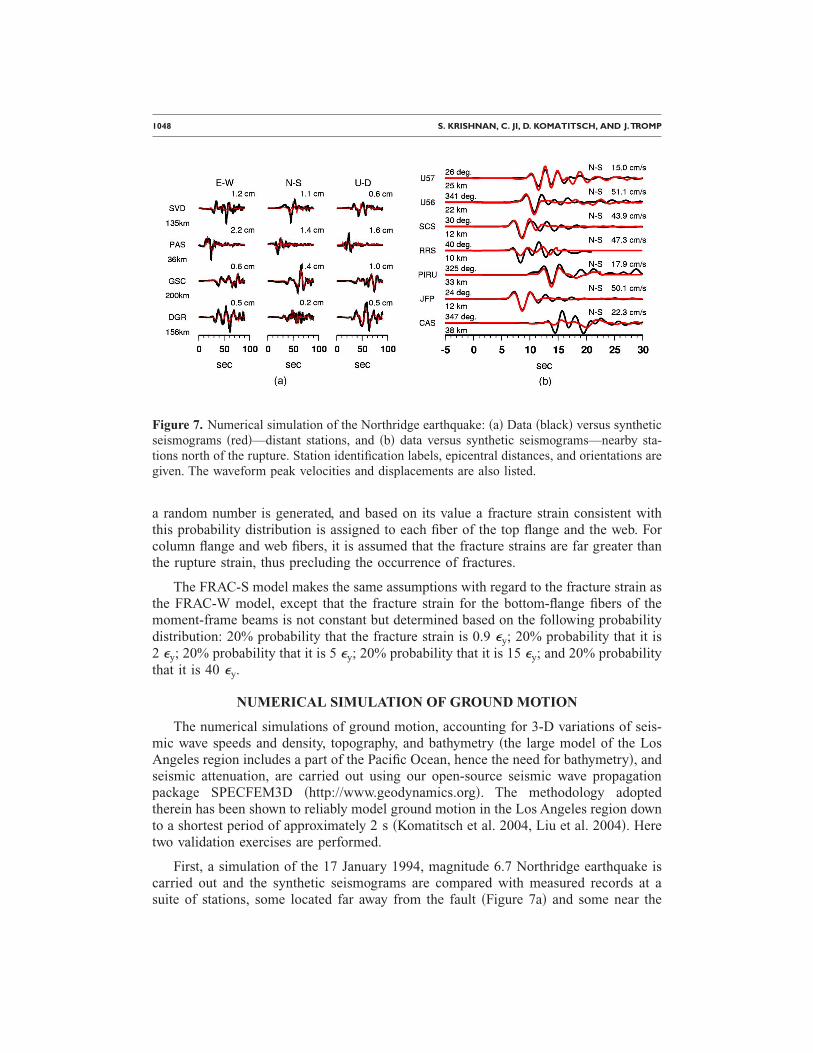
First, a simulation of the 17 January 1994, magnitude 6.7 Northridge earthquake iscarried out and the synthetic seismograms are compared with measured records at asuite of stations, some located far away from the fault �Figure 7a� and some near the
Figure 7. Numerical simulation of the Northridge earthquake: �a� Data �black� versus syntheticseismograms �red�—distant stations, and �b� data versus synthetic seismograms—nearby sta-tions north of the rupture. Station identification labels, epicentral distances, and orientations aregiven. The waveform peak velocities and displacements are also listed.
PERFORMANCE OF 18-STORY STEEL MOMENT-FRAME BUILDINGS IN SOUTHERN CALIFORNIA 1049
fault �Figure 7b�. The good match in the waveforms in terms of amplitudes and fre-quency content illustrates the validity of using this approach to simulate ground motionswith periods greater than 2 s in the Los Angeles Basin �note that both the simulated andthe measured records shown in these figures are lowpass-filtered using a Butterworth fil-ter with a corner period at 2 s�.
Second, since in general the response of a structure depends on the entire frequencyband of ground motion, the acceptability of using the band-limited simulated groundmotion records for the analysis of the two 18-story buildings considered here needs to bedemonstrated. To accomplish this, we performed nonlinear analyses of the existing andredesigned buildings subject to 13 three-component filtered and unfiltered records fromthe 21 September 1999, magnitude 7.7 Chi-Chi earthquake in Taiwan, and the 25 Sep-tember 2003, magnitude 8.3 Tokachi-Oki earthquake in Japan. Response spectra of thenorth and east components of these records, shown in Figures 8a and 8b, respectively,illustrate the wide range of intensities of the chosen ground motion. The results of thebuilding analyses indicate that the response of both buildings when subjected to the fil-tered records is not significantly different from their corresponding response when sub-jected to the unfiltered records for all damage ranges. This can be seen clearly in plots ofthe peak drift ratio occurring in the two cases plotted against each other, Figure 8c forthe existing building and Figure 8d for the redesigned building, wherein most of thepoints closely follow the diagonal. This demonstrates that band-limited simulatedground motions can indeed be reliably used for the analysis of the two 18-story build-ings considered in this study. Note that the colors used to plot the points in these figurescorrespond to those used to plot the response spectra in Figures 8a and 8b. Thus eachpoint can be identified with the corresponding ground motion record.
A key limitation of the ground motion simulation methodology that requires seriousconsideration in future studies is that the top soil layer is not included in the Earth modeldue to lack of sufficient data as well as the complexity associated with taking into ac-count low shear-wave velocities in the layer in the mesh used in the numerical technique.This typically softer layer may have the effect of significantly amplifying the ground mo-tion �Haskell 1960, Anderson et al. 1996�. Also, the simulations do not consider scat-tering of the wave field from city buildings �e.g., Clouteau and Aubry 2001�.
SAN ANDREAS SIMULATION: NORTH-TO-SOUTH RUPTURE
For a San Andreas simulation it is critical to have a realistic source model �slip dis-tribution as a function of time along the fault�. On 3 November 2002, a magnitude 7.9earthquake occurred on the vertical, right-lateral, Denali strike-slip fault system inAlaska, which is geometrically similar to the San Andreas Fault. For the simulation ofthe first scenario earthquake, the slip on the Denali fault system during the 2002 earth-quake is mapped onto the San Andreas Fault, with the rupture initiating at Parkfield andprogressing in a southeasterly direction over a distance of about 290 km �Figure 1 inset�.The maximum depth of rupture is about 20 km. The surface slip grows slowly to 7.4 mand drops off drastically towards the end of the rupture. The peak slip at depth is about12 m. To study the effects of directivity and spatial slip distribution on the basin ground

1050 S. KRISHNAN, C. JI, D. KOMATITSCH, AND J.TROMP
Figure 8. �a� and �b� Pseudo-acceleration response spectra of records from the 1999 Mw 7.7Chi-Chi, Taiwan, and the 2003 Mw 8.3 Tokachi-Oki, Japan, earthquakes: Comparison of spectraof unfiltered �solid� and filtered �dashed� records. �c� Peak drifts observed in the existingbuilding—analyses performed using filtered and unfiltered records. The color code is the sameas that used in �a� and �b�. �d� Peak drifts observed in the redesigned building—analyses usingfiltered and unfiltered records. The close alignment of all the points with the diagonal for alldamage ranges indicates that the effect of higher-frequency ground motion �periods �2 s� onthe response of the tall buildings considered in this study is not significant and can be safelyignored.
PERFORMANCE OF 18-STORY STEEL MOMENT-FRAME BUILDINGS IN SOUTHERN CALIFORNIA 1051
motion, in the next section a second scenario is considered with rupture propagatingfrom south-to-north and terminating at Parkfield, with the peak slip occurring close toParkfield.
Using the spectral-element method �e.g., Komatitsch and Tromp 1999�, seismogramsare computed at each of the 636 analysis sites shown in Figure 1. Time histories with atime step of 9 ms are computed for a total duration of 270 s, and lowpass-filtered usinga Butterworth filter with a corner period at 2 s. The filtered time histories at each analy-sis site are windowed to select only the portion that constitutes significant ground shak-
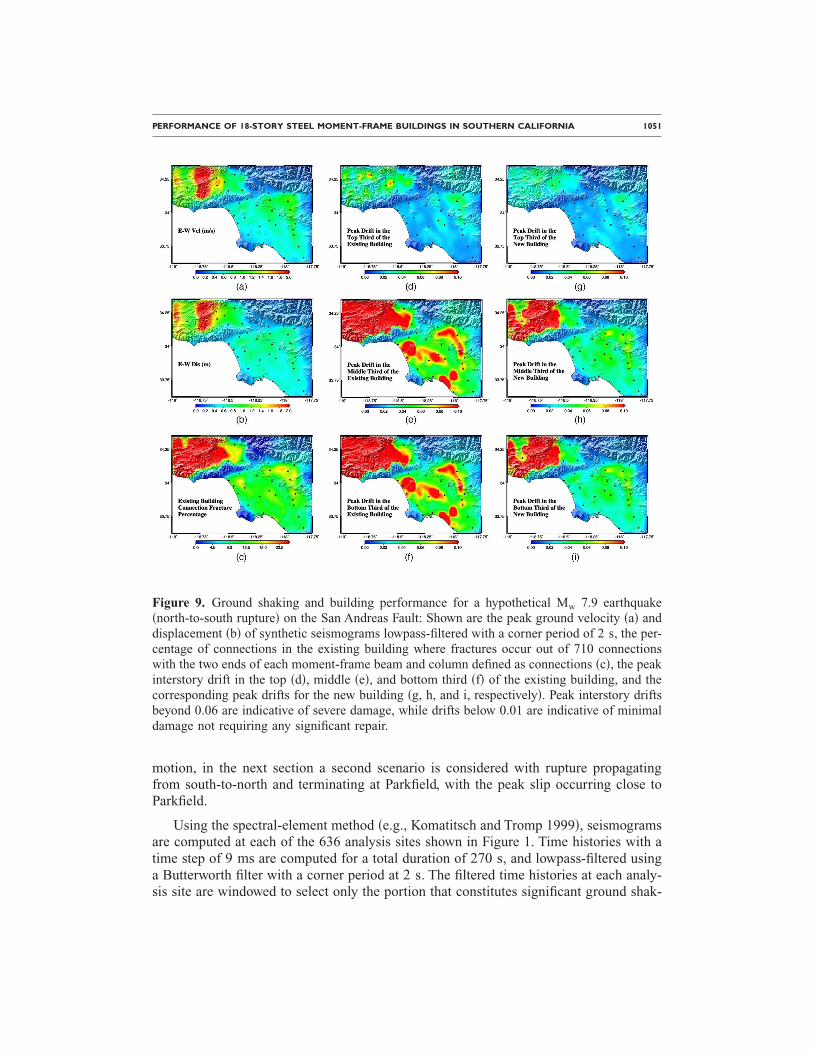
Figure 9. Ground shaking and building performance for a hypothetical Mw 7.9 earthquake�north-to-south rupture� on the San Andreas Fault: Shown are the peak ground velocity �a� anddisplacement �b� of synthetic seismograms lowpass-filtered with a corner period of 2 s, the per-centage of connections in the existing building where fractures occur out of 710 connectionswith the two ends of each moment-frame beam and column defined as connections �c�, the peakinterstory drift in the top �d�, middle �e�, and bottom third �f� of the existing building, and thecorresponding peak drifts for the new building �g, h, and i, respectively�. Peak interstory driftsbeyond 0.06 are indicative of severe damage, while drifts below 0.01 are indicative of minimaldamage not requiring any significant repair.
1052 S. KRISHNAN, C. JI, D. KOMATITSCH, AND J.TROMP
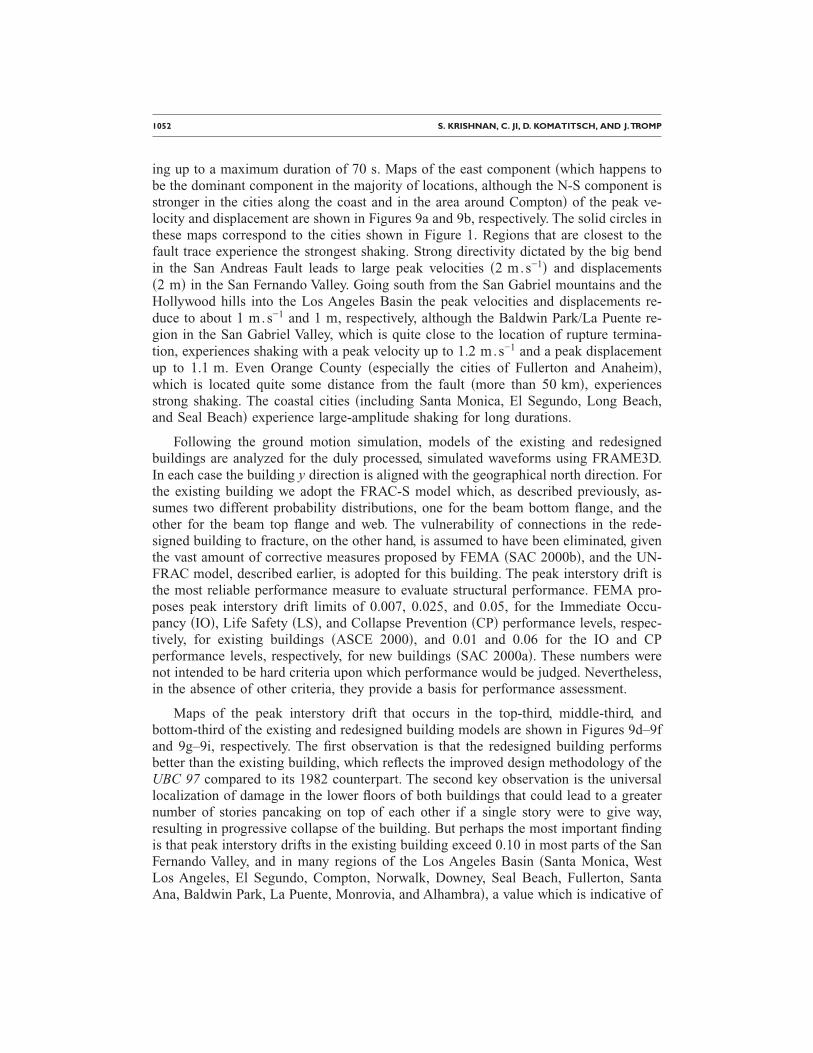
ing up to a maximum duration of 70 s. Maps of the east component �which happens tobe the dominant component in the majority of locations, although the N-S component isstronger in the cities along the coast and in the area around Compton� of the peak ve-locity and displacement are shown in Figures 9a and 9b, respectively. The solid circles inthese maps correspond to the cities shown in Figure 1. Regions that are closest to thefault trace experience the strongest shaking. Strong directivity dictated by the big bendin the San Andreas Fault leads to large peak velocities �2 m.s−1� and displacements�2 m� in the San Fernando Valley. Going south from the San Gabriel mountains and theHollywood hills into the Los Angeles Basin the peak velocities and displacements re-duce to about 1 m.s−1 and 1 m, respectively, although the Baldwin Park/La Puente re-gion in the San Gabriel Valley, which is quite close to the location of rupture termina-tion, experiences shaking with a peak velocity up to 1.2 m.s−1 and a peak displacementup to 1.1 m. Even Orange County �especially the cities of Fullerton and Anaheim�,which is located quite some distance from the fault �more than 50 km�, experiencesstrong shaking. The coastal cities �including Santa Monica, El Segundo, Long Beach,and Seal Beach� experience large-amplitude shaking for long durations.
Following the ground motion simulation, models of the existing and redesignedbuildings are analyzed for the duly processed, simulated waveforms using FRAME3D.In each case the building y direction is aligned with the geographical north direction. Forthe existing building we adopt the FRAC-S model which, as described previously, as-sumes two different probability distributions, one for the beam bottom flange, and theother for the beam top flange and web. The vulnerability of connections in the rede-signed building to fracture, on the other hand, is assumed to have been eliminated, giventhe vast amount of corrective measures proposed by FEMA �SAC 2000b�, and the UN-FRAC model, described earlier, is adopted for this building. The peak interstory drift isthe most reliable performance measure to evaluate structural performance. FEMA pro-poses peak interstory drift limits of 0.007, 0.025, and 0.05, for the Immediate Occu-pancy �IO�, Life Safety �LS�, and Collapse Prevention �CP� performance levels, respec-tively, for existing buildings �ASCE 2000�, and 0.01 and 0.06 for the IO and CPperformance levels, respectively, for new buildings �SAC 2000a�. These numbers werenot intended to be hard criteria upon which performance would be judged. Nevertheless,in the absence of other criteria, they provide a basis for performance assessment.
Maps of the peak interstory drift that occurs in the top-third, middle-third, andbottom-third of the existing and redesigned building models are shown in Figures 9d–9fand 9g–9i, respectively. The first observation is that the redesigned building performsbetter than the existing building, which reflects the improved design methodology of theUBC 97 compared to its 1982 counterpart. The second key observation is the universallocalization of damage in the lower floors of both buildings that could lead to a greaternumber of stories pancaking on top of each other if a single story were to give way,resulting in progressive collapse of the building. But perhaps the most important findingis that peak interstory drifts in the existing building exceed 0.10 in most parts of the SanFernando Valley, and in many regions of the Los Angeles Basin �Santa Monica, WestLos Angeles, El Segundo, Compton, Norwalk, Downey, Seal Beach, Fullerton, SantaAna, Baldwin Park, La Puente, Monrovia, and Alhambra�, a value which is indicative of
PERFORMANCE OF 18-STORY STEEL MOMENT-FRAME BUILDINGS IN SOUTHERN CALIFORNIA 1053
probable collapse. In Hollywood, Beverly Hills, and downtown Los Angeles, the existingbuilding model experiences peak drifts of 0.04–0.06, which is at or above the FEMACollapse Prevention performance level.
The redesigned building model experiences peak drifts of 0.10 �the probable thresh-old for collapse� or greater in the western half of the San Fernando Valley. The easternhalf experiences peak drifts of over 0.06, thus exceeding the Collapse Prevention per-formance criteria under FEMA guidelines. Progressing north to south into the Los An-geles Basin, note that the peak drifts in the redesigned building model are in the range of0.04—0.06, just satisfying the FEMA Collapse Prevention level. These drifts are indica-tive of serious damage, warranting building closures and business interruption. It shouldbe mentioned, however, that the primary goal of the building code is to prevent collapseof buildings in such large events, and in this regard the UBC 97 is partly successful �al-though some of the failure modes not included in the modeling could indicate greaterdamage than estimated here�. The percentage of connections that fractures in the exist-ing building model at each of the analysis sites is illustrated on a map in Figure 9c. Herethe two segments of the elastofiber element that is used to model each moment-framebeam or column are considered as connections. Since there are 355 elastofiber elementsrepresenting the moment-frame beams and columns of the existing building, the totalnumber of connections is taken to be 710. The vast percentage of connections that frac-ture in the existing building model throughout southern California is disconcerting.
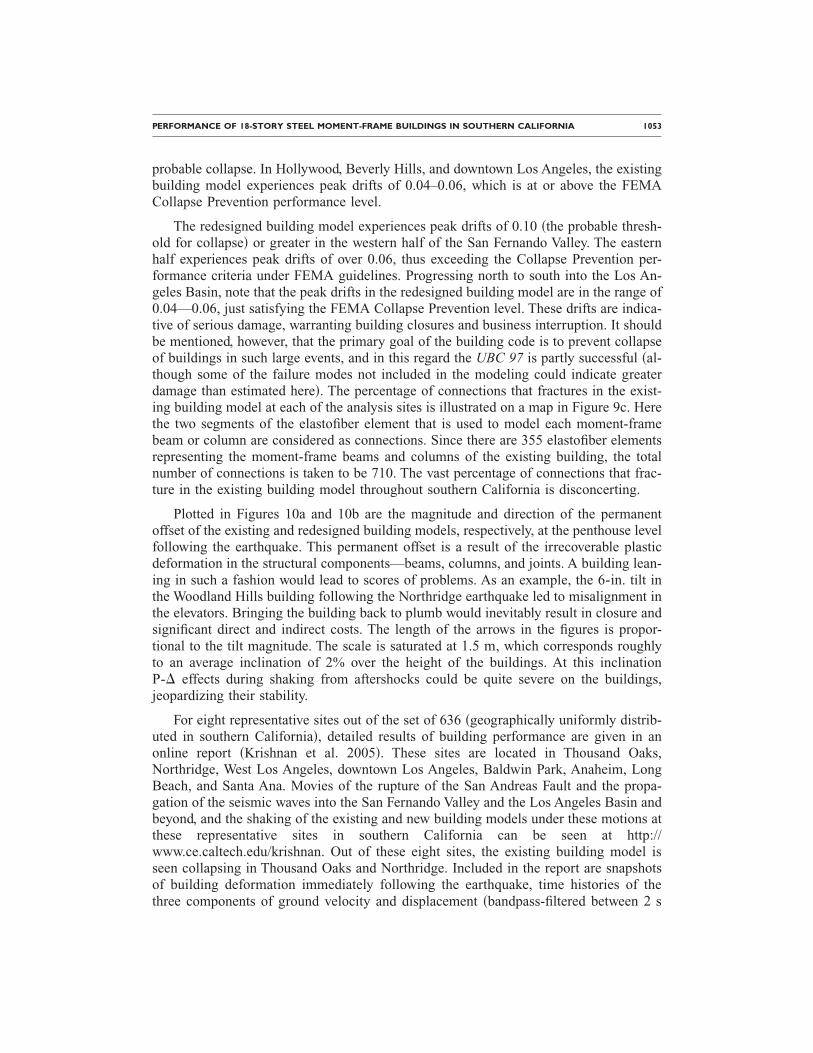
Plotted in Figures 10a and 10b are the magnitude and direction of the permanentoffset of the existing and redesigned building models, respectively, at the penthouse levelfollowing the earthquake. This permanent offset is a result of the irrecoverable plasticdeformation in the structural components—beams, columns, and joints. A building lean-ing in such a fashion would lead to scores of problems. As an example, the 6-in. tilt inthe Woodland Hills building following the Northridge earthquake led to misalignment inthe elevators. Bringing the building back to plumb would inevitably result in closure andsignificant direct and indirect costs. The length of the arrows in the figures is propor-tional to the tilt magnitude. The scale is saturated at 1.5 m, which corresponds roughlyto an average inclination of 2% over the height of the buildings. At this inclinationP-� effects during shaking from aftershocks could be quite severe on the buildings,jeopardizing their stability.
For eight representative sites out of the set of 636 �geographically uniformly distrib-uted in southern California�, detailed results of building performance are given in anonline report �Krishnan et al. 2005�. These sites are located in Thousand Oaks,Northridge, West Los Angeles, downtown Los Angeles, Baldwin Park, Anaheim, LongBeach, and Santa Ana. Movies of the rupture of the San Andreas Fault and the propa-gation of the seismic waves into the San Fernando Valley and the Los Angeles Basin andbeyond, and the shaking of the existing and new building models under these motions atthese representative sites in southern California can be seen at http://www.ce.caltech.edu/krishnan. Out of these eight sites, the existing building model isseen collapsing in Thousand Oaks and Northridge. Included in the report are snapshotsof building deformation immediately following the earthquake, time histories of thethree components of ground velocity and displacement �bandpass-filtered between 2 s
1054 S. KRISHNAN, C. JI, D. KOMATITSCH, AND J.TROMP
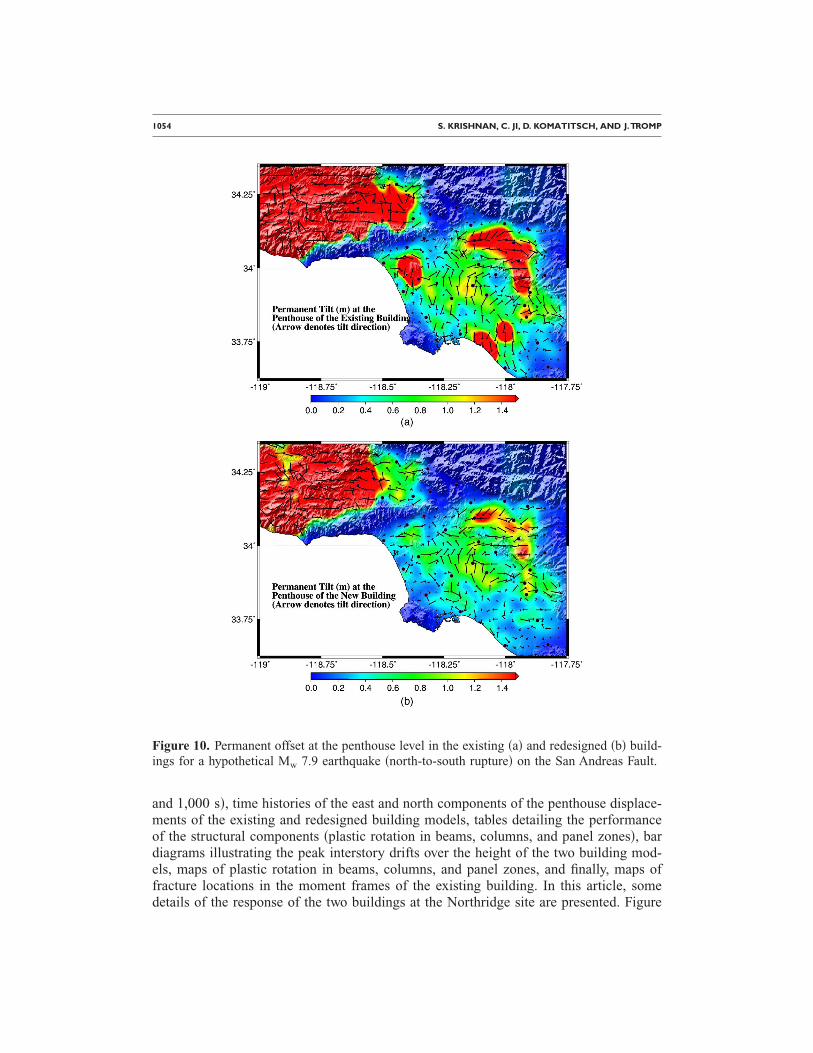
and 1,000 s�, time histories of the east and north components of the penthouse displace-ments of the existing and redesigned building models, tables detailing the performanceof the structural components �plastic rotation in beams, columns, and panel zones�, bardiagrams illustrating the peak interstory drifts over the height of the two building mod-els, maps of plastic rotation in beams, columns, and panel zones, and finally, maps offracture locations in the moment frames of the existing building. In this article, somedetails of the response of the two buildings at the Northridge site are presented. Figure
Figure 10. Permanent offset at the penthouse level in the existing �a� and redesigned �b� build-ings for a hypothetical Mw 7.9 earthquake �north-to-south rupture� on the San Andreas Fault.
PERFORMANCE OF 18-STORY STEEL MOMENT-FRAME BUILDINGS IN SOUTHERN CALIFORNIA 1055
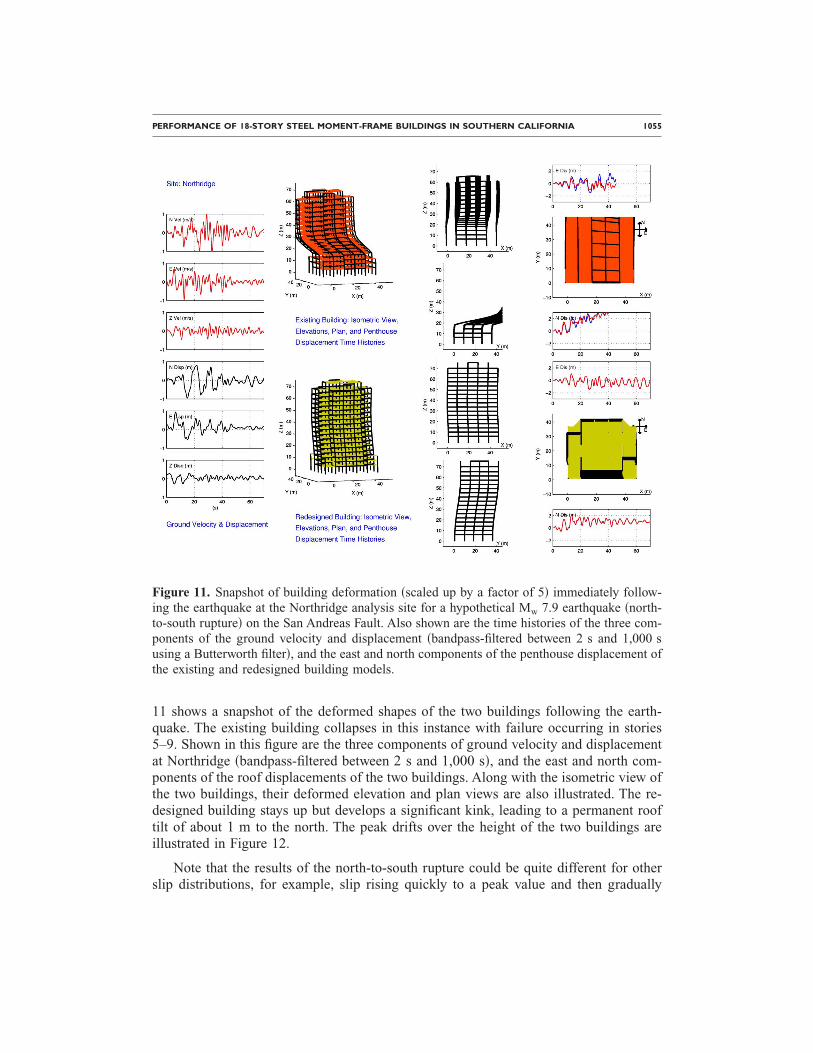
11 shows a snapshot of the deformed shapes of the two buildings following the earth-quake. The existing building collapses in this instance with failure occurring in stories5–9. Shown in this figure are the three components of ground velocity and displacementat Northridge �bandpass-filtered between 2 s and 1,000 s�, and the east and north com-ponents of the roof displacements of the two buildings. Along with the isometric view ofthe two buildings, their deformed elevation and plan views are also illustrated. The re-designed building stays up but develops a significant kink, leading to a permanent rooftilt of about 1 m to the north. The peak drifts over the height of the two buildings areillustrated in Figure 12.
Note that the results of the north-to-south rupture could be quite different for otherslip distributions, for example, slip rising quickly to a peak value and then gradually
Figure 11. Snapshot of building deformation �scaled up by a factor of 5� immediately follow-ing the earthquake at the Northridge analysis site for a hypothetical Mw 7.9 earthquake �north-to-south rupture� on the San Andreas Fault. Also shown are the time histories of the three com-ponents of the ground velocity and displacement �bandpass-filtered between 2 s and 1,000 susing a Butterworth filter�, and the east and north components of the penthouse displacement ofthe existing and redesigned building models.
1056 S. KRISHNAN, C. JI, D. KOMATITSCH, AND J.TROMP
dropping off as in the 1857 earthquake. Directivity also plays a critical role, as seen in asouth-to-north rupture simulation of the same earthquake described in the next section.
SAN ANDREAS SIMULATION: SOUTH-TO-NORTH RUPTURE
The second scenario investigated in this study involves the rupture of the same seg-ment of the San Andreas Fault except that it proceeds from south to north instead of theother way around �with the largest amount of slip occurring further north in central Cali-fornia�. Ground shaking is far less severe in this scenario, as shown in Figure 13. Thisdemonstrates the effects of directivity and of the slip distribution in dictating the level ofground shaking and the associated damage in buildings. While the San Fernando Valley,with peak velocities and displacements of 0.6 m.s−1 and 0.6 m, respectively, still expe-riences the most shaking, Santa Monica, El Segundo, and to some extent Baldwin Parkwith peak velocities of 0.5 m.s−1 and peak displacements of 0.5 m also experience asimilar intensity of ground motion. Peak velocities and displacements are in the neigh-borhood of 0.3 m.s−1 and 0.4 m, respectively, in the remaining parts of Los Angeles andOrange counties.
The reduced level of shaking is reflected in the results of the building analyses. Thepeak drifts in the two building models are in the range of 0.02–0.04, indicating that thereis no significant danger of collapse. However, damage is still significant enough to war-rant building closures and compromise life safety in some instances. As in the case ofthe north-to-south rupture scenario, the peak interstory drifts in the middle third and bot-tom third of the existing building are greater than in the top third, which indicates that
Figure 12. Peak east-west/X �white bars� and north-south/Y�black bars� drifts in each story ofthe existing �a� and redesigned �b� building models at the Northridge analysis site. The driftscale is saturated at 0.10.

PERFORMANCE OF 18-STORY STEEL MOMENT-FRAME BUILDINGS IN SOUTHERN CALIFORNIA 1057
the damage is localized in the lower floors. The redesigned building once again outper-forms the existing building throughout the region, although by a smaller margin than forthe north-to-south rupture scenario.
CONCLUDING REMARKS
From geologic evidence it is inevitable that a large earthquake will occur on the SanAndreas Fault sooner or later. Ground-motion simulations indicate that, depending onthe rupture initiation location, propagation direction, and the slip distribution, the San
Figure 13. Ground shaking and building performance for a hypothetical Mw 7.9 earthquake�south-to-north rupture� on the San Andreas Fault: Shown are the peak ground velocity �a� anddisplacement �b� of synthetic seismograms lowpass-filtered using a Butterworth filter with acorner period of 2 s, �c� the percentage of connections in the existing building where fracturesoccur �out of 710 connections with the two ends of each moment-frame beam and column de-fined as connections�, the peak interstory drift in the top �d�, middle �e�, and bottom third �f� ofthe existing building, and the corresponding peak drifts for the new building �g, h, and i, re-spectively�. The peak drifts in existing and new buildings are in the range of 0.02–0.04, indi-cating that there is no significant danger of collapse. However, damage would still be significantenough to warrant building closures and compromise life safety in some instances.
1058 S. KRISHNAN, C. JI, D. KOMATITSCH, AND J.TROMP
Fernando Valley and the Los Angeles Basin could experience severe shaking �with peakvelocities and displacements in the 1–2 m.s−1 and 1–2 m ranges, respectively�. Analy-sis of an existing 18-story steel moment-frame building model placed at various loca-tions in southern California indicates probable collapse or very serious damage during atleast one of the two scenarios. The permanent tilt in the building is quite large at manygeographical locations, and P-� effects could jeopardize building stability during shak-ing from the strong aftershocks that usually follow the main shock. Although the newbuilding, designed according to UBC 97, performs better, damage is still serious enoughthat its performance cannot be classified as “Life Safe” at many locations in the region.Let us note that these conclusions are based on analyses of two 18-story steel moment-frame buildings and cannot be extrapolated to other buildings with different function,geometric configuration, materials, or structural systems.
The main purpose of this paper is to illustrate how seismic hazard assessment can bemade much more quantitative by considering realistic rupture scenarios on nearby faultsand subjecting specific engineered structures to the resulting ground motions. We haveillustrated that the details of a rupture scenario can have a profound effect on the result-ing ground motion, and that the rupture direction, i.e., the directivity, plays a criticalrole. Therefore, we envision a much more quantitative approach to seismic hazard as-sessment in which one constructs a detailed 3-D numerical model of an engineeredstructure, e.g., steel-frame or reinforced-concrete buildings, highway overpasses, dams,pipelines, etc., and subjects this particular engineered structure to a wide variety of geo-logically and geophysically plausible ground motions generated by earthquakes onnearby faults. The results of this collection of scenario simulations can then be used tomake well-informed engineering decisions about how to improve the ability of the struc-ture to withstand plausible strong ground motions. Of course, the band-limited nature ofthe simulated ground motion needs to be taken into account and the validity of usingthese waveforms for the specific structure under consideration needs to be ascertained.In this paper we provide a proof-of-concept for two specific steel-frame buildings sub-jected to two plausible earthquakes on the San Andreas Fault. From a practical perspec-tive, if one wanted to construct a particular building in, say, downtown Los Angeles,these would be just two of a much broader range of scenario earthquakes on a number offaults to which one would subject the engineered structure of interest. Although theanalysis in this paper illustrates the simulation of the physical phenomena of earth-quakes and building damage alone, human injuries and deaths as well as economic andfinancial losses could be part of more complete end-to-end simulations. Finally, for fu-ture studies such as this, two areas of research need attention: including the top soil layerin the Earth models and soil-structure interaction in the analyses of the structure.
ACKNOWLEDGMENTS
We wish to thank John F. Hall, Thomas Heaton, and Hiroo Kanamori of the Califor-nia Institute of Technology for their input during the course of this study, and the Earth-quake Spectra editor and reviewers for valuable comments that enhanced the article. Thenumerical simulations were performed on the Division of Geological & Planetary Sci-

PERFORMANCE OF 18-STORY STEEL MOMENT-FRAME BUILDINGS IN SOUTHERN CALIFORNIA 1059
ences Dell cluster at the California Institute of Technology and the Seawulf cluster at theUniversity of Toronto.
REFERENCES
Agnew, D. C., and Sieh, K., 1978. A documentary study of the felt effects of the great Cali-fornia earthquake of 1857, Bull. Seismol. Soc. Am. 68 �6�, 1717–1729.
American Society of Civil Engineers �ASCE�, 2000. Prestandard and Commentary for the Seis-mic Rehabilitation of Buildings, prepared for the SAC Joint Venture, published by the Fed-eral Emergency Management Agency, FEMA-356, Washington, D.C.
Anderson, J. G., Lee, Y., Zeng, Y., and Day, S. M., 1996. Control of strong motion by the upper30 meters, Bull. Seismol. Soc. Am. 86, 1749–1759.
Carlson, A., 1999. Three-dimensional Nonlinear Inelastic Analysis of Steel Moment-FrameBuildings Damaged by Earthquake Excitations, Technical Report EERL 99–02, EarthquakeEngineering Research Laboratory, California Institute of Technology, Pasadena, CA.
Clouteau, D., and Aubry, D., 2001. Modifications of the ground motion in dense urban areas, J.Comput. Acoust. 9 �4�, 1659–1675.
Darragh, R., Cao, T., Graizer, V., Shakal, A., and Huang, M., 1994. Los Angeles Code Instru-mented Building Records from the Northridge, California Earthquake of January 17 1994:Processed Release No. 1, Technical Report OSMS 94–17, California Strong Motion Instru-mentation Program, California Department of Conservation, Division of Mines and Geology�now California Geological Survey�, Sacramento, CA.
El-Tawil, S., and Deierlein, G. G., 1996. Inelastic Dynamic Analysis of Mixed Steel-ConcreteSpace Frames, Technical Report Structural Engineering 96–05, Cornell University, Ithaca,NY.
Fenves, G. L., and Serino, G., 1990. Soil-structure interaction in buildings from earthquakerecords, Earthquake Spectra 6 �4�, 641–655.
Filippou, F., and Romero, M. L., 1998. Nonlinear and dynamic analysis from research to prac-tice, in N. K. Srivatsava �editor�, Structural Engineering World Wide 1998, pp. T101–3.Elsevier Science Ltd., New York.
Graves, R. W., 1998. Three-dimensional finite-difference modeling of the San Andreas Fault:Source parameterization and ground-motion levels, Bull. Seismol. Soc. Am. 88 �4�, 881–897.
Hall, J. F., 1998. Seismic response of steel frame buildings to near-source ground motions,Earthquake Eng. Struct. Dyn. 27, 1445–1464.
Hall, J., Heaton, T., Halling, M., and Wald, D., 1995. Near-source ground motion and its effectson flexible buildings, Earthquake Spectra 11 �4�, 569–605.
Haskell, N. A., 1960. Crustal reflection of plane SH waves, J. Geophys. Res. 4147–4150.Heaton, T., Hall, J., Wald, D., and Halling, M., 1995. Response of high-rise and base-isolated
buildings to a hypothetical Mw 7.0 blind thrust earthquake, Science 267, 206–211.International Conference of Building Officials �ICBO�, 1982. 1982 Uniform Building Code,
Volume 2, Whittier, CA.———, 1997. 1997 Uniform Building Code, Volume 2, Whittier, CA.Ji, C., Tan, Y., Helmberger, D., and Tromp, J., 2003. Modeling teleseismic P and SH static off-
sets for great strike-slip earthquakes, in Proceedings of the American Geophysical UnionFall Meeting.

1060 S. KRISHNAN, C. JI, D. KOMATITSCH, AND J.TROMP
Kohler, M., Magistrale, H., and Clayton, R., 2003. Mantle heterogeneities and the SCEC three-dimensional seismic velocity model version 3, Bull. Seismol. Soc. Am. 93, 757–774.
Komatitsch, D., and Tromp, J., 1999. Introduction to the spectral element method for three-dimensional seismic wave propagation, Geophys. J. Int. 139, 806–822.
Komatitsch, D., Liu, Q., Tromp, J., Süss, P., Stidham, C., and Shaw, J. H., 2004. Simulations ofground motion in the Los Angeles Basin based upon the spectral element method, Bull. Seis-mol. Soc. Am. 94, 187–206.
Krishnan, S., 2003a. FRAME3D—A Program for Three-dimensional Nonlinear Time-HistoryAnalysis of Steel Buildings: User Guide, Technical Report EERL 2003–03, Earthquake En-gineering Research Laboratory, California Institute of Technology, Pasadena, CA.
Krishnan, S., 2003b. Three-dimensional Nonlinear Analysis of Tall Irregular Steel BuildingsSubject to Strong Ground Motion, Technical Report EERL 2003–01, Earthquake Engineer-ing Research Laboratory, California Institute of Technology, Pasadena, CA.
Krishnan, S., Ji, C., Komatitsch, D., and Tromp, J., 2005. Performance of 18-story SteelMoment-Frame Buildings during a Large San Andreas Earthquake—A Southern California-wide End-to-end Simulation, Technical Report EERL 2005–01, Earthquake Engineering Re-search Laboratory, California Institute of Technology, Pasadena, CA.
Krishnan, S., and Hall, J. F., 2006a. Modeling steel frame buildings in three dimensions—PartI: Panel zone and plastic hinge beam elements, J. Eng. Mech. 132 �4�, 345–358.
Krishnan, S., and Hall, J. F., 2006b. Modeling steel frame buildings in three dimensions—PartII: Elastofiber beam element and examples, J. Eng. Mech. 132 �4�, 359–374.
Kunnath, S. K., 1995. Enhancements to Program IDARC: Modeling Inelastic Behavior ofWelded Connections in Steel Moment-Resisting Frames, Technical Report NIST GCR 95–673, Building and Fire Research Laboratory, National Institute of Standards and Technology,Gaithersburg, MD.
Liu, Q., Polet, J., Komatitsch, D., and Tromp, J., 2004. Spectral-element moment tensor inver-sions for earthquakes in southern California, Bull. Seismol. Soc. Am. 94 �5�, 1748–1761.
Lobo, R., 1994. IDARC3D: Inelastic Damage Analysis of Reinforced Concrete Structures inThree Dimensions, Technical report, National Center for Earthquake Engineering Research,University at Buffalo, State University of New York, Buffalo.
Lobo, R. F., Skokan, M. J., Huang, S. C., and Hart, G. C., 1998. Three-dimensional analysis ofa 13-story steel building with weld connection damage, in N. K. Srivatsava �editor�, Struc-tural Engineering World Wide 1998, pp. T114–2, Elsevier Science Ltd., New York.
Magistrale, H., McLaughlin, K., and Day, S., 1996. A geology based 3-D velocity model of theLos Angeles Basin sediments, Bull. Seismol. Soc. Am. 86, 1161–1166.
Magistrale, H., Day, S., Clayton, R., and Graves, R., 2000. The SCEC southern California ref-erence three-dimensional seismic velocity model version 2, Bull. Seismol. Soc. Am. 90 �6B�,S65–S76.
Mazzoni, S., McKenna, F., and Fenves, G. L., 2005. OpenSees Command Language Manual,Pacific Earthquake Engineering Research �PEER� Center, University of California, Berkeley.http://opensees.berkeley.edu
Meltzner, A. J., and Wald, D. J., 1998. Foreshocks and Aftershocks of the Great 1857 CaliforniaEarthquake, USGS Open-File Rep. 98–465, Pasadena, CA.
Olsen, K. B., Archuleta, R. J., and Matarese, J. R., 1995. Three dimensional simulation of amagnitude 7.75 earthquake on the San Andreas Fault, Science 270, 1628–1632.
PERFORMANCE OF 18-STORY STEEL MOMENT-FRAME BUILDINGS IN SOUTHERN CALIFORNIA 1061
Powell, G. H., and Campbell, S., 1994. DRAIN-3DX Element Description and User Guide forElement Type01, Type05, Type08, Type09, Type15, and Type17, Technical Report UCB/SEMM-94/08, Structural Engineering Mechanics and Materials, University of California,Berkeley.
Prakash, V., Powell, G. H., and Campbell, S., 1994. DRAIN-3DX Base Program Descriptionand User Guide, Version 1.10, Technical Report UCB/SEMM-94/07, Structural EngineeringMechanics and Materials, University of California, Berkeley.
SAC Joint Venture, 1995a. Analytical and Field Investigations of Buildings Affected by theNorthridge Earthquake of January 17, 1994—Part 1, Technical Report SAC 95–04, Part 1,Structural Engineers Association of California, Applied Technology Council, and CaliforniaUniversities for Research in Earthquake Engineering.
———, 1995b. Analytical and Field Investigations of Buildings Affected by the NorthridgeEarthquake of January 17, 1994—Part 2, Technical Report SAC 95–04, Part 2, StructuralEngineers Association of California, Applied Technology Council, and California Universi-ties for Research in Earthquake Engineering.
———, 1995c. Surveys and Assessments of Damage to Buildings Affected by the NorthridgeEarthquake of January 17, 1994, Technical Report SAC 95–06, Structural Engineers Asso-ciation of California, Applied Technology Council, and California Universities for Researchin Earthquake Engineering.
———, 2000a. Recommended Seismic Design Criteria for New Steel Moment-Frame Build-ings, prepared for the Federal Emergency Management Agency, FEMA-350, Washington,D.C.
———, 2000b. Recommended Specifications and Quality Assurance Guidelines for SteelMoment-Frame Construction for Seismic Applications, prepared for the Federal EmergencyManagement Agency, FEMA-353, Washington, D.C.
Serino, G., 1989. Dynamic Soil-Structure Interaction in Building Response from EarthquakeRecords, Technical Report UCB/SEMM-1989/01, Department of Civil Engineering, Univer-sity of California, Berkeley.
Sieh, K. E., 1978. Slip along the San Andreas Fault associated with the great 1857 earthquake,Bull. Seismol. Soc. Am. 68 �5�, 1421–1448.
Stewart, J. P., Seed, R. B., and Fenves, G. L., 1998. Empirical Evaluation of Inertial Soil-Structure Interaction Effects, Technical Report PEER-98/07, Pacific Earthquake EngineeringCenter, University of California, Berkeley.
Süss, M. P., and Shaw, J. H., 2003. P-wave seismic velocity structure derived from sonic logsand industry reflection data in the Los Angeles Basin, J. Geophys. Res. 108 �B3� Article no.2170.
Trifunac, M., Todorovska, M., and Hao, T., 2001a. Full-scale experimental studies of soil-structure interaction—A review, in Proceedings of the Second U. S.-Japan Workshop on Soil-Structure Interaction, Tsukuba City, Japan, 52 pp. �CD-ROM�.
Trifunac, M., Hao, T., and Todorovska, M., 2001b. Response of a 14-story Reinforced ConcreteStructure to Nine Earthquakes: 61 Years of Observation in the Hollywood Storage Building,Technical Report CE 01–02, Department of Civil Engineering, University of Southern Cali-fornia, Los Angeles.
Weldon, R. J., Fumal, T. E., Biasi, G. P., and Scharer, K. M., 2005. Past and future earthquakeson the San Andreas Fault, Science 308, 966–967.
�Received 5 August 2005; accepted 10 February 2006�