performance of small-scale …ageconsearch.umn.edu/bitstream/196766/2/islam and islam.pdfperformance...
TRANSCRIPT
Bangladesh J. Agric. Econs. XXXV, 1&2(2012) 91-113
PERFORMANCE OF SMALL-SCALE PARTICIPATORY WATER PROJECTS – AN ECONOMETRIC ANALYSIS OF
IMPACT ON INCOME AND ASSETS
K M Nabiul Islam 1 Md Nazrul Islam 2
Abstract
The small-scale water resources development projects, constructed by Local Government Engineering Department in Bangladesh are designed as participatory at all stages of planning, designing, implementation and maintenance. An econometric modeling exercise is carried out to assess the economic effects of such interventions, to ascertain how far the beneficiaries were able to reap benefits. The results show that such interventions had substantial positive impacts on income and asset for the beneficiary households, although the non-poor households have benefited more. However, some autonomous growth resulting from factors such as switch to HYV varieties and increased use of inputs due to lower perceived risk of crop failure or reduced losses due to flooding may also have some contribution to these incremental benefits. One is also tempted to suggest that beneficiary participation in all project cycles might have positively contributed to performance of the projects. The performances of the ten subprojects and the ten water management cooperative associations (WMCAs) under study were evaluated through multi-criteria analysis. The significant positive rank correlation of the performance between the subprojects and the WMCAs leads to the conclusion that the performance of the SPs is highly dependent on the performance of the WMCAs. Hence, efforts should be made to improve the performance of the WMCAs through improved operation and maintenance in order to ensure the sustainability of the projects and also avoid their costly rehabilitation in the future.
1 Senior Research Fellow, Bangladesh institute of Development Studies. This article draws on a Benefit Monitoring Study of LGED’s Small Scale Water Resources Development Sector Project (SSWRD) where the first author was involved as the Team Leader (Islam et al 2009: Impact Evaluation Study Report, BIDS). He was also individually responsible for, among others, this part of the analysis, apart from the study report, as a whole. The authors wish to acknowledge the contribution of the Team Members, particularly Dr Quazi Shahabuddin and Mirza M Shafiqur Rahman for their valuable feedback on an earlier draft of this paper. The authors also wish to acknowledge the valuable comments of anonymous referees on an earlier version of this paper. However, the authors are fully responsible for the views expressed and for any remaining errors or shortcomings in the paper.
2 Research Officer, BIDS
The Bangladesh Journal of Agricultural Economics
92
I. INTRODUCTION
Common property resources (e.g. open access water bodies) and public infrastructure (e.g. polders, embankments and regulators to control water flows) are often used generously by people in Bangladesh. However, not only the operation and maintenance of such infrastructures has largely been ignored, but also the facilities created have most often been uneven and problematic. One way to resolve the problem is to create property rights on such resources and facilities. In other words, establishing property rights and ownership on them for the community is a possible means to operate and maintain them so as to put them to proper use and they do not degrade as usually the case with unrestrained use of common property resources. The important question is how to create such property rights and ownership. Formation of water management associations is one option towards this end. Operation and maintenance, a crucial element of project cycle, is considered to be properly addressed through formation of such associations. Over the years, participatory water management received emphasis under the water sector reform programme and National Water Management Plan with major focus on institutional arrangements aiming at improving capacities and efficiencies of water sector institutions and facilitating participation of stakeholders and water management associations (WMAs). In this backdrop, the Local Government Engineering Department (LGED) suggests that the community needs to be involved in the process from the very beginning of project cycle, up to the actual project implementation. Thus, LGED initiated a model with small scale water interventions under Small Scale Water Resources Development (SSWRD-1) Project (Phase 1) in the late 1990s, focusing on a participatory project framework (log frame) ensuring sustainable operation and maintenance through forming Water Management Cooperative Associations (WMCAs). The model is designed such that participation of beneficiaries is ensured from the very inception stage through planning, designing, construction and O & M of the project cycle. Under the model, the WMCAs receive the project infrastructure, which includes the actual water bodies and other LGED-constructed infrastructure on lease for a 20-year period. After the hand over, the WMCAs have the sole legal right to use, operate and maintain the infrastructure for day-to-day management of water for various kinds of water-using activities including cultivation and fisheries. The LGED initiated this model and implemented 280 small water resources management subprojects under its Small Scale Water Resources Development Sector Project (SSWRDSP-1) during 1996-2002. The main purpose of the subprojects, benefiting a net area of up to 1,000 hectares, was to improve water management, flood management, drainage improvement, water conservation and command area development.
Performance of Small-scale Participatory water projects – An econometric Analysis of impact
93
Now, the research question is whether such subprojects have created positive impacts in terms of expected increased production in agriculture and fishery through better water and flood management. More specifically, the paper aims to examine the performance of the subprojects in terms of income and employment of the beneficiaries and whether they have contributed to an overall reduction in poverty. To this end, an econometric modeling exercise is carried out to assess the economic effects of such interventions, to ascertain how far and who were the beneficiaries reaping benefits. This paper has been organized in four sections. Started with a brief introduction outlining evolution of participatory water intervention projects in Section 1, Section 2 presents the methodology of SSWRD-1 Impact Study on which this article is based. Section 3 presents an analysis, based on perceptions of the beneficiaries, of the impact on water and flood management due to LGED water interventions. The performance of the subprojects in respect to changes in water and flood management including status of the subprojects, operation and maintenance and institutional aspects has also been discussed in this Section. Finally, Section 4 presents analyses on economic effects of LGED water interventions through carrying out econometric modeling. In order to determine how far the poor farmers were able to reap benefits from the SSWRDSP-I subprojects an analysis of differential impacts by income levels was also carried out. The section also contains an analysis aiming at assessing the overall performance of the subprojects and WMCAs through multi-criteria analyses. The paper ends with concluding remarks presented in Section 5.
II. METHODOLOGY OF SSWRD-1 IMPACT STUDY
In 2009, BIDS carried out a Benefit Monitoring and Evaluation (BME) Study to examine the performance of the subprojects, through covering 10 subprojects (SP) of SSWRDSP-1, for which a baseline study was carried out by LGED in 2002 (Islam et al 2009) (The list of ten subprojects presented in Table 1). The study assessed impacts of the subprojects on various aspects related to socio-economic (e.g. income and employment), agriculture (e.g. crop productivity) and water management (e.g. irrigation and drainage facility). This paper is based on that study (Table 1).
The methodology involved collection of data through adopting a ‘project’ (two villages) and ‘control’ area (one village) approach. Data were collected in five modules from households categorized by land-holding size (according to ownership) in 30 villages in total (3 villages from each subproject). The total number of households interviewed was 700. Using a pre-tested structured questionnaire, the selected households were interviewed to generate data on the impact indicators. Ssystematic random sampling procedure was adopted for the selection of the households. This involved choosing every k-th subsequent unit after the first sample was chosen at random,
The Bangladesh Journal of Agricultural Economics
94
where k= N/n, N = population size, n = sample size. The procedure with a random start was adopted for all the individual categories of households, without replacement. Table 1. LGED water intervention subprojects under study Name of Subproject (SP)
Location Type of SP
1. Jetua-Kanaidia Satkhira Flood Control & Drainage (FCD) 2 Rajapur Patilapara Patuakhali Flood Control & Drainage (FCD) 3. Raufkhali Chuadanga Flood Control & Drainage (FCD) 4. Puthia-Falia Sirajganj Flood Control & Drainage (FCD) 5. Char Bhurungamari Kurigram Flood Control & Drainage (FCD) 6. Ramkrishnapur Gopalganj Drainage (DR) 7. Rajapur Jhalakathi Drainage (DR) 8. Banderpara Chatra Beel Rangpur Water Conservation (WC) 9. Barung River Panchagarh Water Conservation (WC) 10.Akhaira-Saidpur Khal Noagaon Drainage (DR) & Water Conservation (WC)
Econometric modeling of household incomes The provision of water management facilities in rural areas was one of the major features of LGED’s water management infrastructure development. Finally, therefore, econometric modeling was carried out to determine the likely impact of water management interventions on household incomes, assets and poverty, by using the information available from the household surveys. Multivariate regression model was also estimated to determine what could be the impact of the subprojects on different groups of household, classified by poverty levels. Finally, multi-criteria analysis was carried out to assess the overall performance of both the subprojects and WMCAs, which also allowed to testing whether the performance of the former depended on that of the latter. The very SSWRDSP model hypothesizes that the sustainability of the subprojects is largely dependent on the satisfactory performance of the WMCAs and the performance of the WMCAs depends on their operation and maintenance activities. Hence, this paper first focused on the issues related to the institutions and sustainability of the subprojects and their operation and maintenance activities. It discusses, among others, changes in land and inundation levels, changes in irrigation, water regime and drainage facilities, employment generation and benefits accrued to the farmers. Besides, it sheds light on constraints of WMCA development, focusing on implications towards their better performance in the future3.
Performance of Small-scale Participatory water projects – An econometric Analysis of impact
95
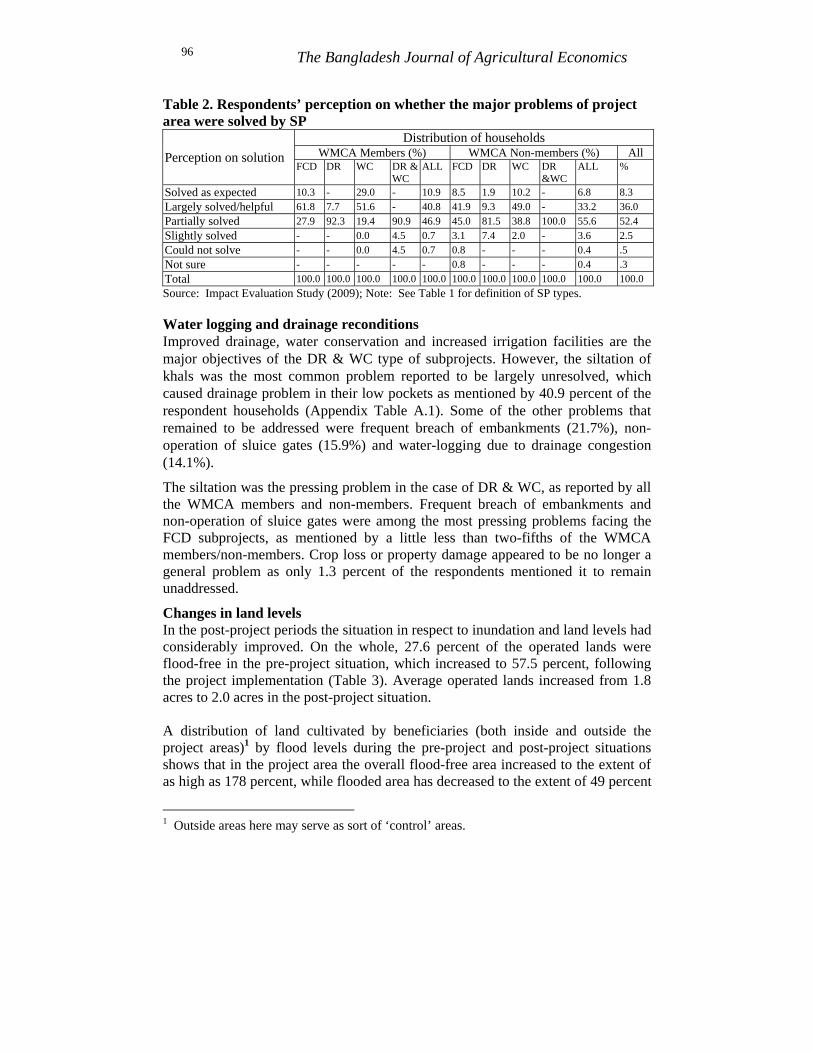
The information in relation to some performance criteria for SPs and WMCAs (See Tables 10 and 11) were obtained from two major sources: household survey and interviews with WMCA officials. Some of the findings of the household survey are presented with respect to WMCA members and non-members while some are presented with respect to subprojects so as to highlight differential impacts caused by different types of subprojects. Limitations of data from the benchmark study The impact study, on which this paper is based, encountered a number of data problems. A major problem was related to the benchmark study conducted nearly six years ago. The major limitation of the benchmark study was that it did not adopt any control area approach. Consequently, there was no alternative but to assess the effects of the subproject by interviewing households for pre- and post-project situations, by collecting data virtually at one point in time for both project and control areas 4, obviously at the risk of some recall problems. 3. Impact on water and flood management Before any rigorous analysis is undertaken on the performance of the small-scale participatory water projects through an econometric analysis of impact on income and assets, we first present the performance in respect to changes in water management due to the SSWRDSP-1 interventions as perceived by beneficiaries. Water problems and their solution: Perception of beneficiaries In fact, the major reasons for constructing the subprojects were incidence of crop losses, drainage congestion, lack of irrigation facilities, flooding and property losses. Regarding whether the problems were resolved satisfactorily, only a few respondents (3.3%) mentioned the problems to have been slightly solved or not solved at all, while over half (52.4%) of them mentioned that the problems were only partially solved (Table 2). However, around 44.3 percent of the respondents thought that the problems have largely been solved or have been solved as expected. All these imply that there were some problems that still remained. Field investigations generally indicate that the formation of WMCAs or the handover of the subprojects has been delayed due to, among others, the delay in construction (not shown here). In such cases, the problems were unlikely to be resolved satisfactorily in some places. Additionally, the performance of the WMCAs, in terms of maintenance, was found to be not satisfactory in a number of cases (Appendix Tables A.3 and A.4).
The Bangladesh Journal of Agricultural Economics
96
Table 2. Respondents’ perception on whether the major problems of project area were solved by SP
Perception on solution Distribution of households
WMCA Members (%) WMCA Non-members (%) All FCD DR WC DR &
WC ALL FCD DR WC DR
&WC ALL %
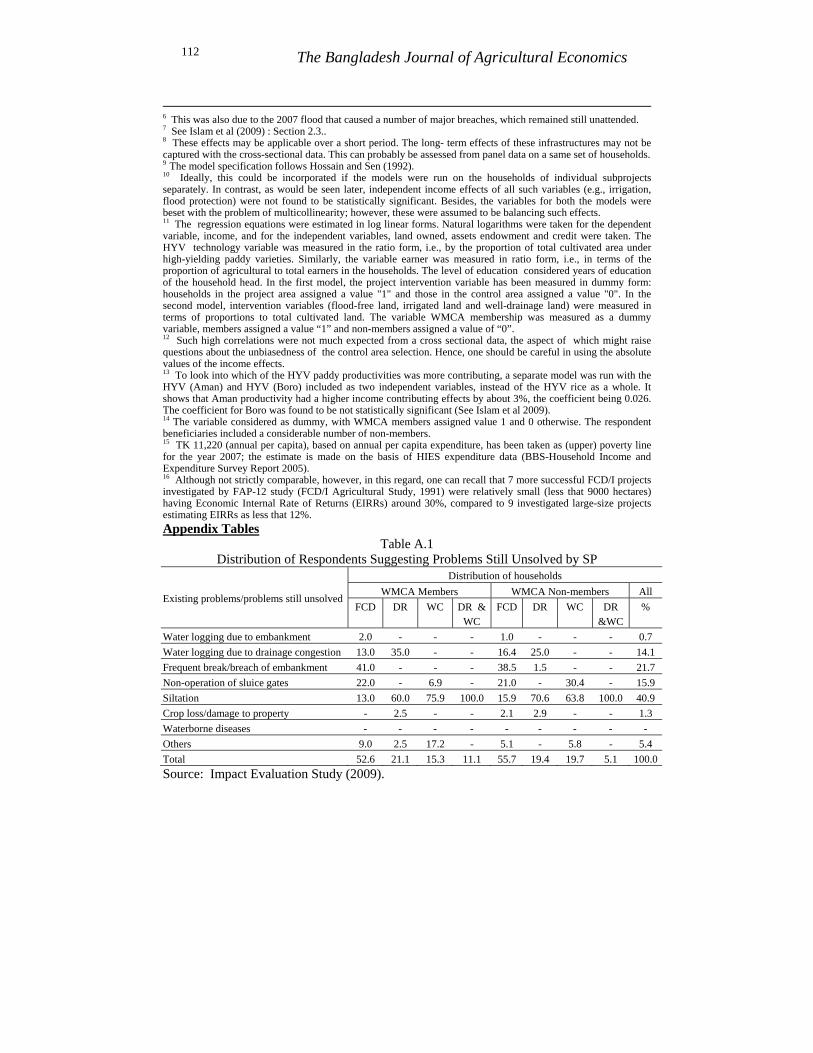
Solved as expected 10.3 - 29.0 - 10.9 8.5 1.9 10.2 - 6.8 8.3 Largely solved/helpful 61.8 7.7 51.6 - 40.8 41.9 9.3 49.0 - 33.2 36.0 Partially solved 27.9 92.3 19.4 90.9 46.9 45.0 81.5 38.8 100.0 55.6 52.4 Slightly solved - - 0.0 4.5 0.7 3.1 7.4 2.0 - 3.6 2.5 Could not solve - - 0.0 4.5 0.7 0.8 - - - 0.4 .5 Not sure - - - - - 0.8 - - - 0.4 .3 Total 100.0 100.0 100.0 100.0 100.0 100.0 100.0 100.0 100.0 100.0 100.0 Source: Impact Evaluation Study (2009); Note: See Table 1 for definition of SP types. Water logging and drainage reconditions Improved drainage, water conservation and increased irrigation facilities are the major objectives of the DR & WC type of subprojects. However, the siltation of khals was the most common problem reported to be largely unresolved, which caused drainage problem in their low pockets as mentioned by 40.9 percent of the respondent households (Appendix Table A.1). Some of the other problems that remained to be addressed were frequent breach of embankments (21.7%), non-operation of sluice gates (15.9%) and water-logging due to drainage congestion (14.1%).
The siltation was the pressing problem in the case of DR & WC, as reported by all the WMCA members and non-members. Frequent breach of embankments and non-operation of sluice gates were among the most pressing problems facing the FCD subprojects, as mentioned by a little less than two-fifths of the WMCA members/non-members. Crop loss or property damage appeared to be no longer a general problem as only 1.3 percent of the respondents mentioned it to remain unaddressed.
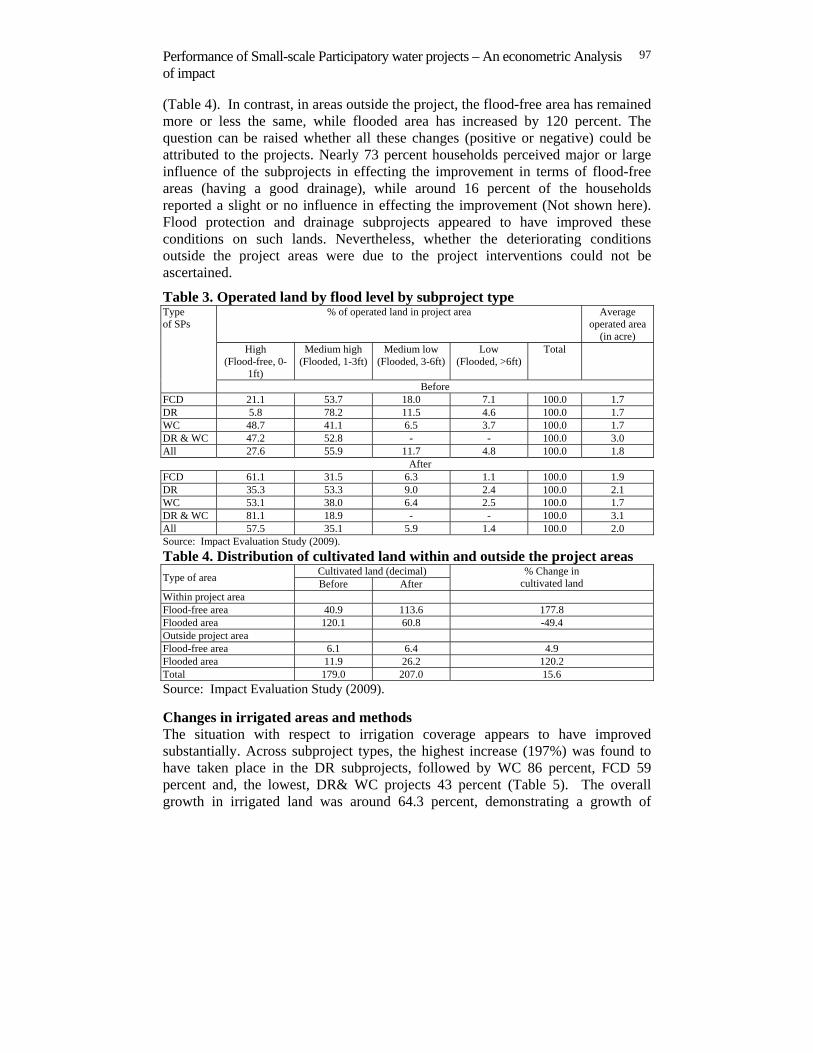
Changes in land levels In the post-project periods the situation in respect to inundation and land levels had considerably improved. On the whole, 27.6 percent of the operated lands were flood-free in the pre-project situation, which increased to 57.5 percent, following the project implementation (Table 3). Average operated lands increased from 1.8 acres to 2.0 acres in the post-project situation. A distribution of land cultivated by beneficiaries (both inside and outside the project areas)1 by flood levels during the pre-project and post-project situations shows that in the project area the overall flood-free area increased to the extent of as high as 178 percent, while flooded area has decreased to the extent of 49 percent
1 Outside areas here may serve as sort of ‘control’ areas.
Performance of Small-scale Participatory water projects – An econometric Analysis of impact
97
(Table 4). In contrast, in areas outside the project, the flood-free area has remained more or less the same, while flooded area has increased by 120 percent. The question can be raised whether all these changes (positive or negative) could be attributed to the projects. Nearly 73 percent households perceived major or large influence of the subprojects in effecting the improvement in terms of flood-free areas (having a good drainage), while around 16 percent of the households reported a slight or no influence in effecting the improvement (Not shown here). Flood protection and drainage subprojects appeared to have improved these conditions on such lands. Nevertheless, whether the deteriorating conditions outside the project areas were due to the project interventions could not be ascertained.
Table 3. Operated land by flood level by subproject type Type of SPs
% of operated land in project area Average operated area
(in acre) High
(Flood-free, 0-1ft)
Medium high (Flooded, 1-3ft)
Medium low (Flooded, 3-6ft)
Low (Flooded, >6ft)
Total
Before FCD 21.1 53.7 18.0 7.1 100.0 1.7 DR 5.8 78.2 11.5 4.6 100.0 1.7 WC 48.7 41.1 6.5 3.7 100.0 1.7 DR & WC 47.2 52.8 - - 100.0 3.0 All 27.6 55.9 11.7 4.8 100.0 1.8
After FCD 61.1 31.5 6.3 1.1 100.0 1.9 DR 35.3 53.3 9.0 2.4 100.0 2.1 WC 53.1 38.0 6.4 2.5 100.0 1.7 DR & WC 81.1 18.9 - - 100.0 3.1 All 57.5 35.1 5.9 1.4 100.0 2.0 Source: Impact Evaluation Study (2009). Table 4. Distribution of cultivated land within and outside the project areas Type of area Cultivated land (decimal) % Change in
cultivated land Before After Within project area Flood-free area 40.9 113.6 177.8 Flooded area 120.1 60.8 -49.4 Outside project area Flood-free area 6.1 6.4 4.9 Flooded area 11.9 26.2 120.2 Total 179.0 207.0 15.6 Source: Impact Evaluation Study (2009). Changes in irrigated areas and methods The situation with respect to irrigation coverage appears to have improved substantially. Across subproject types, the highest increase (197%) was found to have taken place in the DR subprojects, followed by WC 86 percent, FCD 59 percent and, the lowest, DR& WC projects 43 percent (Table 5). The overall growth in irrigated land was around 64.3 percent, demonstrating a growth of
The Bangladesh Journal of Agricultural Economics
98
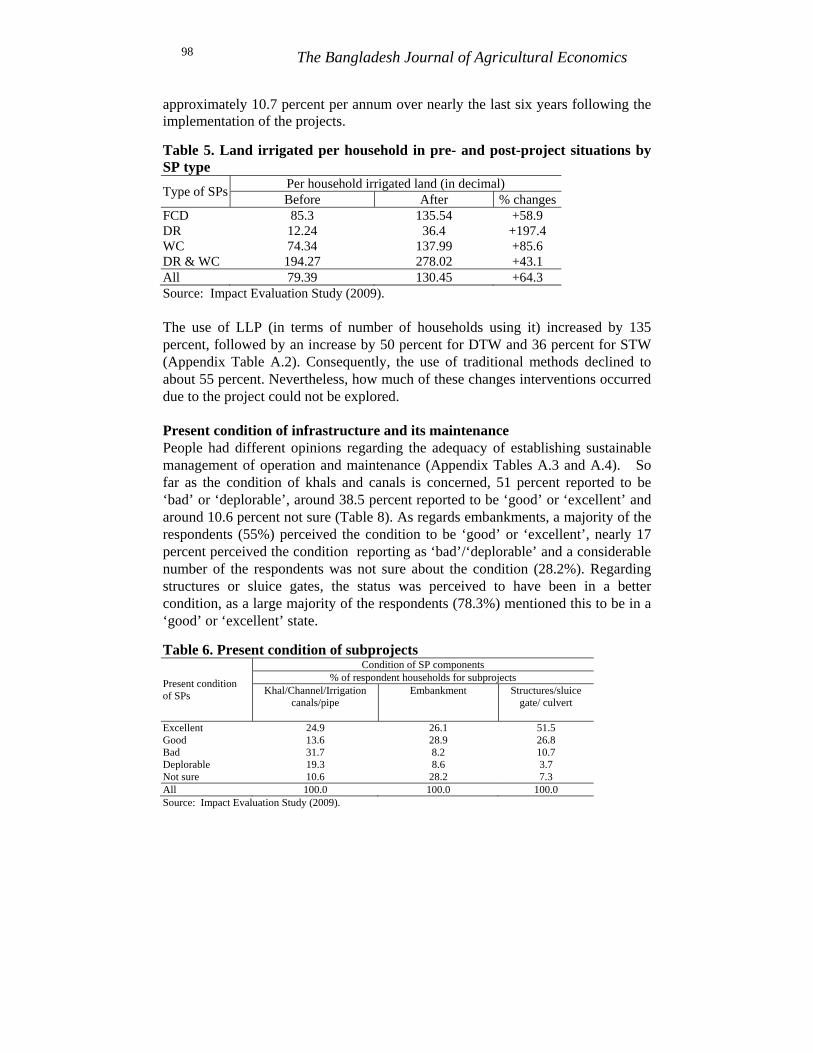
approximately 10.7 percent per annum over nearly the last six years following the implementation of the projects. Table 5. Land irrigated per household in pre- and post-project situations by SP type
Type of SPs Per household irrigated land (in decimal) Before After % changes
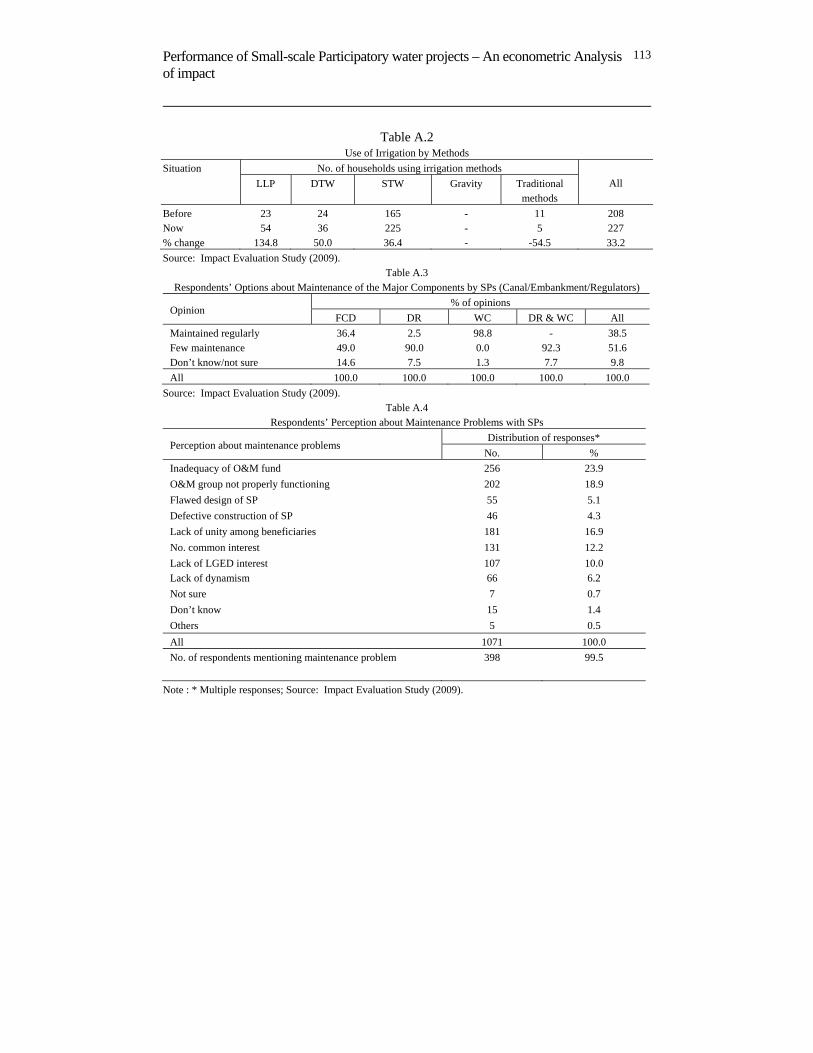
FCD 85.3 135.54 +58.9 DR 12.24 36.4 +197.4 WC 74.34 137.99 +85.6 DR & WC 194.27 278.02 +43.1 All 79.39 130.45 +64.3 Source: Impact Evaluation Study (2009). The use of LLP (in terms of number of households using it) increased by 135 percent, followed by an increase by 50 percent for DTW and 36 percent for STW (Appendix Table A.2). Consequently, the use of traditional methods declined to about 55 percent. Nevertheless, how much of these changes interventions occurred due to the project could not be explored. Present condition of infrastructure and its maintenance People had different opinions regarding the adequacy of establishing sustainable management of operation and maintenance (Appendix Tables A.3 and A.4). So far as the condition of khals and canals is concerned, 51 percent reported to be ‘bad’ or ‘deplorable’, around 38.5 percent reported to be ‘good’ or ‘excellent’ and around 10.6 percent not sure (Table 8). As regards embankments, a majority of the respondents (55%) perceived the condition to be ‘good’ or ‘excellent’, nearly 17 percent perceived the condition reporting as ‘bad’/‘deplorable’ and a considerable number of the respondents was not sure about the condition (28.2%). Regarding structures or sluice gates, the status was perceived to have been in a better condition, as a large majority of the respondents (78.3%) mentioned this to be in a ‘good’ or ‘excellent’ state. Table 6. Present condition of subprojects
Present condition of SPs
Condition of SP components % of respondent households for subprojects
Khal/Channel/Irrigation canals/pipe
Embankment
Structures/sluice gate/ culvert
Excellent 24.9 26.1 51.5 Good 13.6 28.9 26.8 Bad 31.7 8.2 10.7 Deplorable 19.3 8.6 3.7 Not sure 10.6 28.2 7.3 All 100.0 100.0 100.0 Source: Impact Evaluation Study (2009).
Performance of Small-scale Participatory water projects – An econometric Analysis of impact
99
Obviously, operation and maintenance has a large bearing on the conditions of the project infrastructures. (Appendix Tables A.3 and A.4). Over half of the respondents (52%) reported that there had been hardly any maintenance. Regular maintenance activities were carried out largely for the WC subprojects while there were hardly any maintenance activities in the case of DR & WC subprojects and DR subprojects. Field investigations clearly show that O&M had not developed to its desired level of performance due to many reasons5. The reasons in most cases are not easy to explain. In general, lack of motivation of the local beneficiaries can be considered to be the main cause of its under-performance. Some of the subprojects were found utterly dysfunctional reportedly due to erroneous design or construction faults (e.g., Barung River WC in Panchagar). In some cases, the subprojects were nearly dysfunctional due to lack of maintenance (e.g., Char Buringamari FCD)6. In many cases, the WMCAs were reluctant in maintenance job presumably because of their understanding that at some later stage, the government or the LGED would take up the job of rehabilitation. In most cases, beneficiaries also showed little interest in assuming responsibility for maintenance. Perceived problems of maintenance WMCAs were specifically established to (a) conduct routine operation of the structures and necessary maintenance works, with resources generated from among the members, and (b) plan for O & M for the future. Most subprojects encountered some maintenance problems, most of which were not difficult to have been addressed. These are O&M fund inadequacy, O&M group being non-functioning, lack of dynamism on the part of the WMCA or lack of unity/common interest on the part of the beneficiaries. Some of the problems, however, were related to subproject design or its defective construction or lack of long-term planning associated with potential changes in the future water regime. Involvement of beneficiaries in the participatory process The basic approach of the subprojects was that the initiation, identification, designing, construction and O & M activities should be participatory with the local beneficiaries involved in various capacities. By and large, the beneficiaries had participated in a moderate way in the activities of the WMCAs, but largely during the identification phase only. The field investigations generally reveal that the participation of the beneficiaries in the O & M and post-construction phases has been constrained by two factors. First, not all of them could benefit equally, as many lacked land in the project areas to directly derive the benefit. Secondly, the WMCAs being largely operated by the rural affluent people seemed to have prevented fuller participation of the general people. It was gathered that the rules
The Bangladesh Journal of Agricultural Economics
100
for general membership and managing committee membership were largely not broad-based.
ECONOMIC EFFECTS OF SSWRDSP-I INTERVENTION The impact assessment of SSWRDSP-I interventions on economic variables is a formidable task because of multiple ongoing programmes along with those of water management infrastructures in a particular area. Segregating the impacts poses a particular challenge in that the SSWRDSP-I interventions involve a small area (comprising only up to 1000 hectares) in the local economy. Attempts have, however, been made to capture the impact of water interventions by carrying out an econometric modeling exercise. The primary project objective of ensuring benefits to poor farmers has been kept in perspective while carrying out the analysis. The economic variables considered are income and asset of the project beneficiaries. Impact on household income and assets: a multi-variate econometric
analysis The analytical framework The provision of water management facilities in rural areas is one of the major features of LGED’s infrastructure development in recent years. The villagers’ access to this facility has grown rapidly over the last decade. The question is what we can infer about the likely impact of such water management interventions on household income and assets. In rural Bangladesh, where agriculture is still the pre-dominant activity, the impact of water infrastructure such as flood protection, drainage and irrigation development may immediately lead to higher adoption of modern high yielding variety (HYV) technology through the provision of increased irrigation facilities, and thereby enhance production and income. However, the increased adoption of modern technology is likely to result in unequal income distribution among the poor and non-poor, as these are relatively cash intensive in nature, compared to traditional varieties. The interventions such as embankments leading to decreased crop losses (and thereby increased productivity) generally lead to expanded non-farm activities (e.g., processing industries and small enterprises). As was evident from the preceding sections, the management of small-scale water infrastructures under study was generally dominated by local elites and affluent farmers. Hence, it is likely to have greater economic impacts on those with higher incomes (having access to such facilities) than on the average poor who might not be able to reap the full advantage of the created water facilities. All these aspects discussed above would be kept in perspective in the analysis that follows.
Performance of Small-scale Participatory water projects – An econometric Analysis of impact
101
The analysis is carried out to capture the aggregate impact on household income and asset using the information available from the household surveys carried out under the present study. Household’s income and asset The average household income (farm income) and value of assets in the project area (with interventions) were respectively 22.3 and 30.6 percent higher than those in the control villages (having no such interventions)7. Not all of these differences, however, were attributable to the effect of the concerned subprojects. Considerable differences were evident among the households, located in two different sets of study villages, in terms of initial resource endowment as well as the level of development due to other infrastructures. In order to segregate the influence of the "other" factors, a household income (or asset) determination model has been estimated, using household level data to analyse the determinants of income and assets8. The household income (assets) determination model 9 The income (or asset) determination model is described as follows. Two models have been estimated using two sets of data (Table 7). First, the farm income of a household is expected to primarily depend on land owned (LAND), asset endowment (ASSET), credit/loans received (CREDIT), cropping intensity (INTNSTY) and the number of earning members (proxied here by the number of agriculture earners) (ERNER). The income of households is also likely to be positively correlated with the productivity of land, proxied by the proportion of area allocated to the cultivation of high yielding varieties of crops (HYV). The productivity of land and occupation choice may also vary according to the level of education (proxied here by years of education of household head) (EDUC). The first model (Model 1) along with the corresponding set of results refers to entire samples comprising both the project and control areas (combined), while the second model (Model 2) along with the corresponding set of results refers to that of the project area only; the only major difference was that the second model incorporates an additional set of variables, called intervention variables (Table 7). Such variables include proportion of flood-free land (FLDFREE), proportion of irrigated land (IRRIG), proportion of well-drainage type of land (DRAIN) and WMCA membership (WMCA) (taken as dummy variable, with members assigned as 1 and 0 otherwise). It may be recalled that the projects under study were of several types (e.g., Flood Control, Irrigation and Drainage) in disproportionately unequal numbers, and hence benefits of the households from flood protection, irrigation and drainage in the entire sample have a skewed distribution10. Finally, an important instrumental variable is the “Project intervention” variable, a dummy variable defined as beneficiary households living in project area as 1, and
The Bangladesh Journal of Agricultural Economics
102
control areas as zero. The project intervention is likely to make positive difference to the overall income-earning environment.
III. DISCUSSION OF RESULTS
Two sets of information were considered for the two models, the former including the entire sample (combining project and control areas households), and the latter considering only the project area households, which, of course, included, as already mentioned, a number of additional intervention variables, such as those related to irrigation, flood protection, drainage and WMCA membership (Table 7)11. It can be seen that both the models fitted extremely well, indicated by high value of R2s (adjusted), 0.69 and 0.71 respectively, which were found to be highly significant12. Interestingly, almost all the independent variables have shown statistical significance, at more than 99 percent level for all but two variables. In the first model, the variable CREDIT was significant at more than 95 percent level. As expected, the variable of landownership (LAND) was an important determinant of income in the study areas. Its independent effect was quite substantial as reflected in the relatively high elasticity of income with respect to landownership. Thus, a doubling of the landownership size for an average household was expected to increase income by about 46 percent. The variable asset endowment (ASSET) had relatively low elasticity as doubling of the assets for a household would increase income by 35 percent. The coefficient for the variable credit (CREDIT) is statistically significant but has a low elasticity (3%). The variable of HYV technology (HYV) was found to be highly significant and the regression coefficient was estimated as 0.32, implying that the contribution made by the new rice technology to farm income was 32 percent higher than that for land cultivated under traditional rice varieties. The contribution of agricultural labour (ERNER) to household farm incomes was also found to be higher than that for the non-agricultural workers by 32 percent. The education variable (EDUC) was found to be positive but not significant at any acceptable level; this was significant at only 90 percent level. Thus, controlling for the variation in initial resource endowment of the household (e.g., land, non-land capital, labour, modern technology and education), one can observe a significant positive income effect of the SSWRDSP-I investments. In general, households in the project area (with intervention) had, on average, 25 percent higher income than those in the control area (without intervention). Similar results were obtained for the second model comprising households of only the project area, representing interventions in water management. The only major difference that can be observed was related to income effect of HYV rice technology. Such coefficient in this model was 44 percent compared to 32 percent

Performance of Small-scale Participatory water projects – An econometric Analysis of impact
103
in the first model13. As regards project intervention variables, the independent income effects of WMCA membership14 and well-drainage land variables were found to be statistically significant: the former at more than 95 percent and the latter at more than 90 percent level. This implies that the WMCA members had higher income than that of the non-members by about 18 percent while, well-drainage type of lands had higher returns by more than one third (34%), compared to lands with poor drainage conditions. The variables such as flood-free land and irrigated land were not found to be significant at any acceptable level of significance, presumably because the sample households comprised not a single type of subproject but various types such as irrigation, flood protection and drainage improvement so that benefits from these varied substantially (See footnote 4).
Almost similar findings are found to be true for the models with Total Assets as dependent variable (See Islam 2009). Table 7. Multiple regression results: dependent variable: log of farm income Tk)
Model MODEL 1
(Project + Control ) Area Households
MODEL 2 Project Area Households
Regression coefficients ‘t’ value Signifi-
canceRegression coefficients ‘t’ value Signifi-
cance Constant 1.373 1.927 .055 1.096 1.15 .25 LAND-Log owned land (dec.) .464 8.810 .000 .431 5.77 .00 ASSET-Log total assets (Tk.) .346 5.183 .000 .354 3.86 .00 CREDIT-Log of credits received (Tk.) .032 2.079 .038 .043 2.18 .03 HYV-Proportion of cultivated land under HYV rice variety .320 3.694 .000 .442 2.93 .00
INTNSTY-Cropping intensity (%) .006 7.764 .000 .006 6.67 .00 ERNER-Proportion of agric. earner .319 4.175 .000 .267 2.76 .01 EDUC-Years of schooling of household head .011 1.589 .103 .009 .977 .33
PROJ- Project/control (Dummy) * .249 4.141 .000 - - - FLDFREE -Proportion of flood-free land - - - .199 .98 .33
IRRIG -Proportion of irrigated land - - - -.107 -.90 .37 DRAIN -Proportion of well-drainage land - - - .335 1.74 .08
WMCA -Membership of WMCA** - - - .176 2.34 .02 R2 (Adjusted) .69 F .000 .71 F .00 No. of cases 494 - - 282 - - Note: * Dummy variable, assigned value 1 for the project and 0 for the control area ** Dummy variable, assigned value 1 for the WMCA members and 0 for the non-members.
Differential Impact of SSWRDSP-I subprojects by Income Status The preceding analysis has demonstrated significant positive impact of SSWRDSP-I subprojects on income and assets at household level. Now the
The Bangladesh Journal of Agricultural Economics
104
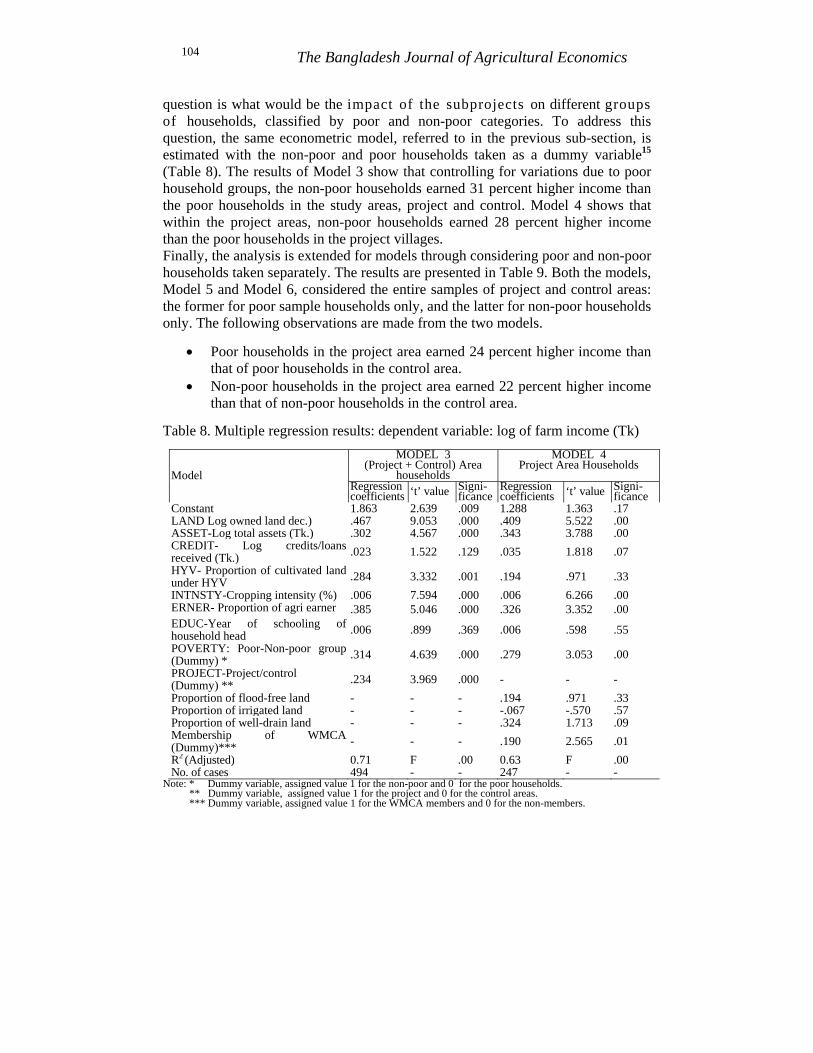
question is what would be the impact of the subprojects on different groups of households, classified by poor and non-poor categories. To address this question, the same econometric model, referred to in the previous sub-section, is estimated with the non-poor and poor households taken as a dummy variable15 (Table 8). The results of Model 3 show that controlling for variations due to poor household groups, the non-poor households earned 31 percent higher income than the poor households in the study areas, project and control. Model 4 shows that within the project areas, non-poor households earned 28 percent higher income than the poor households in the project villages. Finally, the analysis is extended for models through considering poor and non-poor households taken separately. The results are presented in Table 9. Both the models, Model 5 and Model 6, considered the entire samples of project and control areas: the former for poor sample households only, and the latter for non-poor households only. The following observations are made from the two models.
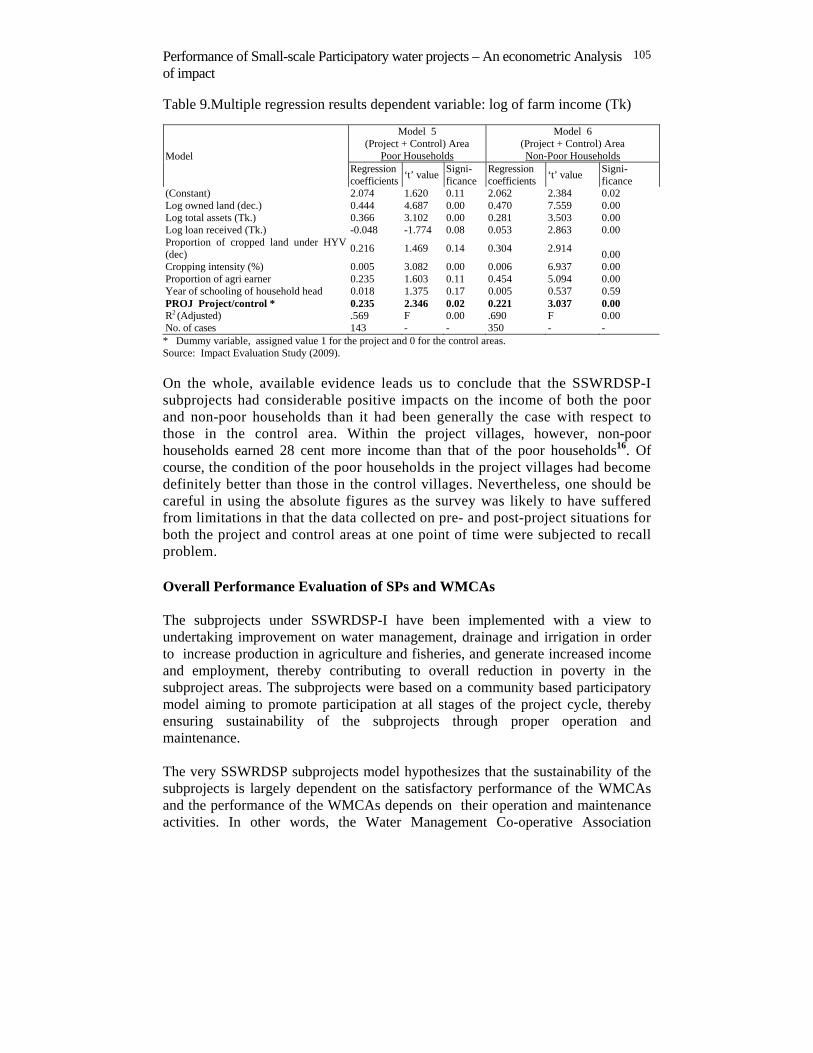
• Poor households in the project area earned 24 percent higher income than that of poor households in the control area.
• Non-poor households in the project area earned 22 percent higher income than that of non-poor households in the control area.
Table 8. Multiple regression results: dependent variable: log of farm income (Tk)
Model
MODEL 3(Project + Control) Area
households
MODEL 4 Project Area Households
Regression coefficients ‘t’ value Signi-
ficanceRegression coefficients ‘t’ value Signi-
ficance Constant 1.863 2.639 .009 1.288 1.363 .17 LAND Log owned land dec.) .467 9.053 .000 .409 5.522 .00 ASSET-Log total assets (Tk.) .302 4.567 .000 .343 3.788 .00 CREDIT- Log credits/loans received (Tk.) .023 1.522 .129 .035 1.818 .07 HYV- Proportion of cultivated land under HYV .284 3.332 .001 .194 .971 .33 INTNSTY-Cropping intensity (%) .006 7.594 .000 .006 6.266 .00 ERNER- Proportion of agri earner .385 5.046 .000 .326 3.352 .00 EDUC-Year of schooling of household head .006 .899 .369 .006 .598 .55 POVERTY: Poor-Non-poor group (Dummy) * .314 4.639 .000 .279 3.053 .00 PROJECT-Project/control (Dummy) ** .234 3.969 .000 - - - Proportion of flood-free land - - - .194 .971 .33 Proportion of irrigated land - - - -.067 -.570 .57 Proportion of well-drain land - - - .324 1.713 .09 Membership of WMCA (Dummy)*** - - - .190 2.565 .01 R2 (Adjusted) 0.71 F .00 0.63 F .00 No. of cases 494 - - 247 - -
Note: * Dummy variable, assigned value 1 for the non-poor and 0 for the poor households. ** Dummy variable, assigned value 1 for the project and 0 for the control areas. *** Dummy variable, assigned value 1 for the WMCA members and 0 for the non-members.
Performance of Small-scale Participatory water projects – An econometric Analysis of impact
105
Table 9.Multiple regression results dependent variable: log of farm income (Tk)
Model
Model 5 (Project + Control) Area
Poor Households
Model 6 (Project + Control) Area Non-Poor Households
Regression coefficients ‘t’ value Signi-
ficance Regression coefficients ‘t’ value Signi-
ficance (Constant) 2.074 1.620 0.11 2.062 2.384 0.02 Log owned land (dec.) 0.444 4.687 0.00 0.470 7.559 0.00 Log total assets (Tk.) 0.366 3.102 0.00 0.281 3.503 0.00 Log loan received (Tk.) -0.048 -1.774 0.08 0.053 2.863 0.00 Proportion of cropped land under HYV (dec) 0.216 1.469 0.14 0.304 2.914 0.00 Cropping intensity (%) 0.005 3.082 0.00 0.006 6.937 0.00 Proportion of agri earner 0.235 1.603 0.11 0.454 5.094 0.00 Year of schooling of household head 0.018 1.375 0.17 0.005 0.537 0.59 PROJ Project/control * 0.235 2.346 0.02 0.221 3.037 0.00 R2 (Adjusted) .569 F 0.00 .690 F 0.00 No. of cases 143 - - 350 - - * Dummy variable, assigned value 1 for the project and 0 for the control areas. Source: Impact Evaluation Study (2009). On the whole, available evidence leads us to conclude that the SSWRDSP-I subprojects had considerable positive impacts on the income of both the poor and non-poor households than it had been generally the case with respect to those in the control area. Within the project villages, however, non-poor households earned 28 cent more income than that of the poor households16. Of course, the condition of the poor households in the project villages had become definitely better than those in the control villages. Nevertheless, one should be careful in using the absolute figures as the survey was likely to have suffered from limitations in that the data collected on pre- and post-project situations for both the project and control areas at one point of time were subjected to recall problem. Overall Performance Evaluation of SPs and WMCAs The subprojects under SSWRDSP-I have been implemented with a view to undertaking improvement on water management, drainage and irrigation in order to increase production in agriculture and fisheries, and generate increased income and employment, thereby contributing to overall reduction in poverty in the subproject areas. The subprojects were based on a community based participatory model aiming to promote participation at all stages of the project cycle, thereby ensuring sustainability of the subprojects through proper operation and maintenance. The very SSWRDSP subprojects model hypothesizes that the sustainability of the subprojects is largely dependent on the satisfactory performance of the WMCAs and the performance of the WMCAs depends on their operation and maintenance activities. In other words, the Water Management Co-operative Association
The Bangladesh Journal of Agricultural Economics
106
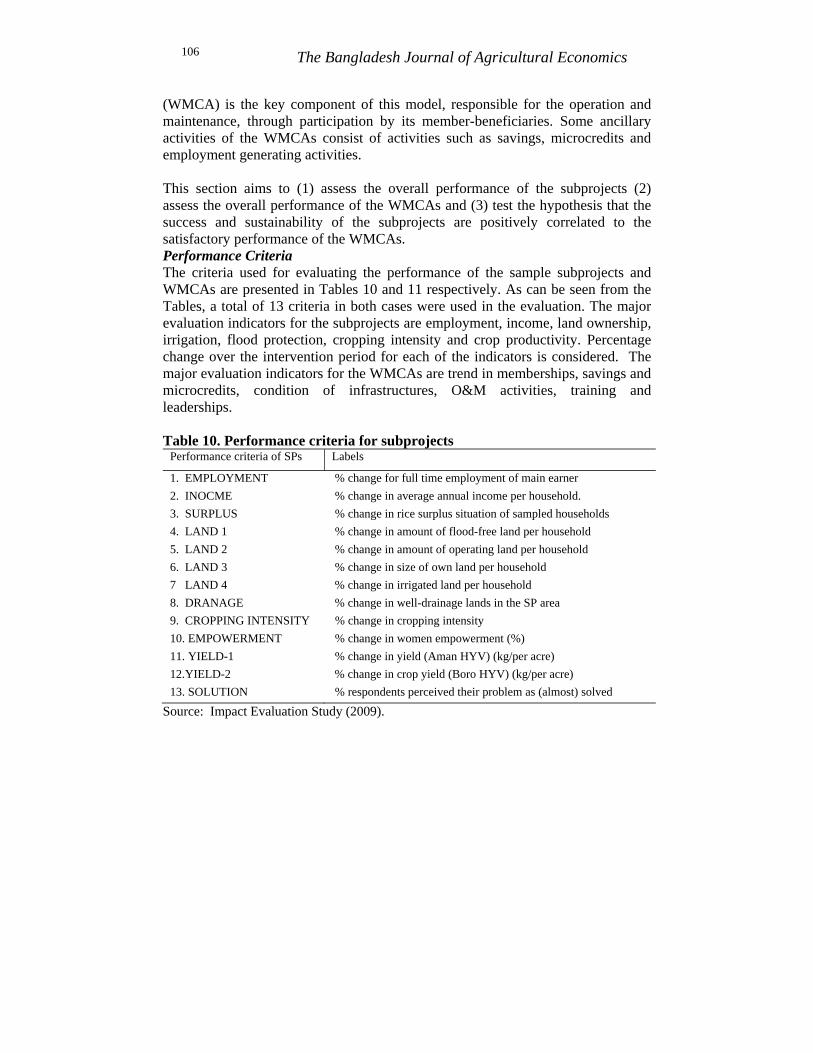
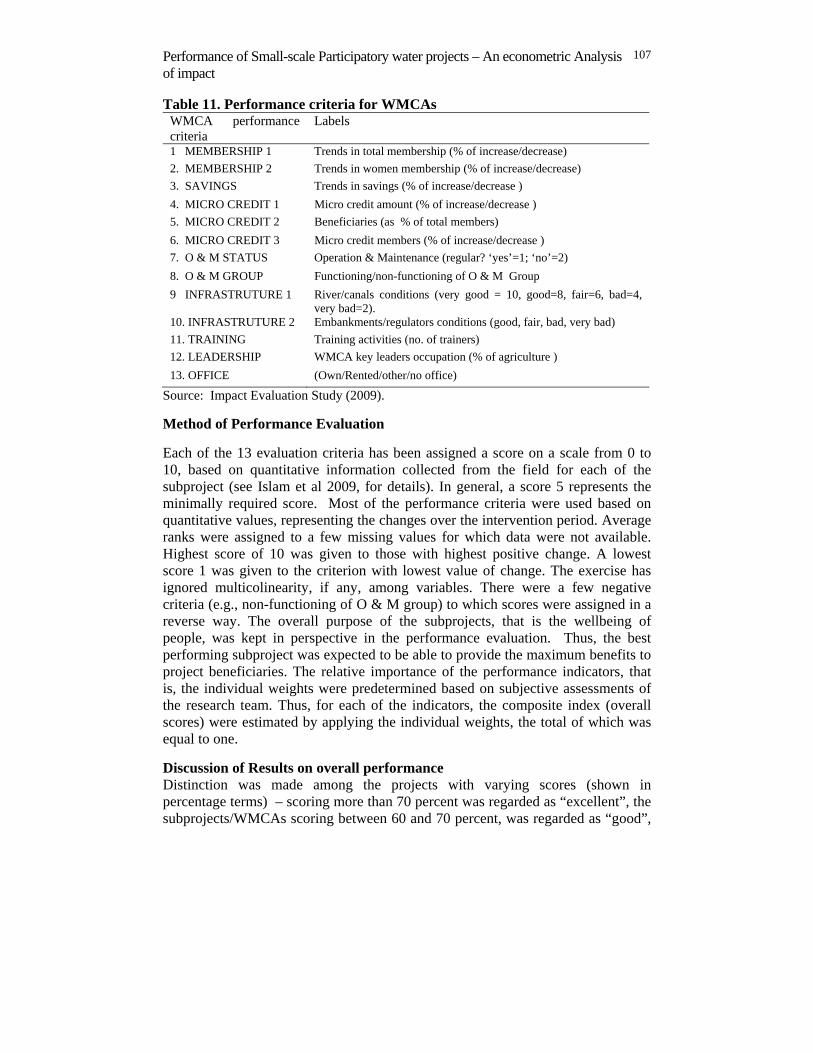
(WMCA) is the key component of this model, responsible for the operation and maintenance, through participation by its member-beneficiaries. Some ancillary activities of the WMCAs consist of activities such as savings, microcredits and employment generating activities. This section aims to (1) assess the overall performance of the subprojects (2) assess the overall performance of the WMCAs and (3) test the hypothesis that the success and sustainability of the subprojects are positively correlated to the satisfactory performance of the WMCAs. Performance Criteria The criteria used for evaluating the performance of the sample subprojects and WMCAs are presented in Tables 10 and 11 respectively. As can be seen from the Tables, a total of 13 criteria in both cases were used in the evaluation. The major evaluation indicators for the subprojects are employment, income, land ownership, irrigation, flood protection, cropping intensity and crop productivity. Percentage change over the intervention period for each of the indicators is considered. The major evaluation indicators for the WMCAs are trend in memberships, savings and microcredits, condition of infrastructures, O&M activities, training and leaderships. Table 10. Performance criteria for subprojects
Performance criteria of SPs Labels
1. EMPLOYMENT % change for full time employment of main earner 2. INOCME % change in average annual income per household. 3. SURPLUS % change in rice surplus situation of sampled households 4. LAND 1 % change in amount of flood-free land per household 5. LAND 2 % change in amount of operating land per household 6. LAND 3 % change in size of own land per household 7 LAND 4 % change in irrigated land per household 8. DRANAGE % change in well-drainage lands in the SP area 9. CROPPING INTENSITY % change in cropping intensity 10. EMPOWERMENT % change in women empowerment (%) 11. YIELD-1 % change in yield (Aman HYV) (kg/per acre) 12.YIELD-2 % change in crop yield (Boro HYV) (kg/per acre) 13. SOLUTION % respondents perceived their problem as (almost) solved
Source: Impact Evaluation Study (2009).
Performance of Small-scale Participatory water projects – An econometric Analysis of impact
107
Table 11. Performance criteria for WMCAs WMCA performance criteria
Labels
1 MEMBERSHIP 1 Trends in total membership (% of increase/decrease) 2. MEMBERSHIP 2 Trends in women membership (% of increase/decrease) 3. SAVINGS Trends in savings (% of increase/decrease ) 4. MICRO CREDIT 1 Micro credit amount (% of increase/decrease ) 5. MICRO CREDIT 2 Beneficiaries (as % of total members) 6. MICRO CREDIT 3 Micro credit members (% of increase/decrease ) 7. O & M STATUS Operation & Maintenance (regular? ‘yes’=1; ‘no’=2) 8. O & M GROUP Functioning/non-functioning of O & M Group 9 INFRASTRUTURE 1 River/canals conditions (very good = 10, good=8, fair=6, bad=4,
very bad=2). 10. INFRASTRUTURE 2 Embankments/regulators conditions (good, fair, bad, very bad) 11. TRAINING Training activities (no. of trainers) 12. LEADERSHIP WMCA key leaders occupation (% of agriculture ) 13. OFFICE (Own/Rented/other/no office)
Source: Impact Evaluation Study (2009). Method of Performance Evaluation Each of the 13 evaluation criteria has been assigned a score on a scale from 0 to 10, based on quantitative information collected from the field for each of the subproject (see Islam et al 2009, for details). In general, a score 5 represents the minimally required score. Most of the performance criteria were used based on quantitative values, representing the changes over the intervention period. Average ranks were assigned to a few missing values for which data were not available. Highest score of 10 was given to those with highest positive change. A lowest score 1 was given to the criterion with lowest value of change. The exercise has ignored multicolinearity, if any, among variables. There were a few negative criteria (e.g., non-functioning of O & M group) to which scores were assigned in a reverse way. The overall purpose of the subprojects, that is the wellbeing of people, was kept in perspective in the performance evaluation. Thus, the best performing subproject was expected to be able to provide the maximum benefits to project beneficiaries. The relative importance of the performance indicators, that is, the individual weights were predetermined based on subjective assessments of the research team. Thus, for each of the indicators, the composite index (overall scores) were estimated by applying the individual weights, the total of which was equal to one. Discussion of Results on overall performance Distinction was made among the projects with varying scores (shown in percentage terms) – scoring more than 70 percent was regarded as “excellent”, the subprojects/WMCAs scoring between 60 and 70 percent, was regarded as “good”,
The Bangladesh Journal of Agricultural Economics
108
those with a score between 50 and 60 percent as “poor”, and those with a score below 50 percent was considered as “very poor”. As mentioned earlier, the valuation of the different criteria has been based on a quantitative analysis of the responses to the questionnaires in the field surveys, in addition to the professional judgment of the members of the evaluation team. Table 12 presents the performance of the ten subprojects under study. Although the figures presented should not be interpreted as absolute scores for each of the evaluation criteria, it allowed a comparative ranking of the ten sub-projects based on some distinctive criteria. The following observations can be made:
• None of the subprojects scored “excellent” (above 70%) performance. Three of the sample subprojects showed a “good” score on the composite index (60-70%), a score limit which may be considered to be minimum for the sustainability of the subprojects. The subprojects were SP8 (Banderpara Chatra Beel WC, Rangpur), SP3 (Roufkhali FCD, Chuadanga and SP5 (Char Bhuringamari FCD, Kurigram). These three subprojects may be considered as more or less sustainable.
• Four subprojects, namely SP2 (Rajapur Patilapara FCD, Patuakhali) ), SP7 (Rajapur DR, Jhalakathi), SP1 (Jetua-Kanaidia FCD, Satkhira) and SP10 (Akhira-Saidpur DR and WC, Noagaon), with scores between 50 and 60 percent showed “poor” performance.
• Three out of ten subprojects had “very poor” score, below 50 percent. These are SP9 (Barung River WC, Panchagarh), SP4 (Puthia-Falia FCD, Sirajganj) and SP6 (Ramkrishnapur DR, Gopalganj). These subprojects demand some urgent actions to improve their performance, especially in terms of operation and maintenance. Performance with regard to WMCAs
• As regards WMCA performance, one of the ten WMCAs, SP 8 (Banderpara Chatra Beel WC, Rangpur), scored as high as 89 percent, which was considered as “excellent” (above 70%). Three WMCAs of SP5 (Char Bhurungamari FCD, Kurigram), SP2 (Rajapur Patilapara, Patuakhali), and SP4 (Puthia-Falia, Sirajganj) scored between 60 and 70 percent. These WMCAs showed “good” performance.
• The remaining six WMCAs, showing 50 to 60 percent scores, had “poor” performance. These are SP1 (Jetua-Kanaidia FCD, Satkhira), SP3 (Roufkhali FCD, Chuadanga), SP9 (Barung River WC, Panchagarh), SP7 (Rajapur DR, Jhalakathi), SP10 (Akhira-Saidpur DR & WC, Noagaon) and SP6 (Ramkrishnapur DR, Gopalganj). None of the WMCAs scored “very poor” (<50%) performance. Correlation of performances between subprojects and WMCAs
Performance of Small-scale Participatory water projects – An econometric Analysis of impact
109
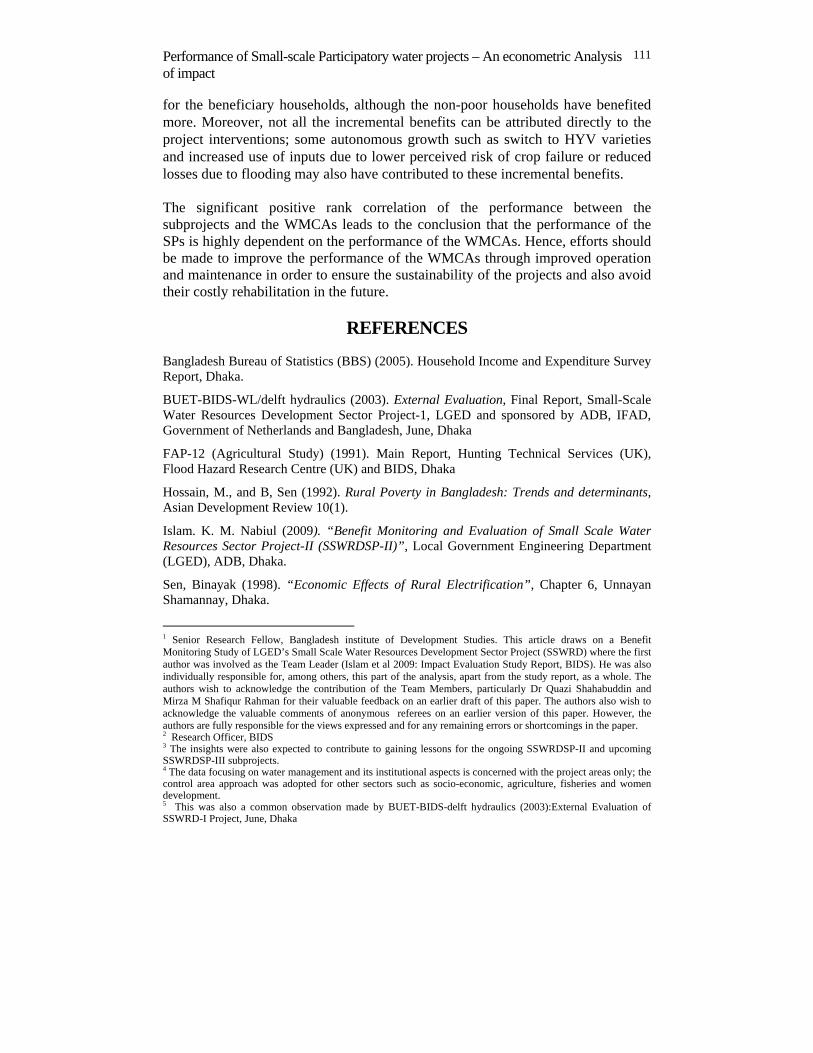
Detailed ranking of the SPs and WMCAs is shown in Table 12. The rank correlation of the performances between the subprojects and the WMCAs was estimated at 0.65, which was statistically significant at 95 percent confidence level (2-tailed). This leads to the conclusion that the performance of the SPs is highly dependent on the performance of the WMCAs (Figure 1).
Table 12. Performance of SPs and WMCAs and their ranks Name of SP Location Score
on SP Rank Score on
WMCA Rank
1. Jetua-Kanaidia FCD Satkhira 5.56 6 5.85 5 2 Rajapur Patilapara FCD Patuakhali 5.90 4 6.14 3 3. Raufkhali FCD Chuadanga 6.93 2 5.75 6 4. Puthia-Falia FCD Sirajganj 4.11 9 6.11 4 5. Char Bhurungamari FCD Kurigram 6.83 3 6.92 2 6. Ramkrishnapur DR Gopalganj 3.80 10 5.24 10 7. Rajapur DR Jhalakathi 5.69 5 5.62 8 8. Banderpara Chatra Beel WC Rangpur 6.97 1 8.87 1 9. Barung River WC Panchagarh 4.91 8 5.67 7 10.Akhaira-Saidpur Khal DR & WC Noagaon 5.50 7 5.61 9
Source: Impact Evaluation Study (2009). Note: Rank=1 refers to highest value, and so on.
Figure 1. Performance of SPs and WMCAs
SP SPSP
SP
SP
SP
SPSP
SP
SPWMCA
WMCA
WMCA W
MCA
WMCA
WMCA
WMCA
WMCA
WMCA
0
10
20
30
40
50
60
70
80
90
100
Jetua - K. FCD Patilapara FCDRaufkhali FCDPuthia-F FCD Bhurunga FCD Ramkrishn DRRajapur DR Banderpara. WC Barung - R WC Akhira DR &
Score Card of SPs and WMCAs
The Bangladesh Journal of Agricultural Economics
110
IV. CONCLUDING REMARKS Indeed, the LGED model for small-scale water resources development with the WMCA as the cornerstone is innovative. Besides, WMCAs have, to some extent, developed facilities towards community development at local levels, through provision of microcredit, training and other activities. However, the sustainability of the subprojects is largely dependent on the performance of the WMCAs through satisfactory operation and maintenance. Nevertheless, O&M has not developed up to its desired level of performance due to many reasons. In general, lack of motivation on the part of local beneficiaries and lack of commitment on the part of the WMCAs can be singled out as the main reasons for under-performance of the subprojects. Some of the projects were found to be dysfunctional reportedly due to flawed design or construction, and due to lack of maintenance. Almost all the projects encountered some maintenance problems, most of which could have been addressed by the WMCAs. Within a few years of its implementation, the siltation problem became most common in khals and canals, which remained largely unaddressed. The problem had worsened over time. Frequent breach of embankments and non-operation of sluice gates were among other pressing problems for the FCD projects. Even then, the situation in the post-project periods with respect to inundation, flood levels and irrigation appeared to have improved substantially. The drainage system also generally improved even though there has been the persistent problem of siltation. Surprisingly though, despite many limitations of the WMCAs (e.g., malfunction of WMCAs, lack of O&M activities, inadequate funds and participation), an overwhelming proportion of the respondents perceived the water management facilities to have largely improved. The formation of Labour Contracting Society (LCS) was somewhat faulty and there were conflicts of interest among leaders on their formation. In some cases, the WMCA leaders and traditional Sardars (Labour leaders) formed LCS with their own people depriving some genuine destitute labourers. Despite that, considerable benefits appeared to have accrued to the marginal and small farmers in the form of increased agricultural production. Besides, a larger part of the indirect employment was perceived to have gone to the hired agricultural labourers through increased cropping activities. Obviously, this is likely to have contributed to reduction of poverty. As already mentioned, one should not rely too much on the absolute figures relating to the performance of the projects and WMCAs. Nevertheless, subject to limitations of the survey and survey data it can be concluded that the SSWRDSP-I projects have had substantial positive impacts on income and asset
Performance of Small-scale Participatory water projects – An econometric Analysis of impact
111
for the beneficiary households, although the non-poor households have benefited more. Moreover, not all the incremental benefits can be attributed directly to the project interventions; some autonomous growth such as switch to HYV varieties and increased use of inputs due to lower perceived risk of crop failure or reduced losses due to flooding may also have contributed to these incremental benefits. The significant positive rank correlation of the performance between the subprojects and the WMCAs leads to the conclusion that the performance of the SPs is highly dependent on the performance of the WMCAs. Hence, efforts should be made to improve the performance of the WMCAs through improved operation and maintenance in order to ensure the sustainability of the projects and also avoid their costly rehabilitation in the future.
REFERENCES Bangladesh Bureau of Statistics (BBS) (2005). Household Income and Expenditure Survey Report, Dhaka.
BUET-BIDS-WL/delft hydraulics (2003). External Evaluation, Final Report, Small-Scale Water Resources Development Sector Project-1, LGED and sponsored by ADB, IFAD, Government of Netherlands and Bangladesh, June, Dhaka
FAP-12 (Agricultural Study) (1991). Main Report, Hunting Technical Services (UK), Flood Hazard Research Centre (UK) and BIDS, Dhaka
Hossain, M., and B, Sen (1992). Rural Poverty in Bangladesh: Trends and determinants, Asian Development Review 10(1).
Islam. K. M. Nabiul (2009). “Benefit Monitoring and Evaluation of Small Scale Water Resources Sector Project-II (SSWRDSP-II)”, Local Government Engineering Department (LGED), ADB, Dhaka.
Sen, Binayak (1998). “Economic Effects of Rural Electrification”, Chapter 6, Unnayan Shamannay, Dhaka.
1 Senior Research Fellow, Bangladesh institute of Development Studies. This article draws on a Benefit Monitoring Study of LGED’s Small Scale Water Resources Development Sector Project (SSWRD) where the first author was involved as the Team Leader (Islam et al 2009: Impact Evaluation Study Report, BIDS). He was also individually responsible for, among others, this part of the analysis, apart from the study report, as a whole. The authors wish to acknowledge the contribution of the Team Members, particularly Dr Quazi Shahabuddin and Mirza M Shafiqur Rahman for their valuable feedback on an earlier draft of this paper. The authors also wish to acknowledge the valuable comments of anonymous referees on an earlier version of this paper. However, the authors are fully responsible for the views expressed and for any remaining errors or shortcomings in the paper. 2 Research Officer, BIDS 3 The insights were also expected to contribute to gaining lessons for the ongoing SSWRDSP-II and upcoming SSWRDSP-III subprojects. 4 The data focusing on water management and its institutional aspects is concerned with the project areas only; the control area approach was adopted for other sectors such as socio-economic, agriculture, fisheries and women development. 5 This was also a common observation made by BUET-BIDS-delft hydraulics (2003):External Evaluation of SSWRD-I Project, June, Dhaka
The Bangladesh Journal of Agricultural Economics
112
6 This was also due to the 2007 flood that caused a number of major breaches, which remained still unattended. 7 See Islam et al (2009) : Section 2.3.. 8 These effects may be applicable over a short period. The long- term effects of these infrastructures may not be captured with the cross-sectional data. This can probably be assessed from panel data on a same set of households. 9 The model specification follows Hossain and Sen (1992). 10 Ideally, this could be incorporated if the models were run on the households of individual subprojects separately. In contrast, as would be seen later, independent income effects of all such variables (e.g., irrigation, flood protection) were not found to be statistically significant. Besides, the variables for both the models were beset with the problem of multicollinearity; however, these were assumed to be balancing such effects. 11 The regression equations were estimated in log linear forms. Natural logarithms were taken for the dependent variable, income, and for the independent variables, land owned, assets endowment and credit were taken. The HYV technology variable was measured in the ratio form, i.e., by the proportion of total cultivated area under high-yielding paddy varieties. Similarly, the variable earner was measured in ratio form, i.e., in terms of the proportion of agricultural to total earners in the households. The level of education considered years of education of the household head. In the first model, the project intervention variable has been measured in dummy form: households in the project area assigned a value "1" and those in the control area assigned a value "0". In the second model, intervention variables (flood-free land, irrigated land and well-drainage land) were measured in terms of proportions to total cultivated land. The variable WMCA membership was measured as a dummy variable, members assigned a value “1” and non-members assigned a value of “0”. 12 Such high correlations were not much expected from a cross sectional data, the aspect of which might raise questions about the unbiasedness of the control area selection. Hence, one should be careful in using the absolute values of the income effects. 13 To look into which of the HYV paddy productivities was more contributing, a separate model was run with the HYV (Aman) and HYV (Boro) included as two independent variables, instead of the HYV rice as a whole. It shows that Aman productivity had a higher income contributing effects by about 3%, the coefficient being 0.026. The coefficient for Boro was found to be not statistically significant (See Islam et al 2009). 14 The variable considered as dummy, with WMCA members assigned value 1 and 0 otherwise. The respondent beneficiaries included a considerable number of non-members. 15 TK 11,220 (annual per capita), based on annual per capita expenditure, has been taken as (upper) poverty line for the year 2007; the estimate is made on the basis of HIES expenditure data (BBS-Household Income and Expenditure Survey Report 2005). 16 Although not strictly comparable, however, in this regard, one can recall that 7 more successful FCD/I projects investigated by FAP-12 study (FCD/I Agricultural Study, 1991) were relatively small (less that 9000 hectares) having Economic Internal Rate of Returns (EIRRs) around 30%, compared to 9 investigated large-size projects estimating EIRRs as less that 12%. Appendix Tables
Table A.1 Distribution of Respondents Suggesting Problems Still Unsolved by SP
Existing problems/problems still unsolved
Distribution of households WMCA Members WMCA Non-members All
FCD DR WC DR & WC
FCD DR WC DR &WC
%
Water logging due to embankment 2.0 - - - 1.0 - - - 0.7 Water logging due to drainage congestion 13.0 35.0 - - 16.4 25.0 - - 14.1 Frequent break/breach of embankment 41.0 - - - 38.5 1.5 - - 21.7 Non-operation of sluice gates 22.0 - 6.9 - 21.0 - 30.4 - 15.9 Siltation 13.0 60.0 75.9 100.0 15.9 70.6 63.8 100.0 40.9 Crop loss/damage to property - 2.5 - - 2.1 2.9 - - 1.3 Waterborne diseases - - - - - - - - - Others 9.0 2.5 17.2 - 5.1 - 5.8 - 5.4 Total 52.6 21.1 15.3 11.1 55.7 19.4 19.7 5.1 100.0Source: Impact Evaluation Study (2009).
Performance of Small-scale Participatory water projects – An econometric Analysis of impact
113
Table A.2 Use of Irrigation by Methods
Situation No. of households using irrigation methods All LLP DTW STW Gravity Traditional
methods Before 23 24 165 - 11 208 Now 54 36 225 - 5 227 % change 134.8 50.0 36.4 - -54.5 33.2 Source: Impact Evaluation Study (2009).
Table A.3 Respondents’ Options about Maintenance of the Major Components by SPs (Canal/Embankment/Regulators)
Opinion % of opinions
FCD DR WC DR & WC All Maintained regularly 36.4 2.5 98.8 - 38.5 Few maintenance 49.0 90.0 0.0 92.3 51.6 Don’t know/not sure 14.6 7.5 1.3 7.7 9.8 All 100.0 100.0 100.0 100.0 100.0
Source: Impact Evaluation Study (2009). Table A.4
Respondents’ Perception about Maintenance Problems with SPs
Perception about maintenance problems Distribution of responses*
No. % Inadequacy of O&M fund 256 23.9 O&M group not properly functioning 202 18.9 Flawed design of SP 55 5.1 Defective construction of SP 46 4.3 Lack of unity among beneficiaries 181 16.9 No. common interest 131 12.2 Lack of LGED interest 107 10.0 Lack of dynamism 66 6.2 Not sure 7 0.7 Don’t know 15 1.4 Others 5 0.5 All 1071 100.0 No. of respondents mentioning maintenance problem 398 99.5
Note : * Multiple responses; Source: Impact Evaluation Study (2009).