performance of pop-up satellite archival tags - inter · pdf fileperformance of pop-up...
TRANSCRIPT

1
The following supplement accompanies the article
Performance of pop-up satellite archival tags
M. K. Musyl1,*, M. L. Domeier2, N. Nasby-Lucas2, R. W. Brill3, L. M. McNaughton1, J. Y. Swimmer4, M. S. Lutcavage5,8, S. G. Wilson5,
B. Galuardi5,8, J. B. Liddle6,7
1University of Hawaii, Joint Institute for Marine and Atmospheric Research (JIMAR), Kewalo Research Facility/NOAA, 1125B Ala Moana Boulevard, Honolulu, Hawaii 96814, USA
2Marine Conservation Science Institute, 2809 South Mission Road, Suite G, Fallbrook, California 92028, USA
3NOAA/NMFS Northeast Fisheries Science Center Virginia Institute of Marine Science, PO Box 1346, Gloucester Point, Virginia 23062, USA
4NOAA/NMFS, Pacific Islands Fisheries Science Center, 2570 Dole Street, Honolulu, Hawaii 96822, USA 5Large Pelagics Research Center, Department of Zoology, University of New Hampshire
Durham, New Hampshire 03824, USA 6University of Alaska Southeast, Department of Mathematics, 1332 Seward Avenue, Sitka, Alaska 99835,
USA 7Liddle and Lee LLC, 609 Sawmill Creek Road, Sitka, Alaska 99835, USA
8Present address: Large Pelagics Research Center, Natural Resources Conservation Department, University of Massachusetts at Amherst and Marine Fisheries Institute, 108 East Main Street, Gloucester,
Massachusetts 01930, USA
*Email: [email protected]
Marine Ecology Progress Series 433:1–28 (2011) Supplement. This supplement contains additional data on PSAT specifications, literature review data and sources, additional models for PSAT reporting rate and retention, as well as PSAT performance based on latitude, species, and habitat class. Recommendations for determining optimal sample sizes (no. of PSATs to be deployed) are provided, as well as chlorophyll a distribution in areas of frequent PSAT pop-up.

2
Table S1. Features of pop-up satellite tags (PSAT) tags from Microwave Telemetry (microwavetelemetry.com) and Wildlife Computers (wildlifecomputers.com). Information in the table was summarized from manufacturers’ websites
Microwave Telemetry
Option Wildlife Computers
By manufacturer Tag Programming
By user
Remove magnet Deployment Activates either by computer command and/or swiping a magnet and receiving confirmation with LEDs
Argos – data transmission maximised by SiV (Satellite in View)
Data transmission
Argos No SiV feature
64Mb non-volatile Memory 64 Mb non-volatile 10,000 to 15,000 + with SiV in the X-tag
Argos message bandwidth
10,000
By manufacturer Data transcription
By user
Raw time series of external temperature, pressure (depth) and a daily estimate of geolocation using changes in ambient light levels (provided by manufacturer). Light, temperature and depth are acquired at 15- to 60-min intervals in the X-tag and PTT-100 (depends on mission time). Fine-scale acquisition rates of 1-6 min available in the PTT-100HR (high rate) tag for up to 30d
Satellite Data products
Summarized histograms of external temperature, depth. Profiles of depth and temperature. User must specify a priori 14 temperature and depth bin dimensions plus how bins are assembled by time (e.g. 4- to 6-h bins appear to be common in studies although 1 h bins can be used for short missions). Daily estimates of geolocation using changes in ambient light levels by user with supplied software

3
Microwave Telemetry Option Wildlife Computers
–4°C to + 60°, 0.176° C resolution for Argos data and 0.04° C resolution for archived data
Temperature range and resolution
–40° C to + 60°, 0.05° C resolution
0-1296 m, 5.38 m resolution for Argos data and 1.27 m resolution for archived data.
Depth range and resolution
0-1000 m, 0.5 m resolution
Corrosional – threshold depth Corrosional link on nosecone of the tag itself, activates ≈ 1200 m (for at least 15 min), to jettison tag to initiate transmission procedures at surface Corrosional – shed tag Constant pressure (user-defined period, e.g. 4 d), will jettison tag to initiate transmission procedures at surface
Pressure release and “fail-safe” mechanisms to detect mortality (or how a tag saves itself from imploding at depth)
Mechanical – threshold depth RD1800 mechanical guillotine (Depth ~1800 m activates release mechanism which cuts monofilament tether and jettisons tag) Corrosional – shed tag Constant pressure (user-defined period, e.g. 4 d), will jettison tag to initiate transmission procedures at surface
From 40 g (X-tag) to 65-68 g [PTT-100]
Weight of tag (in air)
75 g, MK-10
40 × 216 mm (+ 121 mm antennae) PTT-100
120 × 32 mm (+ 150 mm antennae), X-tag
Dimensions 21 × 175 mm, MK-10 (length of antennae not given)
2000 m (3000 psi), PTT-100, 2500 m (3500 psi), X-tag
Pressure rating
2000 m (3000 psi), MK-10
150 lbs, X-tag
120 lbs, PTT-100
Pull strength of eyelet, which secures the tether
Not given
Yes, some models Archival tag function if physically recovered?
Yes
Yes, small models to accommodate small species
Different sized PSATs
Yes, small models to accommodate small species
Consult manufacturer Cost
Consult manufacturer
4
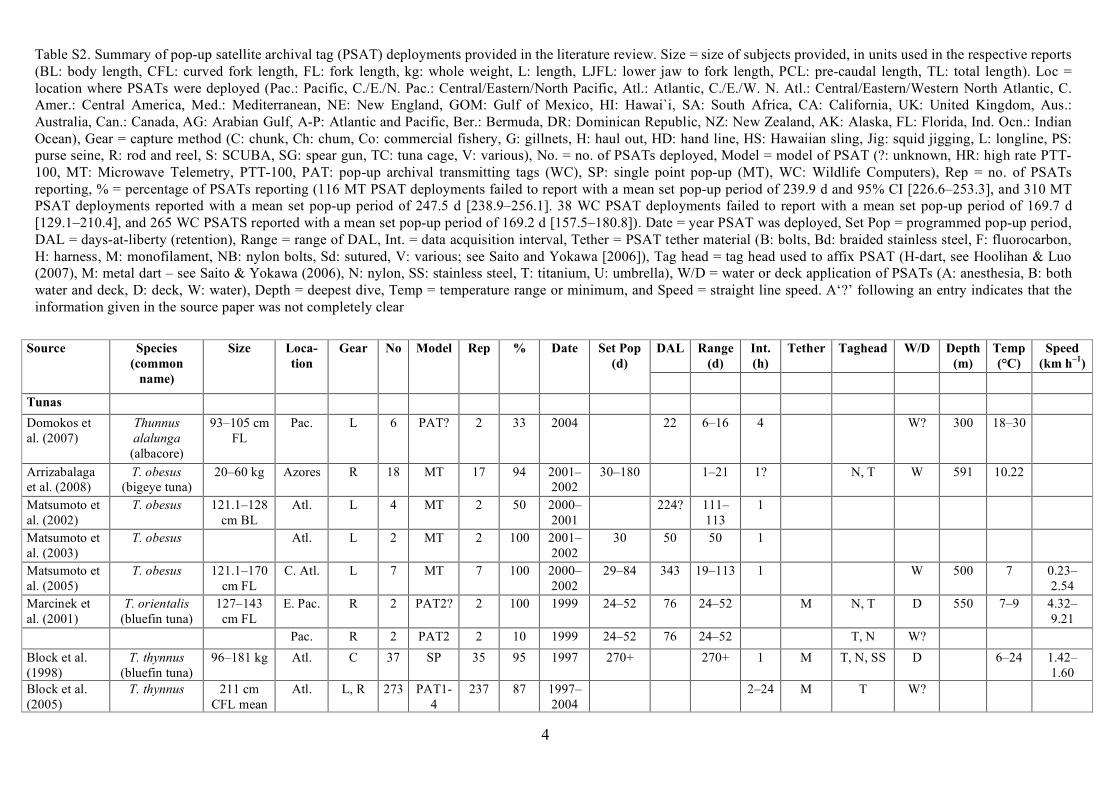
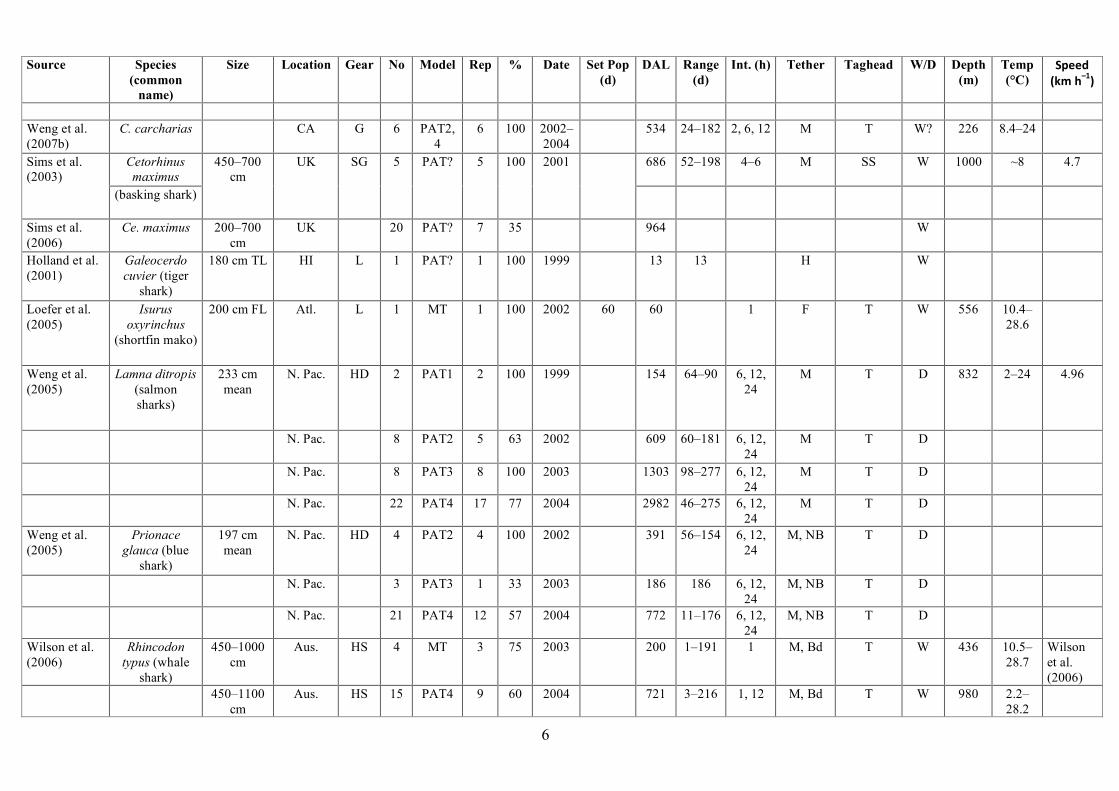
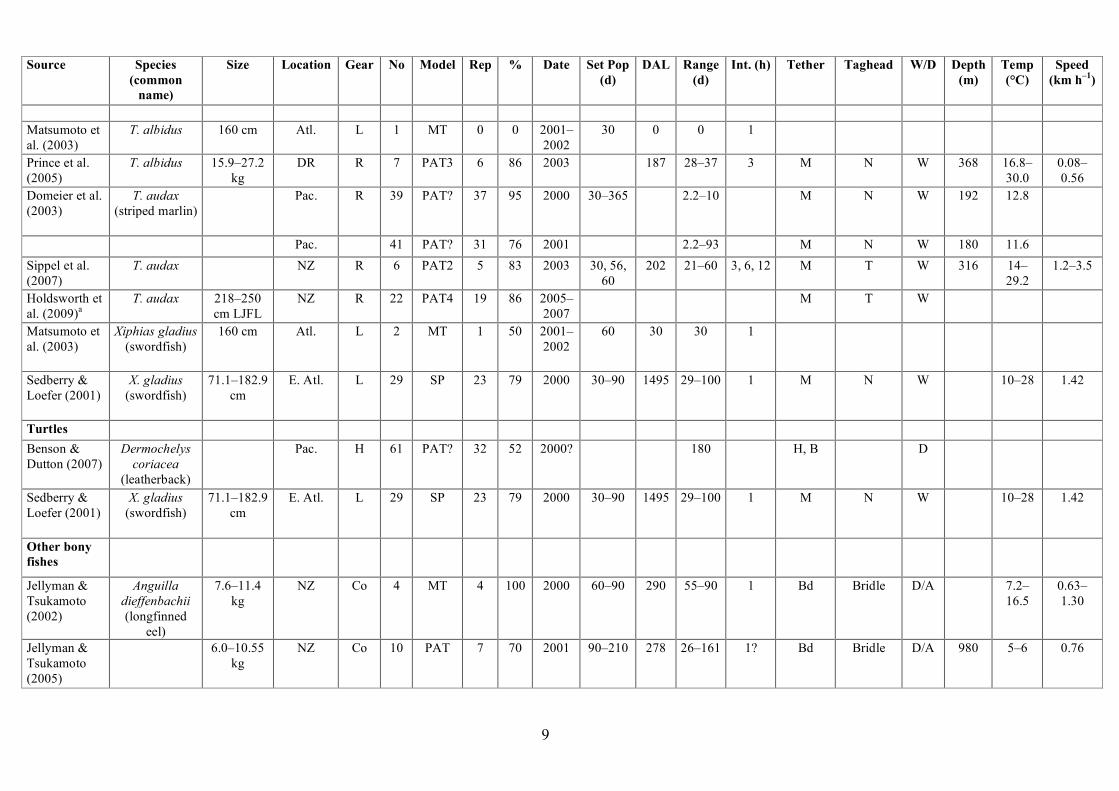
Table S2. Summary of pop-up satellite archival tag (PSAT) deployments provided in the literature review. Size = size of subjects provided, in units used in the respective reports (BL: body length, CFL: curved fork length, FL: fork length, kg: whole weight, L: length, LJFL: lower jaw to fork length, PCL: pre-caudal length, TL: total length). Loc = location where PSATs were deployed (Pac.: Pacific, C./E./N. Pac.: Central/Eastern/North Pacific, Atl.: Atlantic, C./E./W. N. Atl.: Central/Eastern/Western North Atlantic, C. Amer.: Central America, Med.: Mediterranean, NE: New England, GOM: Gulf of Mexico, HI: Hawai`i, SA: South Africa, CA: California, UK: United Kingdom, Aus.: Australia, Can.: Canada, AG: Arabian Gulf, A-P: Atlantic and Pacific, Ber.: Bermuda, DR: Dominican Republic, NZ: New Zealand, AK: Alaska, FL: Florida, Ind. Ocn.: Indian Ocean), Gear = capture method (C: chunk, Ch: chum, Co: commercial fishery, G: gillnets, H: haul out, HD: hand line, HS: Hawaiian sling, Jig: squid jigging, L: longline, PS: purse seine, R: rod and reel, S: SCUBA, SG: spear gun, TC: tuna cage, V: various), No. = no. of PSATs deployed, Model = model of PSAT (?: unknown, HR: high rate PTT-100, MT: Microwave Telemetry, PTT-100, PAT: pop-up archival transmitting tags (WC), SP: single point pop-up (MT), WC: Wildlife Computers), Rep = no. of PSATs reporting, % = percentage of PSATs reporting (116 MT PSAT deployments failed to report with a mean set pop-up period of 239.9 d and 95% CI [226.6–253.3], and 310 MT PSAT deployments reported with a mean set pop-up period of 247.5 d [238.9–256.1]. 38 WC PSAT deployments failed to report with a mean set pop-up period of 169.7 d [129.1–210.4], and 265 WC PSATS reported with a mean set pop-up period of 169.2 d [157.5–180.8]). Date = year PSAT was deployed, Set Pop = programmed pop-up period, DAL = days-at-liberty (retention), Range = range of DAL, Int. = data acquisition interval, Tether = PSAT tether material (B: bolts, Bd: braided stainless steel, F: fluorocarbon, H: harness, M: monofilament, NB: nylon bolts, Sd: sutured, V: various; see Saito and Yokawa [2006]), Tag head = tag head used to affix PSAT (H-dart, see Hoolihan & Luo (2007), M: metal dart – see Saito & Yokawa (2006), N: nylon, SS: stainless steel, T: titanium, U: umbrella), W/D = water or deck application of PSATs (A: anesthesia, B: both water and deck, D: deck, W: water), Depth = deepest dive, Temp = temperature range or minimum, and Speed = straight line speed. A‘?’ following an entry indicates that the information given in the source paper was not completely clear
DAL Range
(d) Int. (h)
Tether Taghead W/D Depth (m)
Temp (°C)
Speed (km h–1)
Source Species (common
name)
Size Loca-tion
Gear No Model Rep % Date Set Pop (d)
Tunas
Domokos et al. (2007)
Thunnus alalunga (albacore)
93–105 cm FL
Pac. L 6 PAT? 2 33 2004 22 6–16 4 W? 300 18–30
Arrizabalaga et al. (2008)
T. obesus (bigeye tuna)
20–60 kg Azores R 18 MT 17 94 2001–2002
30–180 1–21 1? N, T W 591 10.22
Matsumoto et al. (2002)
T. obesus 121.1–128 cm BL
Atl. L 4 MT 2 50 2000–2001
224? 111–113
1
Matsumoto et al. (2003)
T. obesus Atl. L 2 MT 2 100 2001–2002
30 50 50 1
Matsumoto et al. (2005)
T. obesus 121.1–170 cm FL
C. Atl. L 7 MT 7 100 2000–2002
29–84 343 19–113 1 W 500 7 0.23–2.54
Marcinek et al. (2001)
T. orientalis (bluefin tuna)
127–143 cm FL
E. Pac. R 2 PAT2? 2 100 1999 24–52 76 24–52 M N, T D 550 7–9 4.32–9.21
Pac. R 2 PAT2 2 10 1999 24–52 76 24–52 T, N W?
Block et al. (1998)
T. thynnus (bluefin tuna)
96–181 kg Atl. C 37 SP 35 95 1997 270+ 270+ 1 M T, N, SS D 6–24 1.42–1.60
Block et al. (2005)
T. thynnus 211 cm CFL mean
Atl. L, R 273 PAT1-4
237 87 1997–2004
2–24 M T W?

5
Source Species
(common name)
Size Loca-tion
Gear No Model Rep % Date Set Pop (d)
DAL Range (d)
Int. (h)
Tether Taghead W/D Depth (m)
Temp (°C)
Speed (km h–1)
De Metrio et al. (2004)
T. thynnus 120–180 cm FL
Med. PS 13 MT 13 100 2003 34–300 229 3–58 1? M U B? 1000
131–145 cm FL
Med. TC 21 PAT 6 29 2003 34–300 148 6–67 M U B? 1000
De Metrio et al. (2005)
T. thynnus Med. 57 SP 12 21 5–300 B?
Med. 21 PAT 13 62 5–300 B
Lutcavage et al. (1999)
T. thynnus 190–263 cm
Atl. C, PS 20 SP 17 85 1997–1998
285 1? M N W
Stokesbury et al. (2004)
T. thynnus 217–245 cm CFL
NE PS 4 SP 3 75 1998 724 175–371
1 M T W? 0.26–0.41
229–254 cm
NE PS 5 PAT1 5 100 1998 310 10–134 0.5 M T W? 0.18–0.38
173–287 cm
NE R 26 PAT2 24 92 2000–2001
4008 4–324 12, 24
M T D 0.09–0.48
Wilson et al. (2005)
T. thynnus 91–295 kg Atl. PS 68 MT 60 88 2002 150–390 6–304 1 M T W 672 3.4–28.7
Weng et al. (2009)a
T. albacares (yellowfin
tuna)
136–154 cm FL
GOM L 10 PAT2 6 60 2000 220 6–80 2, 12 W 432 12.6
Sharks
Weng & Block (2004)
Alopias superciliosus
(bigeye thresher)
242–229 cm FL
GOM, HI
L, R 2 PAT2 2 100 2000 27–60 87 27–60 6 M T W ~1000 ~4–6
Bonfil et al. (2005)
Carcharodon carcharias
(great white)
SA Ch 25 PAT? 17 68 2002–2003
63–364 1663 7–255 M W 980 3.4
Boustany et al. (2002)
C. carcharias 370–500 cm
Pac. 6 PAT 6 100 1999–2000
650 M 692 4.8
Dewar et al. (2004)
C. carcharias 140 cm FL Pac. G 1 PAT? 0 0 2000 28 N D 240 9–22
Weng et al. (2007a)
C. carcharias CA 26 PAT2, 3, 4
17 65 2002–2005
3336 14–367 12, 24
M T W 644 5.4–24.2
6
Source Species
(common name)
Size Location Gear No Model Rep % Date Set Pop (d)
DAL Range (d)
Int. (h) Tether Taghead W/D Depth (m)
Temp (°C)
Speed(kmh–1)
Weng et al. (2007b)
C. carcharias CA G 6 PAT2, 4
6 100 2002–2004
534 24–182 2, 6, 12 M T W? 226 8.4–24
Cetorhinus maximus
686 52–198 4–6 M SS W 1000 ~8 4.7 Sims et al. (2003)
(basking shark)
450–700 cm
UK SG 5 PAT? 5 100 2001
Sims et al. (2006)
Ce. maximus 200–700 cm
UK 20 PAT? 7 35 964 W
Holland et al. (2001)
Galeocerdo cuvier (tiger
shark)
180 cm TL HI L 1 PAT? 1 100 1999 13 13 H W
Loefer et al. (2005)
Isurus oxyrinchus
(shortfin mako)
200 cm FL Atl. L 1 MT 1 100 2002 60 60 1 F T W 556 10.4–28.6
Weng et al. (2005)
Lamna ditropis (salmon sharks)
233 cm mean
N. Pac. HD 2 PAT1 2 100 1999 154 64–90 6, 12, 24
M T D 832 2–24 4.96
N. Pac. 8 PAT2 5 63 2002 609 60–181 6, 12, 24
M T D
N. Pac. 8 PAT3 8 100 2003 1303 98–277 6, 12, 24
M T D
N. Pac. 22 PAT4 17 77 2004 2982 46–275 6, 12, 24
M T D
Weng et al. (2005)
Prionace glauca (blue
shark)
197 cm mean
N. Pac. HD 4 PAT2 4 100 2002 391 56–154 6, 12, 24
M, NB T D
N. Pac. 3 PAT3 1 33 2003 186 186 6, 12, 24
M, NB T D
N. Pac. 21 PAT4 12 57 2004 772 11–176 6, 12, 24
M, NB T D
Wilson et al. (2006)
Rhincodon typus (whale
shark)
450–1000 cm
Aus. HS 4 MT 3 75 2003 200 1–191 1 M, Bd T W 436 10.5–28.7
Wilson et al. (2006)
450–1100 cm
Aus. HS 15 PAT4 9 60 2004 721 3–216 1, 12 M, Bd T W 980 2.2–28.2

7
Source Species
(common name)
Size Location Gear No Model Rep % Date Set Pop (d)
DAL Range (d)
Int. (h) Tether Taghead W/D Depth (m)
Temp (°C)
Speed (km h–1)
Wilson et al. (2007)
R. typus Ind. Ocn. HS 2 MT 2 100 2005 100 50 0.03–0.25
Sling W
Stokesbury et al. (2005)
Somniosus microcephalus
(greenland shark)
Can. S 2 PAT4 2 100 2004 66 132 66 12 M T W 352 1.1–8.6
Somniosus pacificus
1851 60–336 Bd T, SS W 724 4.4 0.25 vertical
Hulbert et al. (2006)a
(Pacific sleeper shark)
210 cm PCL
AK L 24 PAT? 12 50 2000–2002
90–336
Dasyatis brevicaudata
212 62–151 M Bridle D 250 13.4 Le Port et al. (2008)a
(short–tailed stingray)
90–100 cm disc width
NZ 2 PAT4 2 100 2005–2006
62, 151
Billfish
Hoolihan & Luo (2007)
Istiophorus platyterus (sailfish)
18.1–36.3 kg
AG R 9 PAT2 7 78 2002 110–156 430 4–93 M H-dart D 61 19.7–33.7
23.0–36.0 kg
AG R 6 PAT4 5 83 2005 110–157 376 3–128 M H-dart D 71 19.6–34.6
29.5–45.4 kg
AG R 2 MT 2 100 2001–2002
110–158 160 70–90 1 M H-dart D 48 21.7–33.4
Prince & Goodyear (2006a)
I. platyterus A-P R 2 PAT2 2 100 2000, 2002
59 28–31 6 M N W 284 15.2
A-P R 12 PAT3 12 100 2003 295 8–59 6 M N W 284 15.2
Prince et al. (2006b)
I. platyterus C. Amer. R 41 PAT3 32 78 2000, 2002
28–124 1572 5–118 6 M N W
Kerstetter & Graves (2008)a
I. platyterus 107–183 cm LJFL
FL L 17 HR 17 100 2005–2007
10 1.5 min
F N W
Gunn et al. (2003)
Makaira indica (black marlin)
90.7–102.1 kg
Aus. R 2 SP 2 100 2000 5 10 5 N, SS W 7.60–10.12
113.4–272.2 kg
Aus. R 5 PAT1 3 60 2000–2001
30–150 3–64 N W 236 12 0.83

8
Source Species
(common name)
Size Location Gear No Model Rep % Date Set Pop (d)
DAL Range (d)
Int. (h) Tether Taghead W/D Depth (m)
Temp (°C)
Speed (km h–1)
Prince & Goodyear (2006a)
M. indica A-P R 1 PAT2 1 100 2002 28 28 6 M N W
Graves et al. (2002)
M. nigricans (blue marlin)
Ber. R 9 SP 8 89 1999 5 40? 0–5 2 M N W 22–26+ 0.84–2.04
Kerstetter et al. (2003)
M. nigricans W. N. Atl.
L 7 SP 5 71 2000 5 0–5 1 M N W 28.6–30.6
1.17–3.02
2 PAT2 2 100 2001 30 0–30 1 16.6–30.6
Matsumoto et al. (2002)
M. nigricans 180–200 cm BL
Atl. L 2 MT 1 50 2000–2001
11? 11? 1
Matsumoto et al. (2003)
M. nigricans 180–250 cm
Atl. L 5 MT 3 60 2001–2002
30–150 93 93 1
Matsumoto et al. (2004)
M. nigricans 170–230 cm
Dakar L 4 MT 1 25 2002–2003
60–120 59 59 1? W 15–30
Prince & Goodyear (2006a)
M. nigricans A-P R 2 PAT2 2 100 2000 69 33–36 6 M N W 804 9.8
A-P R 15 PAT3 15 100 2003 841 7–91 6 M N W 804 9.8
Prince et al. (2005)
M. nigricans 59.0 kg DR R 1 PAT3 1 100 2003 40 40 3 M N W 200 ~19–20 0.42
Saito & Yokawa (2006)
M. nigricans 70–200 kg Angola L 12 PAT 6 50 2002 99 6–32 3, 4, 6 V N W? ~1000 9–29
80–150 kg Angola L 6 MT 3 50 2002–2003
88 30–58 3, 4, 6 V M W? 118 16–30
Goodyear et al. (2008)a
M. nigricans 40–227 kg Atl. R, L 79 PAT2, 4
51 65 2002–2004
7–90 2303 5–124 3, 6 M M W ~850 <9
Horodysky & Graves (2005)
Tetrapturus albidus (white
marlin)
W.N. Atl. R 41 HR 40 98 2002–2003
5–10 385? 5–10 2–4 min
M N W 0.60–0.78
Kerstetter & Graves (2006)
T. albidus W.N. Atl. L 1 PAT? 1 100 2002 43 243? 5–43 M N W
5 SP 3 60 2002 5–30 2
22 HR 16 73 2002–2004
10 2–4 min
9
Source Species
(common name)
Size Location Gear No Model Rep % Date Set Pop (d)
DAL Range (d)
Int. (h) Tether Taghead W/D Depth (m)
Temp (°C)
Speed (km h–1)
Matsumoto et al. (2003)
T. albidus 160 cm Atl. L 1 MT 0 0 2001–2002
30 0 0 1
Prince et al. (2005)
T. albidus 15.9–27.2 kg
DR R 7 PAT3 6 86 2003 187 28–37 3 M N W 368 16.8–30.0
0.08–0.56
Domeier et al. (2003)
T. audax (striped marlin)
Pac. R 39 PAT? 37 95 2000 30–365 2.2–10 M N W 192 12.8
Pac. 41 PAT? 31 76 2001 2.2–93 M N W 180 11.6
Sippel et al. (2007)
T. audax NZ R 6 PAT2 5 83 2003 30, 56, 60
202 21–60 3, 6, 12 M T W 316 14–29.2
1.2–3.5
Holdsworth et al. (2009)a
T. audax 218–250 cm LJFL
NZ R 22 PAT4 19 86 2005–2007
M T W
Matsumoto et al. (2003)
Xiphias gladius (swordfish)
160 cm Atl. L 2 MT 1 50 2001–2002
60 30 30 1
Sedberry & Loefer (2001)
X. gladius (swordfish)
71.1–182.9 cm
E. Atl. L 29 SP 23 79 2000 30–90 1495 29–100 1 M N W 10–28 1.42
Turtles
Benson & Dutton (2007)
Dermochelys coriacea
(leatherback)
Pac. H 61 PAT? 32 52 2000? 180 H, B D
Sedberry & Loefer (2001)
X. gladius (swordfish)
71.1–182.9 cm
E. Atl. L 29 SP 23 79 2000 30–90 1495 29–100 1 M N W 10–28 1.42
Other bony fishes
Jellyman & Tsukamoto (2002)
Anguilla dieffenbachii (longfinned
eel)
7.6–11.4 kg
NZ Co 4 MT 4 100 2000 60–90 290 55–90 1 Bd Bridle D/A 7.2–16.5
0.63–1.30
Jellyman & Tsukamoto (2005)
6.0–10.55 kg
NZ Co 10 PAT 7 70 2001 90–210 278 26–161 1? Bd Bridle D/A 980 5–6 0.76

10
Source Species (common
name)
Size Location Gear No Model Rep % Date Set Pop (d)
DAL Range (d)
Int. (h) Tether Taghead W/D Depth (m)
Temp (°C)
Speed (km h–1)
Seitz et al. (2003)
Hippoglossus stenolepis (halibut)
107–165 cm
AK L 14 PAT? 5 36 2000 180–365 887 133–244
12 M T D 502 4.3–12.2
Loher & Seitz (2006)a
H. stenolepis 106–150 cm
AK L 12 PAT? 10 83 2002 120–180?
12 M T D 736 2.6
Seitz et al. (2007)a
H. stenolepis 112–137 cm
AK L 12 PAT? 9 75 2002 180–365 1090 12–258 12 M T D 844 1.4
Seitz et al. (2008)a
H. stenolepis 110–176 cm
AK L 25 PAT? 16 64 2004 180–365 193–206
12 M T D 748 2.6
Polovina et al. (2007)
Lampris guttatus (opah)
>30 kg C. Pac. L 16 PAT 15 94 2002–2003
180 450 6–168 12 F T W 600 <4
C. Pac 1 HR 1 100 2005 28? 23 40s F T W 736 5.2–25.6
0.90–14.4
vertical Kerstetter et al. (2008) a
Lepidocybium flavobruneum
(escolar)
122cm FL L 1 PAT3 1 100 2003 59 14 14 8 M N W 784 <12
Seitz et al. (2002b)
Masturus lanceolatus
100cm, 70kg
GOM L 1 PAT 1 100 2000 61 61 61 2 M W 700 6 0.41
(sharptail mola)
Epperly et al. (2007b)
turtles, drifters, groupers,
pelagic fish,
FL V 39 PAT4 33 85 2003 B
turtles, drifters, groupers,
pelagic fish,
FL V 96 PAT2 66 69
turtles, drifters, groupers,
pelagic fish,
FL V 78 PAT3 59 76

11
Source Species
(common name)
Size Location Gear No Model Rep % Date Set Pop (d)
DAL Range (d)
Int. (h) Tether Taghead W/D Depth (m)
Temp (°C)
Speed (km h–1)
Squid
Gilly et al. (2006)a
Dosidicus gigas
77–85 cm mantle L
Calif. Jig 10 PAT1, 3
7 70 2001, 2004–2005
38 3–8 1, 2 504
Drifter Buoys
Nielsen et al. (2006)
GPS drifter buoy
HI 2 PAT2 2 100 2002 270 270 1 F
aArticle was found during final editing of our paper and therefore not included in the meta-analysis
Other PSAT papers in the literature (data not included in our meta-analysis): Arrizabalaga & Pereira (2005) (Thunnus obesus; see Arrizabalaga et al. 2008), Block et al. (2001a,b) (T. thynnus; Block et al. 2005), Boustany et al. (2001) (T. thynnus; Block et al. 2005), De Metrio et al. (2001) (T. thynnus; De Metrio et al. 2005), De Metrio et al. (2002) (T. thynnus; De Metrio et al. 2005), Domeier (2006) (Tetrapturus audax), Domeier et al. (2005) (geolocations methods, T. thynnus), Epperly et al. (2007a) (Caretta caretta; attachment methods), Galuardi et al. (2008) (Thunnus thynnus, geolocation methods; Wilson et al. 2005), Grusha & Patterson (2005) (drag and hydrodynamics), Hays et al. (2007) (Cetorhinus maximus; Sims et al. 2003, 2006), Hoolihan (2005) (Istiophorus platyterus; Hoolihan & Luo 2007), Horodysky et al. (2007) (Te. albidus; Horodysky & Graves 2005, Kerstetter & Graves 2006), Kerstetter et al. (2004) (Lampris guttatus, Te. albidus; Kerstetter et al. 2003, Polovina et al. 2007), Luo et al. (2006) (Makaira nigricans; habitat envelopes; Prince et al. 2005, 2006b), Luo et al. (2008) (Megalops atlanticus, geolocation methods), Lutcavage et al. (2000a,b) (T. thynnus), Saito et al. (2004) (M. nigricans; Saito & Yokawa 2006), Sasso & Epperly (2007) (C. caretta; Epperly et al. 2007b), Seitz et al. 2002a (Hippoglossus stenolepis; Seitz et al. 2003), Seitz et al. (2005) (H. stenolepis; Seitz et al. 2003), Seitz et al. (2006) (H. stenolepis, geolocation methods), Sibert et al. (2006) (T. thynnus; Lutcavage et al. 1999), Teo et al. (2004) (Lamna ditropis, Prionace glauca; geolocation methods; Weng et al. 2005), Teo et al. (2007) (T. thynnus; Block et al. 2005).

12
Table S3. Pop-up satellite archival tag (PSAT) reporting rates modeled with logistic regression. The p-values are from likelihood ratio tests with and without the given variable. The best fitting model (i.e. AIC with lowest value) contains a habitat class and PSAT manufacturer interaction, which implies that there is a different odds ratio at each habitat class for each PSAT manufacturer (Microwave Telemetry = MT, Wildlife Computers = WC). Detailed descriptions for variables can be found in the main article (Materials and methods: Rationale for variable selection)
Reporting rate AIC Odds ratio p-value
Tagger + Habitat class + Manufacturer + Habitat class × Manufacturer + Pop-up year
696.0 0.678 Domeier vs. Swimmer 4.606 Lutcavage vs. Swimmer 0.700 Musyl vs. Swimmer 0.890 MT vs. WC (coastal) 0.596 MT vs. WC (epipelagic) 0.400 MT vs. WC (mesopelagic I) 0.268 MT vs. WC (mesopelagic II) 1.216 per pop-up year
<0.0001 (tagger) 0.0108 (habitat class × manufacturer) 0.2505 (habitat class) 0.6099 (manufacturer) 0.0191 (pop-up year)
Manufacturer + Pop-up year
717.7 0.293 MT vs. WC 1.361 per pop-up year
<0.0001 (manufacturer) <0.0001 (pop-up year)
Manufacturer + Tag production year
723.1 0.316 MT vs. WC 1.314 per production year
0.0001 (manufacturer) 0.0031 (tag production year)
Tagger 731.0 0.816 Domeier vs. Swimmer 1.016 Lutcavage vs. Swimmer 0.295 Musyl vs. Swimmer
<0.0001 (tagger)
Manufacturer 732.6 0.383 MT vs. WC <0.0001 (manufacturer) Manufacturer + Habitat class
733.4 0.407 MT vs. WC 0.925 per habitat class
<0.0001 (manufacturer) 0.4483 (habitat class)
Habitat class + Pop-up year
746.6 0.794 per habitat class 1.157 per year
0.0158 (habitat class) 0.0384 (pop-up year)
Habitat class 749.3 0.773 per habitat class 0.0064 Pop-up year 750.6 1.176 per year 0.0182 Tag production year 751.4 1.116 per year 0.1685 RD1500 751.9 0.658 RD1500 ‘no’ vs. ‘yes’ 0.0314 Sunspots 753.8 1.006 per sunspot 0.0422 Tag age 753.9 0.999 per year 0.0925 Pop-up period 754.5 0.999 per day 0.1917 Method 754.7 0.805 deck vs. water 0.3092
Pop-up season 755.8 0.72 1st vs. 4th quarter 1.19 2nd vs. 4th quarter 0.98 3rd vs. 4th quarter
0.2139

13
Table S4. Pop-up satellite archival tag (PSAT) retention modeled with Cox proportional hazards. Retention and hazard ratios quantify the change in risk compared to a baseline category. The p-values are from likelihood ratio tests with and without a given variable. The sample size shows 491 individuals and includes 40 sharks having PSATs affixed using tag heads. Lower values of AIC imply a better-fitting model. Detailed descriptions for variables can be found in the main article (Materials and methods: Rationale for variable selection)
Retention AIC Hazard ratio p-value
Tag head + Tether + Pop-up season + Tag production year + RD1500 + Manufacturer + Habitat class + |Latitude| + Habitat class × |Latitude|
4120.5 0.827 flopper vs. umbrella 8.480 nylon vs. umbrella 1.397 stainless steel vs. umbrella 1.806 titanium vs. umbrella 5.964 fluorocarbon vs. stainless steel 2.709 monofilament vs. stainless steel 3.173 monofilament + silicone tubing vs. stainless steel 0.947 1st vs. 4th quarter 0.901 2nd vs. 4th quarter 1.378 3rd vs. 4th quarter 1.215 per year 1.516 RD1500 ‘no’ vs. ‘yes’ 0.459 MT vs. WC 0.311 per habitat class 0.986 per degree of |latitude| HRb habitat class × |latitude|
<0.0001 (tag heada) <0.0001 (tether) 0.0278 (pop-up season) 0.0248 (tag production year) <0.0201 (RD1500) <0.0001 (manufacturer) <0.0001 (habitat class) 0.3418 (|latitude|) 0.0009 (habitat class × |latitude|)
Tag head + Tagger + Pop-up season + Habitat class + Manufacturer + RD1500
4138.2 0.454 flopper vs. umbrella 3.744 nylon vs. umbrella 0.888 stainless steel vs. umbrella 1.490 titanium vs. umbrella 0.314 Domeier vs. Musyl 0.782 Lutcavage vs. Musyl 0.844 1st vs. 4th quarter 0.859 2nd vs. 4th quarter 1.456 3rd vs. 4th quarter 0.635 per habitat class 0.452 MT vs. WC 1.661 RD1500 ‘no’ vs. ‘yes’
<<0.0001 (tag head) 0.0002 (tagger) 0.0012 (pop-up season) <0.0002 (habitat class) <0.0001 (manufacturer) 0.0041 (RD1500)
Tag head + Habitat class + |Latitude|
4173.8 1.337 flopper vs. umbrella 3.489 nylon vs. umbrella 0.953 stainless steel vs. umbrella 1.398 titanium vs. umbrella 0.672 per habitat class 1.020 per degree of |latitude|
<<0.0001 (tag head) <<0.0001 (habitat class) 0.0050 (|latitude|)
Tag head 4176.7 1.176 flopper vs. umbrella 2.948 nylon vs. umbrella 0.723 stainless vs. umbrella 1.041 titanium vs. umbrella
<<0.0001
Tag head + Tether + Manufacturer
4187.0 0.905 flopper vs. umbrella 2.953 nylon vs. umbrella 0.695 stainless vs. umbrella 1.365 titanium vs. umbrella 2.096 fluorocarbon vs. stainless steel 1.450 monofilament vs. stainless steel 1.906 monofilament + silicone tubing vs. stainless steel 0.658 MT vs. WC
<<0.0001 (tag head) 0.0255 (tether) 0.0023 (manufacturer)

14
Species 4208.9 5.053 bigeye tuna vs. bluefin tuna
0.217 bigeye thresher shark vs. bluefin 1.549 black marlin vs. bluefin tuna 1.365 blue marlin vs. bluefin tuna 0.403 great white shark vs. bluefin tuna 0.807 shortfin mako shark vs. bluefin 1.612 spearfish vs. bluefin tuna 1.804 striped marlin vs. bluefin tuna 1.428 swordfish vs. bluefin tuna 1.842 tarpon vs. bluefin tuna 2.253 yellowfin tuna vs. bluefin tuna
<0.0001
Region 4220.7 0.537 Australia vs. Panama 0.385 Baja vs. Panama 0.452 Central Pacific vs. Panama 2.313 Costa Rica vs. Panama 0.221 California vs. Panama 0.947 Ecuador vs. Panama 0.860 Florida vs. Panama 0.337 Gulf Maine vs. Panama 0.847 Hawaii vs. Panama 0.251 Louisiana vs. Panama 0.748 Mexico vs. Panama 0.592 N. Australia vs. Panama 1.140 North Carolina vs. Panama 0.193 New Zealand vs. Panama
<0.0001
Pop-up year 4226.6 0.895 per year 0.0078
Latitude 4236.6 0.988 per degree of latitude 0.0015
Habitat class 4237.1 0.790 per increase in habitat class <0.0001
Method 4242.9 1.329 deck vs. water 0.1354
Tagger
4251.7 1.059 Domeier vs. Musyl 0.767 Lutcavage vs. Musyl
0.0282
Tag production year 4252.7 0.905 per year 0.0330
Pop-up season 4253.1 0.960 1st vs. 4th quarter 0.725 2nd vs. 4th quarter 0.983 3rd vs. 4th quarter
0.0492
RD1500 4253.7 0.819 RD1500 ‘no’ vs. ‘yes’ 0.0602
Longitude 4254.3 0.998 per degree 0.0877
|Latitude| 4255.1 0.993 per degree 0.1434
Manufacturer 4255.2 0.570 MT vs. WC <0.0001
Tag age 4256.5 1.000 per day 0.4049
Swivel 4257.2 0.976 swivel ‘no’ vs. ‘yes’ 0.8876
Tether material 4257.2 0.781 fluorocarbon vs. stainless steel 0.693 monofilament vs. stainless steel 0.809 monofilament + silicone tubing vs. stainless steel
0.2463
aTag head was significantly associated with tether material (χ2 =14.21, p < 0.0001) and by tagger (χ 2 = 750.9, p < 0.0001)
bHazard ratios for the interaction effect between habitat class and |latitude|, can be computed as HR = exp(–1.16935 × Habitat class – 0.01361 × |Latitude| + 0.02644 × Habitat class × |Latitude|). These hazard ratios include the linear habitat class and |latitude| effects and range from 0.03 to 0.93 in comparison to the baseline in the littoral habitat zone at the equator

15
Table S5. Pop-up satellite archival tag (PSAT) retention modeled with Cox Proportional Hazards. Retention and hazard ratios quantify the change in risk compared to a baseline category. The p-values are from likelihood ratio tests with and without a given variable. The sample size is 80 sharks and includes PSATs affixed using tag heads and by harness. Lower values of AIC imply a better-fitting model. Detailed descriptions for variables can be found in the main article (Materials and methods: Rationale for variable selection)
Retention AIC Hazard ratio p-value Tagging method 382.1 2.568 deck vs. water 0.002 Tag head 382.7 1.68 flopper vs. umbrella
2.13 harness vs. umbrella 0.50 stainless vs. umbrella 10.66 nylon vs. umbrella
0.0064
Tagger 383.1 0.516 Domeier vs. Musyl 0.0437 Species 384.4 0.229 bigeye thresher shark vs. blue shark
2.228 silky shark vs. blue shark 0.779 oceanic whitetip shark vs. blue shark 0.443 great white shark vs. blue shark 0.960 shortfin mako shark vs. blue shark
0.0046
Region 385.5 0.455 Baja vs. Central Pacific 0.0113 Tether material 385.9 0.340 fluorocarbon vs. fluorocarbon + stainless steel
0.368 monofilament vs. fluorocarbon + stainless steel 0.561 monofilament + silicone tubing vs. fluorocarbon + stainless steel
0.0142
Latitude 385.9 0.953 per degree of latitude 0.006 Longitude 386.7 0.987 per degree 0.0544 Manufacturer 387.8 1.967 MT vs. WC 0.0405 Habitat class 387.4 0.566 per habitat class 0.0252 Swivel 388.2 0.543 swivel ‘no’ vs. ‘yes’ 0.0355 Sexa 388.3 1.077 female vs. male 0.8101 Pop-up year 390.0 1.150 per year 0.1144 Tag age 390.6 1.154 per day 0.1795 RD1500 392.5 1.038 RD1500 ‘no’ vs. ‘yes’ 0.8985 Pop-up season 393.7 0.570 1st vs. 4th quarter
1.229 2nd vs. 4th quarter 1.059 3rd vs. 4th quarter
0.4345
aSex determined for n = 57 sharks

16
Table S6. Reciprocals of the pop-up satellite archival tag (PSAT) reporting rates, summarized by habitat class and species from the authors’ database and literature sources. The sample size multipliers are reciprocals of the reporting rates from the database as summarized (rate, sample size n, standard error SE) in Table 1 of the main article and from the literature review as summarized (rate, n, SE) in Table 8 of the main article. A sample design which calls for n reporting tags should deploy n/(reporting rate) tags. For example, the sample size multiplier for tarpon can be found from the reciprocal of the reporting rate (Table 1 of the main article) as follows: 1/0.8 = 1.25. Therefore, to have a high probability of getting 10 tags to report, the researcher would need to deploy ~13 tags (i.e. 1.25 × 10). The 95% confidence limits for the tarpon sample size multiplier can be obtained with the standard error for reporting rate given in Table 1 of the main article: 95% CI = 1/(0.8 + 1.96 × 0.06), 1/(0.8 – 1.96 × 0.06) or 1.09, 1.47
Habitat class Species Authors’ database Literature review Coastal Tarpon 1.25 Longfinned eel 1.27 Total 1.25 1.27 Epipelagic Albacore tuna 3.00 Black marlin 1.16 1.33 Blue marlin 1.20 1.38 Green turtle 1.00 Loggerhead turtle 1.15 Oceanic white-tip shark 1.23 Olive ridley 1.25 Sailfish 1.00 1.20 Silky shark 1.00 Striped marlin 1.22 1.18 White marlin 1.17 Total 1.19 1.24 Mesopelagic I Blue shark 2.00 1.65 Great white shark 1.33 1.36 Greenland shark 1.00 Tiger shark 1.00 Whale shark 1.50 Yellowfin tuna 1.19 Total 1.46 1.43 Mesopelagic II Basking shark 2.08 Bigeye thresher shark 2.63 1.00 Bigeye tuna 2.00 1.11 Bluefin tuna, atlantic 1.16 1.28 Bluefin tuna, pacific 1.00 Halibut 2.80 Leatherback turtle 1.90 Opah 1.06 Salmon shark 1.25 Sharptail mola 1.00 Shortfin mako shark 2.50 1.00 Swordfish 2.13 1.29 Total 1.34 1.33
17
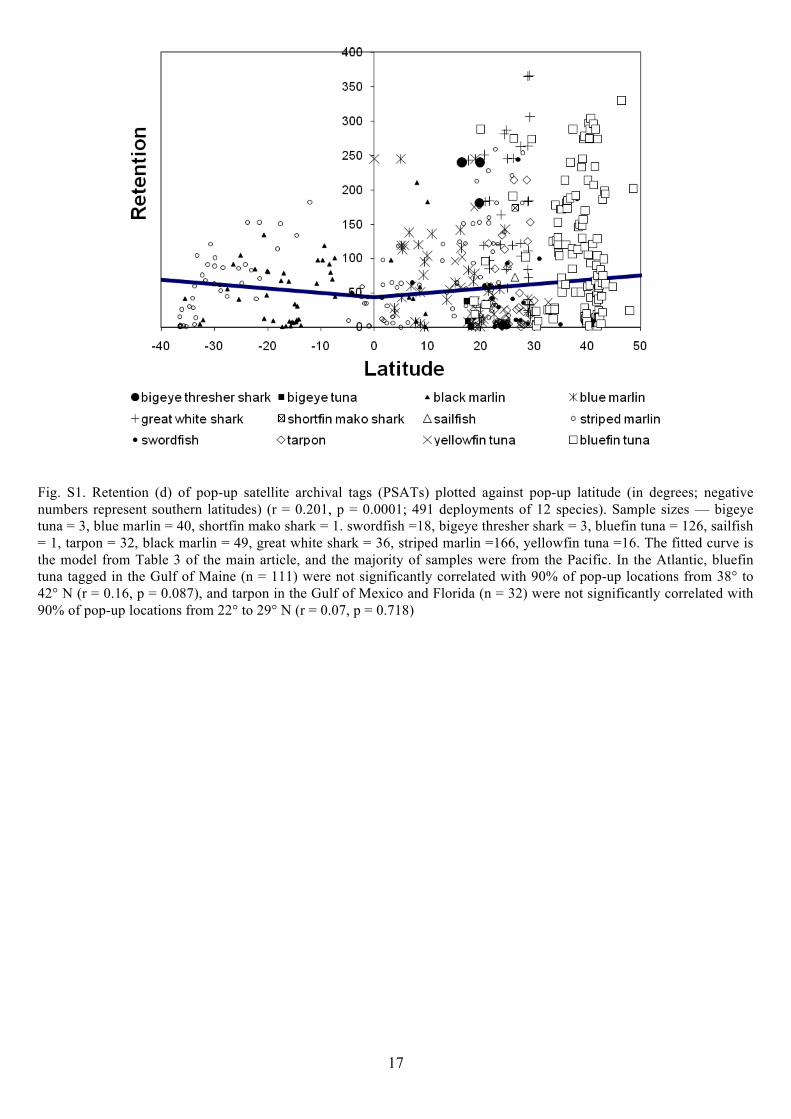
Fig. S1. Retention (d) of pop-up satellite archival tags (PSATs) plotted against pop-up latitude (in degrees; negative numbers represent southern latitudes) (r = 0.201, p = 0.0001; 491 deployments of 12 species). Sample sizes — bigeye tuna = 3, blue marlin = 40, shortfin mako shark = 1. swordfish =18, bigeye thresher shark = 3, bluefin tuna = 126, sailfish = 1, tarpon = 32, black marlin = 49, great white shark = 36, striped marlin =166, yellowfin tuna =16. The fitted curve is the model from Table 3 of the main article, and the majority of samples were from the Pacific. In the Atlantic, bluefin tuna tagged in the Gulf of Maine (n = 111) were not significantly correlated with 90% of pop-up locations from 38° to 42° N (r = 0.16, p = 0.087), and tarpon in the Gulf of Mexico and Florida (n = 32) were not significantly correlated with 90% of pop-up locations from 22° to 29° N (r = 0.07, p = 0.718)

18
Fig. S2. Bootstrap distributions of pop-up satellite archival tag (PSAT) reporting rates as reported in the literature review, broken down by habitat class. A binomial distribution was assumed with reporting rates and sample sizes taken from the literature review (Table S2). Reporting rates were resampled 3000 times and after each iteration recomputed the habitat class reporting rates. Bootstrap 95% confidence intervals for habitat class reporting rates were: coastal = 0.571, 1.000, epipelagic = 0.771, 0.847, mesopelagic I = 0.621, 0.776, mesopelagic II = 0.729, 0.778
Coastal
Epipelagic
Mesopelagic I
Mesopelagic II
PSAT reporting rate

19
Fig. S3. Bootstrap distributions of pop-up satellite archival tag (PSAT) reporting rates for 18 species given in Table S2. We excluded 5 species with 100% reporting rates from the bootstrap analysis. The number of studies per species is shown in the plot label. Bootstrap analysis follows that described in Table 7 of the main article

20
Fig. S4. Indicative seasonal distribution of chlorophyll a (mg m–3) based on SeaWIFS data taken from NOAA Central Pacific Live Access Server at oceanwatch.pifsc.noaa.gov. The majority of the PSATs were deployed in the Pacific (n = 367) from 2002 to 2003. Overall, 90% of the pop-up latitudes spanned from 32.26° N to 32.29° S (50% from 24.78° N to 6.92° N) with 90% of the pop-up longitudes from 148.70° E to 109.32° W (50% from 112.92° W to 168.43° W). Of note is the temporal consistency of the band around the Equator. In our Cox proportional hazard model examining retention (Table 3 in the main article), season was a significant factor in the models, with the months of June, July, and August identified as being the riskiest for retention. These months also correlated with the highest concentrations of chl a (see upper-right panel)
21
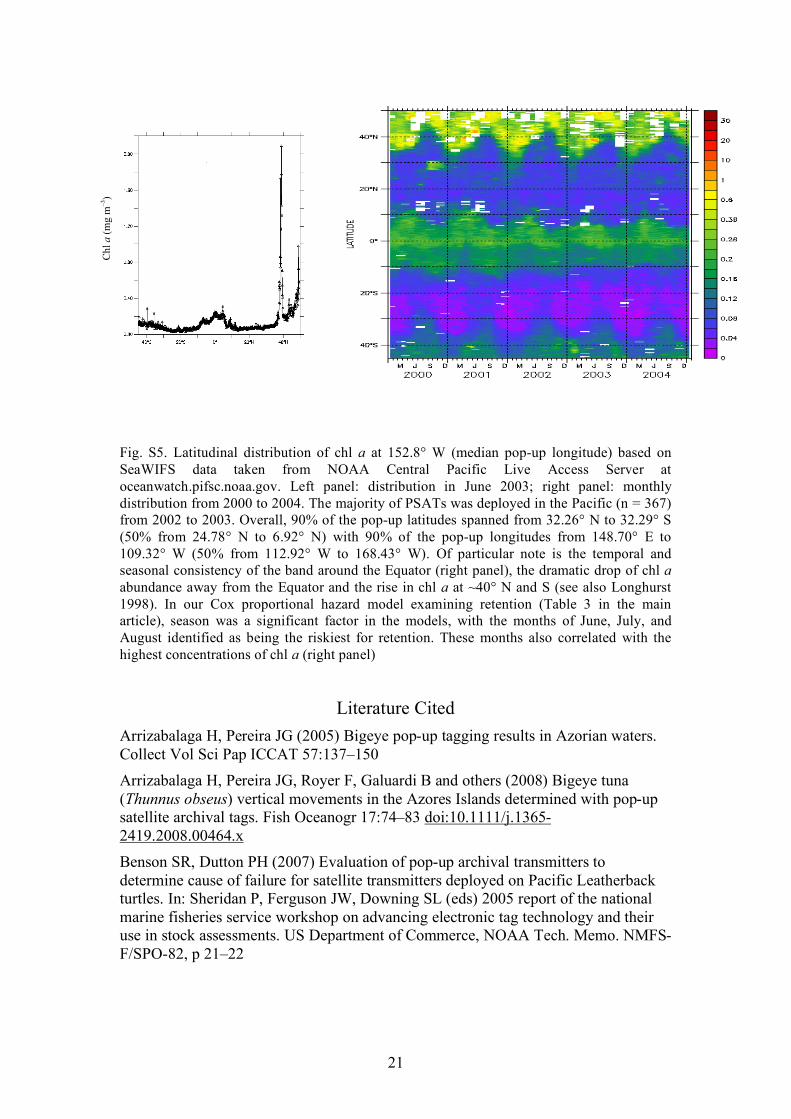
Fig. S5. Latitudinal distribution of chl a at 152.8° W (median pop-up longitude) based on SeaWIFS data taken from NOAA Central Pacific Live Access Server at oceanwatch.pifsc.noaa.gov. Left panel: distribution in June 2003; right panel: monthly distribution from 2000 to 2004. The majority of PSATs was deployed in the Pacific (n = 367) from 2002 to 2003. Overall, 90% of the pop-up latitudes spanned from 32.26° N to 32.29° S (50% from 24.78° N to 6.92° N) with 90% of the pop-up longitudes from 148.70° E to 109.32° W (50% from 112.92° W to 168.43° W). Of particular note is the temporal and seasonal consistency of the band around the Equator (right panel), the dramatic drop of chl a abundance away from the Equator and the rise in chl a at ~40° N and S (see also Longhurst 1998). In our Cox proportional hazard model examining retention (Table 3 in the main article), season was a significant factor in the models, with the months of June, July, and August identified as being the riskiest for retention. These months also correlated with the highest concentrations of chl a (right panel)
Literature Cited
Arrizabalaga H, Pereira JG (2005) Bigeye pop-up tagging results in Azorian waters. Collect Vol Sci Pap ICCAT 57:137–150
Arrizabalaga H, Pereira JG, Royer F, Galuardi B and others (2008) Bigeye tuna (Thunnus obseus) vertical movements in the Azores Islands determined with pop-up satellite archival tags. Fish Oceanogr 17:74–83 doi:10.1111/j.1365-2419.2008.00464.x
Benson SR, Dutton PH (2007) Evaluation of pop-up archival transmitters to determine cause of failure for satellite transmitters deployed on Pacific Leatherback turtles. In: Sheridan P, Ferguson JW, Downing SL (eds) 2005 report of the national marine fisheries service workshop on advancing electronic tag technology and their use in stock assessments. US Department of Commerce, NOAA Tech. Memo. NMFS-F/SPO-82, p 21–22
Chl
a (
mg
m–3
)
22
Block BA, Dewar H, Farwell C, Prince ED (1998) A new satellite technology for tracking the movements of Atlantic bluefin tuna. Proc Natl Acad Sci USA 95:9384–9389 PubMed doi:10.1073/pnas.95.16.9384
Block BA, Dewar H, Blackwell SB, Williams T and others (2001a) Archival and pop-up satellite tagging of Atlantic Bluefin tuna. In: Sibert JR, Nielsen JL (eds) Reviews: methods and technologies in fish biology and fisheries. Electronic tagging and tracking in marine fisheries. Kluwer Academic Publishers, Dordrecht, p 65–88
Block BA, Dewar H, Blackwell SB, Williams TD and others (2001b) Migratory movements, depth preferences and thermal biology of Atlantic bluefin tuna. Science 293:1310–1314 PubMed doi:10.1126/science.1061197
Block BA, Teo SLH, Walli A, Boustany A and others (2005) Electronic tagging and population structure of Atlantic bluefin tuna. Nature 434:1121–1127 PubMed doi:10.1038/nature03463
Bonfil R, Meyer M, Scholl MC, Johnson R and others (2005) Transoceanic migration, spatial dynamics, and population linkages of white sharks. Science 310:100–103 PubMed doi:10.1126/science.1114898
Boustany AM, Marcinek DJ, Keen J, Dewar H, Block BA (2001) Movements and temperature preferences of Atlantic bluefin tuna (Thunnus thynnus) off North Carolina: a comparison of acoustic, archival and pop-up satellite tags. In: Sibert JR, Nielsen JL (eds) Reviews: methods and technologies in fish biology and fisheries. Electronic tagging and tracking in marine fisheries. Kluwer Academic Publishers, Dordrecht, p 89–108
Boustany AM, Davis SF, Pyle P, Anderson SD, LeBoeuf BJ, Block BA (2002) Expanded niche for white sharks. Nature 415:35–36 PubMed doi:10.1038/415035b
De Metrio G, Arnold GP, de la Serna JM, Yannopoulos C, Megalofonou P, Buckley AA, Pappalepore M (2001) Further results of tagging Mediterranean bluefin tuna with pop-up satellite-detected tags. Collect Vol Sci Pap ICCAT 52:776–783
De Metrio G, Arnold GP, Block BA, de la Serna JM and others (2002) Behavior of post-spawning Atlantic bluefin tuna tagged with pop-up satellite tags in the Mediterranean and Eastern Atlantic. Collect Vol Sci Pap ICCAT 54:415–424
De Metrio GD, Oray I, Arnold GP, Lutcavage M and others (2004) Joint Turkish-Italian research in the eastern Mediterranean: bluefin tuna tagging with pop-up satellite tags. Collect Vol Sci Pap ICCAT 56:1163–1168
De Metrio GP, Arnold GP, de la Serna JM, Block BA and others (2005) Movements of bluefin tuna (Thunnus thynnus L.) tagged in the Mediterranean Sea with pop-up satellite archival tags. Collect Vol Sci Pap ICCAT 58:1337–1339
Dewar H, Domeier M, Nasby-Lucas N (2004) Insights into young of the year white shark, Carcharodon carcharias, behavior in the Southern California bight. Environ Biol Fishes 70:133–143 doi:10.1023/B:EBFI.0000029343.54027.6a
Domeier ML (2006) An analysis of Pacific striped marlin (Tetrapturus audax) horizontal movement patterns using pop-up satellite archival tags. Bull Mar Sci 79:811–825

23
Domeier ML, Dewar H, Nasby-Lucas N (2003) Mortality rate of striped marlin (Tetrapturus audax) caught with recreational tackle. Mar Freshw Res 54:435–445 doi:10.1071/MF01270
Domeier ML, Kiefer D, Nasby-Lucas N, Wagschal A, O'Brien F (2005) Tracking Pacific bluefin (Thunnus tynnus orientalis) in the northeastern Pacific with an automated algorithm that estimates latitude by matching sea-surface temperature data from satellites with temperature data from tags on fish. Fish Bull 103:292–306
Domokos R, Seki MP, Polovina JJ, Hawn DR (2007) Oceanographic Investigation of the American Samoa albacore (Thunnus alalunga) habitat and longline fishing grounds. Fish Oceanogr 16:555–572 doi:10.1111/j.1365-2419.2007.00451.x
Epperly SP, Wyneken J, Flanagan JP, Harms CA, Higgins B (2007a) Attachment of pop-up archival transmitting (PAT) tags to loggerhead sea turtles (Caretta caretta). Herpetol Rev 38:419–425
Epperly S, Sasso C, Prince E, Rivero C and others (2007b) Pop-up archival transmitting tags and their application to the loggerhead sea turtle survival studies. In: Sheridan P, Ferguson JW, Downing SL (eds) Report of the National Marine Fisheries Service Workshop on Advancing electronic Tag Technology and Their use in stock assessments. US Department of Commerce, NOAA Tech. Memo. NMFS-F/SPO-82, p 23
Galuardi B, Nielsen A, Lutcavage M (2008) Optimizing smoothed sea surface temperature for improving archival tag geolocation. Mar Ecol Prog Ser 365:35–44 doi:10.3354/meps07497
Gilly WF, Markaida U, Baxter CH, Block BA and others (2006) Vertical and horizontal migrations by the jumbo squid Dosidicus gigas revealed by electronic tagging. Mar Ecol Prog Ser 324:1–17 doi:10.3354/meps324001
Goodyear CP, Luo J, Prince ED, Hoolihand JP, Snodgrass D, Orbesen ES, Serafy JE (2008) Vertical habitat use of the Atlantic blue marlin Maskaira nigricans: interaction with pelagic longline gear. Fish Oceanogr 365:233–245
Graves JE, Luckhurst BE, Prince ED (2002) An evaluation of pop-up satellite tags for estimating postrelease survival of blue marlin (Makaira nigricans) from a recreational fishery. Fish Bull 100:134–142
Grusha DS, Patterson MR (2005) Quantification of drag and lift imposed by pop-up satellite archival tags and estimation of the metabolic cost to cownose rays (Rhinoptera bonasus). Fish Bull 103:63–70
Gunn JS, Patterson TA, Pepperell JG (2003) Short-term movement and behavior of black marlin Makaira indica in the Coral Sea as determined through a pop-up satellite archival tagging experiment. Mar Freshw Res 54:515–525 doi:10.1071/MF03022
Hays GC, Bradshaw CJA, James MC, Lovell P, Sims DW (2007) Why do Argos satellite tags deployed on marine animals stop transmitting? J Exp Mar Biol Ecol 349:52–60 doi:10.1016/j.jembe.2007.04.016
Holdsworth JC, Sipple TJ, Block BA (2009) Near time satellite tracking of striped marlin (Kajikia audax) movements in the Pacific Ocean. Mar Biol 156:505–514 doi:10.1007/s00227-008-1104-y

24
Holland KN, Bush A, Meyer CG, Kajiura S, Wetherbee BM, Lowe CG (2001) Five tags applied to a single species in a single location: the tiger shark experience. In: Sibert JR, Nielsen JL (eds) Reviews: methods and technologies in fish biology and fisheries. Electronic tagging and tracking in marine fisheries. Kluwer Academic Publishers, Dordrecht, p 237–247
Hoolihan JP (2005) Horizontal and vertical movements of sailfish (Istiophorus platypterus) in the Arabian Gulf, determined by ultrasonic and pop-up satellite tagging. Mar Biol 146:1015–1029 doi:10.1007/s00227-004-1488-2
Hoolihan JP, Luo J (2007) Determining summer residence status and vertical habitat use of sailfish (Istiophorus platypterus) in the Arabian Gulf. ICES J Mar Sci 64:1791–1799 doi:10.1093/icesjms/fsm148
Horodysky AZ, Graves JE (2005) Application of pop-up satellite archival tag technology to estimate postrelease survival of white marlin (Tetrapturus albidus) caught on circle and straight-shank (“J”) hooks in the western North Atlantic recreational fishery. Fish Bull 103:84–96
Horodysky AZ, Kerstetter DW, Latour RJ, Graves JE (2007) Habitat utilization and vertical movements of white marlin (Tetrapturus albidus) released from commercial and recreational fishing gears in the western North Atlantic Ocean: inferences from short duration pop-up satellite archival tags. Fish Oceanogr 16:240–256 doi:10.1111/j.1365-2419.2007.00419.x
Hulbert LB, Sigler MF, Lunsford CR (2006) Depth and movement behavior of the Pacific sleeper shark in the north-east Pacific Ocean. J Fish Biol 69:406–425 doi:10.1111/j.1095-8649.2006.01175.x
Jellyman D, Tsukamoto K (2002) First use of archival transmitters to track migrating freshwater eels Anguilla dieffenbachii at sea. Mar Ecol Prog Ser 233:207–215 doi:10.3354/meps233207
Jellyman D, Tsukamoto K (2005) Swimming depths of offshore migrating longfin eels Anguilla dieffenbachia. Mar Ecol Prog Ser 286:261–267 doi:10.3354/meps286261
Kerstetter DW, Graves JE (2006) Survival of white marlin (Tetrapturus albidus) released from commercial longline gear in the western North Atlantic. Fish Bull 104:434–444
Kerstetter DW, Graves JE (2008) Postrelease survival of sailfish caught by commercial pelagic longline gear in the southern Gulf of Mexico. N Am J Fish Manag 28:1578–1586 doi:10.1577/M07-202.1
Kerstetter DW, Luckhurst BE, Prince ED, Graves JE (2003) Use of pop-up satellite archival tags to demonstrate survival of blue marlin (Makaira nigricans) released from pelagic longline gear. Fish Bull 101:939–948
Kerstetter DW, Polovina JJ, Graves JE (2004) Evidence of shark predation and scavenging on fishes equipped with pop-up satellite archival tags. Fish Bull 102:750–756
Kerstetter DW, Rice PH, Snodgrass D, Prince ED (2008) Behavior of an escolar Lepidocybium flavobrunneum in the windward passage as determined by popup satellite archival tags. Gulf Caribb Res 20:97–102
25
Le Port A, Sipple T, Montgomery JC (2008) Observations of mesoscale movements in the short-tailed stingray, Dasyatis brevicaudata from New Zealand using a novel PSAT tag attachment method. J Exp Mar Biol Ecol 359:110–117 doi:10.1016/j.jembe.2008.02.024
Loefer JK, Sedberry GR, McGovern JC (2005) Vertical movements of a shortfin mako in the western North Atlantic as determined by pop-up satellite tagging. Southeast Nat 4:237–246 doi:10.1656/1528-7092(2005)004[0237:VMOASM]2.0.CO;2
Loher T, Seitz A (2006) Seasonal migration and environmental conditions of Pacific halibut Hippoglossus stenolepis, elucidated from pop-up archival transmitting (PAT) tags. Mar Ecol Prog Ser 317:259–271 doi:10.3354/meps317259
Longhurst A (1998) Ecological geography of the sea. Academic Press, San Diego, CA
Luo J, Prince ED, Goodyear CP, Luckhurst BE, Serafy JE (2006) Vertical habitat utilization by large pelagic animals: a quantitative framework and numerical method for use with pop-up satellite data. Fish Oceanogr 15:208–229 doi:10.1111/j.1365-2419.2006.00360.x
Luo J, Ault JS, Larkin MF, Barbieri LR (2008) Salinity measurements from pop-up archival transmitting (PAT) tags and their application to geolocation estimation for Atlantic tarpon. Mar Ecol Prog Ser 357:101–109 doi:10.3354/meps07288
Lutcavage ME, Brill RW, Skomal GB, Chase BC, Howey PW (1999) Results of pop-up satellite tagging of spawning size class fish in the Gulf of Maine: do North Atlantic bluefin tuna spawn in the mid-Atlantic? Can J Fish Aquat Sci 56:173–177 doi:10.1139/f99-016
Lutcavage ME, Brill RW, Porter J, Skomal GB, Chase BC, Howey PW, Murray E Jr (2000a) Preliminary results from the joint US-Canadian pop-up satellite tagging of giant bluefin tuna in the Gulf of Maine and Canadian Atlantic Region, 1998-1999. Collect Vol Sci Pap ICCAT 50:347–354
Lutcavage ME, Brill RW, Porter J, Howey P and others (2000b) Summary of pop-up tagging of giant bluefin in the joint US-Canadian program, Gulf of Maine and Canadian Atlantic. ICCAT SCRS/00/95. ICCAT, Madrid
Marcinek DJ, Blackwell SB, Dewar H, Freund EV and others (2001) Depth and muscle temperature of Pacific bluefin tuna examined with acoustic and pop-up satellite archival tags. Mar Biol 138:869–885 doi:10.1007/s002270000492
Matsumoto T, Miyabe N, Saito H, Okazaki M, Chow S (2002) Report of 2000–2001 research cruise by R/V Shoyo-Maru conducted under the ICCAT's BETYP. Collect Vol Sci Pap ICCAT 54:68–90
Matsumoto T, Saito H, Miyabe N (2003) Report of observer program for Japanese tuna longline fishery in the Atlantic Ocean from September 2001 to March 2002. Collect Vol Sci Pap ICCAT 55:1679–1718
Matsumoto T, Saito H, Miyabe N (2004) Report of the observer program for the Japanese tuna longline fishery in the Atlantic Ocean from September 2002 to January 2003. Collect Vol Sci Pap ICCAT 56:254–281
26
Matsumoto T, Saito H, Miyabe N (2005) Swimming behavior of adult bigeye tuna using pop-up tags in the central Atlantic Ocean. Collect Vol Sci Pap ICCAT 57:151–170
Nielsen A, Bigelow KA, Musyl MK, Sibert JR (2006) Improving light-based geolocation by including sea surface temperature. Fish Oceanogr 15:314–325 doi:10.1111/j.1365-2419.2005.00401.x
Polovina JJ, Hawn D, Abecassis M (2007) Vertical movement and habitat of opah (Lampris guttatus) in the central North Pacific recorded with pop-up archival tags. Mar Biol 153:257–267 doi:10.1007/s00227-007-0801-2
Prince ED, Goodyear CP (2006a) Hypoxia-based habitat compression of tropical pelagic fishes. Fish Oceanogr 15:451–466 doi:10.1111/j.1365-2419.2005.00393.x
Prince ED, Cowen RK, Orbesen ES, Luthy SA, Llopiz JK, Richardson DE, Serafy JE (2005) Movements and spawning of white marlin (Tetraptturus albidus) and blue marlin (Makaira nigricans) off Punta Cana, Dominican Republic. Fish Bull 103:659–669
Prince ED, Holts DB, Snodgrass D, Orbesen ES, Luo J, Domeier ML, Serafy JE (2006b) Transboundary movement of sailfish Istiophorus platypterus, off the Pacific coast of Central America. Bull Mar Sci 79:827–838
Saito H, Yokawa K (2006) Use of pop-up tags to estimate vertical distribution of Atlantic blue marlin (Makaira nigricans) released from the commercial and research longline cruise during 2002 and 2003. Collect Vol Sci Pap ICCAT 59:252–264
Saito H, Takeuchi Y, Yokawa K (2004) Vertical distribution of Atlantic blue marlin obtained from pop-up archival tags in the tropical Atlantic Ocean. Collect Vol Sci Pap ICCAT 56:201–211
Sasso CR, Epperly SP (2007) Survival of pelagic juvenile loggerhead turtles in the open ocean. J Wildl Manag 71:1830–1835 doi:10.2193/2006-448
Sedberry GR, Loefer JK (2001) Satellite telemetry tracking of swordfish, Xiphias gladius, off the eastern United States. Mar Biol 139:355–360 doi:10.1007/s002270100593
Seitz A, Wilson D, Nielsen JL (2002a) Testing pop-up satellite tags as a tool for identifying critical habitat for Pacific halibut (Hippoglossus stenolepis) in the Gulf of Alaska. Exxon Valdez oil spill restoration project final report (Restoration Project 01478), US Geological Survey, Alaska Biological Science Centre, Anchorage, AK
Seitz AC, Weng KC, Boustany AM, Block BA (2002b) Behavior of sharptail mola in the Gulf of Mexico. J Fish Biol 60:1597–1602 doi:10.1111/j.1095-8649.2002.tb02452.x
Seitz AC, Wilson D, Norcross BL, Nielsen JL (2003) Pop-up archival transmitting (PAT) tags: a method to investigate the migration and behavior of Pacific halibut, Hippoglossus stenolepis in the Gulf of Alaska. Alsk Fish Res Bull 10:124–136
Seitz AC, Norcross BL, Wilson D, Nielsen JL (2005) Identifying spawning behavior in Pacific halibut, Hippoglossus stenolepis, using electronic tags. Environ Biol Fishes 73:445–451 doi:10.1007/s10641-005-3216-2

27
Seitz AC, Wilson D, Norcross BL, Nielsen JL (2006) Evaluating light-based geolocation for estimating demersal fish movements in high latitudes. Fish Bull 104:571–578
Seitz AC, Loher T, Nielsen JL (2007) Seasonal movements and environmental conditions experienced by Pacific halibut in the Bering Sea, examined by pop-up satellite tags. Scientific report 84. International Pacific Halibut Commission, Seattle, WA
Seitz AC, Loher T, Nielsen JL (2008) Seasonal movements and environmental conditions experienced by Pacific halibut along the Aleutian Islands, examined by pop-up satellite tags. Scientific report 85. International Pacific Halibut Commission, Seattle, WA
Sibert JR, Lutcavage ME, Nielsen A, Brill RW, Wilson SG (2006) Interannual variation in large-scale movement of Atlantic bluefin tuna (Thunnus thynnus) determined from pop-up satellite archival tags. Can J Fish Aquat Sci 63:2154–2166 doi:10.1139/f06-114
Sims DW, Southall EJ, Richardson AJ, Reid PC, Metcalfe JD (2003) Seasonal movements and behavior of basking sharks from archival tagging: no evidence of winter hibernation. Mar Ecol Prog Ser 248:187–196 doi:10.3354/meps248187
Sims DW, Witt MJ, Richardson AJ, Southall EJ, Metcalfe JD (2006) Encounter success of free-ranging marine predator movements across a dynamic prey landscape. Proc Biol Sci 273:1195–1201 PubMed doi:10.1098/rspb.2005.3444
Sippel TJ, Davie PS, Holdsworth JC, Block BA (2007) Striped marlin (Tetrapturus audax) movements and habitat utilization during a summer and autumn in the southwest Pacific Ocean. Fish Oceanogr 16:459–472 doi:10.1111/j.1365-2419.2007.00446.x
Stokesbury MJW, Teo SLH, Seitz A, O'Dor RK, Block BA (2004) Movement of Atlantic bluefin tuna (Thunnus thynnus) as determined by satellite tagging experiments initiated off New England. Can J Fish Aquat Sci 61:1976–1987 doi:10.1139/f04-130
Stokesbury MJW, Harvey-Clark C, Gallant J, Block BA, Myers RA (2005) Movement and environmental preferences of Greenland shark (Somniosus microcephalus) electronically tagged in the St. Lawrence Estuary, Canada. Mar Biol 148:159–165 doi:10.1007/s00227-005-0061-y
Teo SLH, Boustany A, Blackwell S, Walli A, Weng KC, Block BA (2004) Validation of geolocation estimates based on light level and sea surface temperature from electronic tags. Mar Ecol Prog Ser 283:81–98 doi:10.3354/meps283081
Teo SLH, Boustany A, Dewar H, Stokesbury MJW and others (2007) Annual migrations, diving behavior, and thermal biology of Atlantic bluefin tuna, Thunnus thynnus, on their Gulf of Mexico breeding grounds. Mar Biol 151:1–18 doi:10.1007/s00227-006-0447-5
Weng KC, Block BA (2004) Diel vertical migration of the bigeye thresher shark (Alopias superciliosus), a species possessing orbital retia mirabilia. Fish Bull 102:221–229

28
Weng KC, Castilho PC, Morrissette JM, Landeira-Fernandez AM and others (2005) Satellite tagging and cardiac physiology reveal niche expansion in salmon sharks. Science 310:104–106 PubMed doi:10.1126/science.1114616
Weng KC, Boustany AM, Pyle P, Anderson SD, Brown A, Block BA (2007a) Migration and habitat of white sharks (Carcharodon carcharias) in the eastern Pacific Ocean. Mar Biol 152:877–894 doi:10.1007/s00227-007-0739-4
Weng KC, O'Sullivan JB, Lowe CG, Winkler CE, Dewar H, Block BA (2007b) Movements, behavior and habitat preferences of juvenile white sharks Carcharodon carcharias in the eastern Pacific. Mar Ecol Prog Ser 338:211–224 doi:10.3354/meps338211
Weng KC, Stokesbury MJW, Boustany AM, Seitz AC, Teo SLH, Miller SK, Block BA (2009) Habitat and behaviour of yellowfin tuna Thunnus albacres in the Gulf of Mexico determined using pop-up satellite archival tags. J Fish Biol 74:1434–1449 PubMed doi:10.1111/j.1095-8649.2009.02209.x
Wilson SG, Lutcavage ME, Brill RW, Genovese MP, Cooper AB, Everly AW (2005) Movements of bluefin tuna (Thunnus thynnus) in the northwestern Atlantic Ocean recorded by pop-up satellite archival tags. Mar Biol 146:409–423 doi:10.1007/s00227-004-1445-0
Wilson SG, Polovina JJ, Stewart BS, Meekan MG (2006) Movements of whale sharks (Rhincodon typus) tagged at Nigaloo Reef, Western Australia. Mar Biol 148:1157–1166 doi:10.1007/s00227-005-0153-8 Wilson SG, Stewart BS, Polovina JJ, Meekan MG, Stevens JD, Galuardi B (2007) Accuracy and precision of archival tag data: a multiple-tagging study conducted on a whale shark (Rhinocodon typus) in the Indian Ocean. Fish Oceanogr 16:547–554 doi:10.1111/j.1365-2419.2007.00450.x