performance of pers at the kalvehave test site · of pers at the kalvehave test site rapport nr....
TRANSCRIPT

Performance of PERS at the Kalvehave test siteRapport nr. 514

Performance of PERS at the Kalvehave test
site
Authors:
Hans Bendtsen, Rasmus Stahlfest Holck Skov,
Bent Andersen, Erik Olesen, Annette Neidel
and Jørn Raaberg, Danish Road Directorate
Julien Cesbron, IFSTTAR.
Date:
May 2014
ISBN (NET):
978-87-93184-26-8
Copyright:
Vejdirektoratet, 2014
PoroElastic Road SUrface: an innovation to Avoid Damages to the Environment
Preface 4
Forord 5
Summary 6
Sammenfatning 8
1. Introduction 101.1 The test site 101.2 The construction of the test pavement 121.3 Measurement program 14
2. Friction measurements 152.1 Pendulum 152.2 Portable Friction Tester 162.3 ROAR friction tester 172.4 Summing up on friction 18
3. Noise measurements 193.1 SPB roadside measurements 193.2 CPX trailer measurements 23 3.2.1 Measurements with the standard reference tyre SRTT 23 3.2.2 Measurements with special tyres 253.3 Acoustical absorption 263.4 Summing up on noise 26
4. Surface chaaracteristics 284.1 Surface texture 28 4.1.1 In-situ-texture laser measurements 29 4.1.2 Trailer laser measurements 324.2 Permeability 334.3 Mechanical impedance 34 4.3.1 Measurement principle 34 4.3.2 Materials and methods 35 4.3.3 Results and discussion 36 4.3.4 Conclusions on mechanical impedance 404.4 Evenness of the pavement 424.5 Summing up on surface characteristics 42
Contents5. Microscopy and image analysis 43
5.1 Estimation of built in air void 435.2 Investigation of the pavement structure 43
6. Rolling resistance 45
7. Visual inspection 467.1 After 32 days 467.2 After 70 days 477.3 After 173 days 48 7.3.1 Ravelling 48 7.3.2 Snow plough effect 517.4 After 213 days 53
8. Conclusions 55
9. References 57
Appendix A: Thin sections Kalvehave core 1 58
Appendix B: Thin sections Kalvehave core 2 60

4
The PERSUADE project aims at developing the experi-mental concept of poroelastic road surfacing (PERS) into a feasible noise-abatement measure as an alternative to, for example, noise barriers. It is expected that PERS may provide substantially higher noise reductions than the best of conventional paving materials. The specific feature of this new type of road surfacing is that it includes a substantial proportion of rubber granulates from recycled car tyres bound with a synthetic resin, such as polyurethane.
PERSUADE is the acronym for PoroElastic Road SUrface: an innovation to Avoid Damage to the Environment. The project programme comprises an extensive investigation in the laboratory to develop a durable mixture, the construction of seven test sections in five partner countries, a monitoring effort for the test sections (noise, rolling resistance, skid re-sistance, durability, winter behaviour, etc.), and a study of all conceivable environmental and economic aspects. The pro-ject has been scheduled for a duration of six years. Twelve partners from seven European countries are cooperating in this project, including research institutes, universities and companies representing the involved industry sectors:
• Belgian Road Research Centre (BRRC), Project coor-dinator
• Swedish National Road and Transport Research Insti-tute (VTI)
• Danish Road Directorate (DRD)
• NCC Roads AS (NCC)
• Slovenian National Building and Civil Engineering Insti-tute (ZAG)
• Polish Road and Bridge Research Institute (IBDiM)
• Technical University of Gdansk (TUG)
• Dura Vermeer Infrastructuur NV (DVI)
• European Tyre Recyclers Association (ETRA)
• HET Elastomertechnik GmbH (HET)
• Katholieke Universiteit Leuven (KULeuven)
• The French Institute of Science and Technology for Transport, Development and Networks (IFSTTAR)
See also the PERSUADE website at http://persuade.fehrl.org/
This report has been produced within Work Package WP 5 of the project, which deals with "Monitoring of test sections” and is led by the Danish Road Directorate (DRD). This report presents and evaluates results of measurements on the full scale PERS test section constructed by NCC at the Kalvehave test site in Denmark in August 2013. The meas-urements are performed by DRD, IFSTTAR, VTI and TUG. The report is deliverable D.5.1: “Report on results of initial measurements” in the PERSUADE project. The report has been produced by researchers from the DRD and IFSTTAR with support from VTI and TUG.
The authors would like to thank the enthusiastic DRD, IFSTTAR, VTI and TUG staff for their work in performing measurements and analysis. The authors are solely respon-sible for the contents of this document. The report has been reviewed by Luc Goubert from the Belgian Road Research Institute (BRRC).
This work is financed by the European Commission as well as by the Danish, French, Swedish and Polish partners. The authors are grateful for the financial support for the major part of this project from the European Commission though its 7th Framework Programme.
Preface
Preface

5
Forord
• Technical University of Gdansk (TUG)
• Dura Vermeer Infrastructuur NV (DVI)
• European Tyre Recyclers Association (ETRA)
• HET Elastomertechnik GmbH (HET)
• Katholieke Universiteit Leuven (KULeuven)
• The French Institute of Science and Technology for Transport, Development and Networks (IFSTTAR)
Yderligere oplysninger om PERSUADE findes på hjemmesi-den: http://persuade.fehrl.org/
Denne rapport er blevet udarbejdet i projektets arbejds-pakke 5, omhandlende målinger og monitering af test-strækninger. Denne arbejdspakke ledes af Vejdirektoratet i Danmark. Rapporten beskriver resultaterne fra målinger udført på en fuldskala teststrækning etableret ved Kalvehave i Danmark i august 2013. Rapporten er skrevet af forskere fra Vejdirektoratet samt det franske institut IFSTTAR.
Forfatterne vil gerne takke det entusiastiske personale hos Vejdirektoratet og IFSTTAR som har stået for gennemførel-sen af målinger og analyser. Forfatterne er kun ansvarlige for rapportens indhold. Rapporten er kvalitetskontrolleret af Luc Goubert fra det belgiske vejforskningsinstitut BRRC.
Dette arbejde er finansieret af EU Kommissionen samt de danske og franske partnere. Forfatterne er taknemmelige for den finansielle støtte til størstedelen af dette projekt fra EU kommissionens 7. rammeprogram.
PERSUADE projektets formål er at udvikle poroelastiske vejbelægninger (porøse og elastiske slidlag, forkortet PERS) som en mulig støjreducerende metode alternativt til fx støjskærme. Det forventes, at PERS vil kunne yde en væsentlig højere støjreduktion end de bedste traditionelle støjreducerende vejbelægninger. Den særlige egenskab ved denne nye type vejbelægning er, at den består af traditionelt stenmateriale samt en væsentlig andel gummigranulat fra genanvendte bildæk bundet sammen med polyuretan.
PERSUADE er akronym for ”PoroElastic Road SUrface: an innovation to Avoid Damages to the Environment” (Porøse og elastiske slidlag, en ny metode til at undgå skader på miljøet). Projektprogrammet inkluderer omfattende labo-ratorieundersøgelser for udvikling af en holdbar blanding, konstruktion af syv teststrækninger i fem partnerlande, et måle- og moniterings program for teststrækningerne (støj, rullemodstand, friktion, holdbarhed, egenskaber om vinteren osv.) samt undersøgelse af miljømæssige og økonomi-ske aspekter. Projektet planlægges gennemført over en periode på seks år. Tolv partnere fra syv europæiske lande samarbejder i dette projekt, herunder forskningsinstitutter, universiteter og firmaer, der repræsenterer de involverede industrisektorer. Partnerne er:
• Belgian Road Research Centre (BRRC), Projekt koordinator
• Swedish National Road and Transport Research Institute (VTI)
• Vejdirektoratet i Danmark (DRD)
• NCC Roads A/S (NCC)
• Slovenian National Building and Civil Engineering Institute (ZAG)
• Polish Road and Bridge Research Institute (IBDiM)
Forord

6
Summary
Summary
Since the PERS test section at Kalvehave was constructed in the end of August 2013 a comprehensive series of meas-urements have been performed over a period of around 250 days in order to characterise the PERS pavement in relation to friction, noise, durability etc.
The friction has been measured using three different equip-ment’s and measurement methods the Pendulum, the Porta-ble Friction Tester and ROAR measurement car. The friction measured by the Pendulum at the 5 different positions along the test section is practically the same indicating a uniform friction on the PERS. The friction has been measured by the ROAR car 4 times over a 6 month period and the results indicate a slight tendency for reduction of the friction over time. When the PERS was around 2 weeks old the friction in the two wheel tracks was 0.60 and 0.54 which is over the Danish criteria value of 0.40, showing a reasonable friction also when the PERS was new.
The SPB noise result for passenger cars at 60 km/h is 69.1 dB. After 5 days the level has decreased 1.7 dB which is quite remarkable. In the period from day 5 to 68 the noise level seems to be stabilised. The noise reduction in relation to Nord 2000 is after 68 days is 6.6. It must be remarked that a new dense asphalt concrete (AC11) will have a noise level that will be around 2 dB lower than the Nord2000 reference levels. After 248 days the noise level decreases about 1 dB further. The CPX measurements generally con-firm these results.
Comparing the spectra of the PERS to a new dense asphalt concrete with 11 mm aggregates (AC11) the following can be observed:
• From 160 to 800 Hz the PERS is 2 dB lower than the AC11. This can indicate that the PERS have smother texture caused by the smaller aggregate size (5 mm ver-sus 11 mm) and is elastic due to the rubber granulates.
• From 1000 Hz to 2000 Hz the PERS is 5-6 dB lower than the AC11. In this frequency range the noise gen-erated from vibrations in the tyre caused by the surface texture of the pavement is one of the dominant noise sources. This can also indicate that the PERS have smother texture than the AC11.
• From 2000 to 4000 Hz the PERS is 7 to 8 dB below the AC11. In this frequency range noise generated from air pumping is dominant. This indicates that the PERS has an open and porous structure.
• The result gives an indication that the PERS pavement for heavy vehicles has a SPB noise level 5 to 6 dB be-low the Nord2000 reference level. This is around 2 dB less noise reduction than for passenger cars.
The surface texture has been measured by two different texture laser devices, an in-situ laser which measures 1.5 m sections of the road, and trailer mounted lasers which

7
Summary
measures the texture of the two wheel tracks while record-ing CPX measurements. Using the in-situ equipment the average medium profile depth (MPD) was measured to 0.67 mm and using the trailer mounted method 0.85 mm.
The permeability was measured by the Becker’s tube. The variation between the results 5 measurement positions along the test section was small indicating a uniformity of the pavement regarding permeability. The average result from the Becker tube is 6.9 seconds which is the same as for new two-layer porous asphalt.
The average built in air void has been measured to 27.7% by using image analysis on thin and plane sections. The high air void is in consistence that the PERS has a good permeability.
The mechanical impedance was measured on 5 different spots of the PERS test section. The stiffness was between 3.2e5 N/m and 10.0e5 N/m, leading to a dynamic Young modulus between 30 MPa and 96 MPa for a 30 mm thick PERS. Despite some inhomogeneity, these values are close to the stiffness of standard tyres and could then lead to noise reduction by less tyre deflection and vibrations during rolling. The dynamic Young modulus is around 150 times less than that for a standard dense asphalt concrete.
The measured average International Roughness Index (IRI) is 2.18 m/km. This is a relatively high IRI value indicating that
the PERS has an uneven megatexture. During the con-struction the pavement became uneven in the longitudinal direction of the pavement with waves with a wavelength of 2 to 6 meter that as a result of intensive compaction by a roller. The IRI measurements confirm this.
The measurements of rolling resistance were performed both on the PERS pavement as well as on the adjacent old asphalt concrete that in this case is used as a reference pavement. The rolling resistance of the PERS pavement was on average 7.2 % higher than the old asphalt concrete. This might be caused by the fact that the PERS pavement has a relative high unevenness (IRI).
The visual inspections have been performed over the first 213 days of the PERS pavement lifetime. The observations show that a little tendency of ravelling can be observed after the pavement is a month old. During the winter period heavy ravelling has developed in the wheel tracks and it seems that it is primarily the stone aggregates that have disap-peared leaving back the softer rubber particles in the wheel tracks. This could be the reason for the 1 dB increase in noise level at 80 km/h over the winter period.

8
Sammenfatn ing
Siden konstruktionen af forsøgsstrækningen med PERS belægning ved Kalvehave i august 2013 er der gennemført en omfattende serie af forskellige malinger over en periode på omkring 250 dage. Formålet har været at belyse forhold som friktion, støj, holdbarhed mv.
Der er anvendt tre forskellige typer måleudstyr til friktions-målingerne Pendul metoden, Portable Friktion Tester og Vejdirektoratets målekøretøj ROAR. Friktionen er målt med Pendul metoden på 5 forskellige positioner langs forsøgs-belægningen og resultaterne indikerer en ensartet friktion langs i belægningens længderetning. Målekøretøjet ROAR har målt friktionen 4 gange i løbet af 6 måneder og resul-taterne indikerer en lille reduktion af friktionen over tid. Da PERS belægningen var 2 uger gammel var friktionen i de to hjulspor henholdsvis 0,60 og 0,54 hvilket er over den dan-ske kriterie værdi på 0,40 hvilket viser af PERS belægningen som ny havde en rimelig god friktion.
Resultaterne af SPB støjmålinger udført i vejsiden viser, at for personbiler var støjniveauet 69,1 dB ved 60 km/t, da belægningen var nyudlagt. Efter 5 dage var niveauet faldet med 1,7 dB hvilket er bemærkelsesværdigt. I perioden fra dag 5 til 68 er støjniveauet stabiliseret. Efter 68 dage var støjreduktionen 6,6 dB, i forhold til referenceniveauet i den danske støjberegningsmodel Nord2000. Det skal be-mærkes at en ny tæt asfaltbeton (AB11t) vil have et støj-niveau som vil være omkring 2 dB lavere end Nord2000´s reference niveau. Efter 248 dage var støjniveauet faldet yderligere 1 dB. Målinger med CPX måletraileren bekræfter generelt disse resultater.
Hvis støjspektret fra PERS sammenlignes med en ny tæt asfaltbeton med 11 mm maksimal stenstørrelse (AB11t) kan følgende observeres:
• I det lavfrekvente område fra 160 til 800 Hz ligger PERS 2 dB lavere end AB11t. Dette kan indikere at PERS har en jævnere overfladetekstur som skyldes brug af en maksimal stenstørrelse på kun 5 mm, samt at PERS belægningens elastiske egenskaber har en støjreduce-rende effekt.
• I det vigtige frekvensområde fra 1000 til 2000 Hz ligger PERS 5-6 dB lavere end AB11t. I dette frekvensområde genereres støjen primært fra vibrationer i dækket som skyldes overfladeteksturens ujævnhed. Dette kan derfor også indikere at PERS har en jævnere overflade tekstur end AB11t.
• Fra 2000 til 4000 Hz ligger PERS belægningen 7 til 8 dB under AB11t. I dette frekvensområde er støj fra luftpumpning dominerende. Dette indikerer at PERS belægningen har en åben pore struktur.
Resultaterne giver desuden en indikation af at PERS be-lægningen for tunge køretøjer har en støjreduktion der er omkring 2 dB mindre end for personbiler.
Belægningens overflade tekstur er blevet målt med to forskellige typer laser udstyr, en statisk profilograf som måler over en strækning på 1,5 m samt en trailer med lasere der måler i de to hjulspor samtidig med at der foretages
Sammenfatning

9
Sammenfatn ing
CPX støjmålinger. Resultaterne fra den statiske profilograf metode viser en MPD på 0,67 mm og med trailer metoden er MPD 0,85 mm.
Permeabiliteten er målt med Becker´s rør metode. Der er en lille variation af resultaterne for 5 målepositioner langs belægningens længderetning som indikerer homogenitet hvad angår permeabilitet. Det gennemsnitlige resultat er en gennemløbstid på 6,9 sekund hvilket svarer til permeabilite-ten for en tolags drænasfalt.
Det gennemsnitlige indbyggede hulrum I PERS belægnin-gen er målt til 27,7 % på baggrund af billede analyse af tynd og planslib fra en belægningsprøve. Den høje hulrumspro-cent korresponderer fint med at PERS belægningen har en god permeabilitet.
Den mekaniske impedans (belægningens elasticitet) er målt på 5 forskellige steder i belægningens længderetning. Stivheden ligger mellem 3.2e5 N/m og 10.0e5 N/m. Det kan omregnes til et dynamisk Youngs modul på mellem 30 MPa og 96 MPa for den 30 mm tykke PERS belægning. Denne stivhed ligger tæt på stivheden for et almindeligt dæk og kan derfor indikere en støjreduktion pga. mindre vibrationer i dækket. Youngs dynamiske modul for PERS er omkring 150 gange mindre end det tilsvarende for en standard tæt asfaltbeton.
Belægningens ujævnhed (IRI) er målt til 2,18 m/km. Dette er et relativt højt IRI tal som indikerer at PERS belægningen har en ujævn megatekstur. Som konsekvens af en forholds-
vis intens tromling under udlægning af belægningen, blev belægningen ujævn i længderetning med en bølgelængde på 2 til 6 meter. IRI resultaterne bekræfter dette.
Der er foretaget målinger af rullemodstand både på PERS belægningen og den nærliggende gamle asfaltbeton som I denne sammenhæng anvendes som reference. Rullemod-standen på PERS belægningen ligger i gennemsnit 7,2 % højere end den gamle asfaltbeton. Dette skyldes formodent-lig at PERS belægningen er forholdsvist ujævn med et højt IRI tal.
Der er foretaget visuel inspektion af belægningen gemmen de første 213 dage af belægningens levetid. Observatio-nerne viser en begyndende tendens til stentab efter en måned. Gennem vinterperioden udvikles et kraftigt stentab i hjulsporene, det er især granit sten materialet der slides væk således af det bløde gummi materiale bliver tilbage. Dette kan være en del af forklaringen på den 1 dB forbedrede støjdæmpning i løbet af vinter perioden.

10
1. In t roduc t ion
A key part of the first phase of the PERSUADE project is the development, optimisation and testing of the PERS material in the laboratory. This work is being performed in Working Package 2 (WP2). The full scale section was constructed in Denmark in August 2013. The construction of test sections is part of Work Package WP 4 in PERSUADE, which deals with “Construction technology and test sections”.
To gain experiences mixing and laying the PERS material outside the laboratory on a real road a small scale pre-test was constructed by NCC at the Danish Arnakke test site in October 2011. A series of measurements has been performed on this 10 square meter PERS pavement. The results indicate that this pavement has a good potential for achieving a high noise reduction, better than conventional porous asphalt [2].
1.1 The test siteDRD have been working on finding a suitable road section on the state road network where the full scale test section
could be constructed. The following criteria have been the background for appointing the test section:
• Traffic volume below 5000 vehicles per day
• Speed limit between 50 to 80 km/h
• Traffic driving with constant speed
• No turning vehicles on the section
• A section outside urban environment with good condi-tions for performing noise measurements at the roadside
• No gradient on the section
• Not too long driving distance from the DRD laboratory in Floeng
1. Introduction
Figure 1.2: Overview of the test site seen towards east before constructing PERS. The test area is marked. The PERS pavement first start some meters after the driveway to the farm buildings at the left hand side, in order to avoid turning vehicles on the PERS pavement.
Figure 1.1: Overview of the test site seen towards west before constructing PERS. The test area is marked. The PERS pavement starts around 10m after the driveway to the villa at the right hand side, in order to avoid turning vehicles on the PERS pavement.
Km 15.800
Km 15.812
East end of test section West end of test section
Km 15.726
Km 15.700

11
1. In t roduc t ion
At the same time it was for economic reasons necessary to find a section with an old asphalt pavement where DRD was planning a replacement of the pavement within a few years. After inspecting and evaluation a series of roads DRD finally found the Kalvehave test site. It is located on state road no. 619 and route 59. The road is named “Ny Vordingborgvej”. It is a road between the two small towns Kalvehave (east) and Gammel Kalvehave (west). There is one lane in each direction and on the north side a 2 m wide bike lane with asphalt surfacing. The length profile of the road is slightly declining (about 16 to 9 0/00) from east towards west. The declining is in the driving direction and is so marginal, that it is not evaluated to have any influence on the driving pattern and therefore no influence on the engine noise emission. The side fall from the centre line of the road is 22 to 30 0/00. The yearly daily traffic in 2011 was 4000 with 10 % heavy vehicles. The speed limit is 80 km/h and the esti-mated real speed is somewhat lower.
The PERS section is placed on the northern driving lane from around km 15.726 to km 15.812 with a total length of 75 m. See Figure 1.1 and 1.2. The width of the lane is about 3.5 m. At the side of the pavement there is a curbstone.
There are 3 old drains for rain water at the test section. It was decided to replace these by new drains. Holes have been cut at the side of these drains at a depth of 5 to 30 mm in order to allow rain water to run from the porous pavement to the drain. These holes were cut on three sides of the drains.
Along the curbstones an about 60 cm wide band of porous asphalt (max aggregate size 8 mm) was laid at a thickness of 30 mm. The purpose of this is to lead rain water from the PERS pavement to the drains, see Figure 1.3 and 1.4. The old pavement here was first milled off some days after the ap-plication of the PERS and then the porous asphalt was laid.
Figure 1.3: Curbstone and drain at the side of the pavement before constructing PERS and porous asphalt. The band where porous asphalt was applied is marked by the blue lines.
Figure 1.4: At the western end of the test section by Km 15.726 before con-structing PERS and porous asphalt. The band of porous asphalt was constructed all the way to the drain in order to make rain water run to this drain. The band of porous asphalt is marked by the blue lines. The section with PERS pavement will first start around 5-10 m east of the drain. The PERS pavement is marked with red lines.
Band of popous asphalt
PERS
Band of popous asphalt

12
1. In t roduc t ion
1.2 The construction of the test pavementThe PERS test section was constructed from August 26th to August 28th 2013 (see Figure 1.5) following the following plan:
• August 26th milling off the old asphalt pavement at a width of 3 m and applying a new regulating layer
• August 27th laying of the PERS pavement
• August 30th milling off the 60 cm wide band of old pave-ment at the roadside and applying porous asphalt
• August 30th the test section was opened to normal traffic at 12.30
During the construction period the weather was sunny or a little cloudy with temperatures around 20º C. There was no rain in the period. The experiences from the construction are documented in [3].
As can be seen at Figure 1.7 the new PERS pavement has a smooth open surface with an open structure.
The viscosity of the binder was low. This had the effect that the surface of the PERS pavement had a quite “dry” appear-ance (see Figure 1.8). Thick films of binder on the aggregates were not observed. This might make the pavement more sensitive to ravelling than intended.
Figure 1.5: NCC constructing of the full scale PERS test pavement at the Kalvehave test site in Denmark August 27th 2013.
Figure 1.6: The PERS test section just after construction and before the construction of a band of porous asphalt at the roadside by the curbstone.

13
1. In t roduc t ion
Figure 1.7: Close up photo of the PERS test section.
A binder with a long curing time was used. Due to the long curing time of the PERS and the low viscosity of the binder, the compaction of the mix was very difficult. The mix was very “living” which means that it was like a liquid under the steel wheels of the roller. The result was a very uneven surface with longitudinal lines created by the edges of the roller (see Figure 1.8).
The results of the compaction could probably be better using a bigger steel roller. In order to get rid of these longitudinal lines the compaction was continued for around 60 minutes
after the termination of the paving process. This long com-paction time with many roller passes over the PERS surface had the unwanted effect that the pavement became uneven in the longitudinal direction of the pavement with waves with a wavelength of 2 to 6 meter. Results of measurements of unevenness can be found in Section 4.4. After the test sec-tion was opened for normal traffic some days later it was the clear impression by the DRD crew that this unevenness did not result in any generation of extra tyre road noise. But when driving on the pavement an unwanted sound is generated inside vehicles.
Figure 1.8: Longitudinal lined caused by the roller.

14
1. In t roduc t ion
Figure 1.9: The band of porous asphalt at the roadside constructed August 30th 2013. A new drain can be seen.
Figure 1.10: Picture taken from the video monitoring camera mounted on a mast at the test site, shoving one of the first cars driving on the new pavement on August 30th 2013 at 12.34.
1.3 Measurement programThis report presents the results of the measurements performed in the first 6 month of the lifetime of the PERS pavement at the Kalvehave test site.
When full scale testing a new pavement type like PERS, it is very important that it has a friction that secures a good level of traffic safety on the test section. Already during the laboratory development and testing friction was measured on test samples and the results from the mix applied at Kalvehave were satisfactory. The friction was measured at the test site using three different methods: the Pendulum, the Portable Friction Tester and the DRD ROAR friction tester (see Chapter 2).
The noise has been measured using both the SPB roadside method as well as using the CPX trailer method. As a sup-plement also the acoustical absorption of the porous PERS pavement have been measured (see Chapter 3)
The different surface characteristics of the PERS pavement have an influence on the generation of tyre-road noise. To
describe the pavement surface the surface texture as well as the permeability and the mechanical impedance as an expression of the elasticity of the PERS pavement have been measured together with the evenness of the pavement (see Chapter 4).
Microscopy and image analysis on Thin and Plane sections of pavement test samples have been performed and is used to investigate the physical structure of the pavements and the binding between glue and aggregates. The built in air void is also estimated using this method. The test samples were produced in moulds at the roadside at the same day as the PERS pavement was constructed (see Chapter 5).
The rolling resistance measurements have also been per-formed at the PERS test section (see Chapter 6).
Visual inspections have been performed frequently using both the video monitoring of the test section as well as using inspections at the site (see Chapter 7).

15
2 . Fr ic t ion measurements
be more than 45 .This indicates a fine skid resistance of the one months old PERS pavement. The friction measured at the 5 different positions along the test section is practically the same indicating a uniform friction on the PERS.
The friction was measured using three different measure-ment methods the Pendulum performed by DRD, the Port-able Friction Tester (PFT) performed by VTI and the DRD ROAR friction tester vehicle.
2.1 PendulumThe skid resistance has been measured according to EN 13036-4 by the DRD laboratory at the 1st of October 2013 on the PERS test section at Kalvehave. The test was carried out in wet conditionIt should be noticed that the results from this test are taken at a small area so the results cannot be compared with results from devices measuring the skid resistance over a long length of the surface.
Results from testing are seen in Table 2.1 at five con-secutive measuring positions along the right wheel path. The average friction measured at five positions is 78. For comparison the friction measured at an old asphalt concrete at the Arnakke test site [2] was 70. According to an old DRD practice the friction measured by the pendulum shall
2. Friction measurements
Figure 2.1: Pendulum friction measurements at the Kalvehave test site.
Table 2.1: Results of Friction measurements at chosen points. All measure-ment performed in right wheel path
Position no. Friction index1 77
2 77
3 80
4 78
5 80
Average 78

16
2 . Fr ic t ion measurements
2.2 Portable Friction TesterThe portable friction tester, PFT, has been developed at VTI. Version 4 of the device was used for these tests (see Figure 2.2). This version has been described in [6] and is commer-cially available at the company KD Highway Systems. The PFT is a manually pushed instrument with three wheels. The two wheels at the rear end carry most of the weight of the instrument and the front wheel is used for measuring the friction. The rotation of the front wheel is coupled to the rotation of the rear wheels. The front wheel is forced to rotate at 75 % of the speed of the rear wheels, i.e. the partly braking, measuring front wheel has a slip of 25 %.
The slick tread rubber of the measuring wheel is 40 mm wide and is 5 mm thick and has a Shore A hardness of ap-proximately 63. The tires were inflated to a pressure of 100 kPa. Before measuring the tread rubber of the measuring wheel was refreshed by pushing the instrument lengthways over a stick with Safety-Walk™ tape. The road surface was sprayed with water using a before measuring commenced and the instrument was pushed with an approximate speed of 0.5 m/s.
The following data for each test were recorded: • Minimum friction, µmin
• Average friction, µav
• Maximum friction, µmax
• Standard deviation of friction, σ
• Measuring distance, d (m/s)
Friction was measured:• In the right wheel track on the old Dense Asphalt
Concrete immediately before the PERS test site (DAC in w-t)
• Between the wheel tracks on the old Dense Asphalt Concrete immediately before the PERS test site ( DAC b. w-t)
• In the right wheel track in the beginning of the PERS (PERS in w-t)
• Between the wheel tracks in the beginning of the PERS (PERS b. w-t)
The friction was measured by VTI using the PFT on 1st of October 2013.The average results (µav) of the PFT can be seen in Table 2.2. In the wheel track the friction of the PERS is 0.83 and of the DAC 0.85. Between the wheel tracks the friction is marginally higher with respectably 0.86 and 0.88. This generally indicates that the PERS have approximately the same friction as the old dense asphalt concrete at adja-cent to the test section.
Test µmin µav µmax σ d (m)
DAC in w-t 0.75 0.85 0.94 0.032 4.7
DAC b. w-t 0.79 0.88 0.96 0.035 4.5
PERS in w-t 0.66 0.83 0.91 0.034 13.7
PERS b. w-t 0.71 0.86 0.93 0.032 13.2
Table 2.2: Average results of friction with the PFT at the Persuade test section. Performed 1st of October 2013.
Figure 2.2: VTI performed measurements with the Portable Friction Tester on 2nd of October 2013 at the Kalvehave test site.

17
2 . Fr ic t ion measurements
2.3 ROAR friction testerThe Danish Road Directorate has since 1997 used the ROAR friction device for measuring friction properties on the road network in Denmark. This device measures the friction in each wheel path using the longitudinal friction principle with a 20 % slip. The testing is performed using a standard testing speed of 60 km/h and a water film of 0.5 mm sprayed in front of the measuring wheels. The results of the friction testing of the PERS test section and the adja-cent old asphalt concrete section are seen in Table 2.3 and
2.4. When the PERS was about 2 weeks old the friction is 0.60 and 0.54 in the two wheel paths which is over the Danish criteria value of 0.40 showing a reasonable friction when the pavement was new. The friction of the PERS is the same as the old adjacent asphalt concrete in the right wheel track and lower in the left wheel track.
The friction was measured 4 times over a 6 month period and the results indicate a slight tendency for reduction of the friction over time.
Figure 2.3:The ROAR friction tester operated by DRD.
Table 2.3: Results of friction measurements at the PERS test section.
Date Friction valueLeft wheel track Right wheel track
9th of September 2013 0.60 0.54
10th of October 2013 0.50 0.51
16th of December 2013 0.47 0.40
17th of Marts 2014 0.50 0.56
Table 2.4: Friction measured at the adjacent old asphalt concrete section.
Date Friction valueLeft wheel track Right wheel track
9th of September 2013 0.77 0.54

18
2 . Fr ic t ion measurements
2.4 Summing up on frictionThe friction has been measured using three different equip-ment’s and measurement methods. The results from these methods cannot be compared. The results in the right wheel track, when the PERS test pavement is around one month old, are summarised in Table 2.5 below and compared to the adjacent old asphalt concrete. The old asphalt concrete is considered having a good friction. The results show that the PERS have nearly the same friction indicating that the one month old PERS has a good friction.
The friction measured by the Pendulum at the 5 different positions along the test section is practically the same indi-cating a uniform friction on the PERS. The friction has been measured by the ROAR car 4 times over a 6 month period and the results indicate a slight tendency for reduction of the friction over time. When the PERS was about 2 weeks old the friction was 0.60 and 0.54 which is over the Danish criteria value of 0.40 showing a reasonable friction also when the PERS was new.
Table 2.5: Results of friction measurements in the wheel tracks using threedifferent measurement equipment’s, when the PERS test pavement is about one month old.
Method PERS Old Asphalt concretePendulum 78 70*
Portable Friction tester 0.83 0.85
ROAR measurement car 0.51 0.66
*Result from old asphalt concrete at the Arnakke test site.

19
3 . No ise measurements
measurements have been clustered into one “artificial” measurement.
The LAmax levels for passenger cars can be seen in Table 3.2 were also the Danish reference levels from the Nordic pre-diction model Nord2000 are included for comparison. The Nord2000 reference is the average noise level for an eight years old dense asphalt concrete with 11 mm maximum aggregate size [10]. The noise for passenger cars has been corrected to 20 ºC using the normal conversion factor of -0.05 dB/ºC for asphalt concrete. It can be argued that the temperature conversion factor for a PERS pavement with a high content of rubber differs from -0.05 dB/ºC, but there is no correction factor for PERS available.
The average speed for passenger cars at the test site is around 65 km/h. The analysis has been performed at each SPB measurement at 50, 60 and 80 km/h. The speed of 50 and 80 km/h is just outside the confidence interval for these measurements and therefore the uncertainty is a little higher than for the results at 60 km/h.
The results of the noise measurements performed with the SPB roadside method and the CPX trailer method will be presented in this chapter. Also absorption measurements performed on drill cores in the lab will be included.
3.1 SPB roadside measurementsSPB roadside noise measurements have been performed by DRD three times in the first month after the construction of the PERS test section where the pavement was in a fine condition with no significant ravelling. It is not recommenda-ble to perform SPB measurements during the winter season in Denmark where cars normally are using winter tyres that can have a different influence on the measured noise levels than summer tyres. The measurements were repeated in May 2014 where significant ravelling had occurred on the PERS test section (see Chapter 7). The number of vehicles included in the SPB measurements and the air temperature can be seen in Table 3.1. It can be seen that the require-ment for SPB measurements of 100 passenger cars is generally fulfilled. But there are all too few heavy vehicles. To get an impression of the order of magnitude of the noise from heavy vehicles form the PERS pavement all the four
3. Noise measurements
Figure 3.1: SPB measurements at Kalvehave test site.

20
3 . No ise measurements
The SPB results are also shown in Figure 3.2 where it can be seen that form the day the test section was opened to traffic and 6 days later there is a reduction of the noise. For 60 km/h this is 1.7 dB which is quite remarkable. In the period from day 5 to 68 the noise levels seems to be stabilised. The noise reduction in relation to Nord 2000 is after 68 days 6.2, 6.6 and 7.7 dB for respectably for 50, 60 and 80 km/h. It must be remarked that a new dense asphalt concrete will have a noise level that will be around 2 dB lower than the Nord2000 reference levels. After 248 days the noise level decreases about 1 dB for speeds of 50 and 60 km/h.
Figure 3.3 show the spectre for passenger cars at 60 km/h. The 1.7 dB reduction in the SPB level from the first day and to the fifth day occur in the frequency range from 800 to 1600 Hz where the noise from vibrations in the tyre caused by the surface texture is dominant. This can indicate that the surface texture becomes more even and smooth (see Section 4.1.2 for results of texture measurements). After 248 days in May 2014 there is a remarkable change in the spectra. Below 630 Hz the noise level increases up to 5 dB
and over 630 Hz the noise level decreases up to 4 dB. As described in Chapter 7 significant ravelling has occurred on the PERS pavement and most of the stone aggregates are warn of leaving a surface with a high proportion of soft rubber aggregate. This might partly be the explanation for the reduction in the frequency range from 630 to around 2000 Hz. As also described in Chapter 7 a series of stripes with an angle of around 60º to the driving direction can be observed with a distance of around 2 to 5 meter). Other damaged areas on the pavement surface can also be ob-served. It is the judgement of the authors that this is caused by a snowplough driving on the road in the snow periods. This unevenness of the pavement might be part of the expla-nation for the increased noise under 630 Hz.
Table 3.1: Number of vehicles included and the air temperature recorded during the SPB measurements at the PERS pavement at Kalvehave.
Day 1 5 68 248Number of passenger cars 92 88 100 99
Number of two axle heavy vehicles 6 6 6 8
Number of multi axle heavy vehicles 2 15 5 14
Air temperature [ºC] 20.2 20.0 10.2 11.8
Date Age; days after opening
Speed50 km/h
[dB]60 km/h
[dB]80 km/h
[dB]30. Aug. 2013 1 66.8 69.1 72.7
5. Sep. 2013 5 64.8 67.4 71.5
8. Nov. 2013 68 65.6 67.7 70.9
5. May 2014 246 64.0 67.0 71.7
Nord2000 ref. 8 years old 71.8 74.3 78.6
Table 3.2: LAmax levels for passenger cars measured with the SPB method at three different speeds corrected to 20 ºC.

21
3 . No ise measurements
40
45
50
55
60
65
[dB
]
Frequency [Hz]
SPB 60 km/h
30. Aug. 2013
5. Sep. 2013
8. Nov. 2013
5. May 2014
Figure 3.2: LAmax levels for passenger cars measured with the SPB method at three different speeds corrected to 20 ºC.
Figure 3.3: SPB spectre for passenger cars at 60 km/h.

22
3 . No ise measurements
• From 2000 to 4000 Hz the PERS is 7 to 8 dB below the AC11. In this frequency range noise generated from air pumping is dominant. This indicates that the PERS has an open and porous structure (see Section for 4.2 for permeability measurements and Section 5.1 for meas-urements of the built in air void).
During the SPB measurements it was for practical reasons only possible to include very few heavy vehicles (see Table 3.1) and therefore results from these vehicle categories can-not be included in the analysis. To get an impression of the order of magnitude of the noise from heavy vehicles form the PERS pavement all the four measurements have been clustered into one “artificial” measurement. The results are shown in Table 3.3 for a speed of 60 km/h where also the Danish reference levels from the Nordic prediction model Nord2000 are included for comparison. The result gives an indication that the PERS pavement for heavy vehicles has a SPB noise level 5 to 6 dB below the Nord2000 reference level. This is a dB less noise reduction than for passenger cars.
In Figure 3.4 the spectra form the PERS pavement 68 days old having an SPB level of 67.7 dB is compared to a new dense asphalt concrete with 11 mm aggregates (AC11) at the Danish test section at Kongelundsvej [10] having an SPB level of 71.9 dB. Comparing these two spectra the following can be seen:
• From 160 to 800 Hz the PERS is 2 dB lower than the AC11. This can indicate that the PERS have smother texture caused by the smaller aggregate size (5 mm versus 11 mm) and is elastic compared to the AC11 (see Section 4.3 for measurements of mechanical imped-ance).
• From 1000 Hz to 2000 Hz the PERS is 5-6 dB lower than the AC11. In this frequency range the noise gen-erated from vibrations in the tyre caused by the surface texture of the pavement is one of the dominant noise sources. This can also indicate that the PERS have smother texture than the AC11 (see Section 4.1 for texture measurements).
40
45
50
55
60
65[d
B]
Frequency [Hz]
SPB 60 km/h
8. Nov. 2013
Kongelundsvej year 0
Figure 3.4: SPB spectre for passenger cars at 60 km/h for the PERS when 70 days old and data from a new dense asphalt concrete with 11 mm ag-gregates at the Danish test section at Kongelundsvej [10].
Vehicle type Two axle heavy vehicles Multi axle heavy vehiclesPERS at Kalvehave [dB] 77.0 78,6
Nord2000 ref. [dB] 81.7 84.3
Tabel 3.4: “Artificial” SPB level for heavy vehicles predicted by clustering the 4 SPB measurements performed at 60 km/h corrected to 20 ºC.

23
3 . No ise measurements
3.2 CPX trailer measurementsDRD have performed CPX measurements using the stand-ard tyre SRTT for such measurements. As a supplement TUG has performed a series of measurements with alterna-tive tyres and the SRTT tyre.
3.2.1 Measurements with the standard reference tyre SRTTDRD have performed CPX measurements at 50, 70 and 80 km/h four times after the opening of the test section. The main results as LAmax levels can be seen in Table 3.4 as well as in Figure 3.6. The results has been corrected to 20˚ C using the normal conversion factor of -0.03 dB/º C used by DRD for the SRTT tyre. The same tendencies as observed for the SPB results can be seen. For practical reasons the measurements ar 70 km/h were not conducted on the 5th of May 2014.
The spectra for the CPX measurements with the SRTT tyre at 50 km/h are shown in Figure 3.7. The same tendencies as seen for the SPB results can be seen.
At day 5 the noise was also measured on the old asphalt concrete close to the PERS at Kalvehave. The results can be seen in Table 3.5. The noise reduction for the PERS in relation to the old pavement is around 7 dB.
Figure 3.5:The DRD CPX trailer deciBellA performing CPX measurements at Kalvehave test site just after the test track was opened to traffic.
Date Age: days after
opening
Speed50 km/h
[dB]70 km/h
[dB]80 km/h
[dB]30. Aug. 2013 1 87.0 91.9 93.6
5. Sep. 2013 5 85.9 90.4 92.0
23. Sep. 2013 23 85.4 90.5 91.7
5. May 2014 246 84.0 - 92.4
Table 3.4: Results of the CPX measurements with the SRTT tyre corrected to a temperature corrected to 20 ºC.

24
3 . No ise measurements
82,0
84,0
86,0
88,0
90,0
92,0
94,0
96,0
0 50 100 150 200 250 300
L Am
ax
Age in days
50 km/h
70 km/h
80 km/h
Figure 3.6: LAmax levels measured with the CPX method at three different speeds corrected to 20 ºC.
55
60
65
70
75
80
85
[dB
]
Frequency [Hz]
CPX 50 km/h
30 Aug. 2013
5 Sep. 2013
23 Sep. 2013
5 May 2014
Figure 3.7: CPX spectre for passenger cars at 50 km/h.
Table 3.5: CPX results for the old asphalt concrete and the PERS measured 5th of September 2013 with the SRTT tyre corrected to a temperature corrected to 20 ºC.
Pavement 50 km/h [dB] 80 km/h [dB]PERS 85.9 92.0
Old asphalt concrete 92.4 99.2

25
3 . No ise measurements
82
84
86
88
90
92
94
Tyre MCPR Tyre CTBE Tyre SRTT Tyre AAV4
50 km/h
PERS
Old asphalt
3.2.2 Measurements with special tyresTUG has also performed CPX measurements at the Kalve-have test site on the PERS as well as on the old dense asphalt concrete [4]. The measurements were performed on November 8th 2013 when the PERS pavement was 69 days old. Besides the SRTT three supplementary tyres named MCPR, CTBE and AAV4 were used. The results at 50 km/h can be seen in Figure 3.9. The results are not temperature corrected. The air temperature during the measurements
was 11 to 15 ºC. Fur these tyres the measured noise reduc-tion varies between 4 and 6 dB with the SRTT tyre giving the highest noise reduction.
For the SRTT tyre the noise level was 86.1 dB for the PERS whereas DRD measured 85.9 on September 5th (see Table 3.5). For the old reference pavement the noise level was 92.4 which are the same as measured by DRD.
Figure 3.8:TUG performing CPX measurements with special tyres at the Kalvehave test site.
Figure 3.9:Results of CPX measurements with four different tyres at the Kalvehave test site at 50 km/h, not temperature corrected [4].
26
3 . No ise measurements
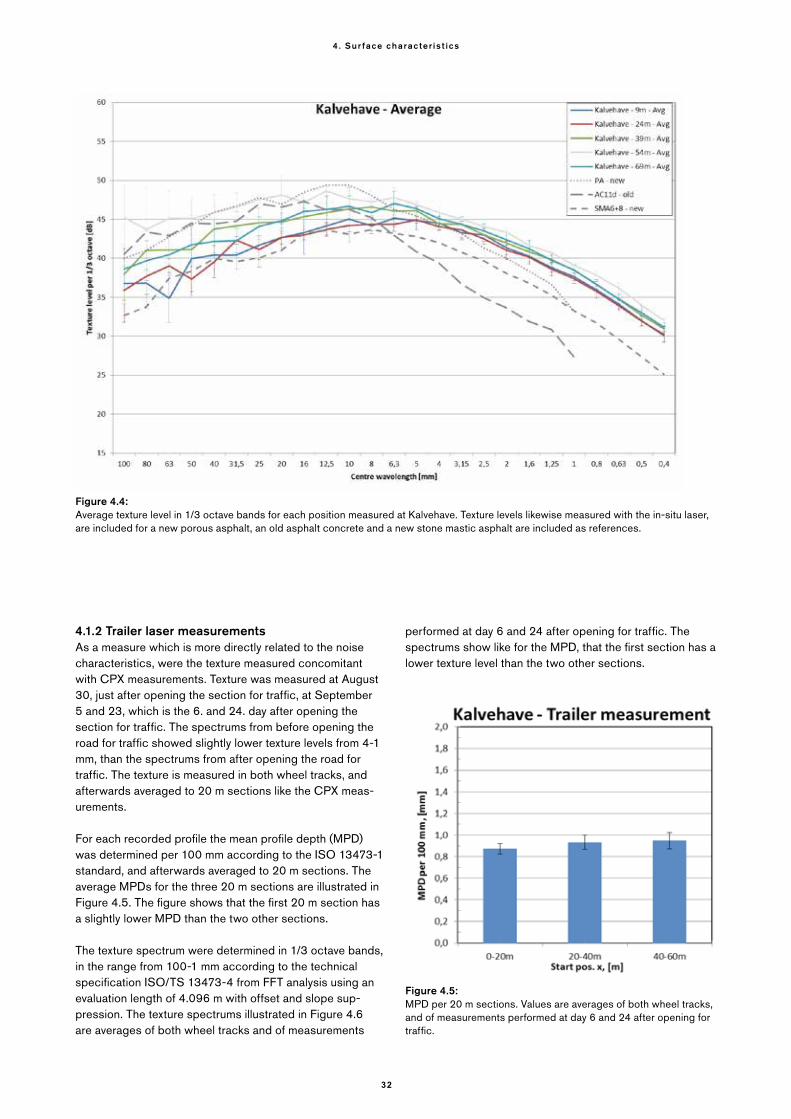
Figure 3.10:Impedance tube for measuring acoustical absorption.
3.3 Acoustical absorptionThe acoustical absorption has been measured on drill cores taken from the pavement slabs that were produced at the roadside when the test pavement was constructed.
Measurements are carried out according to ISO 10534-2 (Acoustics – Determination of sound absorption coefficient and impedance I impedance tubes – Part 2: Transfer-func-tion method).
The acoustical absorption measured in a B&K Type 4206 impedance tube, is measured at six cores drilled from test slabs. The impedance tube can be seen at Figure 3-10.
The absorption measured at the six cores is illustrated in Figure 3-11. The absorption spectra for all of the cores have the same characteristics. Core number 1 and 4 both has the maximum peak at 600-625 Hz, with a maximum absorp-tion coefficient of 0.42. Core number 2, 3, 5 and 6 has the maximum peak at 650-700 Hz, with a maximum absorption coefficient of 0.53. All of the six cores looked similar by visual inspection, and difference in maximum absorption coefficient could not be justified from that method.
As it is the overall absorption from the surface which is perceived by neighbours to the road, is the average absorp-tion spectre in 1/3-octave bands illustrated in Figure 3-12. The figure illustrates that the maximum absorption is in the 630 Hz band, with an absorption coefficient at 0.48. The absorption spectres are a bit more shifted to lower frequen-cies, than expected from the thickness of the cores. A max-imum absorption in the 1000 Hz band is preferred, as the A-weighted sound pressure level emitted from the vehicles, are highest in that frequency band.
3.4 Summing up on noiseThe SPB result for passenger cars at 60 km/h is 69.1 dB. After 5 days the level has decreased 1.7 dB which is quite
remarkable. In the period from day 5 to 68 the noise level seems to be stabilised. The noise reduction in relation to Nord 2000 is after 68 days is 6.6. It must be remarked that a new dense asphalt concrete will have a noise level that will be around 2 dB lower than the Nord2000 reference levels. After 248 days the noise level decreases about 1 dB. The CPX measurements generally confirm these results.
Comparing the spectra of the PERS to a new dense asphalt concrete with 11 mm aggregates (AC11) the following can be observed:
• From 160 to 800 Hz the PERS is 2 dB lower than the AC11. This can indicate that the PERS have smother texture caused by the smaller aggregate size (5 mm versus 11 mm) and is elastic compared to the.
• From 1000 Hz to 2000 Hz the PERS is 5-6 dB lower than the AC11. In this frequency range the noise gen-erated from vibrations in the tyre caused by the surface texture of the pavement is one of the dominant noise sources. This can also indicate that the PERS have smother texture than the AC11.
• From 2000 to 4000 Hz the PERS is 7 to 8 dB below the AC11. In this frequency range noise generated from air pumping is dominant. This indicates that the PERS has an open and porous structure.
The result gives an indication that the PERS pavement for heavy vehicles has a SPB noise level 5 to 6 dB below the Nord2000 reference level. This is a dB less noise reduction than for passenger cars.

27
3 . No ise measurements
0
0,1
0,2
0,3
0,4
0,5
0,6
0,7
0,8
0,9
1
100 200 300 400 500 600 700 800 900 1000 1100 1200 1300 1400 1500 1600
Abso
rptio
n co
effic
ient
[α]
Frequency [Hz]
Kalvehave
Kalvehave - 1Kalvehave - 2Kalvehave - 3Kalvehave - 4Kalvehave - 5Kalvehave - 6
Figure 3.12: Average absorption spectre in 1/3-octave bands.
0,478165
0
0,1
0,2
0,3
0,4
0,5
0,6
0,7
0,8
0,9
1
250 315 400 500 630 800 1000 1250 1600
Abso
rptio
n co
effic
ient
[α]
Frequency [Hz]
Figure 3.11: FFT spectrums of the absorption of the six cores.

28
4 . Sur face charac ter is t i cs
The different surface characteristics of the PERS pavement have an influence on the generation of tyre-road noise. To describe the pavement surface the surface texture as well as the permeability and the mechanical impedance as an expression of the elasticity of the PERS pavement have been measured. Also the evenness of the pavement has been measured.
4.1 Surface textureThe surface texture has been measured by two different texture laser devices, an in-situ laser which measures 1.5
m sections of the road, and trailer mounted lasers which measures the texture of the two wheel tracks while record-ing CPX measurements. The measurements performed by the in-situ laser inform about the texture of the surface at different positions along the test section, and were per-formed at day 34 after opening the test section for traffic. The texture measurements performed the while recording CPX measurements are averaged over 20 m sections and are therefore comparable to the CPX noise measurements. The trailer measurements are measured at day 6 and 24 after opening the road for traffic.
4. Surface characteristics
Figure 4.1: Texture measurements performed at the Kalvehave test site.

29
4 . Sur face charac ter is t i cs
4.1.1 In-situ-texture laser measurementsThe texture of the surface was measured with the in-situ laser device illustrated in Figure 4.1, five places in the left wheel track. The texture profiles were recorded in five 1.5 m long parallel lines separated with 1 cm. The resolution of the instrument is 0.1 mm in the length direction (x) and 9 μm in the height direction(z). The laser is an LMI Selcom SLS5000 with 16 kHz sampling frequency and a spot size of 0.1 mm, and the sample distance was set to 0.18 mm. For each recorded profile the mean profile depth (MPD) was determined per 100 mm according to the ISO 13473-1 standard.
The average MPD of the five test positions is illustrated in Table 4.1. The results show that the average MPD are the same for position 9 m and 24 m, and for position 39 m and 69 m. The position 54 m is not similar to any of the other po-sitions, and is left out from the average due to irregularities in 100 mm values illustrated in Figure 4.2.
Table 4.2 illustrates the average MPD of the four positions together with three different surfaces. The MPD of the new porous asphalt and the old asphalt concrete are of similar sizes, while the poroelastic surface is lower, and the new stone mastic asphalt is considerable lower.
Figure 4.2 shows the MPD along the 1.5 m sections for each of the parallel measurements. The figures shows that there are some variations in the individual scanned lines, where the MPD is either higher or lower at other sections along the scanned line. The figures illustrates, that the MPD of position 9 m and 24 m, and 39 m and 69 m are of the same magnitude, whereas there are some big peaks in posi-tion 54 m. The average MPD of position 54m differs much from the other MPDs, and is therefor left out from the total average.
Surface Kalvehave9 m
Kalvehave24 m
Kalvehave39 m
Kalvehave54 m
Kalvehave69 m
Kalvehave Avg (excl. 54 m)
Average MPD [mm]
0.58 0.58 0.75 0.90 0.75 0.67
Table 4.1: Average MPD over the 1.5 m at different positions in the left wheel track.
Surface type KalvehaveAvg (excl. 54m) PA - new AC11d - old SMA6+8 - new
Average MPD [mm]
0.67 0.86 0.96 0.41
Table 4.2: Average MPD of different surfaces.

30
4 . Sur face charac ter is t i cs
Figure 4.2: MPD per 100 mm for each test position. Each test position includes five parallel measurements and an average. The total average is an average of all the measurements excluding the measurements at position 54 m.

31
4 . Sur face charac ter is t i cs
Figure 4.3: Texture level in 1/3 octave bands per 1.475 m for each measurement at all five positions.
The texture spectrum were determined in 1/3 octave bands, in the range from 100-0.4 mm according to the technical specification ISO/TS 13473-4 from FFT analysis using an evaluation length of 1.475 m with offset and slope suppres-sion.
From the spectrums in Figure 4.3 can it be seen that only small variations are present from the wavelength 5-0.4 mm, whereas there are some bigger variations from 100-5 mm. The variations in MPD for position 54 m are likewise visible in the spectrum.
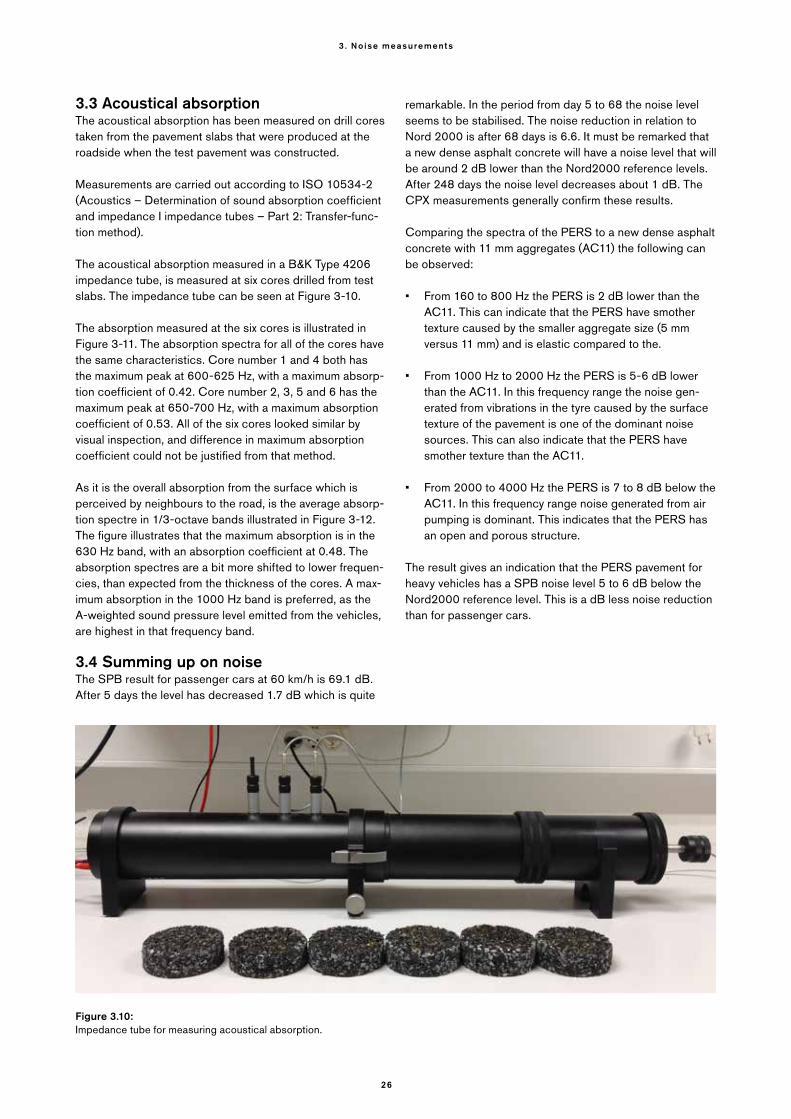
The average spectrums of the different positions are illus-trated in Figure 4.4, together with a new porous asphalt, an old asphalt concrete and a new stone matric asphalt. The spectrum ones again illustrates that the position 9 m and 24 m are of the same magnitude, and likewise position 39 m and 69 m, whereas position 54 m deviates from the others. In comparison with the reference spectrums should the PERS have a lower noise level, as the texture levels are generally higher in the wavelength range from 8-0.4 mm, and lower or similar from 100-10 mm.
32
4 . Sur face charac ter is t i cs
Figure 4.4: Average texture level in 1/3 octave bands for each position measured at Kalvehave. Texture levels likewise measured with the in-situ laser, are included for a new porous asphalt, an old asphalt concrete and a new stone mastic asphalt are included as references.
4.1.2 Trailer laser measurementsAs a measure which is more directly related to the noise characteristics, were the texture measured concomitant with CPX measurements. Texture was measured at August 30, just after opening the section for traffic, at September 5 and 23, which is the 6. and 24. day after opening the section for traffic. The spectrums from before opening the road for traffic showed slightly lower texture levels from 4-1 mm, than the spectrums from after opening the road for traffic. The texture is measured in both wheel tracks, and afterwards averaged to 20 m sections like the CPX meas-urements.
For each recorded profile the mean profile depth (MPD) was determined per 100 mm according to the ISO 13473-1 standard, and afterwards averaged to 20 m sections. The average MPDs for the three 20 m sections are illustrated in Figure 4.5. The figure shows that the first 20 m section has a slightly lower MPD than the two other sections.
The texture spectrum were determined in 1/3 octave bands, in the range from 100-1 mm according to the technical specification ISO/TS 13473-4 from FFT analysis using an evaluation length of 4.096 m with offset and slope sup-pression. The texture spectrums illustrated in Figure 4.6 are averages of both wheel tracks and of measurements
performed at day 6 and 24 after opening for traffic. The spectrums show like for the MPD, that the first section has a lower texture level than the two other sections.
Figure 4.5: MPD per 20 m sections. Values are averages of both wheel tracks, and of measurements performed at day 6 and 24 after opening for traffic.

33
4 . Sur face charac ter is t i cs
Figure 4.6: Texture levels per 20 m sections in 1/3 octave bands. Values are averages of both wheel tracks, and of measurements performed at day 6 and 24 after opening for traffic.
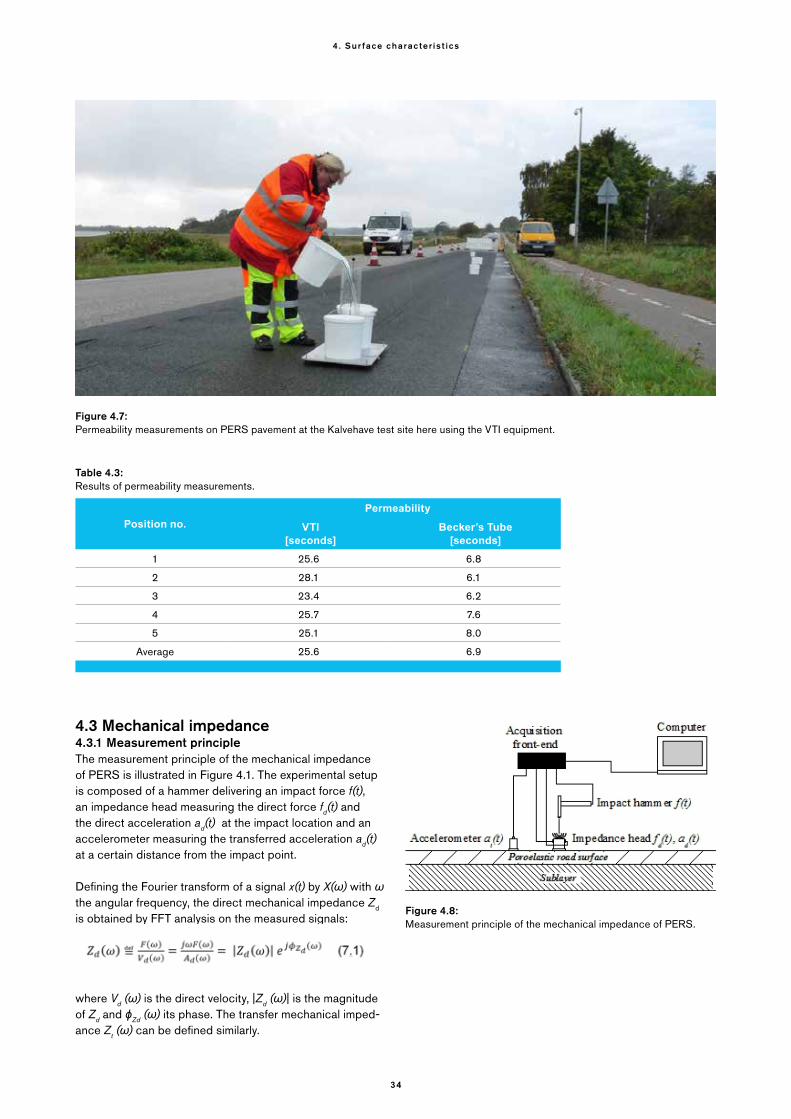
4.2 PermeabilityThe Danish Road Directorate has for many years used the Becker Tube for determined the permeability of porous asphalt. The principle of the method is measuring the time a certain height (100 mm) of a column of water uses to run out of the tube and into the asphalt. A transparent tube with a diameter of 140 mm is placed on the road, and the joint between the tube and the road is sealed with putty. The permeability is given as the flow out time in seconds. DRD normally considers a pavement as clogged when the outflow time is more than 75 seconds [8, 9]. If the draining time is less than 30 seconds, the pavement is in a good state with high permeability [7]. For comparison it can be remarked, that new two layer porous asphalt at the Dan-ish test site at Øster Søgade had an outflow time of 3-10 seconds [8].
The drain pipe used for the test with the VTI equipment conforms to the current European standard for measuring in situ permeability [EN 12697-40, 2005] with the devia-tion that the inner diameter of the stand pipe was 124 mm instead of 125 mm. The test method and the design of the stand pipe differ greatly compared to measuring permea-bility with a Becker’s tube. The outflow time is measured in seconds for 4 liters of water using the European method, while approximately 1.5 liters was used for the Becker’s
tube test for permeability. Therefore around 3 times longer outflow times can be expected using the VTI equipment than using the Becker´s tube. The results presented in Table 4.3 confirm this. On a new single layer porous asphalt at the Arnakke test site the outflow time have been measured to 54 seconds using the VTI equipment [2].
The permeability determined from both the Becker’s tube and equipment from VTI of the test section at Kalvehave has been measured the 1st of October when the PERS pave-ment was one month old. The measurements have been performed in the right wheel track in five consecutive posi-tions along the test section. In Table 4.3 the results of these measurements are presented. The variation between the results of the 5 measurement positions is small indicating a uniformity of the pavement regarding permeability. The aver-age result from the Becker tube is 6.9 seconds which is the same as for a new two-layer porous asphalt. Measured with the VTI equipment the average result is 25.6 seconds which is much lower than a result from a porous pavement. It must be concluded that the PERS has a very fine permeability.
34
4 . Sur face charac ter is t i cs
Position no. Permeability
VTI[seconds]
Becker’s Tube[seconds]
1 25.6 6.8
2 28.1 6.1
3 23.4 6.2
4 25.7 7.6
5 25.1 8.0
Average 25.6 6.9
Figure 4.7: Permeability measurements on PERS pavement at the Kalvehave test site here using the VTI equipment.
Table 4.3: Results of permeability measurements.
4.3 Mechanical impedance4.3.1 Measurement principleThe measurement principle of the mechanical impedance of PERS is illustrated in Figure 4.1. The experimental setup is composed of a hammer delivering an impact force f(t), an impedance head measuring the direct force fd(t) and the direct acceleration ad(t) at the impact location and an accelerometer measuring the transferred acceleration ad(t) at a certain distance from the impact point.
Defining the Fourier transform of a signal x(t) by X(ω) with ω the angular frequency, the direct mechanical impedance Zd is obtained by FFT analysis on the measured signals:
where Vd (ω) is the direct velocity, |Zd (ω)| is the magnitude of Zd and ϕZd (ω) its phase. The transfer mechanical imped-ance Zt (ω) can be defined similarly.
Figure 4.8: Measurement principle of the mechanical impedance of PERS.
35
4 . Sur face charac ter is t i cs
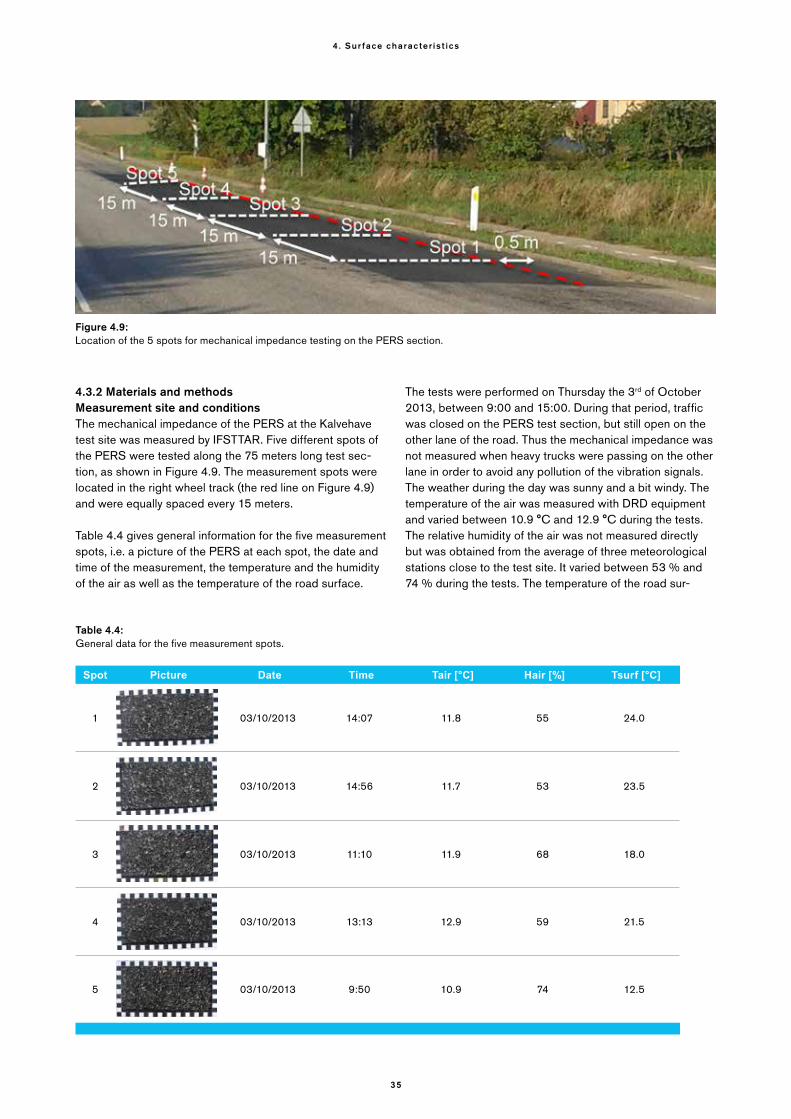
4.3.2 Materials and methodsMeasurement site and conditionsThe mechanical impedance of the PERS at the Kalvehave test site was measured by IFSTTAR. Five different spots of the PERS were tested along the 75 meters long test sec-tion, as shown in Figure 4.9. The measurement spots were located in the right wheel track (the red line on Figure 4.9) and were equally spaced every 15 meters.
Table 4.4 gives general information for the five measurement spots, i.e. a picture of the PERS at each spot, the date and time of the measurement, the temperature and the humidity of the air as well as the temperature of the road surface.
The tests were performed on Thursday the 3rd of October 2013, between 9:00 and 15:00. During that period, traffic was closed on the PERS test section, but still open on the other lane of the road. Thus the mechanical impedance was not measured when heavy trucks were passing on the other lane in order to avoid any pollution of the vibration signals. The weather during the day was sunny and a bit windy. The temperature of the air was measured with DRD equipment and varied between 10.9 °C and 12.9 °C during the tests. The relative humidity of the air was not measured directly but was obtained from the average of three meteorological stations close to the test site. It varied between 53 % and 74 % during the tests. The temperature of the road sur-
Figure 4.9: Location of the 5 spots for mechanical impedance testing on the PERS section.
Spot Picture Date Time Tair [°C] Hair [%] Tsurf [°C]
1 03/10/2013 14:07 11.8 55 24.0
2 03/10/2013 14:56 11.7 53 23.5
3 03/10/2013 11:10 11.9 68 18.0
4 03/10/2013 13:13 12.9 59 21.5
5 03/10/2013 9:50 10.9 74 12.5
Table 4.4: General data for the five measurement spots.

36
4 . Sur face charac ter is t i cs
face was measured with an infrared thermometer Testo, model 830-T1. The temperature at the surface of the PERS increased during the day and varied between 12.5°C in the morning and 24.0°C in the afternoon.
EquipmentThe equipment for testing mechanical impedance can be viewed in Figure 4.10 together with the operator and is composed of:• an impact hammer of the brand PCB (model 086C04)
fitted with the black rubber tip and the additional mass;
• an impedance head of the brand PCB (model 288D01) mounted between two circular steel plates, one at the top to protect the sensor when impacting with the ham-mer and the other at the base stuck on the road surface;
• an accelerometer of the brand PCB (model 352C34) mounted on a hexagonal base stuck on the road surface.
The sensors are connected to the acquisition system com-posed of:• a Dell laptop computer with the Pulse Labshop 11.1
software from Bruël & Kjaer ;
• a Bruël & Kjaer acquisition front-end of type 3560C.
Experimental procedureFirstly, the sensors were stuck on the road surface with superglue HBM X60, a rapid adhesive usually intended for installing strain gages. The curing time of the glue depends on the temperature and can be quite long in practice when
Figure 4.10: IFSTTAR performing mechanical impedance measurements on PERS pavement at the Kalvehave test site.
performing outdoor tests. The gluing was repeated twice for measurement spots 3, 4 and 5 before having a good bond-ing of the sensors on the road surface. Figure 4.11 shows the sensors glued on the PERS. The distance between the accelerometer (transfer point) and the impedance head (direct point) was fixed to 10 cm.
Secondly, the experimental protocol consists in a succes-sion of six impacts on the impedance head using the impact hammer. Each impact is carefully validated by the operator during the test. The transfer function between the impact force and the acceleration is calculated after averaging the spectra of the six signals. The direct and transfer mechan-ical impedances can then be obtained using the relation of equation (1). The test was repeated four times at each spot.
4.3.3 Results and discussionRepeatabilityThe repeatability of the test was assessed for each meas-urement spot. The direct and transfer mechanical imped-ances for a series of 4 tests are given in Figures 4.5 to 4.9 for spots 1 to 5 respectively. Each curve represents the result of a test obtained from a series of six impacts. The magnitude of the mechanical impedance is given in dB relative to 1 N.s/m and the phase is given in degrees. The coherence between the force and the acceleration signals was close to 1 between 100 Hz and 2000 Hz for the direct acceleration and between 100 Hz and about 1000 Hz for the transfer acceleration. Thus the frequency range on the plots is fixed between 100 Hz and 2000 Hz, but it can be observed that the transfer mechanical impedance is quite noisy after 1000 Hz due to the lack of coherence between

37
4 . Sur face charac ter is t i cs
the source and the receiver. Considering these frequency ranges, it is observed that the repeatability of the magni-tude and the phase of the direct mechanical impedance is excellent for the 5 measurement spots. For the transfer mechanical impedance, the repeatability is also good for the
magnitude while some slight discrepancies can be ob-served for the phase. Taken as a whole, it can be concluded that the repeatability of the test is quite acceptable for all measurement spots, allowing a comparison of the results at the different spots.
Figure 4.11: Location of the 5 spots for mechanical impedance testing on the PERS section.
Figure 4.12: Direct (left) and transfer (right) mechanical impedances for measurement spot 1.
100 200 500 1000 200030
40
50
60
70
f (Hz)
20 lo
g |Z
d| (dB
rel 1
N.s
/m)
100 200 500 1000 2000-180
-100
0
100
180
f (Hz)
φ Z d (deg
)
Test 1Test 2Test 3Test 4
100 200 500 1000 200080
90
100
110
120
f (Hz)
20 lo
g |Z
t| (dB
rel 1
N.s
/m)
100 200 500 1000 2000-180
-100
0
100
180
f (Hz)
φ Z t (deg
)
Test 1Test 2Test 3Test 4
100 200 500 1000 200040
50
60
70
f (Hz)
20 lo
g |Z
d| (dB
rel 1
N.s
/m)
100 200 500 1000 2000-180
-100
0
100
180
f (Hz)
φ Z d (deg
)
Test 1Test 2Test 3Test 4
100 200 500 1000 200080
90
100
110
120
f (Hz)
20 lo
g |Z
t| (dB
rel 1
N.s
/m)
100 200 500 1000 2000-180
-100
0
100
180
f (Hz)
φ Z t (deg
)
Test 1Test 2Test 3Test 4
Figure 4.13: Direct (left) and transfer (right) mechanical impedances for measurement spot 2.

38
4 . Sur face charac ter is t i cs
100 200 500 1000 200030
40
50
60
f (Hz)
20 lo
g |Z
d| (dB
rel 1
N.s
/m)
100 200 500 1000 2000-180
-100
0
100
180
f (Hz)
φ Z d (deg
)
Test 1Test 2Test 3Test 4
100 200 500 1000 200080
90
100
110
120
f (Hz)
20 lo
g |Z
t| (dB
rel 1
N.s
/m)
100 200 500 1000 2000-180
-100
0
100
180
f (Hz)
φ Z t (deg
)
Test 1Test 2Test 3Test 4
100 200 500 1000 200030
40
50
60
f (Hz)
20 lo
g |Z
d| (dB
rel 1
N.s
/m)
100 200 500 1000 2000-180
-100
0
100
180
f (Hz)
φ Z d (deg
)
Test 1Test 2Test 3Test 4
100 200 500 1000 200090
100
110
120
f (Hz)
20 lo
g |Z
t| (dB
rel 1
N.s
/m)
100 200 500 1000 2000-180
-100
0
100
180
f (Hz)
φ Z t (deg
)
Test 1Test 2Test 3Test 4
Figure 4.14: Direct (left) and transfer (right) mechanical impedances for measurement spot 3.
Figure 4.15: Direct (left) and transfer (right) mechanical impedances for measurement spot 4.
100 200 500 1000 200030
40
50
60
f (Hz)
20 lo
g |Z
d| (dB
rel 1
N.s
/m)
100 200 500 1000 2000-180
-100
0
100
180
f (Hz)
φ Z d (deg
)
Test 1Test 2Test 3Test 4
100 200 500 1000 200090
100
110
120
130
f (Hz)
20 lo
g |Z
t| (dB
rel 1
N.s
/m)
100 200 500 1000 2000-180
-100
0
100
180
f (Hz)
φ Z t (deg
)
Test 1Test 2Test 3Test 4
Figure 4.16: Direct (left) and transfer (right) mechanical impedances for measurement spot 5.
HomogeneityThe homogeneity of the PERS test section is assessed only from the direct mechanical impedance. Indeed, the transfer
mechanical impedance is not interpreted here since it needs an elaborated model due to wave dispersion and damping in the structure.

39
4 . Sur face charac ter is t i cs
Figure 4.17: Comparison of the direct mechanical impedances for the five spots of the PERS test section in Kalvehave.
100 200 500 1000 200030
40
50
60
70
f (Hz)
20 lo
g |Z d| (d
B re
l 1 N
.s/m)
100 200 500 1000 2000-180
-100
0
100
180
f (Hz)
φ Z d (deg
)
Spot 5Spot 4Spot 3Spot 2Spot 1
Figure 4.17 gives the magnitude and the phase of the direct mechanical impedance. The curves at the different spots have quite similar shapes. At low frequency, there is a linear decrease which is typical of an ideal spring. At high frequencies, there is a linear increase which is typical of an ideal mass. At medium frequencies, there is a minimum value at a frequency corresponding to the resonance of the mass spring system. The minimum value corresponds to the damping of the system. At the resonance frequency a typical phase shift is also observed.
The magnitude differences observed in Figure 4.17 can be qualitatively assessed from a simple Single Degree Of Free-dom (SDOF) system consisting in a mass over a parallel spring/dashpot combination. The stiffness of the spring is
denoted while the damping constant of the dashpot is denoted c. The natural frequency of such a system is f0 = √k/m.
The SDOF parameters can be assessed manually from the experimental data. First the natural frequency f0 is deter-mined from the phase shift in Figure 4.17. Then the damping constant is estimated from the magnitude value of the mechanical impedance in Figure 4.17, which is close to the minimum value. The stiffness k is estimated from the value of the dynamic stiffness Dd at low frequency, i.e. between 100 Hz and 200 Hz. The dynamic stiffness can be derived from the mechanical impedance and is depicted in Figure 4.18 for each spot. Finally the mass m can be easily calculated from the estimates of f0 and k.
Figure 4.18: Comparison of the direct dynamic stiffness for the five spots of the PERS test section in Kalvehave.
100 200 500 1000 2000100
110
120
130
140
f (Hz)
20 lo
g |D
d| (dB
rel 1
N/m
)
100 200 500 1000 2000-180
-100
0
100
180
f (Hz)
φ D d (deg
)
Spot 5Spot 4Spot 3Spot 2Spot 1

40
4 . Sur face charac ter is t i cs
Table 4.5 gives an estimate of the SDOF parameters obtained from the experimental data. The natural frequency varies between 437.5 Hz and 750.0 Hz for the different spots. The damping constant is 61.2 N.s/m for spot 5 and varies between 93.3 N.s/m and 110.3 N.s/m for the other spots. The stiffness is around 3.2e5 N/m for spot 5, around 5.6e5 N/m for spots 3 and 4 and respectively 8.9e5 N/m and 10.0e5 N/m for spots 1 and 2. Consequently the mass is around 0.04 kg for all spots which correspond to the measured mass of the impedance head sensor.
The dynamic Young’s modulus E of the PERS can be estimated from the dynamic stiffness k using the following relation:
(2)
where h = 0.03 m is the thickness of the PERS assumed to be homogenous and r = 0.01 m is the radius of the circular steel plates glued on the PERS. Table 4.6 gives the values of the dynamic Young’s modulus for each spot. The value of E ranges between 30 MPa and 95 MPa. Thus, despite some inhomogeneity of the PERS section, a rolling noise reduction can be expected since the stiffness of the PERS is close to the stiffness of standard tyres.
Spot f0 [Hz] c [N.s/m] k [N/m] m [kg]1 737.5 93.3 8.9e5 0.042
2 750.0 110.3 10.0e5 0.045
3 562.5 93.3 5.6e5 0.045
4 637.5 98.1 5.6e5 0.035
5 437.5 61.2 3.2e5 0.042
Table 4.5:Estimation of the SDOF parameters from the experimental data.
E= kh πr2
SurfacePERS Kalvehave (Spot 2)
PERS Arnakke (June 2012)
PERS Arnakke (October 2013)
DAC 0/10 Ifsttar Nantes
h [m] 0.03 0.03 0.03 0.05
k [N/m] 10.0e5 10.0e5 7.1e5 10.0e8
E [MPa] 95 95 68 15915
Figure 4.19 shows that the direct mechanical impedance of a PERS is much smaller than that of a DAC, which is com-posed of stiffer materials. Consequently, due to the high stiffness, there is no resonance frequency for DAC within the studied frequency range. The curves are very close be-tween the Kalvehave PERS (spot 2) and the Arnakke PERS in June 2012. Spot 2 was chosen because the temperature of the surface during the test (23.5°C) was very close to that during the test in Arnakke in June 2012 (22.3°C). Then it is observed that the PERS in Arnakke and in Kalvehave have very similar elastic behaviour at an equivalent age. This is an important result since the formulation of the PERS on both Danish test sites was the same. Another remark is that after about 15 months, the mechanical impedance of the PERS in Arnakke in October 2013 was not so far from the initial measurements in June 2012. The mechanical imped-ance decreases with the age, indicating a possible soften-ing of the PERS with time. Nevertheless, knowing how the PERS was deteriorated after 15 months in Arnakke, it is impressive to note how few the mechanical impedance was impacted by aging. This will need to be confirmed by further measurements.
The dynamic stiffness of each surface can be assessed from Figure 4.20 and is given in Table 4.7. It is observed that the dynamic Young modulus of the PERS is about 150 times smaller than the dynamic Young modulus of the DAC 0/10.
Table 4.6:Dynamic Young’s modulus E calculated from the dynamic stiffness k.
Spot 1 2 3 4 5k [N/m] 8.9e5 10.0e5 5.6e5 5.6e5 3.2e5
E [MPa] 85 95 54 54 30
Table 4.7:Elastic properties of the different road surfaces used for comparison.
Comparison with other road surfacesFigures 4.19 and 4.20 give respectively a comparison of the direct mechanical impedance and of the direct dynamic stiffness measured on three different road surfaces: the PERS of Kalvehave test site, the PERS 2 of Arnakke test site at two different ages (June 2012 and October 2013) and a Dense Asphalt Concrete (DAC 0/10) located on Ifsttar reference test track in Nantes (France).
4.3.4 Conclusions on mechanical impedanceThe mechanical impedance was successfully tested on 5 different spots of the PERS test section in Kalvehave. The main results are the following:
• The repeatability of the test at the 5 spots is good between 100 Hz and 2000 Hz for the direct mechanical impedance. The frequency range is limited to 100 Hz to 1000 Hz for the transfer mechanical impedance.
• The homogeneity of the PERS was assessed by identi-fying a SDOF model to the direct experimental results. The damping constant of the PERS was evaluated between 61.2 N.s/m and 110.3 N.s/m. The stiffness was evaluated between 3.2e5 N/m and 10.0e5 N/m, leading to a dynamic Young modulus between 30 MPa and 95

41
4 . Sur face charac ter is t i cs
100 200 500 1000 200040
60
80
100
f (Hz)
20 lo
g |Z
d| (dB
rel 1
N.s
/m)
100 200 500 1000 2000-180
-100
0
100
180
f (Hz)
φ Z d (deg
)
Kalvehave - Spot 2Arnakke (June 2012)Arnakke (October 2013)DAC 0/10
100 200 500 1000 2000100
120
140
160
180
f (Hz)
20 lo
g |D
d| (dB
rel 1
N/m
)
100 200 500 1000 2000-180
-100
0
100
180
f (Hz)
φ Dd (d
eg)
Kalvehave - Spot 2 Arnakke (June 2012)Arnakke (October 2013)DAC 0/10
Figure 4.19:Comparison of the direct mechanical impedance of the PERS test section in Kalvehave with the PERS test section in Arnakke at different ages. DAC 0/10 is a conventional dense asphalt concrete located on IFSTTAR reference test track in Nantes.
Figure 4.20:Comparison of the direct dynamic stiffness of the PERS test section in Kalvehave with the PERS test section in Arnakke at different ages. DAC 0/10 is a conventional dense asphalt concrete located on Ifsttar reference test track in Nantes.

42
4 . Sur face charac ter is t i cs
MPa for a 30 mm thick PERS. Despite some inhomoge-neity, these values are close to the stiffness of standard tyres and could then lead to noise reduction by less tyre deflection and vibrations during rolling.
• The direct mechanical impedances of the PERS in Kalvehave and in Arnakke at a similar age are very close. This is an important result for PERS construction since both test sites are based on the same formulation.
• PERS have a dynamic Young modulus about 150 times smaller than a standard dense asphalt concrete. There is no doubt that this drastic stiffness reduction will con-tribute to tyre/road noise abatement.
4.4 Evenness of the pavementSince 1994 the DRD has measured the longitudinal and transverse profile of pavements by laser based equipment the Profilograph (see Figure 4.21). Based on the longi-tudinal profile, it is possible to calculate the International Roughness Index (IRI) of the pavements. The evenness of the PERS pavement has been measured by DRD using the Profilograph. The results are expressed as the International Roughness Index (IRI) that indicates the displacement in height in meter over one kilometre of road.
In general an IRI-value of 0.8 m/km should be possible to obtain for a new constructed pavement. In Denmark the average IRI value on the state road network is approx.
1.26 m/km. The measured IRI of 1.99 and 2.36 m/km (see Table 4.8) is relatively high indicating that the PERS has an uneven megatexture. In Section 1.2 it was described that the pavement became uneven in the longitudinal direction of the pavement with waves with a wavelength of 2 to 6 meter that as a result of intensive compaction by a roller. The IRI measurements confirm this.
4.5 Summing up on surface characteristicsThe surface texture has been measured by two different texture laser devices, an in-situ laser which measures 1.5 m sections of the road, and trailer mounted lasers which measures the texture of the two wheel tracks while record-ing CPX measurements. Using the in-situ equipment the average medium profile depth (MPD) was measured to 0.67 mm and using the trailer mounted method 0.85 mm.
The permeability was measured by the Becker’s tube. The variation between the results 5 measurement positions along the test section was small indicating a uniformity of the pavement regarding permeability. The average result from the Becker tube is 6.9 seconds which is the same as for new two-layer porous asphalt.
The mechanical impedance was measured on 5 different spots of the PERS test section. The stiffness was between 3.2e5 N/m and 10.0e5 N/m, leading to a dynamic Young modulus between 30 MPa and 96 MPa for a 30 mm thick PERS. Despite some inhomogeneity, these values are close to the stiffness of standard tyres and could then lead to noise reduction by less tyre deflection and vibrations during rolling. The dynamic Young modulus is around 150 times less than that for a standard dense asphalt concrete.
The measured average International Roughness Index (IRI) is 2.18 m/km. This is a relatively high IRI value indicating that the PERS has an uneven megatexture. In Section 1.2 it was described that the pavement became uneven in the longitudinal direction of the pavement with waves with a wavelength of 2 to 6 meter that as a result of intensive com-paction by a roller. The IRI measurements confirm this.
Date
International Roughness Index (IRI) [m/km]
Left wheel path
Right wheel path
Average
16th of October 2013
1.99 2.36 2.18
Table 4.8:The result of the evenness measurements at the PERS test.
Figure 4.21: The measurement vehicle used for the IRI measurements.

43
5 . M icroscopy and image ana lys is
5.1 Estimation of built in air voidDrill cores have not been taken from the Kalvehave test section in order not to harm the pavement. When the pavement was constructed some test slabs of the material was constructed. Three slices have been cut from one of these slabs. These slices are impregnated with epoxy resin containing fluorescent dye. The size of the plane sections corresponds to the width and height of the samples and the thickness is approximately 10 mm.
The three plan sections of the test slab under incident UV-light can be seen in Table 5.1. The air voids filled with epoxy resin will under these conditions light up like a bright green colour. The content of air voids were measured by image analysis and the results for each test sections can be seen in Table 5.1. The air void of the three samples are
29.5 %, 25.6 % and 28.1 % giving an average built in air void of 27.7%. This must be considered a high built in air void for example compared to the air void of two-layer po-rous pavements at the Danish Øster Søgade test site at 23 to 27 % when new [8].
The images of the PERS samples in Table 5.1 also show the distribution of the stone aggregates (reed) and the rubber aggregates (black). From these images it looks like the distribution of aggregates is very uniform in the whole layer of the pavement.
5.2 Investigation of the pavement structureThe thin section is taken from a piece cut vertically from the sample. To illustrate an example can be seen in figure 5.2.
5. Microscopy and image analysis
Location Air void [%]
Image of sampleGreen air, black rubber and read stone
Kalvehave
29.5
25.6
28.1
Table 5.1: Air voids measured by image analysis in 3 PERS samples. The green areas are air voids, the reed areas are stone aggregates and the black areas are rubber aggregates.

4 4
5 . M icroscopy and image ana lys is
The standard thin sections are impregnated with epoxy resin containing fluorescent dye which fills all air voids, porous rocks and cracks. Normally thin sections have a thickness of approx. 20 µm. In this case, where it is a PERS surface, which is produced with rubber granulate, the final thickness of the sections is approx. 90 µm so that the rubber is not pulled out during the final polishing. The investigation of the thin section under the microscope has been carried out with transmitted light.
The different layers of the Kalvehave test slab were inves-tigated in [1] where it was concluded that there is not so
much polyurethane in the top layers and that the polyure-thane present is generally situated under the stone and rubber aggregates and not coating the aggregates all way around. This will presumably cause a reduced strength of the material in the surface of the pavement. In the lower layers more polyurethane is present and the aggregates are coated with this material. There is a tendency of accumu-lation of polyurethane in the bottom layers. This can be explained by the polyurethane used in the Kalvehave mix had a low viscosity and ran off the top aggregates and accumu-lated in the bottom of the layers. This low viscosity was also observed during the laying process.
Besides this there seems to be a tendency of the rubber materials packing together else it looks like a homogeneous material (see Figure 5.2 – 5.5). Some steel fibers from the rubber can be seen. In the polyurethane mortar only a few air bubbles are seen. All the pictures from the microscopy of the thin section are seen in appendix A and B. The original size of the samples on the images in the following and in the annexes is 1.22 x 1.63 mm. The images are shown with a magnification of 25 times the original size. See also Annex A and B for more images from Kalvehave.
Figure 5.1: Example of cutting thin sections from samples (not PERS sample).
Aggregate
Mortar of polyurethan
Rubber
Figure 5.2: Example of view in the microscope with normal light.
Figure 5.3: Example of view in the microscope with UV light.
Rubber
Mortar of polyurethan
Steel fibre in rubber
Figure 5.4: Example of view in the microscope with normal light.
Figure 5.5: Example of view in the microscope with UV light.

45
6 . Ro l l ing res is tance
6. Rolling resistance
The rolling resistance have been measured by TUG on the 3rd of October 2013 when the PERS pavement was 1 month old. Original asphalt concrete surfaces used on the road nearby the test sections were used as reference surfaces. Tests were performed at 80 km/h on dry road surfaces with load of 4000 N and inflation pressure 210 kPa (regulated) [5].
Three tyres considered to be "informal reference tyres" for rolling resistance were used for these measurements:
1. Michelin PRIMACY HP 225/60R16
2. Uniroyal TIGER PAW (SRTT)
3. P225/60R16 and Avon SUPERVAN AV4 195R14C
The measurements were performed both on the PERS pavement as well as on the adjacent old asphalt concrete that in this case is used as a reference pavement. Results of all measurements are presented in Table 6.1. The rolling re-sistance of the PERS pavement is 3.9 to 8.9 % higher than the old asphalt concrete. The average difference for these three tyres is 7.2 %. This might be caused by the fact that the PERS pavement has a relative high unevenness (see Section 4.4). The results are also shown in Figure 6.2.
Tyre PERS Old dense asphaltAAV4 0,0187 0,0172
MCPR 0,0158 0,0152
SRTT 0,0135 0,0124
Table 6.1: Results of rolling resistance measurements at 80 km/h at the Kalvehave test site. The difference in percentage of the old asphalt concrete is also shown.
Figure 6.2:Results of rolling resistance measurements at 80 km/h at the Kalvehave test site.
0
0,002
0,004
0,006
0,008
0,01
0,012
0,014
0,016
0,018
0,02
AAV4 MCPR SRTT
PERS
Old dense asphalt
Figure 6.1:TUG performing trailer rolling resistance measurements at the Kalvehave PERS test section on the 3rd of October 2013.

46
7. V isua l inspec t ion
the PERS was 32 days old. The pavement structure looked like when it was newly laid (see Figure 7.1). A little tendency of beginning ravelling can be seen as a few aggregates are missing in the pavement surface (see Figure 7.2).
Visual inspections have frequently been performed at the test site. The pavement has also been followed on weekly basis from the laboratory by using the video camera at the test site.
7.1 After 32 daysAn inspection was performed on 1st of October 2013 when
7. Visual inspection
Figure 7.1: Overview of the PERS pavement after 32 days.
Figure 7.1: Overview of the PERS pavement after 32 days.

47
7. V isua l inspec t ion
7.2 After 70 daysOn November 8th after 70 days the PERS pavement looks like it did in the beginning of October with light tendencies of ravelling (see Figure 7.3).
Two continues lines along the pavement can be observed (see Figure 7.4). These lines have been there since the
pavement was constructed in August 2013, but have not been so visible on the previous photos. It looks like they come either from the rolling procedure or from a tyre that has been driving on the not totally cured PERS just after the construction of the pavement.
Figure 7.3: Close up of the PERS pavement at the Kalvehave test site after 70 days. The yellow arrows marks lost aggregates. The size of the black and white squares is 10x10 mm.
Figure 7.4: The PERS pavement after 130 days. The yellow arrow mark two continuous lines in the pavement surface.

48
7. V isua l inspec t ion
7.3 After 173 daysOn the 19th of February 2014 DRD performed a visual inspection at the test site when the PERS was 173 days old. It was in the Danish winter period but the weather was cloudy with little rain and a temperature of 6˚ C and no signs of snow. In January 2014 there had been 1 to 2 weeks with snow. Winter maintenance and snow removal from the road had been performed using a snowplough.
Figure 7.5 shows an overview of the PERS pavement. Ravelling can be observed in the wheel tracks and a series of stripes with an angle of around 60º can be observed
with a distance of 2 to 5 meter. These observations will be described further below.
7.3.1 RavellingFigure 7.6 shows the eastern part of the PERS section. It can be seen that the ravelling is less intense at the eastern beginning of the PERS section than further west. There is a clear change in ravelling where the two read arrows are placed on the figure. A close up picture of the area with little ravelling can be seen in Figure 7.8, a close up picture of the area with medium ravelling can be seen in Figure 7.9 and a close up picture of the area with much ravelling can be seen
Figure 7.5: Overview of the PERS pavement at Kalvehave 19th of February 2014 seen towards west.
Figure 7.6: The eastern part of the PERS test section seen towards east.
Little raveling
Medium raveling

49
7. V isua l inspec t ion
in Figure 7.10. It seems that it is mainly the stone aggre-gates that have been lost from the pavement surface.
Figure 7.7 shows the western and the middle part of the PERS section. Also here there is a clear change in ravelling
where the two read arrows are placed on the figure. Differ-ent batches of the mixed PERS material have been used on the test section. The batches were delivered in an asphalt truck. The change in the level of ravelling might be occurring when a new batch of the material have been used.
Figure 7.7: The western and middle part of the PERS test section seen towards east.
Figure 7.8: Close up picture of the pavement surface at the eastern end of the test PERS section with only little ravelling. The yellow arrows marks lost aggregates.
Much raveling
Medium raveling

50
7. V isua l inspec t ion
Figure 7.9: The western and middle part of the PERS test section seen towards east.
Figure 7.10: Close up picture of the pavement surface at western part of the test PERS section much medium ravelling.

51
7. V isua l inspec t ion
Stripping of aggregates could be observed on the band of porous asphalt at the roadside and on the white road mark-ing stripe (see Figure 7.11).
At a few sections of a length of 30 to 50 cm along the band of porous asphalt the PERS pavement does not glue to the
sub layer (see Figure 7.12). This has been the case from the construction of the PERS.
7.3.2 Snow plough effect As mentioned previously a series of stripes with an angle of around 60º to the driving direction can be observed with
Figure 7.11: Stripping of aggregates was observed on the band of porous asphalt at the roadside.
Figure 7.12: The PERS pavement not gluing to the sub layer.

52
7. V isua l inspec t ion
a distance of around 2 to 5 meter (see Figure 7.13). Other damaged areas on the pavement surface can also be ob-served. It is the judgement of the authors that this is caused
by a snowplough driving on the road in the snow periods. A few potholes were also observed presumably also caused by the snowplough (see Figure 7.14 and 7.15).
Figure 7.13: Stripes with an angle of around 60º to the driving direction on the PERS pavement marked with reed arrows as well as other damages on the surface.
Figure 7.14: Close up picture of one of the larger snowplough damaged areas.

53
7. V isua l inspec t ion
7.4 After 213 daysThe test section was inspected on 31st of March when the PERS section was 213 days old. The impression is the same as after 173 days. Ravelling and scars from the snow
plough. It does not look like the ravelling has become signifi-cantly verse. There has been no snow in the period since the last inspection so presumably there has been no snow plough on the PERS section the last 1½ month.
Figure 7.15: Pothole in the PERS pavement.
Figure 7.16: Overview of the PERS test section after 213 days.

5 4
7. V isua l inspec t ion
Figure 7.17: Close up of an area in the wheel tracks with heavy ravelling. It is mainly the stone aggregates that have disappeared; and they can be found at the kerbside.
Figure 7.18: Close up of an area between the wheel tracks with no ravelling.

55
8 . Conc lus ions
Since the PERS test section at Kalvehave was constructed in the end of August 2013 a comprehensive series of meas-urements have been performed over a period of around 250 days in order to characterise the PERS pavement in relation to friction, noise, durability etc.
The friction has been measured using three different equip-ment’s and measurement methods the Pendulum, the Porta-ble Friction Tester and ROAR measurement car. The friction measured by the Pendulum at the 5 different positions along the test section is practically the same indicating a uniform friction on the PERS. The friction has been measured by the ROAR car 4 times over a 6 month period and the results indicate a slight tendency for reduction of the friction over time. When the PERS was around 2 weeks old the friction in the two wheel tracks was 0.60 and 0.54 which is over the Danish criteria value of 0.40 showing a reasonable friction also when the PERS was new.
The SPB noise result for passenger cars at 60 km/h was 69.1 dB. After 5 days the level had decreased 1.7 dB which is quite remarkable. In the period from day 5 to 68 the noise level seems to be stabilised. The noise reduction in relation to Nord 2000 is after 68 days is 6.6. It must be remarked that a new dense asphalt concrete (AC11) will have a noise level that will be around 2 dB lower than the Nord2000 reference levels. After 248 days the noise level decreases about 1 dB further. The CPX measurements generally con-firm these results.
8. Conclusions
Comparing the spectra of the PERS to a new dense asphalt concrete with 11 mm aggregates (AC11) the following can be observed:
• From 160 to 800 Hz the PERS is 2 dB lower than the AC11. This can indicate that the PERS have smother texture caused by the smaller aggregate size (5 mm versus 11 mm) and is elastic compared to the rubber granulates.
• From 1000 Hz to 2000 Hz the PERS is 5-6 dB lower than the AC11. In this frequency range the noise gen-erated from vibrations in the tyre caused by the surface texture of the pavement is one of the dominant noise sources. This can also indicate that the PERS have smother texture than the AC11.
• From 2000 to 4000 Hz the PERS is 7 to 8 dB below the AC11. In this frequency range noise generated from air pumping is dominant. This indicates that the PERS has an open and porous structure.
The result gives an indication that the PERS pavement for heavy vehicles has a SPB noise level 5 to 6 dB below the Nord2000 reference level. This is around two dB less noise reduction than for passenger cars.
The surface texture has been measured by two different texture laser devices, an in-situ laser which measures

56
8 . Conc lus ions
1.5 m sections of the road, and trailer mounted lasers which measures the texture of the two wheel tracks while record-ing CPX measurements. Using the in-situ equipment the average medium profile depth (MPD) was measured to 0.67 mm and using the trailer mounted method 0.85 mm.
The permeability was measured by the Becker’s tube. The variation between the results 5 measurement positions along the test section was small indicating a uniformity of the pavement regarding permeability. The average result from the Becker tube is 6.9 seconds which is the same as for new two-layer porous asphalt.
The average built in air void has been measured to 27.7 % by using image analysis on thin and plane sections. The high air void is in consistence that the PERS has a good permeability.
The mechanical impedance was measured on 5 different spots of the PERS test section. The stiffness was between 3.2e5 N/m and 10.0e5 N/m, leading to a dynamic Young modulus between 30 MPa and 96 MPa for a 30 mm thick PERS. Despite some inhomogeneity, these values are close to the stiffness of standard tyres and could then lead to noise reduction by less tyre deflection and vibrations during rolling. The dynamic Young modulus is around 150 times less than that for a standard dense asphalt concrete.
The measured average International Roughness Index (IRI) is 2.18 m/km. This is a relatively high IRI value indicating that the PERS has an uneven megatexture. During the con-struction the pavement became uneven in the longitudinal direction of the pavement with waves with a wavelength of 2 to 6 meter that as a result of intensive compaction by a roller. The IRI measurements confirm this.
The measurements of rolling resistance were performed both on the PERS pavement as well as on the adjacent old asphalt concrete that in this case is used as a reference pavement. The rolling resistance of the PERS pavement was on average 7.2 % higher than the old asphalt concrete. This might be caused by the fact that the PERS pavement has a relative high unevenness (IRI).
The visual inspections have been performed over the first 213 days of the PERS pavement lifetime. The observations show that a little tendency of ravelling can be observed after the pavement is a month old. During the winter period heavy ravelling has developed in the wheel tracks and it seems that it is primarily the stone aggregates that have disap-peared leaving back the softer rubber particles in the wheel tracks. This could be the reason for the 1 dB increase of noise over the winter period.

57
9 . References
1. Bendtsen, Skov, Andersen, Neidel, Råberg and Cesbron (2014):“Laboratory measurements on PERS test slabs”. PERSUADE report 2014.
2. Bendtsen, Hans; Olesen, Erik; Pigasse, Gilles; Andersen, Bent; Raaberg, Jørn; Kalman, Bjørn; Cesbron, Julien (2013): “Measurements at the Arnakke test site with small PERS sections”. PERSUADE report 2013.
3. Olesen, Erik; Bendtsen, Hans; Jensen, Bjarne Bo (2014): ”Experiences constructing Danish PERS test section”. Internal PERSUADE Report, 2012.
4. Wälivaara, Bengt (2007): "Validering av VTI-PFT version 4. Mätningar på plana och profilerade vägmarke-ringar". VTI-notat 16-2007, Linköping, Sweden.
5. Leest, A. J. v.; Crielaard, J. J.; Gruie, H. J. A. J.; Gorkum, F. v., Heerkens, J. C. P.; Nugteren; H. P., & Fafie, J. J. (1997): "Guidelines for determining the cleaning effects of porous asphalt," in European Conference on Porous Asphalt, Vol. I, Madrid, March 12-14, 1997, Asociación Española de la Carretera, Madrid, pp. 635-647.
6. Ellebjerg, Lars; Bendtsen, Hans (2008): Two-layer po-rous asphalt – lifecycle - The Øster Søgade experiment. Danish Road Directorate, Danish Road Institute, Report 165, 2008. See: www.vejdirektoratet.dk.
7. Raaberg, J; Neidel, A (2009): Øster Søgade. 8 år med 2-lag drænasfalt (“Øster Søgade, 8 years with two layer porous asphalt” in Danish). Danish Road Directorate, Danish Road Institute, Rapport 168, 2009. See: www.vejdirektoratet.dk.
8. Bendtsen, Hans (2014): Støjdæmpning over lang tid; støjreducerende tyndlagsbelægninger - Statusrapport 2010 (Noise reduction over long time, noise reducing thin layer pavements – status report 2010 in Danish with English summary). Danish Road Directorate, Report, 2014. See: www.vejdirektoratet.dk
9. References

58
Appendix A
Appendix A:Thin sections Kalvehave core 1
Thin section with position A - F
Persuade pavement from Kalvehave, August 2013.
Thickness off the thin section is app.90 µy.
25x / 1,69 x 2,56 mm
Pos A Pos A (with UV light)
Surface
Mortar of polyurethan
Rubber
Aggregate
Pos B Pos B (with UV light)
Surface
Rubber
Mortar of polyurethan
Aggregate
A B
CD
E
F
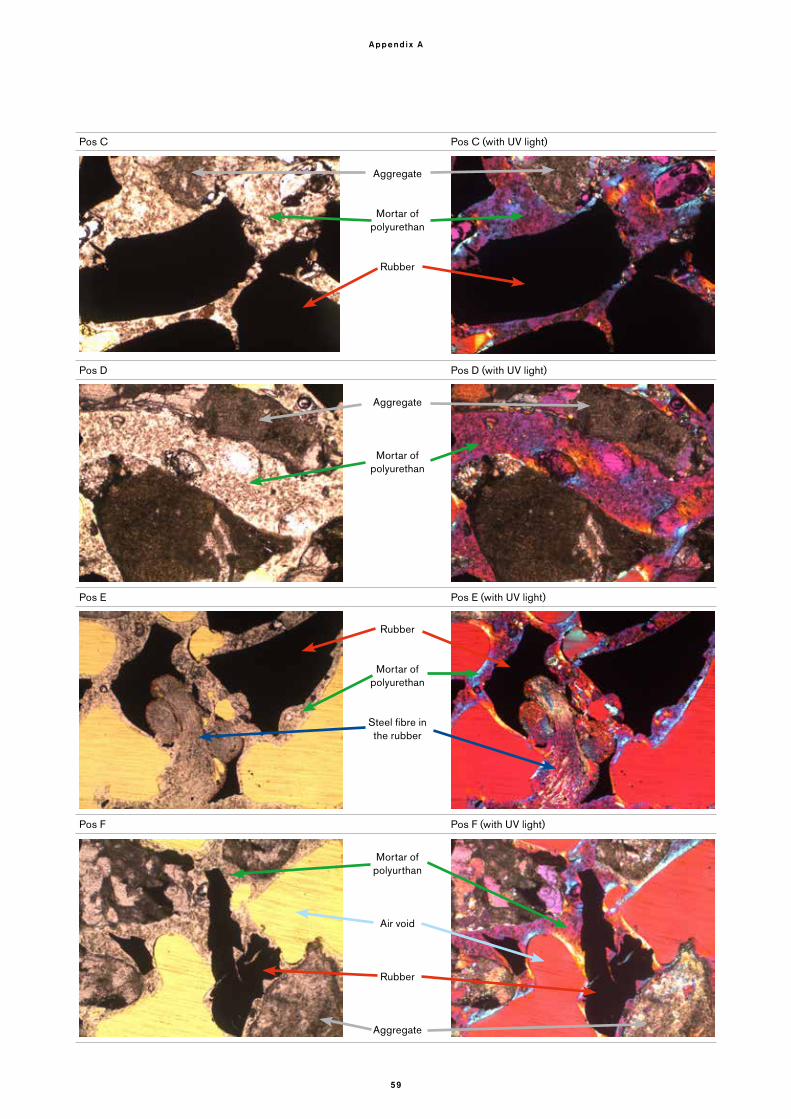
59
Appendix A
Pos C Pos C (with UV light)
Aggregate
Mortar of polyurethan
Rubber
Pos D Pos D (with UV light)
Aggregate
Mortar of polyurethan
Pos E Pos E (with UV light)
Rubber
Mortar of polyurethan
Steel fibre in the rubber
Pos F Pos F (with UV light)
Mortar of polyurthan
Air void
Rubber
Aggregate

60
Appendix B
Appendix B:Thin sections Kalvehave core 2
Thin section with position A - F
Persuade pavement from Kalvehave, August 2013.
Thickness off the thin section is app.90 µy.
25x / 1,69 x 2,56 mm
Pos A Pos A (with UV light)
Surface
Mortar of polyurethan
Aggregate
Rubber
Pos B Pos B (with UV light)
Rubber
Mortar of polyurethan
Aggregate
A
BC
D
E
F

61
Appendix B
Pos C Pos C (with UV light)
Aggregate
Mortar of polyurethan
Rubber
Aggregate
Pos D Pos D (with UV light)
Aggregate
Mortar of polyurethan
Pos E Pos E (with UV light)
Rubber
Mortar of polyurethan
Steel fibre in the rubber
Pos F Pos F (with UV light)
Mortar of polyurthan
Air void
Rubber
Aggregate

Vejdirektoratet har lokale kontorer i:
Aalborg, Fløng, Middelfart, Næstved og Skanderborg samt hovedkontor i København
Find mere information på vejdirektoratet.dk
Vejdirektoratet Niels Juels Gade 13Postboks 90181022 København K
Telefon 7244 [email protected]
Annex E