performance of indian power sector during a decade under
TRANSCRIPT

Performance of Indian power sector during a decade underrestructuring: a critique$
D. Parameswara Sharmaa,*, P.S. Chandramohanan Nairb, R. Balasubramanianc
aDepartment of Space, CED, New BEL Road, Bangalore 560 094, Karnataka, Indiab Department of Electrical Engineering, College of Engineering, Trivandrum 695 016, Kerala, India
c Centre for Energy Studies, Indian Institute of Technology, New Delhi 110 016, India
Abstract
The Indian power sector has been facing serious functional problems during the past few decades. In order to re-vitalise the sectorand to improve its techno-economic performance, Government of India has initiated restructuring process in 1991. This paperreviews the performance of the Indian power sector in the last decade (1991-2001), while undergoing the restructuring process. Thestudy also examines how far the restructuring process during this period has been effective in realising its set objectives and benefitedthe social development of the Nation. A critical evaluation of the methodology and steps so far adopted for the restructuring processand a few suggestions for re-framing the future course of reforms also have been proposed in this paper.
Keywords: Power sector restructuring; Indian power sector; Performance evaluation of power sector
1. Introduction
Though the Indian power sector has achievedsubstantial growth during the post-independence era,the sector has been ailing from serious functionalproblems during the past few decades. The power sectorannually avails a substantial share of the outlay of thenational economic plan (about 13-18%), but most ofthe State Electricity Boards (SEBs) in India have beenstriving under resource crunches and operating at hugecommercial losses. Consequently, the electricity servicesprovided to the consumers by these SEBs—both interms of quality and quantity—are 'poor'.
The supply-demand gap of electricity in India isconsistently widening over years and most of the Statesin India are facing heavy electricity shortage. Typical formost of the developing countries, the power 'crisis' inIndia also had been identified to be arisen out of seriousinadequacies in the structure and performance of thepower sector. Functional inefficiency of Government
owned SEBs, non-rationality at all phases of trading ofenergy (including tariff setting, metering, billing andrevenue collection), inability of the utilities to mobiliseadequate resources for capacity expansion and moder-nisation, etc.; have been cited as the major reasons forthe crisis (Baijal, 1999; Planning Commission, 2001a, b;Parikh and Radhakrishna, 2002).
Basic and radical restructuring of the power sector hadbecome imperative to improve the consumer services andalso even for the sustenance of the power sector itselfavoiding a shatter. It was under these circumstances,Government of India, in the year 1991 decided toappropriately restructure the Indian power sector in aphased manner. The prime objective of the reformprocess was to transit the power sector into a technicallyefficient and commercially profitable energy—tradingsector. The Government of India as well as the StateGovernments have taken various steps during the pastdecade for implementing the restructuring processthrough legislative and administrative measures.
Thus commenced in 1991, the Indian power sector hasundergone quite a lot process of reforms during the pastten years. Following a full decade of reforms, theobjective of this study is to examine the performance ofthe Indian power sector during the period from 1991 to2001 and to review how far the restructuring processes

564 D.P. Sharma et al. / Energy Policy 33 (2005) 563-576
have been effective in realising their set goals. Asimproved energy services have vital roles in theimprovement of social conditions, how far the powersector reforms during the past decade have also beeneffective as a welfare measure for social development inIndia? A brief evaluation of this issue is also attemptedin this study.
This paper is divided into ten sections. After thisintroduction, Section 2 provides a brief literature reviewand discusses the theoretical background of perfor-mance evaluation studies. After narrating the pre-reform profile of Indian power sector in Section 3,Section 4 discusses the objectives and salient features ofthe reform process initiated in the Indian power sector.Section 5 briefs the techno-commercial indicatorsselected in this study for performance evaluation.Section 6 is devoted for the review of the performanceof the Indian power sector during the period 1991-2001.This is attempted in four sub-sections. Sections 6.1 and6.2 evaluate the technical and economic performance ofthe sector, respectively. Section 6.3 examines the role ofprivate sector participation during this period inimproving the resource mobilisation in the power sector.
In order to understand the specific impacts of thepower sector reforms at micro level, the performance ofthe power sector in five selected Indian States under-going reforms have been attempted in Section 6.4. Therole of electricity regulatory commissions—the main by-product of the power sector reform process in India—isbriefly reviewed in Section 7. Section 8 provides ageneral assessment of the performance of the powersector in the last decade while undergoing the reformprocess. A critical evaluation of the methodology andsteps adopted for restructuring process in India andtheir impacts at large are also discussed in this section.A few suggestions for re-framing the future reformstrategy is depicted in Section 9. Concluding in Section10, the authors affirm the need for a holistic review ofthe present reform process to make it more appropriateand effective in Indian scenario.
2. Literature on utility performance under restructuring
During the past decade, utility restructuring havebeen taken up by countries worldwide and the reformprocess are at various stages now. While most of thesecountries are deriving successful results, restructuringefforts in a few countries (like California) had ended upin unmitigated disaster. During this period, quite a goodnumber of studies have attempted to review the degreeof success of the reform process in various countries.All these studies analyse the performance on the basisof actual data over a selected period and in somecases depend on the simulated data of historic trend(Pollitt, 1997).
Most of the earlier studies measured the success ofrestructuring either by comparing the energy prices(Yarrow, 1992) or by making general efficiency compar-isons (Burns and Weyman-Jones, 1994). A few sub-sequent studies reviewed the macro economic linkagesof energy and the consumer price benefits arousedout of restructuring (Chisari et al., 1999; Antonio et al.,2001). However, these empirical studies do not take intoaccount of the country specific issues like incomedistribution or environmental impacts. In a morecomprehensive approach, one study evaluates theinfluence of regulatory reforms in 19 OECD countrieswith the aid of a set of regulatory indicators (FayeSteiner, 2000). This study also explores the relativeefficiency of different reform strategies employed in thesecountries. A few studies, of late, measure the success ofregulatory reforms on the scales of 'public good' (CeciliaUgaz, 2001; Maximo and Alberto, 2001; Preetum andPollitt, 2000; Kristin et al., 2001; Chisari et al., 2001).Most of these studies conceptualise the objective ofrestructuring process as a welfare measure and someeven underline that success of power sector reforms(especially in developing countries) shall be meaningfullyevaluated by measuring their ability in benefiting themajority of (economically weaker section of) population(Berket et al., 2002; Karekezi and Majoro, 2002).
A few studies related to the restructuring processtaking place in India have been published in the past(Dubash and Rajan, 2001; Ruet, 2002; Godbole,2002a, b,c; Reddy, 2000, 2001, 2002). Though thesestudies do not provide a comprehensive evaluation ontechno-commercial performance of power sector under-going restructuring, they focus and review variousaspects of the reform process like utility privatisations,regulatory commissions, economic impacts etc. Thispresent study is an effort to comprehensively examinethe past performance of the Indian power sector underreforms, covering both technical and economic spheres.
3. Indian power sector in 1990: a pre-reform profile
Commencing with a meager installed capacity of1300MW during the year of national independence in1947, the Indian power sector has made substantial growthover decades. By the year 1990 the installed capacity grewto the tune of 75000 MW and the total electricity sale wasabout 289,440 million units. Major portion of thetransactions related to the trading of electricity in thecountry, including generation, transmission and distribu-tion, power delivery and revenue realisation have beencarried out at State level by 19 State owned ElectricityBoards (SEBs) and also six Electricity Departments of theGovernments in a few States. The functional structure ofthe SEBs was vertically integrated, and the control—notonly in matters of policy but on day-to-day affairs also—

D.P. Sharma et al. / Energy Policy 33 (2005) 563-576 565
were basically resting with the energy ministries of theState Governments. In general, the technical performancesof these SEBs were not satisfactory. The T&D lossesrecorded during the year 1991 was about 22.90%. Thermalpower stations were operating at very low efficiency andwith average Plant Load Factor (PLF) of only 53.90%.The generating capacity additions were totally inadequateto meet the growing demand requirements and conse-quently the deficits in electrical energy and peak-powerrequirement experienced during the year 1990-91 were7.7% and 18.8%, respectively.
Selected indicators
Installed capacityHydro-thermal ratio
of Indian Power Sector, 1990-91
Gross annual generationEnergy deficitPeak power deficitPercapita consumptionT&D lossesPlant load factor ofstationsAnnual commercialSEBsAverage productionelectricityAverage tariff
thermal
loss of
cost of
74,698 MW21:71289,440 million kWh7.7%18.8%271 kWh22.9%53.9%
40,210 million rupees
108.58 paise/kWh
81.80 paise/kWh
Note: One Indian Rupee = 100 Paise D0.02 US$ in 2003.
In the financial side also, the score card of the SEBswere not impressive. The annual commercial loss of theSEBs during the year 1990-91 was about 40,210 millionIndian rupees. The non-scientific tariff and poor techno-commercial management were identified to be the majorreasons for this loss (Planning Commission, 2001b). Theaverage unit cost of electricity production during 1990 was108.59 paise whereas the average revenue realised throughtariff was 81.80 paise only. Huge percentage of unusedsupply due to poor operating load factor of thermalstations (about 50%), non-comprehensive energy account-ing, high level of theft and pilferage of electricity, subsidyto agriculture sector, cross subsidy to domestic sector, etc.,have been cited as the key factors of the defectivefunctioning of the SEBs in India during this period(World Bank, 1998; Kannan and Pillai, 2000). Thus therewas a general approved consensus that maintaining thisstatus quo will be detrimental to the nation and mayshatter the sector itself. It was in this situation that in 1991Government of India decided to restructure the powersector radically through a set of comprehensive reforms.
4. Features of power sector reforms
The efforts to restructure the power sector in Indiaformally commenced in 1991. The prime reasons which
prompted the Government to initiate such a reformprocess were: (i) the ever-widening gap between thedemand and availability of electricity, (ii) the poortechnical and financial performance of the StateElectricity Boards and (iii) inability of the Central andState Governments to finance and mobilise resources forgeneration capacity expansion projects, making thirdparty investment in power sector imperative.
The initial step in this direction has been theamendment of legislation governing the electricity sectorin 1991. This allowed private sector participation inpower generation and also permitted foreign companiesto build up power projects in India and sell the power toSEBs. The National Development Council set up in1993 was the first official body to steer the reformprocess. This was followed by various national levelconferences of State Chief Ministers during the years1996, 1998, 2000 and 2001. Comprehensive reforms oflegislation including Electricity Regulatory CommissionAct (1998) and electricity bill (2001) also followed.Central Electricity Regulatory Commission (CERC,formed on 26 April 1999) as well as State ElectricityRegulatory Commissions (SERCs) subsequently set upin 15 States are already functioning. Most of the Stateshave initiated reform process and some have madesubstantial progress in restructuring of the power sector.
The salient features of the restructuring process ofIndian power sector can be summarised as follows:
(i) Unbundling of vertically integrated SEBs intodifferent companies, segregating along their differ-ent functional lines viz. generation, transmissionand distribution. This was expected to bring greateroperational efficiency in all the three functionalareas.
(ii) Allowing private investment (from both nationaland foreign investors) in all spheres of electricityindustry, mainly in generation sector. This wasanticipated to improve resource mobilisation in thegeneration sector and also attract IndependentPower Producers (IPP). It was also expected thatthe shortfall in generation capacity could be reducedby this way and would relieve SEBs from financialcrunches. Resultant competition in generation andretail marketing of electricity was intended to fetchimproved consumer service, reduced retail pricesand better functional efficiency.
(iii) Steps to rationalise the tariff, effort to reduce thecommercial losses, promote fair competition and toensure transparency in all activities related to thetrade of electricity. For this purpose independentelectricity regulatory commissions at Centre andState levels were proposed to be set up.
The Indian Electricity Act 2003 recently enacted bythe Indian Parliament embodies the above features ofreform steps carried out during the past decades
566 D.P. Sharma et al. / Energy Policy 33 (2005) 563-576
(Ministry of Power, 2003). As depicted in the preambleof this Act, the basic guiding principles and objectives ofthe restructuring were to
• take measures conducive to the development ofelectricity in India;
• to ensure reasonable price of electricity;• to promote free and fair competition so as to achieve
greater operational and economic efficiency and• to establish independent and transparent electricity
trade regulations through establishing regulatorycommissions.
Section 5 provides review of the performance of thepower sector during the last decade while undergoingthe process of reforms and evaluates how far it wassuccessful in achieving the set goals of reforms.
5. Selection of performance indicators
A number of indicators—categorised under technicaland economic indicators—have been defined in recentstudies monitoring the performance of the power sector(World Bank, 1995). The selection of a particular set ofindicators depends on the objective of the evaluation. Asthis study intends to evaluate the success of restructur-ing process in India and also attempts to assess the
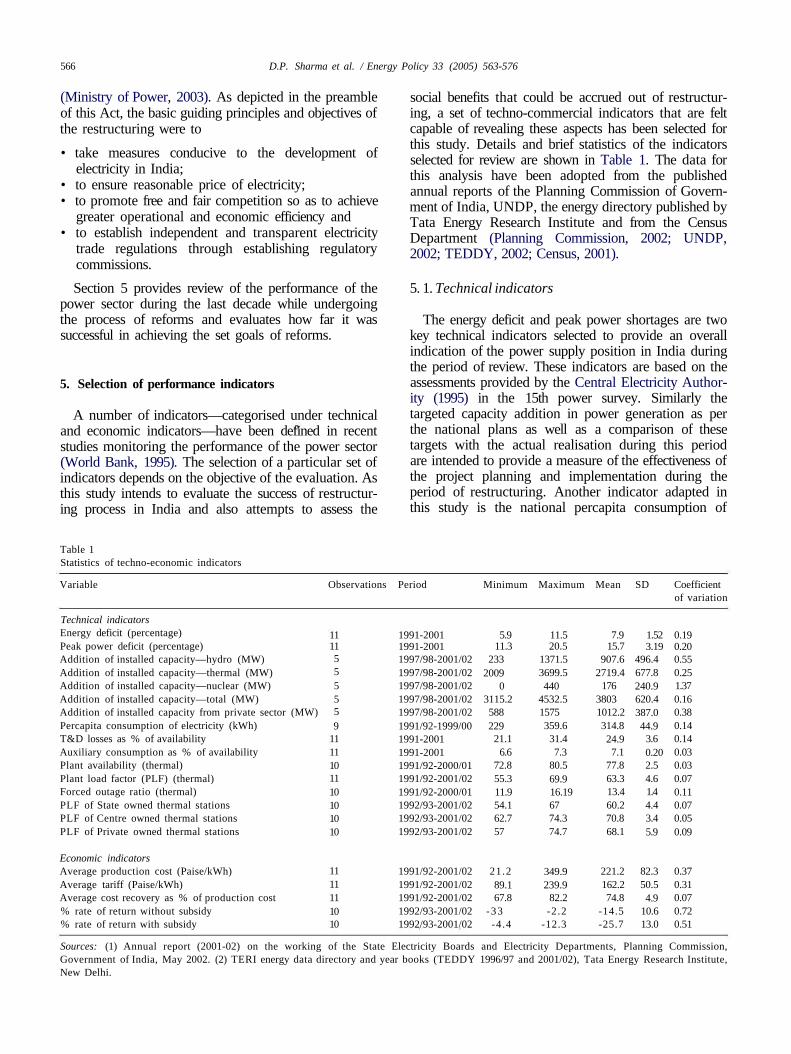
social benefits that could be accrued out of restructur-ing, a set of techno-commercial indicators that are feltcapable of revealing these aspects has been selected forthis study. Details and brief statistics of the indicatorsselected for review are shown in Table 1. The data forthis analysis have been adopted from the publishedannual reports of the Planning Commission of Govern-ment of India, UNDP, the energy directory published byTata Energy Research Institute and from the CensusDepartment (Planning Commission, 2002; UNDP,2002; TEDDY, 2002; Census, 2001).
5. 1. Technical indicators
The energy deficit and peak power shortages are twokey technical indicators selected to provide an overallindication of the power supply position in India duringthe period of review. These indicators are based on theassessments provided by the Central Electricity Author-ity (1995) in the 15th power survey. Similarly thetargeted capacity addition in power generation as perthe national plans as well as a comparison of thesetargets with the actual realisation during this periodare intended to provide a measure of the effectiveness ofthe project planning and implementation during theperiod of restructuring. Another indicator adapted inthis study is the national percapita consumption of
Table 1Statistics of techno-economic indicators
Variable Observations Period Minimum Maximum Mean SD Coefficientof variation
Technical indicatorsEnergy deficit (percentage)Peak power deficit (percentage)Addition of installed capacity—hydro (MW)Addition of installed capacity—thermal (MW)Addition of installed capacity—nuclear (MW)Addition of installed capacity—total (MW)Addition of installed capacity from private sector (MW)Percapita consumption of electricity (kWh)T&D losses as % of availabilityAuxiliary consumption as % of availabilityPlant availability (thermal)Plant load factor (PLF) (thermal)Forced outage ratio (thermal)PLF of State owned thermal stationsPLF of Centre owned thermal stationsPLF of Private owned thermal stations
Economic indicatorsAverage production cost (Paise/kWh)Average tariff (Paise/kWh)Average cost recovery as % of production cost% rate of return without subsidy% rate of return with subsidy
1111555559
1111101110101010
1111111010
1991-20011991-20011997/98-2001/021997/98-2001/021997/98-2001/021997/98-2001/021997/98-2001/021991/92-1999/001991-20011991-20011991/92-2000/011991/92-2001/021991/92-2000/011992/93-2001/021992/93-2001/021992/93-2001/02
1991/92-2001/021991/92-2001/021991/92-2001/021992/93-2001/021992/93-2001/02
5.911.3
2332009
03115.2588229
21.16.6
72.855.311.954.162.757
21.289.167.8
-33-4.4
11.520.5
1371.53699.5440
4532.51575359.6
31.47.3
80.569.916.196774.374.7
349.9239.9
82.2-2.2
-12.3
7.915.7
907.62719.4
17638031012.2314.824.97.1
77.863.313.460.270.868.1
221.2162.274.8
-14.5-25.7
1.523.19
496.4677.8240.9620.4387.044.9
3.60.202.54.61.44.43.45.9
82.350.54.9
10.613.0
0.190.200.550.251.370.160.380.140.140.030.030.070.110.070.050.09
0.370.310.070.720.51
Sources: (1) Annual report (2001-02) on the working of the State Electricity Boards and Electricity Departments, Planning Commission,Government of India, May 2002. (2) TERI energy data directory and year books (TEDDY 1996/97 and 2001/02), Tata Energy Research Institute,New Delhi.

D.P. Sharma et al. / Energy Policy 33 (2005) 563-576 567
electricity. Growth in percapita consumption does notrepresent the true growth of power sector. However, acomparison of this indicator with that of other similardeveloping countries as well as an analysis of thestructural changes occurred in consumption by varioussectors is attempted in this study. This is expected toprovide a meaningful indication of the social benefitsprovided by reforms during this period.
Regarding the operational performance indices, twocommon indicators—T&D losses and auxiliary con-sumption rate of power stations—are selected. Thevariation of these indices over the period of review areintended to reveal how far the technical measure adaptedduring the reform process have been effective to bringdown the high level of technical losses of Indian powersector. The operational efficiency of thermal powerstations in India has been identified to be very poor. Inorder to evaluate the improvement in the performance ofthermal stations, three indicators viz: plant availabilityfactor, PLF and forced outage ratio have been selected.These indices in respect of thermal stations falling underthree separate categories of ownership (Central owned,State owned and private sector stations) have beenreviewed separately. No suitable indicators could beidentified at national level to comprehensively representthe quality of power—in terms of various parameters likevoltage and frequency as well as in respect of the servicequality like outages and load shedding. Hence, review onthe quality factor is not attempted in this study.
5.2. Economic indicators
The financial ill health of the utility companies hasbeen the most critical factor impeding the growth ofIndian power sector. Hence, the economic indicatorsselected are required to reveal the financial progress ofthe sector. The average production costs of electricityand average tariff are the two indicators selected forreview. These indicators provide cost-revenue compar-ison and show how far the periodic tariff revisions wereeffective in realizing the actual production cost. Simi-larly the structural components involved in the unit costof electricity and their periodic changes also have beenstudied to reveal the progress of power sector.
6. Performance of power sector during 1991-2001
The performance of the Indian power sector bothon technical and commercial terms during the period1991-2001 is discussed in this section.
6.1. Technical performance
The percentage deficit of electrical energy during1990-91 was 7.7%. However, in spite of the efforts, the
power situation continued to be grim through out thelast decade and as shown in Fig. 1, by the year 2001-02the energy deficit still remained at the level 7.5%. Infact, it went up to digits as high as 11.5% during someyears in this period. The case of peak power demand isalso not different. The power shortage of 18.8% duringpeak hours in 1990 did not come down, but continuedthroughout the decade within a steady range of 12-14%.This sizeable percentage deficit of both energy andpeak power indicates that the capacity additionsduring this period was inadequate to bridge thesupply-demand gap.
The generation expansion programs during thisdecade suffered substantial slippage from targets. Theslippage in the eighth National Five-Year Plan period(1992-97) was about 46.3%. During the period of theninth plan (1997-2002) this has further increased to52.75% and the capacity additions during this periodwere only to the tune of 19015 MW against the target of40245 MW. As shown in Table 2 it can be seen thatexcept in nuclear plants—where capacity addition wasmeager—the target of realising power projects in boththermal and hydroelectric sectors suffered substantialslippage. It is significant to mention that the contribu-tion for capacity additions during the ninth plan periodfrom Central, State and Private sector power projectswere, respectively, 4504, 9450 and 5061 MW only (whichare respectively, 37.8%, 87.9% and 28.8% of thetargeted capacity expansions from these sectors). Thereasons for such glaring disappointment in contribution,especially from private sector, will be discussed later inthis paper.
Regarding the percapita consumption of electricityalso, it can be seen that the growth rate achieved duringthe last decade is not promising. The percapitaconsumption, which was 268 kWh in 1991-92 indicatedonly a low average annual growth rate of 3.57% duringthis period and by the end of the decade it, was354.75 kWh only. As shown in Table 3, according to the
1991- 1992- 1993- 1994- 1995- 1996- 1997- 1998- 1999- 2000- 2001-92 93 94 95 96 97 98 99 00 01 02
Year
Fig. 1. Power and energy deficit in India during 1991-2001. Source:Web site of Ministry of Power, http://www.powermin.nic.in.

568 D.P. Sharma et al. / Energy Policy 33 (2005) 563-576
Table 2Growth of installed electricity generation capacity during ninth national five year plan period (1997-98 to 2001-02)
Year
1997-981998-991999-002000-012001-02
Total
Generation <capacity addition in
Hydro electric
Target
1963.941963.941963.941963.941963.94
9819.70
Actual
233.00542.50
1371.501285.001106.20
4538.20
MW
Thermal
Target
5909.105909.105909.105909.105909.10
29,545.50
Actual
2993.503699.502721.002173.902009.00
13,596.90
Nuclear
Target
176176176176176
880
Actual
00
440440
0
880
Total
Target
8049.048049.048049.048049.048049.04
40,245.20
Actual
3226.5042424532.503898.903115.20
19,015.10
Source: Annual report (2001-02) on the working of the State Electricity Boards and Electricity Departments, Planning Commission, Government ofIndia, May 2002.
Table 3Growth in electricity percapita consumption of selected nations
Sl. No. Country HumanDevelopmentIndex asdefinedby UN
Electricityconsumptionpercapita(kWh) in year
1980 1999
Annualcompoundedgrowthrate (%)
ThailandOmanTurkeyParaguayChinaIndonesiaEgyptIndia
7078859096
110115124
279614439245253
44380130
135228801396789758345900354.75
8.668.476.286.355.95
11.454.645.74
Sources: (1) Human Development Report 2002, UNDP, Published byOxford University Press, ISBN 0-19-521915-5. (2) Annual report(2001-02) on the working of the State Electricity Boards andElectricity Departments, Planning Commission, Government of India,May 2002.
UN development report 2002, this percapita consump-tion and growth rate of consumption are far belowcompared to other countries (coming under the group ofcomparable nations with medium level of humandevelopment indices) (UNDP, 2002).
Referring to the structural composition of electricityconsumption by various sectors shown in Fig. 2, it canbe seen that the percentage share of residential sectorincreased from 17% to 25% during this period.However, the share of electricity consumption foragriculture (upon which the majority of the Indianpopulations depend) remained unchanged at about 26%through out this period. Hence, the mere marginalincrease in percapita consumption does not unequi-vocally establish a true contribution of electricity sectorin the improvement of the quality of life of the majorityof Indian population.
The efforts to bring down various technical lossesdeterring the performance also could not be effective
Year
Other 4sectors \^
57%
1990-91
Residential
" ^ \ 1 7 %
Agriculture26%
Year2000-01
Othersectors
49% (ftResidential
25%
Agriculture26%
Fig. 2. Structural composition of electricity consumption. Sources: (1)Annual report (2001-02) on the working of the State Electricity Boardsand Electricity Departments, Planning Commission, Government ofIndia, May 2002. (2) TERI energy data directory & year books(TEDDY, 1996/97 and 2001/02), Tata Energy Research Institute, NewDelhi.
Table 4Performance of Indian power sector 1991-92 to 2001-02
Year Percapitaconsumptionof electricityinkWh
T&Dlosses(as % ofavailability)
Auxiliaryconsumption(as % ofavailability)
1991-921992-931993-941994-951995-961996-971997-981998-991999-002000-012001-02
268283229320336334348.50359.58354.75
22.8321.8121.4121.1322.2724.5324.7926.4531.4429.9027.80
7.327.327.307.077.176.597.147.037.197.187.05
Source: Annual report (2001-02) on the working of the StateElectricity Boards and Electricity Departments, Planning Commission,Government of India, May 2002.
aData not available.
during this period as depicted in Table 4. The T&Dlosses which were about 22.83% in 1991-92 thoughremained steady for a few years, indicated the trend ofincrease and according to the latest figures it is about
D.P. Sharma et al. / Energy Policy 33 (2005) 563-576 569
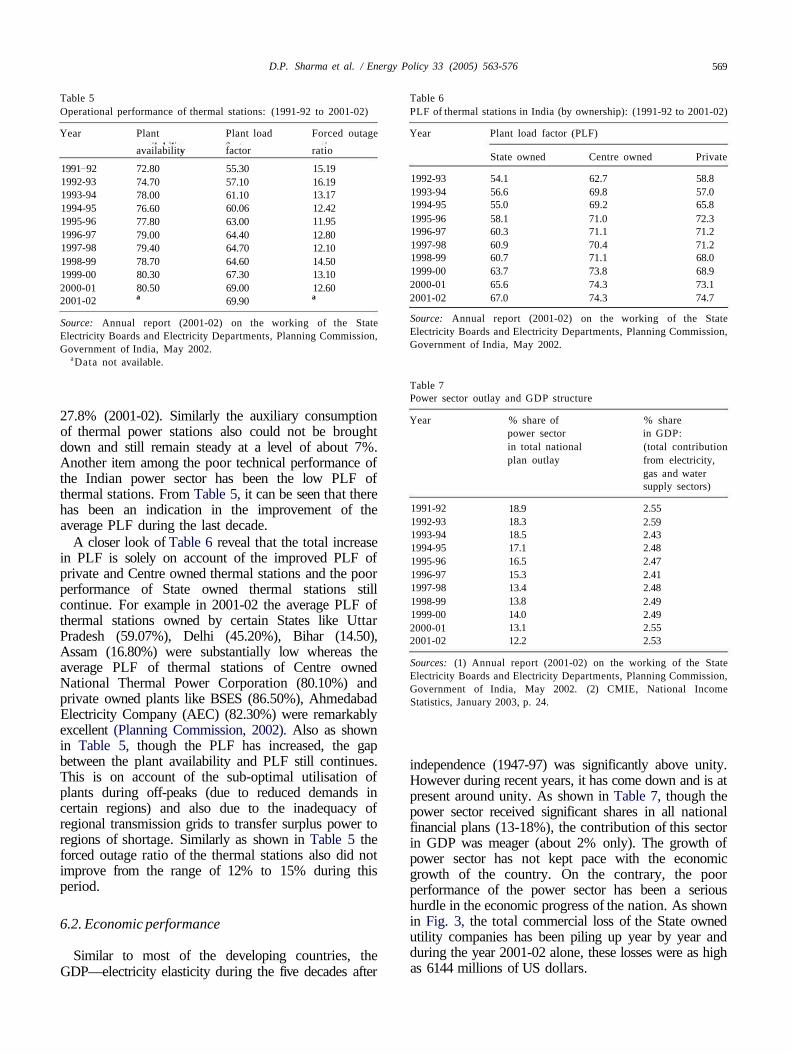
Table 5Operational performance of thermal stations: (1991-92 to 2001-02)
Table 6PLF of thermal stations in India (by ownership): (1991-92 to 2001-02)
Year
1991 921992-931993-941994-951995-961996-971997-981998-991999-002000-012001-02
Plant
availability
72.8074.7078.0076.6077.8079.0079.4078.7080.3080.50a
Plant load
factor
55.3057.1061.1060.0663.0064.4064.7064.6067.3069.0069.90
Forced outage
ratio
15.1916.1913.1712.4211.9512.8012.1014.5013.1012.60a
Year
1992-931993-941994-951995-961996-971997-981998-991999-002000-012001-02
Plant load factor
State owned
54.156.655.058.160.360.960.763.765.667.0
(PLF)
Centre owned
62.769.869.271.071.170.471.173.874.374.3
Private
58.857.065.872.371.271.268.068.973.174.7
Source: Annual report (2001-02) on the working of the StateElectricity Boards and Electricity Departments, Planning Commission,Government of India, May 2002.
aData not available.
27.8% (2001-02). Similarly the auxiliary consumptionof thermal power stations also could not be broughtdown and still remain steady at a level of about 7%.Another item among the poor technical performance ofthe Indian power sector has been the low PLF ofthermal stations. From Table 5, it can be seen that therehas been an indication in the improvement of theaverage PLF during the last decade.
A closer look of Table 6 reveal that the total increasein PLF is solely on account of the improved PLF ofprivate and Centre owned thermal stations and the poorperformance of State owned thermal stations stillcontinue. For example in 2001-02 the average PLF ofthermal stations owned by certain States like UttarPradesh (59.07%), Delhi (45.20%), Bihar (14.50),Assam (16.80%) were substantially low whereas theaverage PLF of thermal stations of Centre ownedNational Thermal Power Corporation (80.10%) andprivate owned plants like BSES (86.50%), AhmedabadElectricity Company (AEC) (82.30%) were remarkablyexcellent (Planning Commission, 2002). Also as shownin Table 5, though the PLF has increased, the gapbetween the plant availability and PLF still continues.This is on account of the sub-optimal utilisation ofplants during off-peaks (due to reduced demands incertain regions) and also due to the inadequacy ofregional transmission grids to transfer surplus power toregions of shortage. Similarly as shown in Table 5 theforced outage ratio of the thermal stations also did notimprove from the range of 12% to 15% during thisperiod.
6.2. Economic performance
Similar to most of the developing countries, theGDP—electricity elasticity during the five decades after
Source: Annual report (2001-02) on the working of the StateElectricity Boards and Electricity Departments, Planning Commission,Government of India, May 2002.
Table 7Power sector outlay and GDP structure
Year
1991-921992-931993-941994-951995-961996-971997-981998-991999-002000-012001-02
% share ofpower sectorin total nationalplan outlay
18.918.318.517.116.515.313.413.814.013.112.2
% sharein GDP:(total contributionfrom electricity,gas and watersupply sectors)
2.552.592.432.482.472.412.482.492.492.552.53
Sources: (1) Annual report (2001-02) on the working of the StateElectricity Boards and Electricity Departments, Planning Commission,Government of India, May 2002. (2) CMIE, National IncomeStatistics, January 2003, p. 24.
independence (1947-97) was significantly above unity.However during recent years, it has come down and is atpresent around unity. As shown in Table 7, though thepower sector received significant shares in all nationalfinancial plans (13-18%), the contribution of this sectorin GDP was meager (about 2% only). The growth ofpower sector has not kept pace with the economicgrowth of the country. On the contrary, the poorperformance of the power sector has been a serioushurdle in the economic progress of the nation. As shownin Fig. 3, the total commercial loss of the State ownedutility companies has been piling up year by year andduring the year 2001-02 alone, these losses were as highas 6144 millions of US dollars.

570 D.P. Sharma et al. / Energy Policy 33 (2005) 563-576
Referring to Table 8, the unit cost of production ofelectricity, which was 112.20 paise in 1991-92, indicatedan average annual increase of about 11.8% and is about349.9 paise per unit in 2001-02. But the average revenuerealised through electricity tariff which was 89.06 paisein 1991-92 increased to only 239.9 paise in 2001-02, still
w
COenr*j
199
• ^ •
en
199
in
4
199
(O0)10
199
r̂ento
199
COen
199
(7)0)ro
199
oom
199
_̂on
200
CNO^i .
200
Fig. 3. Commercial losses of State Utilities. Source: Web site ofMinistry of Power, http://www.powermin.nic.in.
Table 8Recovery cost of electricity through tariff: 1991-92 to 2001-02
Year
1991-921992-931993-941994-951995-961996-971997-981998-991999-002000-012001-02
Averageproductioncost of energy(Paise/kWh)
112.20128.20149.10163.40179.60215.60239.70263.10305.10327.30349.90
Averagetariff(Paise/kWh)
89.06105.40116.70128.00139.00165.30180.301 . 0 0207.00226.302349.90
Average revenuerecovery as % ofproduction cost
79.3882.2078.3078.3077.4076.7075.2071.0067.8069.1068.60
Sources: (1) Annual report (2001-02) on the working of the StateElectricity Boards and Electricity Departments, Planning Commission,Government of India, May 2002. (2) TERI energy data directory andyear books (TEDDY 1996/97 and 2001/02), Tata Energy ResearchInstitute, New Delhi.
maintaining a deficit of about 9.5% annually from theactual unit cost of production. The average tariffthroughout the decade was totally inadequate to covereven the production cost of energy and this furtheraggravated the ill health of SEBs.
On analysing the components involved in the unit costof production of electricity for a few years in the past, asshown in Table 9, the percentage share of all compo-nents except power purchase cost showed a decliningtrend. The share of power purchase cost of SEBs (fromthe generating companies owned by Central Govern-ment and private power producers) has undergoneexorbitant increase during the past decade. Thispercentage increase is more during the period from1996 to 1997 wherein the reforms in the generationsector were initiated vigorously and a few new generat-ing companies—mostly based on naphtha and diesel—were set up.
The SEBs facing serious inadequacy of in-housegenerations (of low cost power) were forced to importpower from the new generating companies at higher costto reduce power shortages. This posed additionalburden on the already poor financial set up of most ofthe SEBs. At least in some States it lead to the viciousparadox that even though the Central and privateowned generating stations in those States were operatingbelow their rated capacity, SEBs running in the sameStates at huge losses could not find enough funds topurchase power and utilise the spare generating capacityto reduce the shortage of power. To site an example,Kerala—one of the southern most States of India—wassuffering from serious power shortages during the pastfew years whereas the National Thermal Power Cor-poration (NTPC) was ready to provide power from theirthermal station operating within the State itself. But thisSEB could not purchase costlier naphtha-based powerfrom this NTPC station. Ultimately the State wasplunged into severe power cuts and load shedding.
The dismal financial performance of the SEBs will bemore discernible while reviewing the rate of return. Asshown in Fig. 4, the rate of return of the SEBs hassharply declined from -12.7% (1992-93) to -44.1%
Table 9
Componen t of unit cost of electricity
Item
Fuel
Power purchase
Operat ion and maintenance (O&M)
Establishment
Miscellaneous
Depreciation
Interest
1996-97
23.4
34.1
4.213.7
2.47.4
14.0
1997-98
213.1
36.4
4.113.6
2.27.4
13.2
1998-99
20.038.8
3.614.6
2.46.4
13.5
1999-00
15.2
48.9
2.813.3
3.06.0
10.3
2000-01
14.2
50.5
2.713.5
2.45.9
10.7
2001-02
13.1
52.9
2.612.7
1.86.0
11.1
Source: Annua l report (2001-02) on the working of the State Electricity Boards and Electricity Depar tments , Planning Commission, Government of
India, May 2002.

D.P. Sharma et al. / Energy Policy 33 (2005) 563-576 571
-50
Year
Fig. 4. Financial rate of return of SEBs in the past decade. Source:Annual report (2001-02) on the working of the State Electricity Boardsand Electricity Departments, Planning Commission, Government ofIndia, May 2002.
(2001-02). Even Government subvention through sub-sidies could not improve the situation. In fact all the 19SEBs in India were running under negative returnsthroughout the past decades, in spite of the tariffincrease of about 10% annually.
6.3. Private sector participation
Having seen the dismal technical and financialperformance of the power sector in the last decade,now the review is focussed on the success of the privatesector participation, which was one of the chief aims ofrestructuring. It can be seen that there was terribleshortfall in the capacity addition expected from privatesector. Against a target of 2810 MW in the eighthNational Plan (1992-97) the achievement was only1430 MW and against a targeted capacity addition of17588.5 MW from private sector in the ninth plan(1997-2002) the actual realisation was only 5061 onlyindicating a shortfall of 71.2%. As shown in Fig. 5,though the average capacity addition targeted per yearduring the ninth plan period was about 3517 MW, theactual achievement in all the 5 years were far below thisexpectation. The poor financial situation of the SEBsand their inability for ensuring payment security for thepower purchase are the main reasons for the poorparticipation of private sector.
6.4. Performance of 'reformed' states
All the 27 States in India have initiated restructuringprocess of their SEBs and these are at various stages ofimplementation. Twenty States have already signedmemorandum of understanding with the Ministry ofpower of Government of India to implement reforms atdistribution sector in a time bound manner. Orissa,Haryana, Uttar Pradesh (UP), Andhra Pradesh (AP)and Karnataka were the first five Indian States that
4000 n
*•* 3000-
2000
oa.o
1000-
0J
864 2
2A816.3
n Target
D Actual
1997-98 1998-99 1999-00 2000-01 2001-02
Year
Fig. 5. Generation capacity contribution from private sector. Source:Annual report (2001-02) on the working of the State Electricity Boardsand Electricity Departments, Planning Commission, Government ofIndia, May 2002.
Table 10Power supply position of selected Indian States: (1991-92 to 2001-02)
State
OrissaHaryanaUttar PradeshAndhra PradeshKarnataka
Year
Energy deficit (%
1991-92
72
10.36.7
23.6
1996-97
35.9
13.922.127.1
%)
2001-02
0.101.69.98.5
12.5
Peak power deficit (%)
1991-92 1996-97 2001-02
23.920.217.815.828.5
13.815.92023.628.5
7.33.39.2
19.917
Sources: (1) Annual report (2001-02) on the working of the StateElectricity Boards and Electricity Departments, Planning Commission,Government of India, May 2002. (2)TERI energy data directory andyear books (TEDDY 1996/97 and 2001/02), Tata Energy ResearchInstitute, New Delhi.
initiated restructuring process and vigorously imple-mented various steps during this period. Referring toTable 10, it can be seen that even after a full decade ofrestructuring all these States are still facing deficit, bothin energy and peak generation capacity. In the case ofAP, the level of energy deficit as well as the peak powershortage has increased. On reviewing the T&D losses ofthese States (Table 11), T&D losses in Orissa stillcontinues to be at alarming levels as high as 49%.
The World Bank's staff appraisal report on Orissa,before commencing of the reforms, has targeted areduction of T&D losses to the level of 25% by theyear 2001 but this has not been realised at all (SAR,1996). The picture of Haryana, UP, AP and Karnatakaalso are not different. In the case of these States, thelosses showed an increasing trend and are currentlyabove 30%. In AP and Karnataka the percentage ofT&D losses have shown about two-fold increasewhile undergoing restructuring. Regarding the growthin percapita consumption of electricity, as shown inTable 12, the rates in these States except that of AP havenot indicated any substantial improvement above thenational average growth rate of 3.5%. UP recorded avery poor average growth rate of 0.66%.

572 D.P. Sharma et al. / Energy Policy 33 (2005) 563-576
Table 11T&D losses of selected Indian States (1995-96 to 2001-02)
State
OrissaHaryanaUttar PradeshAndhra PradeshKarnataka
T&D Losses (%)
1995-96
46.931.422.818.918.5
1996-97
50.432.82733.118.9
1997-98
49.233.425.532.518.6
1998-99
41.933.922.531.930.2
1999-00
45.233.842.235.238
2000-01
49.93539.832.936.5
2001-02
a
3338.732.636
Source: Annual report (2001-02) on the working of the State Electricity Boards and Electricity Departments, Planning Commission, Government ofIndia, May 2002.
a Data not available.
Table 12Percapita electricity consumption of selected States (1990-91 to 1999-2000)
State Percapita consumption of electricity (kWh) % decadal growth
Year
1990-91 1991-92 1992-93 1993-94 1994-95 1995-96 1996-97 1997-98 1998-99 1999-00
OrissaHaryanaUttar PradeshAndhra PradeshKarnataka
271400166245296
295455174191296
297507179312303
313491186345328
3133467204374364
3705032073683403
309504197346340
308488199391387
312503195404349
354530175391387
3.403.610.666.023.41
Sources: (1) Annual report (2001-02) on the working of the State Electricity Boards and Electricity Departments, Planning Commission,Government of India, May 2002. (2) TERI energy data directory and year books (TEDDY 1996/97 and 2001/02), Tata Energy Research Institute,New Delhi.
Table 13Electricity tariff in selected States: (1991-92 to 2000-01)
State Electricity tariff (Paise/kWh)
Year
1991-92 1992-93 1993-94 1994-95 1995-96 1996-97 1 9 9 9 1998-99 1999-00 2000-01
OrissaHaryanaUttar PradeshAndhra PradeshKarnataka
65.166.379.783.382.4
77.272.5
108.494.393.4
95.1083.3
111.898.6
106.8
149.8110.8122.492.9
105.1
175.4132.8140.897.1
114.4
235155.3143156140.6
259187.3171.6166.7192.22
262.3199.5171.6165.3192.2
261.5198.3234.1175205.8
272.4205.4258.6211217.2
Sources: (1) Annual report (2001-02) on the working of the State Electricity Boards and Electricity Departments, Planning Commission,Government of India, May 2002. (2) TERI energy data directory and year books (TEDDY 1996/97 and 2001/02), Tata Energy Research Institute,New Delhi.
All the above five States implemented heavy tariffrevisions during the course of restructuring. The averageof annual percentage tariff increase from 1991-92to 2000-01 in Orissa, Haryana, UP, AP andKarnataka were 17.24%, 13.39%, 13.97%, 10.88%and 11.37%, respectively, as depicted in Table 13. Itmay be noted that the national annual average increaseof tariff during this period was about 10% only.Paradoxically, in spite of the tariff revisions, thecommercial rate of return of power sector in theseStates are still at huge negative figures as depicted inTable 14. In short, the financial situation of SEBs of
these States has substantially deteriorated during thisperiod.
7. Role of regulatory commissions
The broad objectives of setting up regulatory commis-sion (as reiterated in the introduction of The ElectricityAct 2003) are to
(i) regulate tariff and trade margin;(ii) issue licenses;

D.P. Sharma et al. / Energy Policy 33 (2005) 563-576 573
Table 14Rate of return of SEBs without subsidy (1992-93 to 2001-02)
State % rate of return (without subsidy)
Year
1992-93 1993-94 1994-95 1995-96 1996-97 1997-98 1998-99 1999-00 2000-01 2001-02
OrissaHaryanaUttar PradeshAndhra PradeshKarnataka
-8.7-26.1-16.7
-0.2-2.0
-13.5-31.2-17.8
-0.6-0.20
-10.2-27.9-12.2-22.3-11.4
-21.5-31.8
-9.6-28.8-29.4
-19.15-38.9-26.1-21.8-36.1
-20.28-47.8-26.3-33.9-16.5
-28.3143.3
-26.3-100.9
-37.9
-16.58-54.9-24.5
-119.4-36.8
-18.68-85.5-27.8-92.8-65.9
-17.38-78.6-22.4
-102.3-81.3
Source: Annual report (2001-02) on the working of the State Electricity Boards and Electricity Departments, Planning Commission, Government ofIndia, May 2002 and TERI energy data directory and year books (TEDDY 1996/97 and 2001/02), Tata Energy Research Institute, New Delhi.
(iii) promote competition and economy;(iv) develop appropriate policies for environmental
regulations;(v) frame guidelines in the matters related to electricity
tariff;(vi) adjudicate disputes in matters of electricity trades.
In addition to the CERC at national level, most of theIndian States have already constituted SERCs andcommenced their functions. From a public consumerpoint of view, the present role of ERCs has beenseriously limited to mere bodies enacting periodic tariffrevision orders, which was earlier being performed bythe SEBs in consultation with the respective StateGovernments. Probably the only qualitative differencein the role is that if earlier tariff revisions effected bySEBs/Government were guided by social and politicalconsiderations also, now they are most likely to be takenin the interest of the major stakeholders of the powersector. Members of the ERCs are expected to be eminentpersonalities having expertise in the techno-economicaspects of the power trading. But the present frameworkof the ERCs neither demands nor permits them tofunction as true independent regulatory bodies thatcould ultimately provide benefit to the greater need ofthe society at large.
Another limitation experienced by ERCs in theircurrent functioning is their narrow field of jurisdiction.The present jurisdiction of ERCs are limited to powersector only and they have no say in the matters relatedto the basic energy sources like petrol, coal, naphtha orCNG. While the availability and price setting of theseenergy sources have considerable bearing in the policymatters of electricity sector, this limitation of juris-diction of ERCs seriously hamper their effectivefunctioning. Further, regarding the improvement ofquality and reliability of power delivered to thecustomers also, the ERCs could so far contribute little.In short, the present structure of ERCs have not enabledthem to act as a body with multi-dimensional functionsand also to assume the role of a true guide for the
overall development of power sector, but only providedthat of a quasi-judicial setup for periodic tariff revisions.
8. General assessment and evaluation
From the above overview it is apparent that thetechnical and financial performance of power sector inthe past decade have not been successful in realising thepositive results of restructuring, particularly in respectof the following:
1. To improve the operational efficiency and reducelosses.
2. To re-mould the power sector as an economicallyprofitable one.
3. To increase private sector participation so as toimprove resource mobilisation.
4. To reduce supply-demand gap.5. To improve free trade of electricity regulated through
ERCs.
While evaluating the general performance indices ofthe power sector of India in general and that of certainrestructured States in particular, it is obvious that themajor set objectives could not be realised.
As per the Indian Census 2001, out of the totalpopulation of 1027 million, about 742 million live inrural areas and their predominant income is fromagriculture (Census, 2001). It can be seen that in 1991,out of 587,258 inhabitable Indian villages, electricity wasaccessible to 487,200 covering about 82.96% only.However, looking at the scenario in 2001, power hasbeen extended to 508,701 villages (out of 638,691villages) covering about 79.55%. It is obvious that thethrust given on rural electrification schemes is retardingduring the course of restructuring and does notcommensurate with the demographic transitions of thenation.
Similarly while reviewing the share of electricityprovided for agriculture, it can be seen that this alsohas retarded slightly from 29.90% in 1992-93 to 28.78%

574 D.P. Sharma et al. / Energy Policy 33 (2005) 563-576
in 2001-02. In the States of Orissa and Haryana, it hassubstantially reduced from 5.60% to 1.81% and 27.20%to 19.61%, respectively, during the above period. Thisdiscerns the shift in focussing of distribution priorities ofelectricity. Though this may marginally aid to improvethe financial health of SEBs (due to the decreasedliability on agricultural subsidy), this will significantlyaffect the agrarian base of the economy and thereby thecommon welfare of the majority of population.
In a recent study analysing the impacts of theelectricity reforms in the rural development of Orissa,it was revealed that during the restructuring period therural electrification programs also suffered serioussetbacks (Panda, 2002). This study also revealed thatthe agricultural sector suffered the maximum with lowgrowth in lift irrigation, energy availability to pumpsets, etc. According to the study the power sectorrestructuring in Orissa could not succeed in improvingthe power quality or even in effectively realising therevenue of electricity through retail billing.
If we look at the development of renewable sourcesfor power generation, the performance in the pastdecade was not promising. The total capacity ofrenewable energy that could contribute to powergeneration was about 3165 MW only, less than 3% ofthe total installed capacity (TEDDY, 2002). Though thewind energy potential of India is estimated to be about45,000 MW, we could tap only 1507.46 MW till datewhich forms only 1.44% of the total installed capacity.The wind power development during the eighth andninth national plan was 312.3 and 1195.16 MW only.The apathy shown towards development of renewablesources of power may have two implications in Indianscenario.
1. The feasibility of providing power to about 18,000non-electrified remote villages (where power supplyfrom conventional grid is hardly possible) willdiminish.
2. The development program aiming a sustainable andenvironment friendly power generation will getsetbacks.
Here, it is worth while to mention that the Indianexperience of power sector reforms which do not benefitthe rural poor as it was expected, is not unique. A fewrecent studies—on the impact of power sector reformsinitiated during the same period in African continent—report that the restructuring could not fetch any positivebenefits to the rural poor in these countries also(Karekezi and Kimani, 2002; Pineau, 2002).
Though the tariff underwent consistent and exorbi-tant increases, it could not improve the economy of theSEBs. The quality and availability of the power alsocould not be improved during this period. The socialobjectives of the power sector also remained out of focusin the restructuring process. The study-report on the
non-performance of Orissa model inferred that seriousflaws exist in the objectives, methodology and imple-mentation of present restructuring (Department ofEnergy, 2001). It is appropriate that a comprehensivereview on the footing of the restructuring and theimpacts made so far be done before chalking out furthersteps.
The need aspect of a restructuring of the Indian powersector, at the time when it was initiated a decade back,was beyond any debate. Retaining the status quo wouldhave definitely lead to a shattering of the sector.However, the following features contribute to the non-delivery of positive results as expected.
1. The pre-conceived notion that private sector partici-pation is unavoidable for the growth of the sectorprovided a wrong footing. The need for resourcemobilisation ultimately turned up to an agenda ofprivatisation. A simultaneous contribution fromco-operative sectors or joint venture investment alsocould be sought for resource mobilisation. Thesuccessful episodes of co-operative movement in milkproduction and marketing in Gujarat State andvarious industrial and banking sectors in KeralaState are promising examples for this proposition.
2. The initial part of the restructuring concentrated atthe generation expansion programs. Considering thefact that the Indian power sector feeds a very largenumber of consumers (113.66 million as on 31 March2002), the distribution sector should have been givenan equal or more thrust for efficiency improvementmeasures. In fact, many of the regional studiesbrought out the potential of substantial energysavings (and thereby reducing generation expansion)by adopting DSM techniques, which implies that it isappropriate to start restructuring from distributionside rather than from generation sector (Reddy andSumithra, 1997; Sharma et al., 2001).
3. The failure to conceive the unique nature of theelectricity industry, which qualitatively differentiatesit from other sectors, is perhaps one reason for thelack of results. While unbundling the three majorfunctions namely generation, transmission and dis-tribution, it should be essentially preconceived howthese three interdependent functions would beeffectively operating in harmony, after unbundling.The vertically integrated structure of SEBs, howeverless efficient, was rugged and capable of dealing withmulti-faced functions including rural electrification,extending power to remote areas etc. Onceunbundled, there should be more clarity in identify-ing the agencies responsible for implementation of allthese functions. Lack of perception in this mattermay defeat the efficiency improvement programs.
4. During the pre-reform period, Integrated ResourcePlanning (IRP) was considered essential for the

D.P. Sharma et al. / Energy Policy 33 (2005) 563-576 575
overall development of the sector. The focus on anarrow band of electricity planning (without visualis-ing the energy sector as a whole) would notstrengthen the process. The unanticipated marketfluctuation in the cost of hydrocarbons like naphthaand its consequent impacts in the power industry isan example for this.
5. The welfare and social objectives were not givenrequired prominence in the restructuring aims. Asabout half of the Indian population is yet to haveaccess to electricity, it is essential to visualise this roleof the power sector also while initiating restructuring.Treating this sector as an industry with sole aims ofefficiency and profit will deter the social developmentprocess.
6. The restructuring proposals were more based oneconomic and efficiency standards, not with enoughthrust for the equity and environmental aspects.Hence from the sustainability point of view also thereform process lack adequate footing.
7. The present tailor-made structure of the ERC is notappropriate for Indian power sector. A 'true'competitive market only requires a regulatory frame-work of the present form. But such a competitivemarket is far from reality in India. Hence the ERCsnow have the role of tariff revising bodies. An energyboard, with a broader outlook on various techno-commercial matters related to energy with juris-diction on all segments of energy (not restricting toelectricity alone) would be appropriate.
It is essential that along with betterment of techno-commercial efficiency of power sector and improving theconsumer choice for better reliability, the reform shouldencompass the broader objective of providing access toelectricity to the major portion of the population ofIndia and to increase the affordability of this energyform by the weaker section of the society.
9. Future of reforms
Having experienced that the performance of theIndian power sector during the past decade of reformshas not fetched the positive results as expected, it may beappropriate to have thoughts regarding the futuretrajectory of reforms. It has been wisely advised thatrather than going for drastic steps of restructuring whichmay land up in serious after-effects that are hard tobear, small 'reversible paths' with greater clarity ofobjectives are ideal for Indian situations (Reddy, 2001,2002). Looking back on the continued poor perfor-mance of the power sector during the last decade and thevaluable experience gained from the shortfalls in therestructuring models (implemented in a few Indian
States), the following suggestions shall be worthconsidered while continuing future course of reforms.
1. The objectives and guiding principles of restructur-ing shall be framed taking into consideration thesocial objectives and restated with greater clarity.
2. The preconceived notion that 'the vertically inte-grated structure of SEBs are the root cause for theinefficiency and hence to be unbundled' shall bereviewed. The experience with unbundled utilities sofar does not substantiate this. Hence rather thanunbundling, efficiency improvement measures shallbe the objective.
3. It may not be always true that privatisation willfetch market efficiency and improve competition.Some countries (like Norway) have very efficientand competitive electricity market without privati-sation. Better public participation through co-operative sector can be a strong alternative.
4. Along with efficiency and economy the basicobjectives of access and affordability of electricity,especially to the weaker section of the public shouldalso be given equal thrust.
5. While effecting tariff increase to cover the opera-tional inefficiency it should be ensured that suchincreases are carried out on a rational social baseand simultaneously fulfilling the long-term objectiveof enhancing the efficiency.
6. Rather than a power sector restructuring policy itwill be effective to have a comprehensive energypolicy on the basis of integrated resource planning.
7. Along with capacity addition at generation side,energy conservation efforts through demand sidemanagement (DSM) measures shall also be takenup.
8. The present role of ERCs shall be redefined andassigned with improved functions as an effectivebody catalysing the development of power sector.
9. Steady incremental steps of reforms with fore-thought will be more appropriate than highlyaccelerated development programs.
10. It is essential to identify the 'real' crisis of the sectorso as to arrive at 'real' prescriptions. In the long run,adhoc programs will not bring any benefit to theconsumers, power sector or the society as a whole.
10. Conclusions
The power sector restructuring process initiatedduring 1991 has not succeeded in improving technicalefficiency or in improving financial position of the powersector. Also it could not reduce the losses or improvecustomer satisfaction. The social objectives of the powersector also could not be fulfilled effectively in the reformprocess. It is appropriate that serious review be made on
576 D.P. Sharma et al. / Energy Policy 33 (2005) 563-576
the past performance of the power sector and effectivesteps taken. Learning from the past decade's experienceof reforms, an integrated approach to redefine theobjectives and methodologies are imperative to realisedevelopment. This approach can only ensure reliableand affordable electricity with greater accessibility forthe Indian population.
References
Antonio, E., Andres, G.-L., Danny, L., 2001. Utilities privatizationand the poor: lessons and evidence from Latin America. WorldDevelopment 29 (7), 1179-1198.
Baijal, P., 1999. Restructuring power sector in India: a base paper.Economic and Political Weekly, 25September, pp. 2795-2804.
Berket, K., Almaz, B., Elias, K., 2002. Can the urban poor affordmodern energy? The case of Ethiopia. Energy Policy 30, 1029-1045.
Burns, P., Weyman-Jones, T., 1994. Productive efficiency and theregulatory review of regional electricity companies in the UK.Regulatory Policy Research Centre, Discussion Paper no. 1.
Cecilia, U., 2001. A public goods approach to regulation of utilities.World Institute for Development Economic Research, UnitedNations University, Discussion paper no. 2001/9.
Census, 2001. Census of India 2001, Provisional data for vitalstatistics. Office of the Registrar General, Government of India,also at http://www.censusindia.net.
Central Electricity Authority, 1995. Fifteenth Electric Power Survey ofIndia (Report), July.
Chisari, O., Estache, A., Romero, C., 1999. Winners and loosers fromthe privatisation and regulation of utilities: lessons from a generalequilibrium model for Argentine. World Bank Economic Review13/2, 357-378.
Chisari, O., Estache, A., Waddams, C., Price., 2001. Access by thepoor in Latin America's utility reform: subsidies and serviceobligations. World Institute for Development Economic Research,United Nations University, Discussion paper no. 2001/75.
Department of Energy, 2001. Kanungo committee report onpower sector reforms in Orissa (Report), Government of Orissa,October.
Dubash, N.K., Rajan, S.C., 2001. Power politics: Process of powersector reform in India. Economic and Political Weekly, 1September, pp. 3367-3390.
Faye, S., 2000. Regulation, Industry structure and performance in theelectricity supply industry. OECD Economic Department workingpaper no. 238, ECO/WKP (2000), p. 11, web site http://www.oecd.orgeco/eco.
Godbole, M., 2002a. Power sector reforms: if wishes were horses.Economic and Political Weekly, February 16, pp. 621-626.
Godbole, M., 2002b. Electricity Bill 2001: need for a fresh look.Economic and Political Weekly, May 18, pp. 1874-1878.
Godbole, M., 2002c. Electricity regulatory commissions, the jury is stillout. Economic and Political Weekly, June 8, pp. 2195-2200.
Kannan, K.P., Pillai, N.V., 2000. Plight of the power sector in India:SEBs and their saga of inefficiency, Working paper no. 308. Centrefor Development Studies, Trivandrum, India, November.
Karekezi, S., Kimani, J., 2002. Status of power sector reform in Africa:impact on the poor. Energy Policy 30 (2002), 923-945.
Karekezi, S., Majoro, L., 2002. Improving modern energy sources forAfrica's urban poor. Energy Policy 30 (2002), 1015-1028.
Kristin, K., Dale W., Xun, W., 2001. Access to Utilities by the poor:a global perspective. World Institute for DevelopmentEconomic Research, United Nations University. Discussionpaper no. 2001/15.
Maximo, T., Alberto, P.-F., 2001. The social impact of privatizationand the regulation of Utilities in Peru. World Institute forDevelopment Economic Research, United Nations University,Discussion paper no. 2001/17.
Ministry of Power, 2003. The Indian Electricity Act 2003. Web site ofMinistry of Power, http://www.powermin.nic.in.
Panda, H., 2002. Assessing the impact of power sector reforms in Orissa(Report), International Water Management Institute, Colombo.
Parikh, K.S., Radhakrishna, R., 2002. India Development Report2002. Oxford University Press, New Delhi, ISBN 019-565883-3.
Pineau, P.-O., 2002. Electricity Sector reform in Cameroon: isprivatization the solution? Energy Policy 30 (2002), 999-1012.
Planning Commission, 2001a. Annual report (2000-01) on the workingof State Electricity Boards and Electricity Departments. Power andEnergy Division, Planning Commission, Government of India,June.
Planning Commission, 2001b. Approach paper to the tenth five yearplan (2002-2007). Government of India, September.
Planning Commission, 2002. Annual report (2001-02) on the working ofState Electricity Boards and Electricity Departments. Power andEnergy Division, Planning Commission, Government of India, May.
Pollitt, M.G., 1997. The impact of liberalisation on the performance ofthe electricity supply industry: an international survey. Journal ofEnergy Literature 3/2, 3-31.
Preetum, D., Pollitt, M.G., 2000. The restructuring and privatisationof the electricity distribution and supply business in England andWales: a social cost-benefit analysis. World Institute for Develop-ment Economic Research, United Nations University, ISBN 952-455-158-6.
Reddy, A.K.N., 2000. Power sector reforms: Indian experienceand global trends. Economic and Political Weekly, March 18,pp. 1023-1028.
Reddy, A.K.N., 2001. California energy crisis and its lessons for powersector reform in India. Economic and Political Weekly, 5 May,pp. 1533-1540.
Reddy, A.K.N., 2002. Need for rethink on Karnataka power sectorreforms (article in two parts). The Deccan Herald Daily, 4th and5th Edition, Bangalore, January 2002.
Reddy, A.K.N., Sumithra, D.G., 1997. Karnataka's power sector—some revelations. Economic and Political Weekly, 22 March,pp. 585-560.
Ruet, J., 2002. A new paradigm for the Indian power sector: goingbeyond the silver bullet privatisation. In: Mishra, R.K., Gerard de, B.(Eds.), Chapter 12 in Privatisation of Public Enterprises: Indo-FrenchPerspectives and Global Relevance. Manak Publishers, New Delhi.
SAR, 1996. Staff Appraisal Report No. 14298-IN, Orissa powersector restructuring project, Energy and infrastructure operationsDivision, The World Bank.
Sharma, D.P., Nair, P.S. Chandramohanan, Balasubramanian, R.,2001. Perspective planning for generation expansion for the powersector of Kerala: an analytical framework incorporatingdemand side management options. Water and Energy Inter-national, July-September, pp. 39-51.
TEDDY, 2002. TERI Energy Data Directory and Yearbook. TataEnergy Research Institute, New Delhi, ISBN 81-85419-94-9.
UNDP, 2002. United Nations Development Program. HumanDevelopment Report 2002. Oxford University Press, New York,ISBN 0-19-521925-5.
World Bank, 1995. Power sector performance monitoring indicators.Power development, efficiency and house hold fuel division,Industry and energy department, May 1995, web site http://www.worldbank.org/html/opr/pmi/powind01.html.
World Bank, 1998. India: Environmental issues in the power sector.National synthesis (Draft report), April.
Yarrow, G., 1992. British electricity prices since privatisation, studiesin regulation. Regulatory Policy Institute, Oxford, paper no.1.