performance of engineered soil and trees in a parking lot … · · 2011-09-17research article...
TRANSCRIPT
This article was downloaded by: [University of California Davis]On: 08 August 2011, At: 09:50Publisher: Taylor & FrancisInforma Ltd Registered in England and Wales Registered Number: 1072954 Registered office: Mortimer House,37-41 Mortimer Street, London W1T 3JH, UK
Urban Water JournalPublication details, including instructions for authors and subscription information:http://www.tandfonline.com/loi/nurw20
Performance of engineered soil and trees in a parkinglot bioswaleQingfu Xiao a & E. Gregory McPherson ba Department of Land, Air, and Water Resources, University of California, Davis, USAb USDA Forest Service, Pacific Southwest Research Station, Urban Ecosystems & SocialDynamics Program, Davis, CA, 95618, USA
Available online: 08 Aug 2011
To cite this article: Qingfu Xiao & E. Gregory McPherson (2011): Performance of engineered soil and trees in a parking lotbioswale, Urban Water Journal, 8:4, 241-253
To link to this article: http://dx.doi.org/10.1080/1573062X.2011.596213
PLEASE SCROLL DOWN FOR ARTICLE
Full terms and conditions of use: http://www.tandfonline.com/page/terms-and-conditions
This article may be used for research, teaching and private study purposes. Any substantial or systematicreproduction, re-distribution, re-selling, loan, sub-licensing, systematic supply or distribution in any form toanyone is expressly forbidden.
The publisher does not give any warranty express or implied or make any representation that the contentswill be complete or accurate or up to date. The accuracy of any instructions, formulae and drug doses shouldbe independently verified with primary sources. The publisher shall not be liable for any loss, actions, claims,proceedings, demand or costs or damages whatsoever or howsoever caused arising directly or indirectly inconnection with or arising out of the use of this material.
RESEARCH ARTICLE
Performance of engineered soil and trees in a parking lot bioswale
Qingfu Xiaoa* and E. Gregory McPhersonb
aDepartment of Land, Air, and Water Resources, University of California, Davis, USA; bUSDA Forest Service, Pacific SouthwestResearch Station, Urban Ecosystems & Social Dynamics Program, Davis, CA 95618, USA
(Received 23 September 2010; final version received 6 June 2011)
A bioswale integrating an engineered soil and trees was installed in a parking lot to evaluate its ability to reducestorm runoff, pollutant loading, and support tree growth. The adjacent control and treatment sites each receivedrunoff from eight parking spaces and were identical except that there was no bioswale for the control site. A tree wasplanted at both sites. Storm runoff, pollutant loading, and tree growth were measured. There were 50 storm eventswith a total precipitation of 563.8 mm during February 2007 and October 2008. The bioswale reduced runoff by88.8% and total pollutant loading by 95.4%. The engineered soil provided a better aeration and drainage for treegrowth than did the control’s compacted urban soil. The superior performance of the bioswale demonstrated itspotential use for large-scale application in parking lots and roadsides to reduce runoff and support tree growth.
Keywords: urban runoff; water quality; engineered soil; bioswale; parking lot
Introduction
Increasing urbanisation has resulted in the construc-tion of more roads and parking lots, significantlyincreasing the amount of impervious land cover in ourtowns and cities (Arnold and Gibbons 1996). Daviset al. found parking lots accounted for 5% of urbanland use in the Upper Great Lakes region and 7% ofthe total urban area in Tippecanoe, Indiana (Daviset al. 2010a, 2010b). In metropolitan Sacramento,parking lots make up 12% of the urban land (Akbariet al. 2003). Impervious land cover alters the quantityand quality of surface runoff because of its effects onsurface retention storage, rainfall interception, infiltra-tion, runoff temperature, and contaminants. Largevolumes of excess storm water runoff from urbanisedareas cause flooding, water pollution, groundwaterrecharge deficits, destroyed habitat, beach closures,and toxicity to aquatic organisms (Greenstein et al.2004, USEPA 2005). Runoff from parking lots hasunique flushing effects (Black 1980) and can havesignificant ecological impact. Best Management Prac-tices (BMPs) have been developed to reduce parkinglot runoff and pollutant loading. These BMPs includeonsite treatments such as sand filters (USEPA 1999b),permeable pavement (Booth and Leavitt 1999), low-impact parking lot designs (Rushton 2001), and othertypes of treatment systems (Sonstrom et al. 2002).
These decentralised BMPs used source-control ap-proaches with potential to significantly reduce urbanstormwater runoff quantity (Shuster et al. 2008).Vegetative swales are recommended by the USEPAas BMPs to clean pollutants and improve waterquality (Barrett et al. 1998, Cheng 2003, Vyslouzilo-va et al. 2003, USEPA 2004, Matteo et al. 2006, Liuet al. 2007). Vegetation reduces surface runoff bycanopy interception (Xiao et al. 2000a) and improvesinfiltration of compacted subsoil (Bartens et al.2008). Some of the intercepted rainwater will neverreach the ground surface to produce surface runoff.Increasing canopy cover is one approach to reducingsurface runoff. Indeed, there are municipal storm-water credit programs in several US cities thatpromote tree planting and conservation (Greensboro1996, Haubner et al. 2001, City of San Jose 2006,City of Austin 2007, City of Portland 2008, City ofSeattle 2008). For example, The City of San Jose,California has a program that gives credits for newtrees planted within 9.1 m of impervious surfacesand for existing trees kept on a site if the trees’canopies are within 6.1 m of impervious surfaces.The credit for each new deciduous tree is 9.3 m2, andthe credit for each new evergreen tree is 18.6 m2. Thecredit for existing trees is the square-footage equal toone-half of the existing tree canopy. Up to 25% of a
*Corresponding author. Email: [email protected]
Urban Water Journal
Vol. 8, No. 4, August 2011, 241–253
ISSN 1573-062X print/ISSN 1744-9006 online
� 2011 Taylor & Francis
DOI: 10.1080/1573062X.2011.596213
http://www.informaworld.com
Dow
nloa
ded
by [
Uni
vers
ity o
f C
alif
orni
a D
avis
] at
09:
50 0
8 A
ugus
t 201
1
site’s impervious surface area can be treated throughthe use of trees.
Impervious land cover not only causes environ-mental problems downstream but also creates manyproblems that affect our daily quality of life. Urbanheat islands (Swaid and Hoffman 1989, Taha et al.1991, Simpson et al. 1993) and air quality problems(Smith 1978, McPherson and Simpson 1999, Scottet al. 1999, Simpson et al. 1999, Nowak et al. 2000) aredirectly caused by impervious land cover and the lackof vegetation cover. Tree planting programs have beenestablished in many cities across the United States(such as Denver, CO, Los Angeles and Sacramento,CA, and New York, NY etc.) to improve urban airquality and reduce the urban heat island (Hickenloo-per 2008, Sacramento Tree Foundation 2008, McPher-son et al. 2010). Many cities in California haveestablished parking lot ordinances that require 50%of paved area shaded within 10 to 15 years (McPherson2001) and treatment for 85th percentile 24-hour runoffevent (California State and Regional Water QualityControl Boards 2008). However, actual shading isoften less than required. One reason is stunted treegrowth due to inadequate soil volume, drainage, andaeration. Polluted urban stormwater runoff eventuallybuilds up pollutants in surface soils and sub-surfacesediments to cause environmental problems, includinggroundwater contamination (Mikkelsen et al. 1997)and the growing risk of heavy metal uptake by humansand livestock (Camobreco et al. 1996, Moller et al.2005).
Recently, green infrastructure technology (Bartenset al. 2008, Day and Dickinson, 2008, Bartens et al.2009) or biofilters (Bratieres et al. 2008, Blecken et al.2009, Hatt et al. 2009) has integrated engineered soiland vegetation to treat and store parking lot surfacerunoff. Engineered soil, a mixture of stones and regularsoil, is friendly to trees in urban environments becauseit is more porous than native backfill urban soil(Costello and Jones 2003, Smiley et al. 2006). Indeed,engineered soil has been used for landfill gas treatmentin Australia (Dever et al. 2007) and the United States(City of Santa Rosa 2010, Clearlake Lava Inc. 2010).The highly porous, engineered soil provides space fortemporarily storing surface runoff (Day and Dickinson2008, Thompson et al. 2008, Xiao and McPherson2008). By promoting deeper growing roots, engineeredsoil reduces the heaving of sidewalks, curbs and guttersby tree roots (Grabosky and Bassuk, 1995, Graboskyand Bassuk 1996, Smiley et al. 2006).
Bioswales, a part of landscape elements, have beendesigned to remove pollution from surface runoff.Traditional, the swales consist of a swaled drainagecourse filled with vegetation, compost and/or riprap.As part of surface runoff flow path, it is designed to
maximise the time water spends in the swale, whichaids the trapping of pollutants (USEPA 1999a).Biological factors also contribute to the breakdownof certain pollutants.
The engineered soil used in this study offers severaladvantages over other engineered soils. It is made ofnatural materials (75% lava rock and 25% loam soil,porosity: 45.3%) that are readily and inexpensivelyavailable in California. Because the main structuralelement is lava rock, the soil is very porous with highwater storage capacity, so it stores more stormwaterand makes more water available to the trees. The lavarock has a very high surface area to volume ratio, withnooks and crannies that trap pollutants and fostergrowth of bacteria that decompose nutrient pollutants(Xiao and McPherson 2008). Reducing surface runoffreduces pollutants travelling downstream into thereceiving water body. The potential of this engineeredsoil system was tested in laboratory experiments (Xiaoet al. 2006). The purpose of this study was to evaluateits effectiveness in the field. In this study a bioswalewas constructed adjacent to an existing parking lot.The objective was to evaluate its performance in termsof pollutant removal rate, storm-runoff reductioncapacity, and tree growth.
Methods
Study site
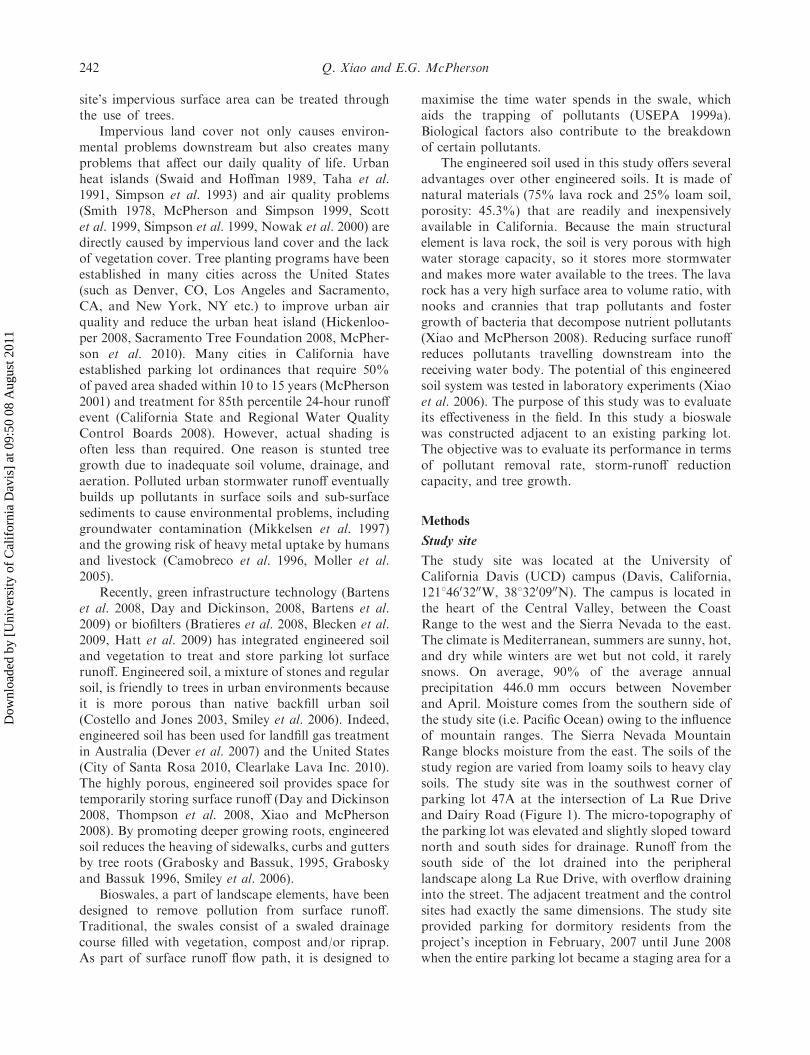
The study site was located at the University ofCalifornia Davis (UCD) campus (Davis, California,12184603200W, 3883200900N). The campus is located inthe heart of the Central Valley, between the CoastRange to the west and the Sierra Nevada to the east.The climate is Mediterranean, summers are sunny, hot,and dry while winters are wet but not cold, it rarelysnows. On average, 90% of the average annualprecipitation 446.0 mm occurs between Novemberand April. Moisture comes from the southern side ofthe study site (i.e. Pacific Ocean) owing to the influenceof mountain ranges. The Sierra Nevada MountainRange blocks moisture from the east. The soils of thestudy region are varied from loamy soils to heavy claysoils. The study site was in the southwest corner ofparking lot 47A at the intersection of La Rue Driveand Dairy Road (Figure 1). The micro-topography ofthe parking lot was elevated and slightly sloped towardnorth and south sides for drainage. Runoff from thesouth side of the lot drained into the peripherallandscape along La Rue Drive, with overflow draininginto the street. The adjacent treatment and the controlsites had exactly the same dimensions. The study siteprovided parking for dormitory residents from theproject’s inception in February, 2007 until June 2008when the entire parking lot became a staging area for a
242 Q. Xiao and E.G. McPherson
Dow
nloa
ded
by [
Uni
vers
ity o
f C
alif
orni
a D
avis
] at
09:
50 0
8 A
ugus
t 201
1
nearby campus construction project. There wereneither lockup shed nor structures built in this parkinglot that may change the runoff collection area. FromJune to October 2008, when the study concluded, theconstruction and other structures near the site did notinfluence stormwater runoff patterns or volumes.
Experiment setup
A treatment site (10.4 m617.4 m) included eightparking spaces and a buffer strip (0.6 m610.4 m)between the parking spaces and the bioswale. Thebioswale was 10.4 m long, 2.4 m wide, and 0.9 m deep.The treatment site had a rectangular shape. The northedge of the treatment site was the ridge of the parkinglot where surface runoff was naturally divided to floweither to the north or the south. Two pieces of rope(17.4 m long, 1.0 cm diameter) covered by tar (17.8 cmwide and 1.9 cm deep) were placed on the east and
west edges of the treatment site on the parking lot toprevent water from flowing across and off treatmentsite. Three redwood boards (5.1 cm625.4 cm) wereburied on the west, south, and east edges of thebioswale. These boards were set 2.5 cm above groundsurface. The redwood boards along the east and westsides of the bioswale were extended to the edge of theparking lot where they met the ropes. The three boardsand the two rope/tar strips defined the boundaries ofthe treatment site. Approximately 28.3 m3 of nativesoil was excavated and replaced with engineered soil toform the base of the bioswale. A fine graded non-woven geotextile (filter fabric Mirafi 180N, TenCate,Pendergrass, GA 30567) was placed at the bottom,sides, and top of the engineered soil. The geotextileprevented fine soil/sediment from entering the systemand reducing the system’s porosity. During soilreplacement, the engineered soil was packed with atamping rammer (Mikasa Sangyo Co., Ltd., Model:
Figure 1. The study sites are outlined with dash line in the images (2003,WAC Corporation, Inc. Eugene, Oregon, USA).Surface drainage of the parking lot is shown with the arrow line.
Urban Water Journal 243
Dow
nloa
ded
by [
Uni
vers
ity o
f C
alif
orni
a D
avis
] at
09:
50 0
8 A
ugus
t 201
1
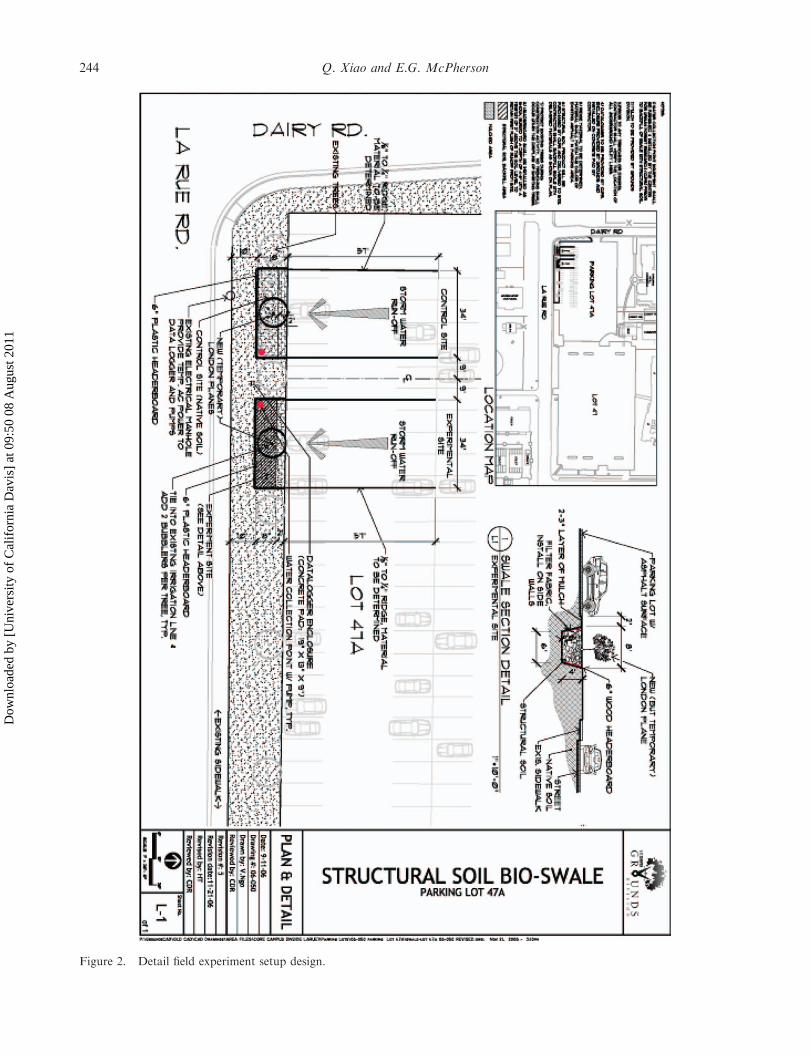
Figure 2. Detail field experiment setup design.
244 Q. Xiao and E.G. McPherson
Dow
nloa
ded
by [
Uni
vers
ity o
f C
alif
orni
a D
avis
] at
09:
50 0
8 A
ugus
t 201
1

MT-65H). A 19.0)litre Bloodgood London Plane(Platanus x acerifolia ‘Bloodgood’) tree was planted inthe centre of the bioswale. Initially, the bioswale wasdesigned to be 1.2 m deep, but was reduced to 0.9 mdepth during field installation to avoid damagingutility and communication cables that wereunderground.
The control site had an identical setup as thetreatment site except no soil was replaced (Figure 2).The soil of the control site was clay loam (porosity:0.46 m3 m73, saturated hydraulic conductivity:2.14 cm day71) (Wang et al. 1996, Bird et al.2000). The finished landscape of both control andtreatment sites followed the UCD parking lotstandard. Mulch (i.e. wood chips from 5.1 cm to7.6 cm deep) was uniformly spread over the entireplanting strip. Figure 3 shows the landscape before,during, and after the system installation. Thisbioswale was designed to eliminate runoff from a10-year storm event (7.9 cm rainfall) or 97% of allannual rainfall events (based on rainfall analysis of
Davis’ 2000 precipitation data), as per local devel-opment requirements (Karoly 1991).
After installation the system was tested withpotable water sprayed from a water truck to simulatestormwater runoff. The bioswale stored and infiltratedmore than 15.1 m3 of water, equivalent to 7.2 cmprecipitation and nearly a 10-year storm. There was nosettling of soil in the bioswale.
Runoff measurement system
Because of the relatively flat landscape between theparking lot and the street, surface runoff measurementswere conducted through a surface-subsurface watercollection and measurement system. Surface runoffwas directed to flow off each test area by the elevatedredwood board and into a 5.1 cm PVC pipe. One endof this PVC pipe was located at the lowest corner of thetest area (i.e. the outlet point) at ground surface leveland the other end was connected to a 189.0 litreunderground water storage tank located nearby
Figure 3. Field installation. Photos were taken at different stage of the field installation. a) Before the bioswale installation, b)excavated pit, c) filled with engineered soil, d) compacted the soil, e) leveled the pit, f) tested the soil settlement, g) added tree tothe system, h) finished site, i) both control and treatment sites were coved with mulch to match the surrounding land cover.
Urban Water Journal 245
Dow
nloa
ded
by [
Uni
vers
ity o
f C
alif
orni
a D
avis
] at
09:
50 0
8 A
ugus
t 201
1
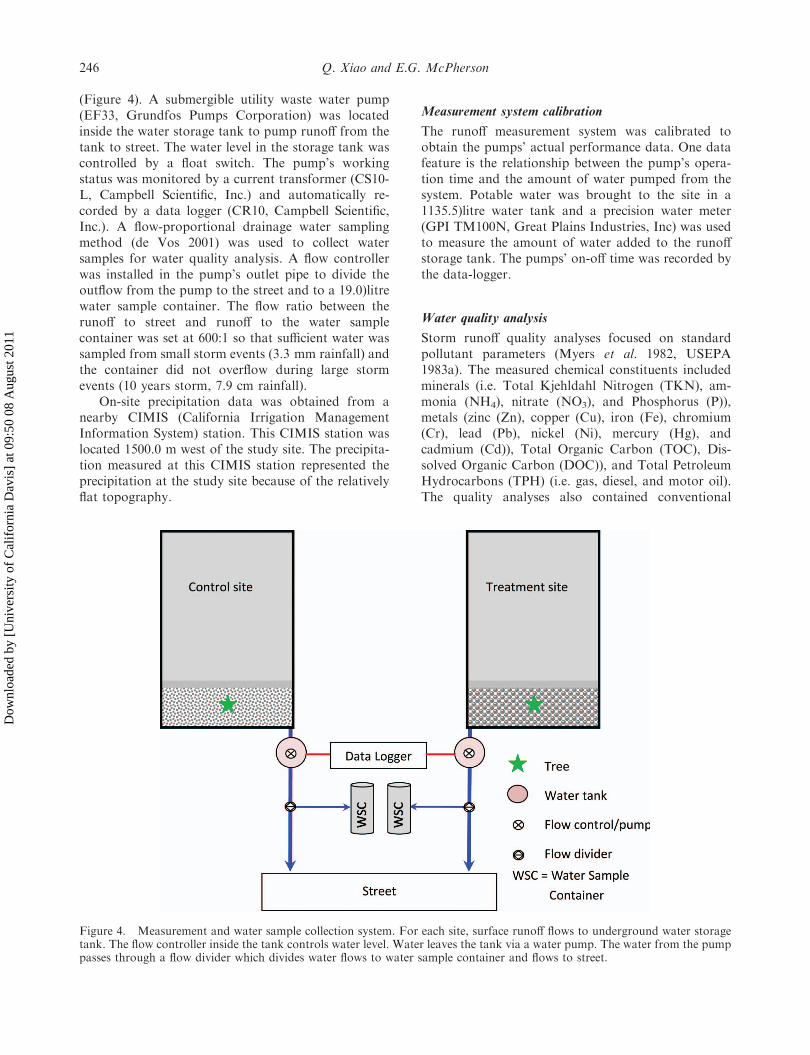
(Figure 4). A submergible utility waste water pump(EF33, Grundfos Pumps Corporation) was locatedinside the water storage tank to pump runoff from thetank to street. The water level in the storage tank wascontrolled by a float switch. The pump’s workingstatus was monitored by a current transformer (CS10-L, Campbell Scientific, Inc.) and automatically re-corded by a data logger (CR10, Campbell Scientific,Inc.). A flow-proportional drainage water samplingmethod (de Vos 2001) was used to collect watersamples for water quality analysis. A flow controllerwas installed in the pump’s outlet pipe to divide theoutflow from the pump to the street and to a 19.0)litrewater sample container. The flow ratio between therunoff to street and runoff to the water samplecontainer was set at 600:1 so that sufficient water wassampled from small storm events (3.3 mm rainfall) andthe container did not overflow during large stormevents (10 years storm, 7.9 cm rainfall).
On-site precipitation data was obtained from anearby CIMIS (California Irrigation ManagementInformation System) station. This CIMIS station waslocated 1500.0 m west of the study site. The precipita-tion measured at this CIMIS station represented theprecipitation at the study site because of the relativelyflat topography.
Measurement system calibration
The runoff measurement system was calibrated toobtain the pumps’ actual performance data. One datafeature is the relationship between the pump’s opera-tion time and the amount of water pumped from thesystem. Potable water was brought to the site in a1135.5)litre water tank and a precision water meter(GPI TM100N, Great Plains Industries, Inc) was usedto measure the amount of water added to the runoffstorage tank. The pumps’ on-off time was recorded bythe data-logger.
Water quality analysis
Storm runoff quality analyses focused on standardpollutant parameters (Myers et al. 1982, USEPA1983a). The measured chemical constituents includedminerals (i.e. Total Kjehldahl Nitrogen (TKN), am-monia (NH4), nitrate (NO3), and Phosphorus (P)),metals (zinc (Zn), copper (Cu), iron (Fe), chromium(Cr), lead (Pb), nickel (Ni), mercury (Hg), andcadmium (Cd)), Total Organic Carbon (TOC), Dis-solved Organic Carbon (DOC)), and Total PetroleumHydrocarbons (TPH) (i.e. gas, diesel, and motor oil).The quality analyses also contained conventional
Figure 4. Measurement and water sample collection system. For each site, surface runoff flows to underground water storagetank. The flow controller inside the tank controls water level. Water leaves the tank via a water pump. The water from the pumppasses through a flow divider which divides water flows to water sample container and flows to street.
246 Q. Xiao and E.G. McPherson
Dow
nloa
ded
by [
Uni
vers
ity o
f C
alif
orni
a D
avis
] at
09:
50 0
8 A
ugus
t 201
1
physical properties such as pH, Electrical Conductivity(EC), Total Dissolved Solids (TDS), and TotalSuspended Solids (TSS), because they are of primaryconcern in runoff water quality. Total dissolved solids(TDS) are differentiated from total suspended solids(TSS), in that the latter cannot pass through a sieve oftwo micrometers and yet are indefinitely suspended insolution.
The majority of these water quality parameterswere analysed at the Division of Agriculture andNatural Resources (ANR) Analytical Laboratory,University of California. The ANR Analytical La-boratory performs water quality analyses for theseselected chemical constituents with USEPA recom-mended or standard analytical methods. The MethodDetection Limit (MDL) for minerals was 0.05 mg/Lexcept TKN, for which the MDL was 0.10 mg/L. Formetals, the MDL was 0.1 mg/L for copper, 0.02 mg/Lfor zinc, and 0.05 mg/L for both nickel and lead. Forchromium and cadmium, the MDL was 0.005 mg/L,and selenium and mercury had an MDL of 1.0)m g/L.The organic carbon and hydrocarbon analyses wereconducted by California Laboratory Services (CLSLabs). CLS is an USEPA certified full serviceenvironmental chemistry laboratory. MDL were 1.0mg/L for TOC and DOC and 0.05 mg/L for TPH.
The nature of the pollutant concentrations mea-sured for each storm event represented the Event Mean
Concentration (EMC) because the water samples wereflow-proportional (USEPA, 2002). Standard statisticalanalytical methods (i.e., mean, minimum, maximumconcentrations, standard deviation, and t-test) wereused to perform water quality statistical data analysis.
Results and discussion
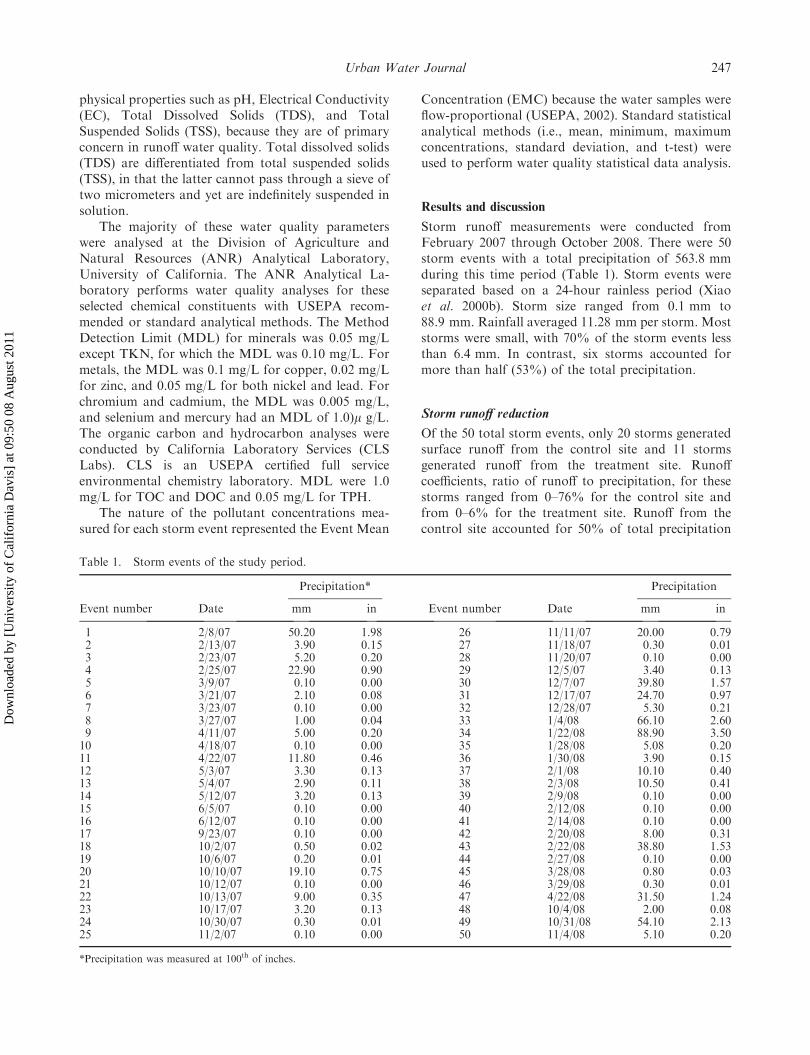
Storm runoff measurements were conducted fromFebruary 2007 through October 2008. There were 50storm events with a total precipitation of 563.8 mmduring this time period (Table 1). Storm events wereseparated based on a 24-hour rainless period (Xiaoet al. 2000b). Storm size ranged from 0.1 mm to88.9 mm. Rainfall averaged 11.28 mm per storm. Moststorms were small, with 70% of the storm events lessthan 6.4 mm. In contrast, six storms accounted formore than half (53%) of the total precipitation.
Storm runoff reduction
Of the 50 total storm events, only 20 storms generatedsurface runoff from the control site and 11 stormsgenerated runoff from the treatment site. Runoffcoefficients, ratio of runoff to precipitation, for thesestorms ranged from 0–76% for the control site andfrom 0–6% for the treatment site. Runoff from thecontrol site accounted for 50% of total precipitation
Table 1. Storm events of the study period.
Precipitation* Precipitation
Event number Date mm in Event number Date mm in
1 2/8/07 50.20 1.98 26 11/11/07 20.00 0.792 2/13/07 3.90 0.15 27 11/18/07 0.30 0.013 2/23/07 5.20 0.20 28 11/20/07 0.10 0.004 2/25/07 22.90 0.90 29 12/5/07 3.40 0.135 3/9/07 0.10 0.00 30 12/7/07 39.80 1.576 3/21/07 2.10 0.08 31 12/17/07 24.70 0.977 3/23/07 0.10 0.00 32 12/28/07 5.30 0.218 3/27/07 1.00 0.04 33 1/4/08 66.10 2.609 4/11/07 5.00 0.20 34 1/22/08 88.90 3.5010 4/18/07 0.10 0.00 35 1/28/08 5.08 0.2011 4/22/07 11.80 0.46 36 1/30/08 3.90 0.1512 5/3/07 3.30 0.13 37 2/1/08 10.10 0.4013 5/4/07 2.90 0.11 38 2/3/08 10.50 0.4114 5/12/07 3.20 0.13 39 2/9/08 0.10 0.0015 6/5/07 0.10 0.00 40 2/12/08 0.10 0.0016 6/12/07 0.10 0.00 41 2/14/08 0.10 0.0017 9/23/07 0.10 0.00 42 2/20/08 8.00 0.3118 10/2/07 0.50 0.02 43 2/22/08 38.80 1.5319 10/6/07 0.20 0.01 44 2/27/08 0.10 0.0020 10/10/07 19.10 0.75 45 3/28/08 0.80 0.0321 10/12/07 0.10 0.00 46 3/29/08 0.30 0.0122 10/13/07 9.00 0.35 47 4/22/08 31.50 1.2423 10/17/07 3.20 0.13 48 10/4/08 2.00 0.0824 10/30/07 0.30 0.01 49 10/31/08 54.10 2.1325 11/2/07 0.10 0.00 50 11/4/08 5.10 0.20
*Precipitation was measured at 100th of inches.
Urban Water Journal 247
Dow
nloa
ded
by [
Uni
vers
ity o
f C
alif
orni
a D
avis
] at
09:
50 0
8 A
ugus
t 201
1

during this measurement period. In contrast, only 3%of rainfall falling on the treatment site contributed tosurface runoff flowing off the site (Table 2). No runoffflowed to the street from either site when precipitationwas less than 3.3 mm or 50% of the storm events.From the treatment site, there was no runoff flow tostreet for all storms less than 9.0 mm or 70% of thetotal storm events. Storm runoff in the treatment sitewas significantly reduced. The runoff from the treat-ment site was 94% less than runoff from the controlsite. The rate of runoff reduction of this system wassimilar to other biofilter studies. For example, a fieldtest of biofilters in Australia found that they reducedpeak runoff flow rats by at least 80% (Hatt et al. 2009).
Initially, the bioswale was designed to be 1.2 mdeep to retain and treat storm runoff from a 10-yearevent. However, the bioswale’s depth was reduced by0.3 m during field installation to avoid damagingunderground utility and communication cables. Theresulting 25% volume reduction may explain whyrunoff was observed for storm events with less than a10-year return frequency.
Pollutant reduction
There were 21 chemical constituents analysed in thisproject (Table 3). All detectable water quality con-stituents’ concentrations from the control site were
Table 2. Runoff and runoff coefficient by storm event.
Event Number Precipitation (mm)
Control site Treatment site
Litre Gallon RC** Litre Gallon RC
1 50.2 4,425.4 1,169.1 0.412 3.9 126.7 33.5 0.153 5.2 271.5 71.7 0.254 22.9 2,027.2 535.5 0.4212 3.3 208.2 55.0 0.3020 19.1 2,140.4 565.4 0.53 178.7 47.2 0.0422 9.0 1,049.8 277.3 0.55 89.4 23.6 0.0526 20.0 1,601.6 423.1 0.38 175.7 46.4 0.0430 39.8 5,211.2 1,376.6 0.62 364.0 96.2 0.0431 24.7 2,216.6 585.6 0.42 89.0 23.5 0.0233 66.1 10,653.8 2,814.4 0.76 654.9 173.0 0.0534 88.9 14,103.8 3,725.8 0.75 1,128.1 298.0 0.0635 5.1 330.3 87.2 0.3136 3.9 250.5 66.2 0.3037 10.1 1,465.0 387.0 0.68 93.5 24.7 0.0438 10.5 1,575.1 416.1 0.71 94.1 24.9 0.0442 8.0 766.6 202.5 0.4543 38.8 4,706.4 1,243.3 0.57 273.0 72.1 0.0349 54.1 5,666.5 1,496.9 0.49 633.0 167.2 0.0650 5.1 576.9 152.4 0.53
*Only storms that had runoff flow off the system are listed in this table. The gray areas are storms with no runoff flow out the system. The date ofeach storm event was listed in Table 1.**RC: Runoff coefficient.
Table 3. Summary of runoff quality measurement.
Constituent
Control site Treatment site
EMC range Median EMC EMC range Median EMC
DOC (mg/L) 10.00–76.00 17.50 7.50–73.00 14.50EC (dS/m) 0.04–1.00 0.15 0.05–0.29 0.08Fe (mg/L) 0.40–2.35 0.63 0.85–3.40 2.15NH4-N (mg/L) 0.03–1.03 0.09 0.03–0.64 0.07NO3-N (mg/L) 0.07–5.87 0.40 0.03–13.23 0.25P (mg/L) 0.10–2.50 0.40 0.20–1.90 0.30pH 6.70–7.70 7.41 7.00–7.80 7.45PO4-P (mg/L) 0.08–2.20 0.29 0.07–1.53 0.20TDS (mg/L) 80.00–305.00 95.00 35.00–260.00 85.00TKN (mg/L) 0.55–8.10 1.48 0.95–8.20 1.35TOC (mg/L) 11.00–35.00 22.00 7.80–25.00 20.00TSS (mg/L) 6.00–23.00 12.50 9.00–28.50 17.79
248 Q. Xiao and E.G. McPherson
Dow
nloa
ded
by [
Uni
vers
ity o
f C
alif
orni
a D
avis
] at
09:
50 0
8 A
ugus
t 201
1
Table
4.
Pollutantloadingbystorm
events.
Controlsite
Treatm
entsite
Event
Number
PT**
PS***TKN
NO
3NH
4Fe
Zn
TOC
DOC
TDS
TSS
PT
PS
TKN
NO
3NH
4Fe
Zn
TOC
DOC
TDS
TSS
111.1
9.7
35.8
26.0
4.6
2.4
0.9
154.9
336.3
1,261.1
112.8
20.3
0.3
1.0
0.7
0.1
0.1
0.0
4.4
9.6
36.1
3.2
30.7
0.6
2.2
1.6
0.3
0.1
0.1
9.5
20.6
77.4
6.9
45.1
4.4
16.4
11.9
2.1
1.1
0.4
70.9
154.0
577.7
51.7
12
0.5
0.5
1.7
1.2
0.2
0.1
0.0
7.3
15.8
59.3
5.3
20
5.4
4.7
17.3
12.6
2.2
1.2
0.4
74.9
162.7
609.9
54.6
0.3
0.3
1.5
0.6
0.1
0.2
0.0
3.8
13.0
39.3
3.5
22
2.2
2.0
4.6
13.9
0.1
0.4
0.1
36.7
56.7
320.1
12.6
0.0
0.0
0.1
0.5
0.0
0.2
0.0
1.9
1.7
23.2
0.5
26
3.3
3.1
7.0
21.2
0.1
0.6
0.1
56.1
86.5
488.5
19.2
0.0
0.0
0.3
0.9
0.0
0.4
0.0
3.7
3.3
45.7
1.1
30
2.6
1.6
7.3
2.5
0.8
2.6
0.3
57.3
125.1
469.0
52.1
0.2
0.1
0.9
0.1
0.0
0.7
0.0
4.4
6.2
29.1
10.2
31
0.9
0.6
3.4
0.7
0.1
1.2
0.4
53.2
22.2
199.5
42.1
0.0
0.0
0.1
0.0
0.0
0.3
0.0
2.2
0.7
6.2
0.8
33
2.1
1.8
12.3
1.8
1.2
25.0
0.5
213.1
106.5
852.2
245.0
0.1
0.1
0.6
0.0
0.0
1.4
0.0
12.4
4.9
52.4
5.9
34
1.4
1.1
7.8
1.0
0.4
9.9
0.7
169.2
141.0
1,198.7
401.9
0.3
0.2
1.1
0.1
0.0
3.8
0.1
8.8
8.5
39.5
11.3
35
0.0
0.0
0.2
0.0
0.0
0.2
0.0
4.0
3.3
28.1
9.4
36
0.1
0.0
0.2
0.0
0.0
0.4
0.0
2.8
2.8
25.0
2.9
37
0.3
0.2
1.2
0.2
0.0
2.1
0.1
16.1
16.1
146.5
16.8
0.0
0.0
0.1
0.0
0.0
0.2
0.0
1.1
1.1
4.7
1.6
38
0.6
0.5
3.2
1.3
0.2
1.7
0.1
55.1
50.4
189.0
26.1
0.1
0.0
0.2
0.2
0.0
0.2
0.0
2.0
1.8
8.9
1.4
42
0.3
0.2
1.6
0.6
0.1
0.8
0.0
26.8
24.5
92.0
12.7
43
1.9
1.4
9.6
3.9
0.7
5.2
0.2
164.7
150.6
564.7
78.1
0.2
0.1
0.6
0.5
0.0
0.4
0.0
5.7
5.2
25.9
4.1
49
14.2
12.4
45.9
33.2
5.8
3.1
1.1
198.3
430.6
1,614.8
144.5
1.2
1.0
5.2
2.1
0.4
0.5
0.0
13.3
46.2
139.2
12.3
50
1.4
1.3
4.7
3.4
0.6
0.3
0.1
20.2
43.8
164.4
14.7
Total
54.3
46.5
183.5
137.8
19.7
58.7
5.6
1,395.5
1,959.1
8,973.9
1,312.7
2.6
1.9
10.6
5.1
0.7
8.3
0.3
59.3
92.6
414.2
52.7
*Only
storm
sthathadrunoffflow
offthesystem
are
listed
inthistable.Thegrayareasare
storm
swithnorunoffflow
offthesystem
.**PT:Totalphosphorus.
**PS:Dissolved
phosphorus.
Urban Water Journal 249
Dow
nloa
ded
by [
Uni
vers
ity o
f C
alif
orni
a D
avis
] at
09:
50 0
8 A
ugus
t 201
1

consistently higher than those measured from thetreatment site except for iron and pH. The iron and pHwere consistently lower from the control site than thosemeasured from the treatment site. However, there wasno statistically significant difference between the run-off’s pollutant concentrations between the two sites.Only Zn and Fe were detected from both treatmentand control sites. The other metal elements (i.e. Cu,Cd, Cr, Pb, Ni, and Hg) were below the laboratory’sMethod Detection Limit (MDL). This may be due torelatively clean runoff from this lot (Xiao et al. 2006) ascompared with runoff data from USEPA (USEPA1983b). Diesel and motor oil were not detected fromrunoff samples collected from both sites. This may bedue to filtering by the mulch applied on top of theplanting strip. Hong et al. found that a thin layer ofmulch on the surface of a bio-retention facility caneffectively reduce oil and grease from urban storm-water runoff (Hong et al. 2006).
Loading reduction
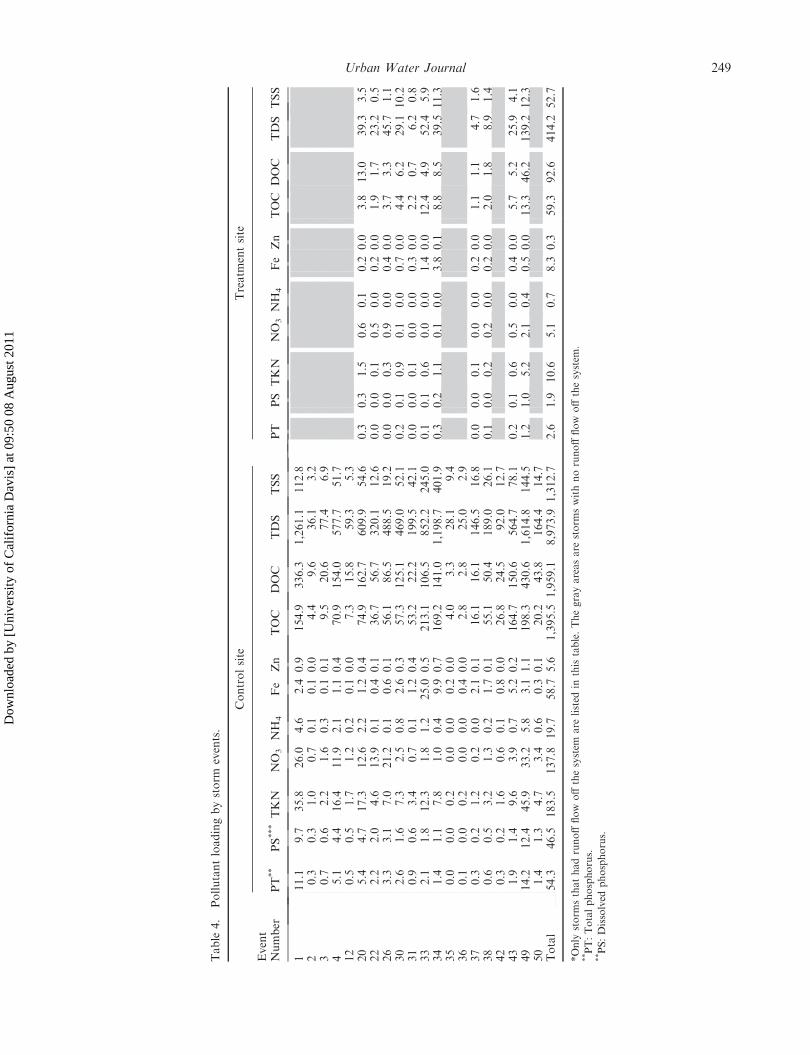
The bioswale not only reduced the amount of runoffbut also reduced runoff pollutant loading. Thus,pollutant loading that contributed to downstreamrunoff was different for the two sites. Table 4 listspollutant loading from each storm event. This bioswalesystem reduced minerals by 95.3%, metals by 86.7%,organic carbon by 95.5%, and solids by 95.5%. Theaverage loading reduction of this bioswale was 95.4%.A similar pollutant reduction rate was found in large-scale biofilter column test, where up to 70% N and85% P were reduced (Bratieres et al. 2008). Bleckenet al. found that biofilters can remove 90% of metalsfrom stormwater (Blecken et al. 2009). Total loadingfrom the control and from the treatment sites were14,147.3 g and 675.1 g, respectively. Solids (i.e. TDSand TSS) accounted for the majority of the loading(more than 72%), followed by organic carbon (i.e.TOC and DOC) which accounted for more than 23%of the total loading. Minerals (i.e. nitrogen (TKN,ammonia, and ammonium) and phosphorus (total anddissolved)) accounted for 3% of the total loading. Thetotal amount of metals (i.e. Zn and Fe) from thetreatment site was much smaller than from the controlsite (8.6 g vs. 64.3 g). However, 1.3% of loading fromthe treatment site were metals compared to 0.5%metals from the control site. The lava rock could be asource of iron, accounting for the higher ironconcentration found in water samples collected fromthe treatment site. TPH from both sites were below thelaboratory detectable limit.
The pH measured in the water samples wasconsistently higher for the treatment site than thecontrol site. At a confidence level of 0.05, there was no
significant difference in pH measured in the runoffsamples from the two sites. However, the pH value was4% higher in the runoff from the treatment site(average pH) ¼ )7.53) than from the control site(average pH) ¼ )7.25). Relatively higher alkalinityfor engineered soils was observed (Day and Dickinson2008), and is very likely caused by the lava rock.Higher soil pH should be considered when selectingtrees for the engineered soil because some species areless tolerant than others.
Water samples collected in this study were stormevent based or water quality represented by EMC.Without taking into account the dynamics of theprocess, there was uncertainty in measured waterquality data. Further water quality data collectionfrom this study site would allow long-term perfor-mance analysis and reduce the uncertainty (Harmeland King 2005, Gulliver et al. 2010).
Tree growth
During this 16-month study, the tree growth at thetreatment site was slightly better (visual observation ofleaves and new branches) than growth at the controlsite. The engineered soil provided better aeration anddrainage for the trees during the winter, when rainfallwas abundant. However, during the dry summer thetree planted in the bioswale required more frequentirrigation due to drainage characteristics of theengineered soil. More frequent irrigation, especiallywhile tree roots are getting established, may increasethe cost of irrigation. Although not observed in thisstudy, trees planted in the engineered soil may requiresupplemental fertilisation because of the limitedamount of soil in the mix.
Bioswale vegetation has proven to play an im-portant role in the process of removing pollutants fromrunoff (Barrett et al. 1998, Mazer et al. 2001, Wonget al. 2006). The trees in this study were too young andsmall to achieve a high level of performance. Longer-term studies are required to provide more informationabout the changing dynamics of tree interception andevapotranspiration on runoff reduction and to provideinformation about the physical and chemical proper-ties of the engineered soil change over time that mayaffect the performance of the system.
Conclusion
Field experiment results indicate that the bioswaleeffectively reduced the amount of storm runoff andpollutant (i.e. minerals, metals, organic carbons,hydrocarbons, and solids) loading from the parkinglot. The bioswale reduced runoff by 88.8% and thetotal loading by 95.4%. Individual water quality
250 Q. Xiao and E.G. McPherson
Dow
nloa
ded
by [
Uni
vers
ity o
f C
alif
orni
a D
avis
] at
09:
50 0
8 A
ugus
t 201
1
constituent reduction rates ranged from 86% for ironto 97% for nitrogen. Pollutant removal rates forminerals, metals, organic carbon, and solids were 95%,87%, 95%, and 95%, respectively. The high porosityof the engineered soil provided more space to storerunoff and better aeration to the tree root system withthe compacted clay loam soil at the control site.
Acknowledgements
We would like to express our appreciation to Skip Mezgerand Christina DeMartini Reyes at the Buildings andGrounds Division, University of California Davis for theirassistance in site selection, field installation, and sitemaintenance. We thank Matt Forrest, Dennis Jackson, andMike Lemaire at Buildings and Grounds Services ofUniversity of California for their assistance installing theirrigation system and the parking lot stripping. We appreci-ate Vince Lampman and his crew members at the Ag andIndustrial Services, University of California Davis for theirassistance installing the system. We thank Damon Williamsand his crew at Operations and Maintenance Electrical fortheir assistance making the electricity available to the site,and Henry Tsai and Henry Luc for planting and caring forthe trees. We also thank Chris Cioni at O&M Utilities,University of California Davis, Cliff Contreras and RobertaDevine at Transportation and Parking Services, University ofCalifornia Davis for their support on this project. Our thanksalso go to Mike Mata at the Department of Land, Air, andWater Resources, University of California Davis for hisassistance in the measurement system calibration. Thisresearch was supported in part by funds provided by theUS Forest Service Pacific Southwest Research Station and bythe National Urban and Community Forestry AdvisoryCouncil (NUCFAC).
References
Akbari, H., Rose, L.S. and Taha, H., 2003. Analyzing theland cover of an urban environment using high-resolu-tion orthophotos. Landscape And Urban Planning, 63 (1),P1–14.
Arnold, C. and Gibbons, C., 1996. Impervious surfacecoverage – The emergence of a key environmentalindicator. Journal of the American Planning Association,62 (2), 243–258.
Barrett, M.E., et al., 1998. Performance of vegetativecontrols for treating highway runoff. Journal of Environ-mental Engineering-Asce, 124 (11), 1121–1128.
Bartens, J., et al., 2008. Can Urban Tree Roots ImproveInfiltration through Compacted Subsoils for StormwaterManagement;) Journal of Environmental Quality, 37 (6),2048–2057.
Bartens, J., et al., 2009. Transpiration and root developmentof urban trees in structural soil stormwater reservoirs.Environmental Management, 44 (4), 646–657.
Bird, N.R.A., Perrier, E., and Rieu, M., 2000. The waterretention function for a model of soil structure with poreand solid fractal distributions. European Journal of SoilScience, 51 (1), 55–63.
Black, P.E., 1980. Water-quality patterns during a storm on amall parking lot. Water Resources Bulletin, 16 (4), 615–620.
Blecken, G.T., et al., 2009. Influence of intermittent wettingand drying conditions on heavy metal removal by storm-water biofilters. Water Research, 43 (18), 4590–4598.
Booth, D.B. and Leavitt, J., 1999. Field evaluation ofpermeable pavement systems for improved stormwatermanagement. Journal of the American Planning Associa-tion, 65 (3), 314–325.
Bratieres, K., et al., 2008. Nutrient and sediment removal bystormwater biofilters: A large-scale design optimisationstudy. Water Research, 42 (14), 3930–3940.
California State and Regional Water Quality ControlBoards, 2008. Small Municipal Separate Storm SewerSystem (MS4) General Permit [online]. Available from:http://www.waterboards.ca.gov/water_issues/programs/stormwater/phase_ii_municipal.shtml, [accessed July 192011].
Camobreco, V.J., et al., 1996. Movement of heavy metalsthrough undisturbed and homogenized soil columns. SoilScience, 161 (11), 740–750.
Cheng, S.P., 2003. Heavy metals in plants and phytor-emediation – A state-of-the-art report with specialreference to literature published in Chinese journals.Environmental Science and Pollution Research, 10 (5),335–340.
City of Austin, 2007. Stormwater management worksheet forsingle family residential lot redevelopment, Austin, Texas.Texas: City of Austin.
City of Portland, 2008. Stormwater management manual. Cityof Portland, OR: BES.
City of San Jose, C., 2006. Post-construction urban runoffmanagement. San Jose, CA: City of San Jose.
City of Santa Rosa, 2010. Compost facility. Santa Rosa, CA:City of Santa Rosa.
City of Seattle, 2008. The effects of trees on stormwater runoff.Seattle, WA: Herrera Environmental Consultants, Inc.,Seattle Public Utilities.
Clearlake Lava Inc, 2010. Air biofilter. Clearlake, CA:Clearlake Lava Inc.
Costello, L.R. and Jones, K.S., eds., 2003. Reducinginfrastructure damage by tree roots: a compendium ofstrategies. Cohasset, CA: Western Chapter of theInternational Society of Arboriculture (WCISA).
Davis, A.Y., et al., 2010a. The environmental and economiccosts of sprawling parking lots in the United States. LandUse Policy, 27 (2), 255–261.
Davis, A.Y., et al., 2010b. Estimating parking lot footprintsin the Upper Great Lakes Region of the USA. LandscapeAnd Urban Planning, 96 (2), 8–77.
Day, S.D. and Dickinson, S.B., 2008. A new stormwater bestmanagement practice using trees and structural soils.Blacksburg, VA: Virginia Polytechnic Institute and StateUniversity.
de Vos, J.A., 2001. Monitoring nitrate leaching fromsubmerged drains. Journal of Environmental Quality, 30(3), 1092–1096.
Dever, S.A., Swarbrick, G.E., and Stuetz, R.M., 2007.Passive drainage and biofiltration of landfill gas:Australian field trial. Waste Management, 27 (2),277–286.
Grabosky, J. and Bassuk, N., 1995. A new urban tree soil tosafely increase rooting volumes under sidewalks. Journalof Arboriculture, 21 (4), 187–201.
Grabosky, J. and Bassuk, N., 1996. Testing of structuralurban tree soil materials for use under pavement toincrease street tree rooting volumes. Journal of Arbor-iculture, 22 (6), 255–262.
Urban Water Journal 251
Dow
nloa
ded
by [
Uni
vers
ity o
f C
alif
orni
a D
avis
] at
09:
50 0
8 A
ugus
t 201
1
Greensboro, 1996. City of Greensboro Water ResourcesDepartment Stormwater Credit Policy [online], City ofGreensboro. Available from: http://www.greensboro-nc.gov/NR/rdonlyres/E0AC56EE-0843-4D1B-8689-EA3752EBA3D9/0/CreditPolicy2005.pdf [Accessed July 192011].
Greenstein, D., Tiefenthaler, L., and Bay, S., 2004. Toxicityof parking lot runoff after application of simulatedrainfall. Archives of Environmental Contamination andToxicology, 47 (2), 199–206.
Gulliver, J.S., Erickson, A.J., and Weiss, P.T., 2010. Storm-water Treatment: Assessment and Maintenance. Minnea-polis, MN: University of Minnesota, St. Anthony FallsLaboratory.
Harmel, R.D. and King, K.W., 2005. Uncertainty inmeasured sediment and nutrient flux in runoff fromsmall agricultural watersheds. Transactions of the ASAE,48 (5), 1713–1721.
Hatt, B.E., Fletcher, T.D., and Deletic, A., 2009. Hydrologicand pollutant removal performance of stormwaterbiofiltration systems at the field scale. Journal OfHydrology, 365 (3–4), 310–321.
Haubner, S., et al., 2001. Georgia stormwater managementmanual. Stormwater Policy Guidebook. Atlanta, GA:Georgia Dept of Natural Resources.
Hickenlooper, J.W., 2008. State of City [online]. Availablefrom http://www.greenprintdenver.org/about/stateofcity.php [accessed July 19 2011].
Hong, E.Y., Seagren, E.A., and Davis, A.P., 2006. Sustain-able oil and grease removal from synthetic stormwaterrunoff using bench-scale bioretention studies. WaterEnvironment Research, 78 (2), 141–155.
Karoly, M., 1991. Design Standards. City of Davis. Davis CA95616: Department of Public Works.
Liu, Y.J., Zhu, Y.G., and Ding, H., 2007. Lead and cadmiumin leaves of deciduous trees in Beijing, China: Develop-ment of a metal accumulation index (MAI). Environ-mental Pollution, 145 (2), 387–390.
Matteo, M., Randhir, T., and Bloniarz, D., 2006. Watershed-scale impacts of forest buffers on water quality andrunoff in urbanizing environment. Journal Of WaterResources Planning And Management-Asce, 132 (3), 144–152.
Mazer, G., Booth, D., and Ewing, K., 2001. Limitations tovegetation establishment and growth in biofiltrationswales. Ecological Engineering, 17 (4), 429–443.
McPherson, E.G., 2001. Sacramento’s parking lot shadingordinance: Environmental and economic costs ofcompliance. Landscape & Urban Planning, 57 (2),105–123.
McPherson, E.G., et al., 2010. Million trees Los Angelescanopy cover and benefit assessment. Landscape andUrban Planning, 99 (2011), 40–50.
McPherson, G.E. and Simpson, J.R., 1999. Reducing airpollution through urban forestry, The 48th Annual Meet-ing of the California Forest Pest Council, Sacramento,CA.
Mikkelsen, P.S., et al., 1997. Pollution of soil and ground-water from infiltration of highly contaminated storm-water - a case study. Water Science And Technology, 36(8–9), 325–330.
Moller, A., et al., 2005. Urban soil pollution in Damascus,Syria: concentrations and patterns of heavy metals in thesoils of the Damascus Ghouta. Geoderma, 124 (1–2), 63–71.
Myers, C., Athayde, D., and Driscoll, E., 1982. EPAsnationwide urban runoff program – designed to produceuseful results. Civil Engineering, 52 (2), 54–55.
Nowak, D.J., Abdollahi, K., and Ning, Z.H., 2000. Theinteractions between urban forests and global climatechange, The Urban Forest and Global Climate Change.Baton Rouge, LA: Franklin Press.
Rushton, B.T., 2001. Low-impact parking lot designreduces runoff and pollutant loads. Journal of WaterResources Planning and Management-ASCE, 127 (3),172–179.
Sacramento Tree Foundation, 2008. Sacramento Greenprint[online], City of Sacramento, CA. Available from: http://www.sactree.com/doc.aspx?30 [Accessed July 19 2011].
Scott, K., et al., 1999. Green parking lots: can trees improveair quality? In: McPherson, E.G. and S. Mathis, eds.Proceedings of the best of the West summit, 1998, SanFrancisco. Davis: UC Davis College of Agricultural andEnvironmental Sciences, 86–87.
Shuster, W.D., Morrison, M.A., and Webb, R., 2008. Front-loading urban stormwater management for success – aperspective incorporating current studies on the imple-mentation of Retrofit low-impact development. Citiesand the Environment, 1 (2), 1–15.
Simpson, J.R., McPherson, E.G., and Kollin, C., 1999.Energy and air quality improvements through urban treeplanting. Proceedings of the 1999 National Urban ForestConference. Washington, DC: American Forests, 110–112.
Simpson, J.R., et al., 1993. Potential of tree shade for reducingbuilding energy use in the Sacramento valley. USDAForest Service. Davis, CA: Western Center for UrbanForest Research.
Smiley, E.T., et al., 2006. Comparison of structural andnoncompacted soils for trees surrounded by pavement.Arboriculture & Urban Forestry, 32 (4), 164–169.
Smith, W.H., 1978. Urban vegetation and air quality,Proceedings of the National Urban Forestry Conference.ESF Publication 80-003. Syracuse, NY: College ofEnvironmental Science and Forestry, State Universityof New York, 284–305.
Sonstrom, R.S., Clausen, J.C., and Askew, D.R., 2002.Treatment of parking lot stormwater using a StormTreatsystem. Environmental Science and Technology, 36 (20),4441–4446.
Swaid, H. and Hoffman, M.E., 1989. The Prediction ofImpervious Ground Surface-Temperature by the SurfaceThermal Time Constant (STTC) Model. Energy andBuildings, 13 (2), 149–157.
Taha, H., Akbari, H., and Rosenfeld, A., 1991. Heat islandand oasis effects of vegetative canopies: micro-meteorlo-gical field measurements. Theoretical and Applied Clima-tology, 44 (2), 123–138.
Thompson, A.M., Paul, A.C., and Balster, N.J., 2008.Physical and hydraulic properties of engineered soilmedia for bioretention basins. Transactions of the Asabe,51 (2), 499–514.
USEPA, 1983a. Results of the Nationwide Urban RunoffProgram. Washington, DC: Water Planning Division[U.S. Environmental Protection Agency: U.S. G.P.O.,1982–1983].
USEPA, 1983b. Results of the Nationwide Urban RunoffProgram. Washington, DC: Water Planning Division[U.S. Environmental Protection Agency: U.S. G.P.O.,1982–1983].
252 Q. Xiao and E.G. McPherson
Dow
nloa
ded
by [
Uni
vers
ity o
f C
alif
orni
a D
avis
] at
09:
50 0
8 A
ugus
t 201
1

USEPA, 1999a. Storm water technology fact sheet. Washing-ton, Vegetation Seales, p. 7.
USEPA, 1999b. Storm water technology fact sheet: sandfilters. Washington, DC: Office of Water, US.
USEPA, 2002. Urban stormwater BMP performance monitor-ing. Washington, DC: USEPA, 248.
USEPA, 2004. Best Management practices (BMP) EPAguidelines. Washington DC: USEPA.
USEPA, 2005. National management measures to controlnonpoint source pollution from urban areas. Washington,DC: Office of Water, 518.
Vyslouzilova, M., et al., 2003. As, Cd, Pb and Zn uptake bySalix spp. clones grown in soils enriched by high loads ofthese elements. Plant Soil and Environment, 49 (5), 191–196.
Wang, W., Schnoor, J.L., and Doi, J., 1996. Volatile organiccompounds in the environment. West Conshohocken, PA:ASTM.
Wong, T.H.F., et al., 2006. Modelling urban stormwatertreatment - A unified approach. Ecological Engineering,27 (1), 58–70.
Xiao, Q. and McPherson, E.G., 2008. Urban RunoffPollutants Removal of Three Engineered Soils. Davis,CA: Western Center for Urban Forest Research, 33.
Xiao, Q., McPherson, G., and Jiang, A., 2006. PollutantRemoval and Runoff Storage Testing of Three Engi-neered Soils, The 4th Biennial CALFED Science Con-ference: Making Sense of Complexity: Science for aChanging Environment, October 23–25, 2006, Sacra-mento, CA.
Xiao, Q.F., et al., 2000a. A new approach to modeling treerainfall interception. Journal of Geophysical Research-Atmospheres, 105 (D23), 29173–29188.
Xiao, Q.F., et al., 2000b. Winter rainfall interception by twomature open-grown trees in Davis, California. Hydro-logical Processes, 14 (4), 763–784.
Urban Water Journal 253
Dow
nloa
ded
by [
Uni
vers
ity o
f C
alif
orni
a D
avis
] at
09:
50 0
8 A
ugus
t 201
1