performance of biometric sample quality measures
TRANSCRIPT

Performance of Biometric Sample Quality Measures
Definition, Utility, and Performance
Patrick Grother + Elham Tabassi National Institute of Standards and Technology
[email protected] AAAS, St Louis, February 20, 2006

Quality is Just a Scalar!
Black Box Quality
Apparatus
80
19
30
[email protected] AAAS, St Louis, February 20, 2006
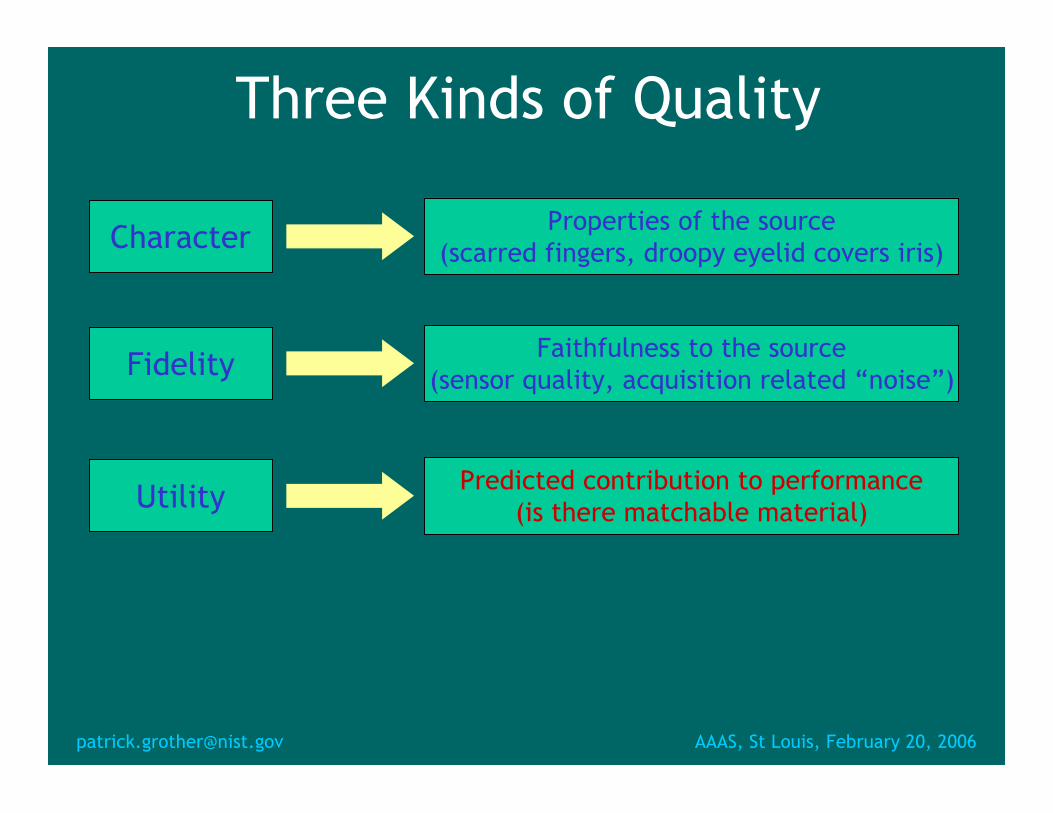
Three Kinds of Quality
Character
Fidelity
Utility
Properties of the source (scarred fingers, droopy eyelid covers iris)
Faithfulness to the source sensor quality, acquisition related “noise”) (
Predicted contribution to performance (is there matchable material)
[email protected] AAAS, St Louis, February 20, 2006

AAAS, St Louis, February 20, 2006 [email protected]
Fingerprint Quality
Q = 4Q = 2
1 2 3 4 5
BAD GOOD

feature NFIQneural
NIST Fingerprint Image QualityNIST Fingerprint Image Quality
Quality number
{1,2,3,4,5}
feature extraction: computes image content and fidelity characteristics and results in an eleven dimensional feature vector. neural network: classifies feature vectors into five classes of quality based on various quantiles of the normalized match score distribution.
[email protected] AAAS, St Louis, February 20, 2006
extraction network

Uses of Quality Numbers
□ Conditional reacquisition – Acceptance for enrollment
• For credential issuance (visa, passport, access card, PIV) – Acceptance for verification
• Of the samples just captured which one to send for matching? • Or acquire still more?
– Acceptance for identification • Is the subject offering a poor sample deliberately?
□ Initiate invocation of special processing or matchingalgorithms
□ Quality directed fusion □ Quality Monitoring
– Are some biometric field locations giving low quality? – Only in the evening?
[email protected] AAAS, St Louis, February 20, 2006

Quality Values vs. Defect Bits □ Quality is a summary of bad (or good) traits □ But defect detection is more specific
– Is the fingerprint image smudged? – Is the face image non-frontal? – Is the eyelid three-quarter closed?
□ Knowledge of defect allows – Instruction to user
[email protected] AAAS, St Louis, February 20, 2006

Matching Involves Two Samples
When Q1 and Q2 are both high the matching score is high.
Furthermore function is monotonic … BUT
when the enrollment sample is of good quality and better than that of the verification sample, the search sample’s quality is sufficient to predict performance.
[email protected] AAAS, St Louis, February 20, 2006

Why Quality as a Performance Predictor is Difficult
Authentication Score, S = F(Sample1, Sample2)
Quality value, Q1 = Q(Sample1)
Quality value, Q2 = Q(Sample2)
Score Estimate, E = P(Q1, Q2)
[email protected] AAAS, St Louis, February 20, 2006
=1
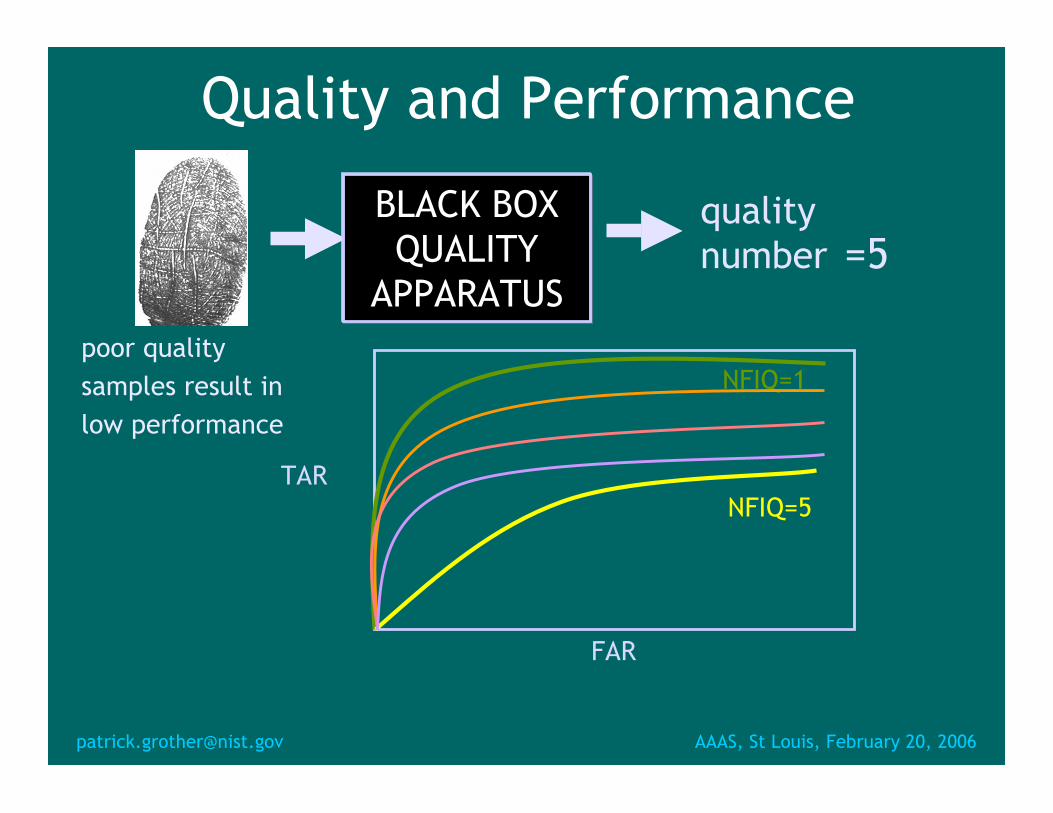
Quality and Performance
BLACK BOX QUALITY
APPARATUS
quality number =5
pexocoer lqleunatl iqty ualityssaammpplleess rreessuulltt iinn hloiw gh p peerrffoorrmmaanncce e
TAR
NFIQ=1
NFIQ=5
FAR
[email protected] AAAS, St Louis, February 20, 2006

DET Curves □ Testing Case A
– Enrol samples of quality X – Attempt authentication with samples of quality X
□ Testing Case B – Enrol samples with quality ≥ X – Attempt authentication with samples of any quality
[email protected] AAAS, St Louis, February 20, 2006

False Match rate
Fals
eN
on-m
atch
Rate
AAAS, St Louis, February 20, 2006 [email protected]
Case A vs B
Q1 = Q2 = XQ1 >= X Q2 unconstrained
False Match rate
Fals
e N
on-m
atch
Rat
e

Quality vs. False Non-match Rate
Quality Value
Fals
e N
on-m
atch
Rat
e □ Increasing quality gives
lower false rejection rates
□ Statistically distinct levels of performance – Five levels, not twenty
[email protected] AAAS, St Louis, February 20, 2006

Error vs. Reject Metric □ Match two samples, get score S □ Compute quality of enrollment sample, Q1 □ Compute quality of authentication sample, Q2 □ Compute Q = min(Q1, Q2) □ Compute FNMR at some reasonable threshold t □ Sort (Q, S) on Q in decreasing order of quality □ Discard fraction x of lowest quality pairs □ Recompute FNMR □ Plot FNMR(x)
[email protected] AAAS, St Louis, February 20, 2006

Evaluation of a Quality Measure
Fals
e N
on-m
atch
Rat
e
Fraction Rejected
5%
5%
Existing quality measures are NOT perfect predictors of the worst case matching scores.
[email protected] AAAS, St Louis, February 20, 2006


Conclusions □ Biometric quality assessment is an operationally
important □ Quality assessment is difficult □ Relatively under-researched □ Quality measures can be evaluated if they’re
supposed to predict performance – In large scale matching trials
□ Primary target should be false non-match rate □ Quality can usefully be represented as an integer
– More statistically separable levels are better □ Quality measures likely to perform better if they
reflect sensitivities of the matcher □ Matcher dependence is OK
[email protected] AAAS, St Louis, February 20, 2006


Quality Development cf. Pharmacology! Patient Biometric System
Drug (given to patient) Sample (given to system)
Efficacy (will it work) Performance (will it match)
Clinical trial Biometric test
Low quality samples produce false acceptances and duplicate enrollments (poisons the matcher)
Toxicity(poisons the patient)
Drug discovery(molecular targets)
Discover failure modes and sensitivities of the matcher
Goal is to tailor drugs and to narrow clinical trials
Goal is to only collect samples suitedto matcher
Combination therapy ≥ 2 samples involved in matching
Discovery methods follow decades of therapeutic use
Image quality and failure analysis followyears using images in biometric systems
s
[email protected] AAAS, St Louis, February 20, 2006

NIST Biometric Quality Workshop
March 8-9 NIST Gaithersburg Maryland
http://www.itl.nist.gov/iad/894.03/quality/workshop/
[email protected] AAAS, St Louis, February 20, 2006

NIST Biometric Quality Workshop Applications
What are the use-cases, business-cases and economics? Are there applications beyond sample re-acquisition, quality assurance and survey, detection of evasion, and fusion?
Capabilities Can quality measurements adequately select the best sample from a stream? Can real-time measurements of quality be used to reduce FTE and FTA? What can be achieved by sensor design alone?
Standardization Does conformance to existing data format standards guarantee quality? Would standard quality corpora be useful? Or standard reference algorithms?
Modalities What methods exist for assessment of face, finger, iris and speech quality? To what extent does good design guarantee quality? Does multimodal, multi-sample, or multi-sensor acquisition solve quality problems?
Evaluation Should quality be predictive of recognition performance, and evaluated as such?
Research and Development What research is being done? Is the amount of research commensurate with its operational importance? Should research funding go into quality-by-design? Quality measurement? Or both?
[email protected] AAAS, St Louis, February 20, 2006

Quality is not about Human Perception
Quality depends how close you look
[email protected] AAAS, St Louis, February 20, 2006

The Core Biometric Function
Genuinematched with = 0.87 Comparison
Impostormatched with = 0.03 comparison
[email protected] AAAS, St Louis, February 20, 2006