performance of agriculture insurance …ageconsearch.umn.edu/bitstream/9245/1/sp07bh01.pdf ·...
TRANSCRIPT

PERFORMANCE OF AGRICULTURE INSURANCE SCHEMES IN INDIA
V.B. BHISE1, S.S. AMBHORE2, and S.H. JAGDALE3 1Professor of Economics
Dr. Babasaheb Ambedkar Marathwada University; Aurungabad [email protected]
2Reader in Economics, Pandit Nehru College, Aurangabad
3Principal, Karmaveer Mamasaheb Jagdale College, Washi Dist. Osmanabad
Paper prepared for presentation at the 101st EAAE Seminar ‘Management of Climate Risks in Agriculture’, Berlin, Germany, July 5-6, 2007
Copyright 2007 by V.B. Bhise, S.S. Ambhore and S.H. Jagdale. All rights reserved. Readers may make verbatim copies of this document for non-commercial purposes by any means, provided that this copyright notice appears on all such copies.
1

PERFORMANCE OF AGRICULTURE INSURANCE SCHEMES IN INDIA
V.B. Bhise, S.S. Ambhore and S.H. Jagdale
Introduction Weather is an important production factor in agriculture. Weather includes
rainfall, temperature, humidity and other natural hazards such as floods, droughts,
hailstorms, pest attacks and diseases etc. This factor is beyond the control of a farmer
and therefore creates weather risks which are the main source of uncertainty in
agriculture. The uncertainty of crop yields is one of the basic risks that every farmer
has to face. The experiences of the past few decades have proved that no state is
immune to natural calamities, no matter what the state of preparedness is. Natural
hazards affect 1.42 million ha. crop area annually, 40 million hectares of landmass is
prone to floods, and 68 percent of the total area is vulnerable to periodical droughts
(Sarkar and Sarma, 2006). Natural calamities and adverse seasonal conditions are
grossly impacting the level of agricultural productivity. In India, the volatility of
weather and the occurrence of extreme weather events has increased. This leads to
destabilization of farm incomes in developing countries like India. Crop failure can
lead to economic downfall and make it difficult for a farmer to repay existing loans
(Srijit Mishra, 2006). The worst affected are the small farmers, as they are more
vulnerable to crop losses and prices fall. They find it extremely difficult to pay back
the loans they have incurred to grow crops and survive (S. Mohankumar and R.K.
Sharma, 2006). According to official statistics, there were 8,900 suicides by farmers
between 2001 to 2006 in the four states of India (viz., Andhra Pradesh, Karnataka,
Kerala and Maharashtra) (K.C. Suri, 2006).
2

After the implementation of AOA and liberalization, prices of agricultural
commodities are determined increasingly by market forces and therefore, fluctuating
demand and supply of agricultural commodities is expected to result in high price risk
for agri-business. In the case of agricultural commodities, supply variability is
generally high as production in a large geographical area could be affected by natural
factors such as weather and incidence of pests and diseases. To help manage price
risks, the central government has been encouraging revival of futures trading, which
was initiated in India as early as 1921. But the Indian futures markets for agricultural
commodities are yet to develop fully as efficient mechanisms of risk management.
They are still not congenial markets for hedgers (Naik and Jain, 2002).
Sixty five percent of Indian agriculture is heavily dependent on natural factors,
particularly rainfall. Studies have established that rainfall variations account for more
than 50 percent of variability in crop yields. Crop losses can be reimbursed through
proper weather risk management. Risk management should address yield, price,
credit, income or weather related uncertainties among others. Management of
weather risks deserves top priority in the government agenda. Several risk
management tools such as agriculture insurance, calamity relief funds, minimum
support prices etc. are available. Contract farming is now getting momentum as tool
of price risk management in case of some exportable crops/commercial crops.
Agricultural insurance exists in many countries as an institutional response to nature
induced risk.
In India agriculture insurance is one of the instruments protecting farmers
from agricultural variability. Agriculture instance is an important risk management
tool that has the potential to provide financial security to the person engaged in
agriculture and allied activities. For coping with natural risks, agriculture insurance is
3

the only mechanism available. It is an important instrument that protects agriculturists
against uncertainties of crop production that are beyond their control. In a country like
India, where crop production has been subjected to vagaries of weather and large
scale damage due to attack of pests and diseases, agriculture insurance assumes a vital
role in the stable growth of the agriculture sector.
In India, attention has been paid towards weather risk management in
agriculture mainly through introducing agriculture insurance schemes. It has become
a regular feature since 1985 during which Comprehensive Crop Insurance Scheme
was started. This was later on replaced by National Agriculture Insurance Scheme
(NAIS) in 1999. The NAIS was introduced on a large scale (in terms of crops and
area covered) to provide insurance coverage to farmers against weather risk. It is,
therefore, essential to evaluate the performance of crop insurance scheme in India and
point out problems in its implementation. It is necessary to think on the schemes that
are supplementary to this scheme. Can the rainfall and income insurance schemes
introduced on a pilot basis be the good substitutes to crop insurance? This paper
attempts to explain these issues. So the main focus of this paper is on discussing the
role of agriculture insurance schemes in protecting farmers from agricultural
variability.
This paper is presented in five sections. Section I gives a brief historical
review of agriculture insurance schemes in India. Section II describes the operation
of National Agriculture Insurance Scheme in India and Maharashtra state. Section III
evaluates the rainfall insurance scheme introduced on pilot basis. Section IV
evaluates income insurance scheme introduced on pilot basis. Section V gives the
main conclusions of the present study and also makes some suggestions with regard to
agriculture insurance in India.
4

Section I
Historical Review of Agriculture Insurance in India:
Credit for pioneering work on crop insurance in India goes to S. Chakravarti,
who in 1920, proposed an agricultural insurance scheme based mainly on the rainfall
approach. The data on which the scheme was based pertained to the then Mysore
state, though the scheme had an all-India perspective. This scheme consisted of a
package that included insurance of buildings, granaries and agricultural implements;
cattle insurance and insurance of crops (Vyas and Singh, 2006).
The issue of introduction of a crop insurance scheme was taken up soon after
the Indian independence in 1947. Ministry of Food and Agriculture gave an assurance
in the central legislature to introduce crop and cattle insurance in the country and a
special study was commissioned in 1947-48. Both ‘individual approach’ and
‘homogeneous area approach’ as the basis for implementation of crop insurance were
studied in detail. It was realized that the ‘individual approach’ indemnifies the farmer
to the full extent of the losses and the premium to be paid by him is determined with
reference to his own past yield data and loss experience. This approach necessitates
reliable and accurate data of crop yields of individual farmers for a sufficiently long
period, for fixation of premium on actuarially sound basis. The ‘homogenous area
approach’ envisages that a homogeneous area comprising villages that are
homogeneous from the point of view of crop production and whose annual variability
of crop production would be similar, would form the basic unit. The study reported in
favour of ‘homogeneous area approach’ even as various agro-climatically
homogenous areas treated as a single unit and the individual farmers in such cases pay
the same rate of premium and receive the same benefits, irrespective of their
5

individual fortunes. The Ministry of Agriculture circulated the scheme for adoption
by the state governments, but unfortunately the states did not accept.
Later in 1965, the government introduced a crop insurance bill and circulated a
Model Scheme of Crop Insurance on compulsory basis to constituent state
governments for their views. The bill provided for the central government framing a
reinsurance scheme to cover indemnity obligations of the states. However, none of
the states was in favour of the scheme because of very high financial obligations. On
receiving the reactions of the state governments, the subject was considered in detail
by the Expert Committee headed by the then Chairman, Agricultural Prices
Commission in July, 1970 for full examination of the economic, administrative,
financial and actuarial implications of the subject. This Committee, headed by
Dharam Narain, submitted its report in August 1971. This committee in its report
concluded that it would not be advisable to introduce crop insurance in near future,
even on a pilot basis (Sidharth Sinha, 2004). But thereafter, different experiments on
crop insurance on a limited, ad-hoc and scatter scale were started from 1972-73.
In 1972-73, the General Insurance Department of Life Insurance Corporation
of India introduced a crop insurance scheme for H-4 cotton. In 1972, general
insurance business was nationalized and, by the Act of Parliament, the General
Insurance Corporation of India (GIC) was set up. The new Corporation took over the
experimental scheme in respect of H-4 cotton. This scheme was based on ‘individual
approach’ and later included groundnut, wheat and potato and implemented in the
states of Gujarat, Maharashtra, Tamil Nadu, Andhra Pradesh, Karnataka and West
Bengal. This scheme continued upto 1978-79 and covered only 3110 farmers for a
premium of Rs. 4.54 lakhs against claims of Rs. 37.88 lakhs.
6

An All-Risk Comprehensive Crop Insurance Scheme (CCIS) for major crops
was introduced in April, 1985, coinciding with the introduction of the Seventh Five
Year Plan. This scheme was optional for the state governments. It was linked to short
term credit and implemented on ‘homogeneous area approach’ as the basis. 15 states
and 2 union territories implemented the scheme until kharif 1999. The states where
the scheme was introduced were Andhra Pradesh, Assam, Bihar, Goa, Gujarat,
Himachal Pradesh, Karnataka, Kerala, Madhya Pradesh, Maharashtra, Meghalaya,
Orissa, Tamil Nadu, Tripura, West Bengal, Pondicherry and Andaman and Nicobar
Islands. The states of Rajasthan, Uttar Pradesh, Jammu and Kashmir, Manipur, and
Delhi initially joined the scheme but subsequently opted out after few years due to
financial obligations. But Rajasthan (Kharif 2003) and Haryana (Kharif 2004) have
rejoined the scheme. The most agriculturally developed Punjab State did not
participate in the scheme. This scheme covered farmers availing crop loans from
financial institutions for growing food crops and oilseeds on compulsory basis. The
coverage was restricted to 100 percent of crop loan subject to a maximum of Rs.
10,000 per farmer. The premium rates were 2 percent for cereals and millets and 1
percent for pulses and oilseeds. 50 percent of the premium payable by small and
marginal farmers was subsidized by central and state governments. Premiums and
claims were shared by central and state governments in 2:1 ratio. Additional coverage
was also provided later up to 150 percent of crop loan. The coverage particulars of
this scheme until kharif 1999 since inception were as follows: This scheme covered
7,62,65,438 farmers and 12,75,70,282 hectares of area. The sum insured was Rs.
24,949 crores. The claims amounted to Rs. 2303.45 crores against premium of Rs.
403.56 crores. Thus the claims to premium ratio was 1:5.71.
7

While, CCIS was still being implemented, attempts were made to modify the
existing CCIS from time to time as demanded by the states. During 1997, a new
scheme, namely, Experimental Crop Insurance Scheme (ECIS) was introduced during
1997-98 season which was implemented in 14 districts of five states. This scheme
was similar to CCIS, except that it was meant only for all small / marginal farmers
with 100 percent subsidy in premium. The central and state government shared the
premium subsidy and claims in 4:1 ratio. The scheme was discontinued after one
season due to its many administrative and financial difficulties. It covered 4,54,555
farmers for a sum insured of Rs. 168.11 crores and claims paid were Rs. 37.80 crores
against a premium of Rs. 2.84 crores. The CCIS scheme was subsequently replaced
by the national agricultural insurance scheme (NAIS) with effect from 1999-2000.
Section II
Performance of NAIS in India:
Agriculture Insurance Company of India (AIC) Limited has been formed by
the Government of India to subserve the needs of farmers better and to move towards
a sustainable actuarial regime. AIC has taken over the implementation of NAIS which
until financial year 2003 was implemented by General Insurance Corporation of India.
Its authorized share capital was Rs. 1500 crores and the public insurance companies
and NABARD are the share holding agencies. The AIC aims at to provide financial
security to persons engaged in agriculture and allied activities through insurance
products. The main aim of the NAIS is to protect the farmers against losses suffered
by them due to crop failure on account of natural calamities, such as droughts, flood,
hailstorm, cyclone, fire, pest diseases etc. The NAIS scheme envisages coverage of all
the food crops, oilseeds and annual commercial and horticultural crops of which past
8

yield data is available for adequate number of years. The scheme is being
implemented by the 21 states and 2 union territories.
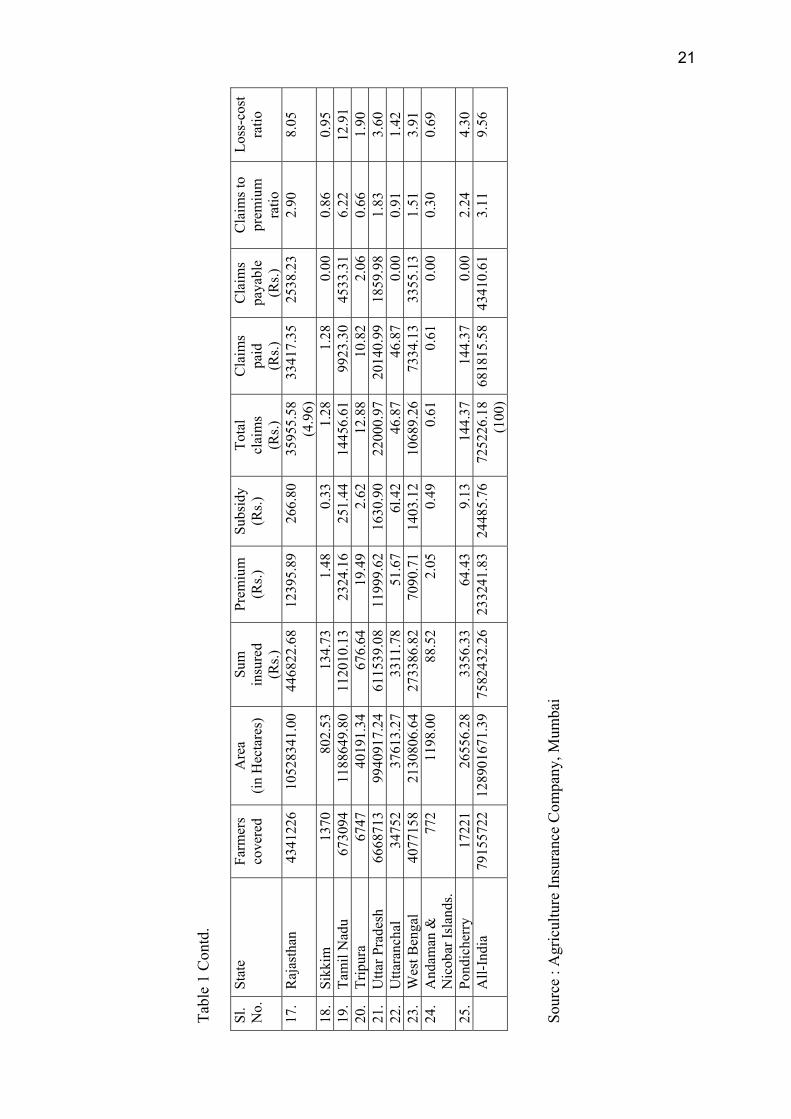
The data on the performance of NAIS at all-India level for thirteen seasons
cumulative totals (rabi 1999-2000 to rabi 2005-06) are presented in table 1. This table
indicates that the claims to premium ratio was 3.11 in India. A study by Sinha
covering seven seasons cumulative totals had shown that the claims to premium ratio
was 1:4.27. It means that the ratio has declined for a longer period. The claims to
premium ratio has been very high in case of Jharkhand (12.59), Bihar (11.49), Tamil
Nadu (6.22), Karnataka (4.86) and Himachal Pradesh (4.21). It was below one in the
states of Assam, Goa, Haryana, Jammu and Kashmir, Meghalaya, Sikkim, Tripura,
Uttaranchal and Andaman and Nicobar islands. It is also seen that Gujarat accounts
for 26.89 percent of total claims, followed by Andhra Pradesh (16.35 percent),
Karnataka (13.45 percent) and Maharashtra (10.58 percent). There are five states with
a loss-cost ratio of 10 percent or more. Eight out of 25 states / UTS had a loss-cost
ratio of below 2 percent and another 2 states had a ratio of 2 to 4 percent. A recent
NSSO report (2005) reports a coverage of 4 percent of the farmers under the crop
insurance scheme. Further, only in three states, Andhra Pradesh, Madhya Pradesh and
Maharashtra, 10 percent or more of the farmers had the benefit of crop insurance over
the whole period. The top five states that availed the bulk of the subsidy are Andhra
Pradesh, Maharashtra, Gujarat, Orissa and Uttar Pradesh. The dominating crops
covered under this scheme were summer paddy, wheat and groundnut and recently
gram.
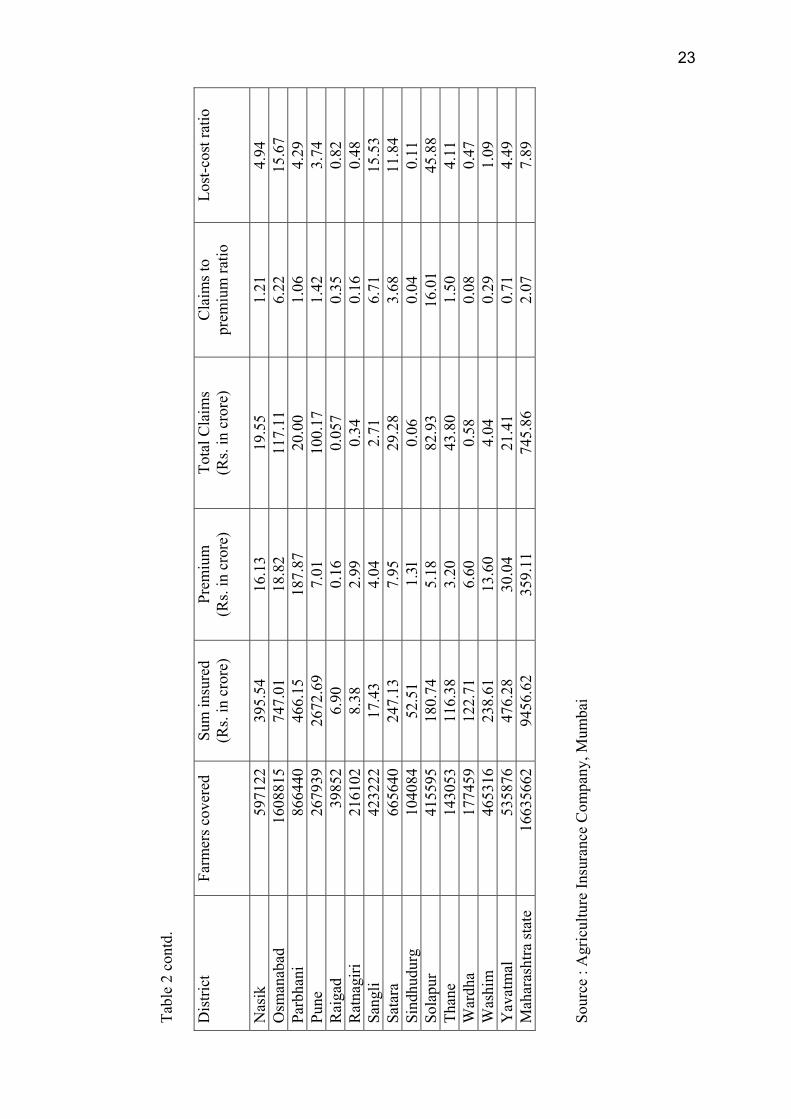
The districtwise data on the performance of crop insurance scheme in
Maharashtra for 14 seasons cumulative totals (rabi 2000 to rabi 2006) are presented in
table 2. The data shows that the claims to premium ratio was 2.07 at the Maharashtra
9

state level. There were four districts (Solapur, Sangli, Osmanabad and Ahmednagar)
where the claims to premium ratio was higher than 5. Further, there were 16 districts
(out of 33 districts) where this ratio was less than unity. In another 8 districts, the
ratio ranged between 1 and 2. The four districts where the claims to premium ratio
was higher than 5, accounted for 42.27 percent of all the claims. The loss-cost ratio
(claims as percent of sum insured) was 7.89 at the Maharashtra state level. It was 10
or higher in six districts (Solapur, Osmanabad, Sangli, Ahmednagar, Latur and
Satara). There were five districts (Bhandara, Raigad, Ratnagiri, Sindhdurg and
Wardha) where the lost-cost ratio was below one.
The cropwise cumulative data on crop insurance scheme in Maharashtra State
(1999-2005) given in table 3 shows that the claims to premium ratio was 10 percent or
higher in case of Bengal gram (16.71) and wheat (10.24) only. It was below one in
case of cotton (0.35) and between 1 and 2 in case of groundnut, nigerseed, onion,
sesamum and redgram. The data indicates that wheat and Bengal gram together
account for 11.23 percent of all the claims.
Problems in Crop Insurance Scheme:
The claim payments are delayed in many states due to the delays in the
payments by the State governments. However, there are some states, namely,
Himachal Pradesh, Jharkhand, Maharashtra, Orissa, Uttaranchal and the union
territories of Pondicherry and Andaman and Nicobar islands, where the payment of
claims was made promptly. Delays in payment of claims was significant in the states
of Andhra Pradesh, Bihar, Rajasthan, Tamil Nadu, Uttar Pradesh and West Bengal.
This problem can be handled in two ways. First, the premium rates should be charged
on actuarial basis so that the claims to premium ratio may decline and the AIC would
find it more easier to disburse the amount of claim. But this may reduce the
10

affordability of small and marginal farmers to insurance coverage. Second, the AIC
may maintain a reserve fund for the operation of agriculture insurance schemes. The
budgetary provision for crop insurance by the states will also help in solving the
problem of delay in claims payment.
Crop insurance should be kept as a separate programme. Further, it should
cover all foodgrains and small farmers. At present the notified areas are up to either
taluka or district or block level. In order to cover localized perils like hailstorm,
landslides etc. the state government is required to notify smaller defined areas such as
a village for various crops. The state government is expected to furnish the final yield
data in the standard format for all unit areas for notified crops for the crop season to
implementing agency within the stipulated time/date. The yield data are generated
through the crop cutting experiments conducted in villages by the revenue officer. The
problems such as delay in the timely availability of yield data and time lag between
crop cutting experiments and release of official figures are observed. The present
system of using three or five year moving average results in significant estimation
errors in yield and hence threshold yields ought to be based on long-term yield data.
Deshpande’s survey study (2005) has shown that the scheme of crop insurance is not
popular with the farmers and almost 57 percent do not know that such schemes exist.
Hence implementing agencies and Nodal bank are expected to create awareness
among farming community about the crop insurance. It is suggested that to make
NAIS financially viable actuarial rates should be charged and they may be different in
different states as the uncertainty varies from state to state. The policy sales closing be
set at between four and six weeks prior to planting. These dates need to be different
in different regions / states.
11
Section III
Rainfall Insurance:
Nearly two-thirds of Indian agriculture is heavily dependent on natural factors,
particularly rainfall. Studies have indicated that rainfall variation accounts for more
than 50 percent of variability in crop yields. It is known that yields are variable,
however it is now being realized that the weather, particularly rainfall is also
becoming increasingly unpredictable and uncertain. Although there is no way of
controlling weather factors, there is now a hope of mitigating the adverse financial
effects that rainfall can have on the farm incomes. Agriculture Insurance Company
(AIC) of India has introduced Rainfall Insurance Scheme on pilot basis in select areas
of the country. This scheme was initially introduced in 27 districts of four states from
the rabi 2004 season. Later on it was extended to 142 districts in ten states. It was
introduced in 10 districts of Andhra Pradesh, 8 districts of Gujarat, 26 districts of
Maharashtra, 31 districts of MP, 19 districts of Karnataka, 11 districts of Orissa, 8
districts of Tamil Nadu, 21 districts of Uttar Pradesh and 4 districts each of
Chattisgarh and Uttaranchal.
AIC has been providing the following three options under this insurance
scheme.
Option I : Seasonal Rainfall Insurance
Option II : Rainfall Distribution Index
Option III : Sowing Failure
Rainfall insurance covers anticipated shortfall in yield on account of deficit
rainfall. It is voluntary for all classes of farmers who stand to lose financially upon
adverse incidence of rainfall can take insurance under this scheme. This scheme is
implemented through the existing network of rural financial institutions, particularly
12
cooperative sector institutions. The cultivators proposed for insurance under this
scheme is required to have bank account at the rural finance institution. A cultivator
can buy this insurance only up to 15th June for sowing failure option and 30th June for
other options.
Though the AIC has offered three different options under rainfall insurance
scheme, the state government of Maharashtra has accepted only two options i.e.
seasonal rainfall insurance and sowing failure, for its implementation through the
District Central Cooperative Banks from kharif 2005 season. Aurangabad district of
the Maharashtra state has been chosen for the case study of rainfall insurance scheme
for the kharif 2005 season. The notified areas for rainfall insurance scheme in this
district are Aurangabad, Phulambri, Khultabad and Gangapur talukas which are
located around the Chikalthana IMD station (notified rain-gauge station). The crops
notified were green gram, tur, soyabean, bajra and kharif jowar. The farmers cannot
insure a crop under more than one scheme. The indemnity period varied from crop to
crop. The pay structure is devised in such a way that the yield is correlated to various
ranges of adverse deviation in rainfall in case of option I preferred by all farmers in
Aurangabad district. The results of this case study are summarized below:
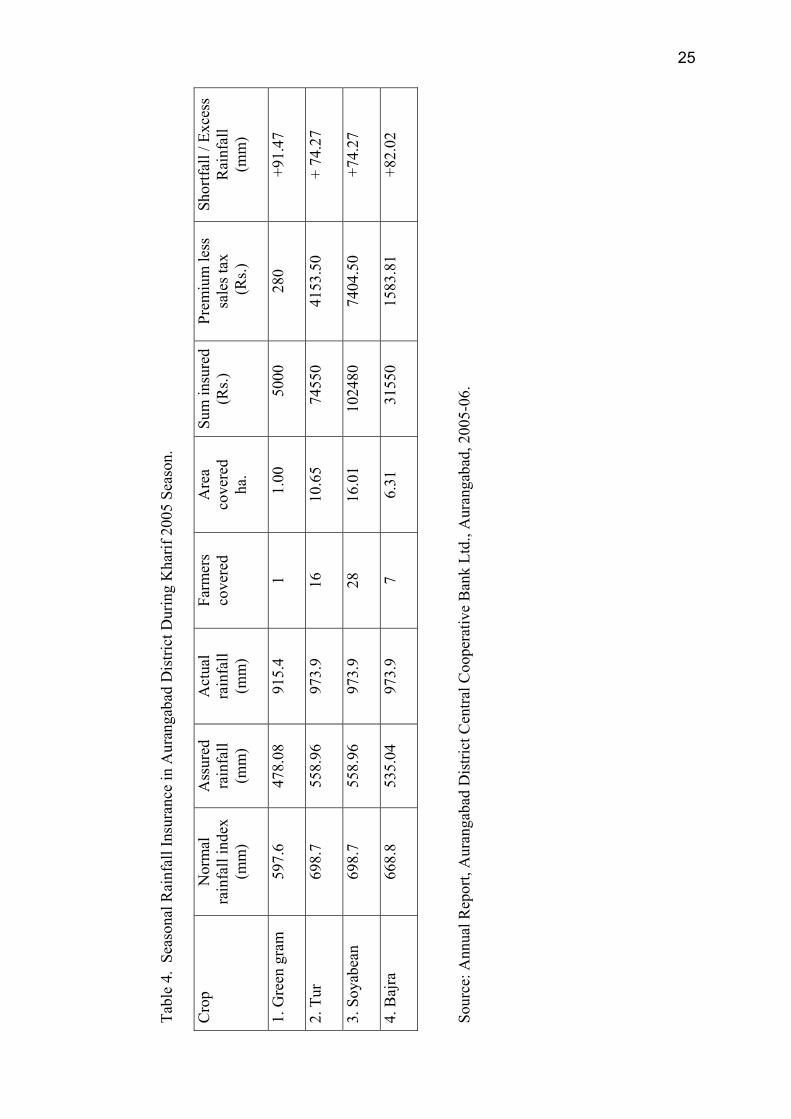
The number of farmers participated in the scheme was 44 during the kharif
2005 season. Further, all the farmer participants had opted for seasonal rainfall
insurance only. The crops for which this type of insurance taken were green gram,
bajra, tur and soyabean. Except one, all the insurers were small and marginal farmers.
They were from Aurangabad and Gangapur talukas (notified areas) and none was
from the remaining two notified areas (Phulambri and Khultabad). The sum insured
per hectare varied between Rs. 5000 in case of green gram and bajra to Rs. 7000 for
tur during kharif 2005 season. The farmers have paid premium at actuarial rates and
13
also paid service tax at the rate of 12.24 percent on the amount of premium. There
was no subsidy in premium. Premium rates varied between 5 percent in case of green
gram to a little over 7 percent for soyabean under the seasonal rainfall insurance
option. The indemnity was payable if the deficit in actuarial rainfall is 20 percent and
beyond under this option. The indemnity period was from 1 June to 30 November in
case of tur and soyabean and 1 June to 30 September for green gram and June 1 to
October 31 for bajra. Area covered under this scheme was 10.65 ha in case of tur,
16.01 ha. for soybean, 6.31 ha for bajra and 1 ha in case of green gram. Out of 44
participating farmers, 28 had taken insurance for soyabean and 16 farmers had insured
tur crop. 7 farmers had taken insurance for bajra crop.
Monsoon rains of 2005 has proved its unpredictableness and erratic nature, as
these notified areas (Chikalthana IMD station) had received excess rains during the
kharif 2005 season. The rainfall during this season for the predetermined insurance
period had exceeded the assured rainfall of that period in case of all the four crops in
Aurangabad district, hence indemnity claims were not payable.
On the basis of the design of the scheme by the AIC and the results of the case
study (in Aurangabad district) allows us to point out the following drawbacks of the
rainfall insurance scheme (Option I).
This scheme does not cover rabi, summer and annual crops. To be more
specific, this scheme is meant for kharif crops grown during the rainy season. The
rainfall registered at the notified IMD station do not represent all the areas notified
(talukas) in that district but indemnity claims are based on the rainfall at the single
notified IMD station, which needs correction. The rainfall insurance scheme does not
cover risks arising out of other weather factors such as pest attacks and diseases,
hailstorms and floods. The study indicated that most of the farmers participated in
14
this scheme are small and marginal and they paid premium at actuarial rates and also
borne the burden of service tax on amount of premium. At least they can be waived
from the service tax. Monsoon rains of 2005 have again proved the need of different
types of rainfall insurance covers i.e. catastrophic cover and excess rainfall cover and
rainfall distribution cover. The AIC is of course thinking to introduce such additional
rainfall covers to the farmers, and to implement this scheme at tehsil level. The case
study also indicated that the indemnity period in case of soyabean and green gram is
faulty. It should be June-August in case of green gram and June-September for
soyabean.
Section IV
Farm Income Insurance Scheme (FIIS):
Farm income insurance scheme was introduced by the AIC as pilot project
with the following objectives. This scheme aims at to provide support to farmers in
the event of loss of income from adverse incidence of crop yield (on account of
natural calamities, pests and diseases) and market price fluctuations. Further, it aims
to encourage the farmers to adopt prudent and progressive farming practices, both in
terms of agricultural technology and market economies. This scheme enhances food
and livelihood security of the farming community and help stabilize farm incomes,
particularly in disaster years.
The scheme was introduced in few districts of selected states. However, it is
being implemented only in those states which gave their consent thereto. At present
this scheme is confined to rice and wheat. This scheme is compulsory for loanee
farmers and voluntary for non-loanee farmers. The scheme provides ‘comprehensive
risk insurance’ against loss in farm income (short fall in actual income over
guaranteed income in a notified area arising out of adverse fluctuations in yield due to
15
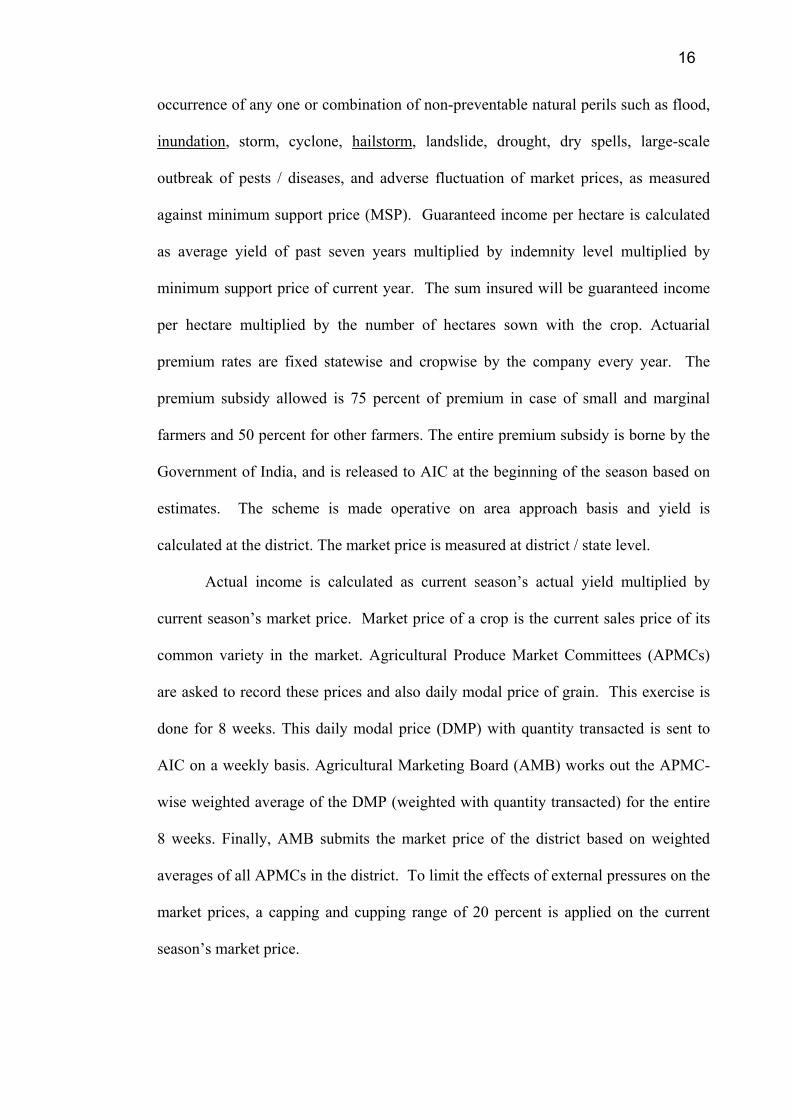
occurrence of any one or combination of non-preventable natural perils such as flood,
inundation, storm, cyclone, hailstorm, landslide, drought, dry spells, large-scale
outbreak of pests / diseases, and adverse fluctuation of market prices, as measured
against minimum support price (MSP). Guaranteed income per hectare is calculated
as average yield of past seven years multiplied by indemnity level multiplied by
minimum support price of current year. The sum insured will be guaranteed income
per hectare multiplied by the number of hectares sown with the crop. Actuarial
premium rates are fixed statewise and cropwise by the company every year. The
premium subsidy allowed is 75 percent of premium in case of small and marginal
farmers and 50 percent for other farmers. The entire premium subsidy is borne by the
Government of India, and is released to AIC at the beginning of the season based on
estimates. The scheme is made operative on area approach basis and yield is
calculated at the district. The market price is measured at district / state level.
Actual income is calculated as current season’s actual yield multiplied by
current season’s market price. Market price of a crop is the current sales price of its
common variety in the market. Agricultural Produce Market Committees (APMCs)
are asked to record these prices and also daily modal price of grain. This exercise is
done for 8 weeks. This daily modal price (DMP) with quantity transacted is sent to
AIC on a weekly basis. Agricultural Marketing Board (AMB) works out the APMC-
wise weighted average of the DMP (weighted with quantity transacted) for the entire
8 weeks. Finally, AMB submits the market price of the district based on weighted
averages of all APMCs in the district. To limit the effects of external pressures on the
market prices, a capping and cupping range of 20 percent is applied on the current
season’s market price.
16
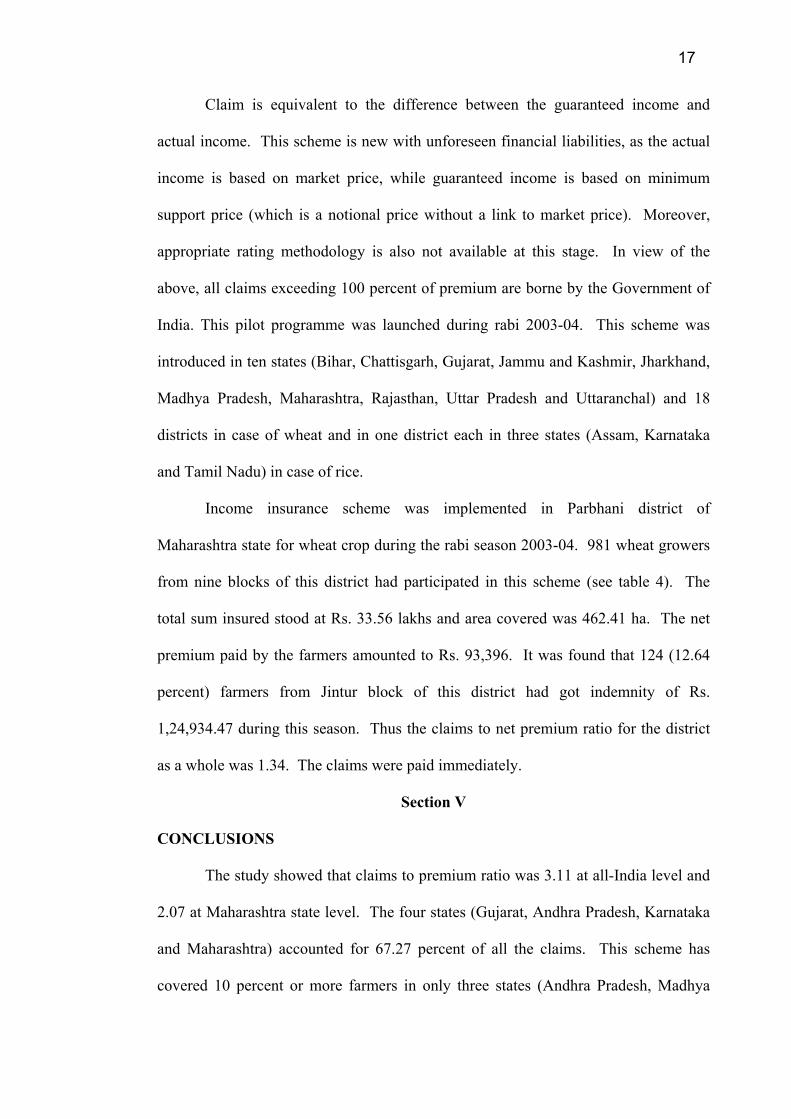
Claim is equivalent to the difference between the guaranteed income and
actual income. This scheme is new with unforeseen financial liabilities, as the actual
income is based on market price, while guaranteed income is based on minimum
support price (which is a notional price without a link to market price). Moreover,
appropriate rating methodology is also not available at this stage. In view of the
above, all claims exceeding 100 percent of premium are borne by the Government of
India. This pilot programme was launched during rabi 2003-04. This scheme was
introduced in ten states (Bihar, Chattisgarh, Gujarat, Jammu and Kashmir, Jharkhand,
Madhya Pradesh, Maharashtra, Rajasthan, Uttar Pradesh and Uttaranchal) and 18
districts in case of wheat and in one district each in three states (Assam, Karnataka
and Tamil Nadu) in case of rice.
Income insurance scheme was implemented in Parbhani district of
Maharashtra state for wheat crop during the rabi season 2003-04. 981 wheat growers
from nine blocks of this district had participated in this scheme (see table 4). The
total sum insured stood at Rs. 33.56 lakhs and area covered was 462.41 ha. The net
premium paid by the farmers amounted to Rs. 93,396. It was found that 124 (12.64
percent) farmers from Jintur block of this district had got indemnity of Rs.
1,24,934.47 during this season. Thus the claims to net premium ratio for the district
as a whole was 1.34. The claims were paid immediately.
Section V
CONCLUSIONS
The study showed that claims to premium ratio was 3.11 at all-India level and
2.07 at Maharashtra state level. The four states (Gujarat, Andhra Pradesh, Karnataka
and Maharashtra) accounted for 67.27 percent of all the claims. This scheme has
covered 10 percent or more farmers in only three states (Andhra Pradesh, Madhya
17

Pradesh and Maharashtra). The dominating crops covered under this scheme were
paddy, wheat, groundnut and recently gram. Loss-cost ratio was 9.56 at all-India
level and 7.89 at Maharashtra state level. It was 10 percent or higher in six districts
(Solapur, Osmanabad, Sangli, Ahmednagar, Latur and Satara). The four districts
where claims to premium ratio was higher than five, accounted for 42.27 percent of
all the claims. Wheat and Bengal gram were the main crops accounting for 11.23
percent of all the claims. A case study of rainfall insurance scheme revealed that
rainfall during insurance period had exceeded the assured rainfall of that period in
case of all the four crops in Aurangabad district, hence indemnity claims were not
payable. Income insurance scheme for wheat in Parbhani district was well received
by the farmers and claims to premium ratio was 1.34.
On the basis of our study it can be suggested that there is need of a transition
to actuarial rates. The implementing financial agencies may be compelled to share
risk with the government. There is need of increasing the accuracy and timeliness of
crop estimation methods. The problems in rainfall insurance scheme need to be
urgently attended.
REFERENCE
1. Gopal Naik and Sudhir Kumar Jain (2002): Indian Agricultural Commodity
Futures Markets – A Performance Survey, EPW, Vol. XXXVII, No. 30, July
27 – August 2.
2. R.S. Deshpande and Nagesh Prabhu (2005): Farmer’s Distress – Proof Beyond
Question, EPW, Vol. XL, Nos. 44 and 45, November 4.
3. NSSO (2005): Some Aspects of Farming, Situation assessment Survey of Farmers,
December.
18

4. Srijit Mishra (2006): Farmers’ suicides in Maharashtra, EPW Vol. XLI, No. 16,
April 22-28.
5. S. Mohankumar and R.K. Sharma (2006): Analysis of farmer, EPW, Suicides in
Kerala, Vol. XLI, No. 16,m April 22-28.
6. K.C. Suri (2006): Political Economy of Agrarian Distress, EPW, Vol. XLI, No. 16,
April 22-28.
7. V.S. Vyas, Agrarian Distress (2006): Strategies to Protect Vulnerable Sections,
EPW, Vol. XLI, No. 16, April 22-28.
8. Siddharth Sinha (2006): Agriculture Insurance in India: Scope for Participation of
Private Insurance, EPW, Vol. XXXIX, No. 25, June 19-25.
9. Subrahdipta Sarkar and Archana Sarma (2006): Disaster Management Act, 2005 –
A Disaster in Waiting? EPW, Vol. XLI, No. 35, September 2-8.
10. Vyas., V.S. and Singh Surjit (2006): Crop Insurance in India – Scope for
Improvement, EPW, Vol. XLI, No. 4 & 5, November 4-10.
19

Tabl
e 1.
Sta
tew
ise
Tota
l for
13
Seas
ons,
Rab
i 199
9-20
00 to
Rab
i 200
5-06
.
Sl.
No.
St
ate
Farm
ers
cove
red
Are
a (in
Hec
tare
s)
Sum
in
sure
d (R
s.)
Prem
ium
(R
s.)
Subs
idy
(Rs.)
To
tal
clai
ms
(Rs.)
Cla
ims
paid
(R
s.)
Cla
ims
paya
ble
(Rs.)
Cla
ims t
o pr
emiu
m
ratio
Loss
-cos
t ra
tio
1.
And
hra
Prad
esh
1216
9257
18
5292
27.1
016
0780
6.56
4438
3.58
6689
.06
1185
43.9
8 (1
6.35
)98
382.
7420
161.
242.
67
7.37
2.
Ass
am
6994
4 52
726.
1260
01.5
414
9.83
24.8
9 12
1.92
111.
0410
.88
0.81
0.
20
3.
Bih
ar
1362
630
1528
948.
4515
6269
.59
3398
.84
551.
05
3904
8.21
(5
.38)
2897
9.61
1006
8.60
11.4
9 24
.99
4.
Cha
ttisg
arh
3490
161
7624
459.
2319
7123
.42
5098
.11
413.
06
1699
1.71
1696
7.13
24.5
83.
33
8.62
5.
G
oa
5214
84
77.6
820
0.86
3.53
1.01
2.
242.
230.
010.
63
1.11
6.
G
ujar
at
6639
321
1622
1732
.67
1169
444.
0851
857.
1636
81.1
5 19
5035
.60
(26.
89)
1947
28.2
7 30
7.33
3.76
16
.68
7.
Har
yana
28
9983
36
2980
.94
2380
0.24
749.
5418
.93
199.
5813
3.35
6t8.
230.
27
0.84
8.
H
imac
hal P
rade
sh
1138
00
7025
7.99
5522
.29
126.
4425
.02
531.
7053
1.70
0.0
4.21
9.
63
9.
Jam
mu
& K
ashm
ir 89
87
1137
2.97
550.
0110
.34
0.75
0.
000.
000.
000.
00
0.0
10.
Jhar
khan
d 99
6059
55
7338
.20
3873
1.22
939.
8172
.85
1182
7.66
1182
7.66
0.00
12.5
9 30
.54
11.
Kar
nata
ka
5858
156
9117
331.
3161
9507
.91
2007
3.13
1495
.24
9755
9.07
(1
3.45
)97
156.
8440
2.23
4.86
15
.75
12.
Ker
ala
2256
54
1916
51.5
825
513.
8353
3.82
129.
56
1445
.28
1421
.27
24.0
12.
71
5.66
13
. M
adhy
a Pr
ades
h 10
3917
19
2808
4752
.87
8215
82.1
714
86.3
914
86.3
9 44
583.
27
(6.1
5)44
544.
4938
.78
1.78
5.
43
14.
Mah
aras
htra
15
3905
83
1623
7977
.98
9074
00.8
232
969.
5336
80.0
7 76
743.
61
(10.
58)
7674
3.61
0.00
2.33
8.
46
15.
Meg
hala
ya
1068
7 12
496.
8198
1.63
61.9
717
.03
28.8
110
.80
18.0
10.
46
2.93
16
. O
rissa
62
8141
4 64
3103
5.39
5506
69.3
813
909.
5926
28.4
8 39
255.
12
(5.4
1)39
255.
120.
002.
82
7.13
20
Tabl
e 1
Con
td.
Sl.
No.
St
ate
Farm
ers
cove
red
Are
a (in
Hec
tare
s)
Sum
in
sure
d (R
s.)
Prem
ium
(R
s.)
Subs
idy
(Rs.)
To
tal
clai
ms
(Rs.)
Cla
ims
paid
(R
s.)
Cla
ims
paya
ble
(Rs.)
Cla
ims t
o pr
emiu
m
ratio
Loss
-cos
t ra
tio
17.
Raj
asth
an
4341
226
1052
8341
.00
4468
22.6
812
395.
8926
6.80
35
955.
58
(4.9
6)33
417.
3525
38.2
32.
90
8.05
18.
Sikk
im
1370
80
2.53
134.
731.
480.
33
1.28
1.28
0.00
0.86
0.
95
19.
Tam
il N
adu
6730
94
1188
649.
8011
2010
.13
2324
.16
251.
44
1445
6.61
9923
.30
4533
.31
6.22
12
.91
20.
Trip
ura
6747
40
191.
3467
6.64
19.4
92.
62
12.8
810
.82
2.06
0.66
1.
90
21.
Utta
r Pra
desh
66
6871
3 99
4091
7.24
6115
39.0
811
999.
6216
30.9
0 22
000.
9720
140.
9918
59.9
81.
83
3.60
22
. U
ttara
ncha
l 34
752
3761
3.27
3311
.78
51.6
76l
.42
46.8
746
.87
0.00
0.91
1.
42
23.
Wes
t Ben
gal
4077
158
2130
806.
6427
3386
.82
7090
.71
1403
.12
1068
9.26
7334
.13
3355
.13
1.51
3.
91
24.
And
aman
&
Nic
obar
Isla
nds.
772
1198
.00
88.5
22.
050.
49
0.61
0.61
0.00
0.30
0.
69
25.
Pond
iche
rry
1722
1 26
556.
2833
56.3
364
.43
9.13
14
4.37
144.
370.
002.
24
4.30
All-
Indi
a 79
1557
22
1289
0167
1.39
7582
432.
2623
3241
.83
2448
5.76
72
5226
.18
(100
)68
1815
.58
4341
0.61
3.11
9.
56
Sour
ce :
Agr
icul
ture
Insu
ranc
e C
ompa
ny, M
umba
i
21

Tabl
e 2.
Dis
trict
wis
e To
tal f
or 1
4 Se
ason
s in
Mah
aras
htra
Sta
te, R
abi 1
999-
2000
to K
harif
200
6.
Dis
trict
Fa
rmer
s cov
ered
Su
m in
sure
d (R
s. in
cro
re)
Prem
ium
(R
s. in
cro
re)
Tota
l Cla
ims
(Rs.
in c
rore
) C
laim
s to
prem
ium
ratio
Lo
st-c
ost r
atio
Ahm
edna
gar
1441
911
582.
56
16.3
0 88
.18
5.41
15
.13
Ako
la
4471
32
263.
75
13.3
4 15
.26
1.14
5.
78
Am
rava
ti 27
8569
17
1.05
9.
06
5.05
0.
55
2.95
A
uran
gaba
d
6560
82
542.
71
16.0
4 39
.37
2.45
7.
25
Bee
d 83
9523
60
4.78
18
.70
17.5
4 0.
93
2.90
B
hand
ara
1242
58
129.
17
3.31
0.
17
0.05
0.
13
Bul
dhan
a 65
8607
35
0.11
17
.52
17.3
7 0.
99
4.96
C
hand
rapu
r 24
4530
25
1.39
9.
14
15.4
3 1.
68
6.13
D
hule
45
2947
26
2.67
14
.28
11.6
1 0.
81
4.41
G
adch
iroli
3771
4 38
9.12
0.
98
2.19
2.
22
5.62
G
ondi
a 15
5495
17
7.49
4.
64
12.0
3 2.
59
6.77
H
ingo
li 45
7556
16
4.20
7.
44
9.38
1.
26
5.71
Ja
lgao
n 50
9378
41
9.02
20
.46
18.5
7 0.
90
4.43
Ja
lna
2355
34
173.
95
7.79
3.
42
0.43
1.
96
Kol
hapu
r 47
89
6.24
1.
00
0.09
0.
87
1.40
La
tur
2628
256
984.
90
32.9
5 12
2.15
3.
70
12.4
0 N
agpu
r 17
5076
17
3.56
6.
21
5.18
0.
83
2.98
N
ande
d 60
1784
47
2.56
20
.76
21.4
6 1.
03
4.54
N
andu
rbar
15
9095
11
2.25
5.
23
4.17
0.
79
3.71
22
Tabl
e 2
cont
d.
Dis
trict
Fa
rmer
s cov
ered
Su
m in
sure
d
(Rs.
in c
rore
) Pr
emiu
m
(Rs.
in c
rore
) To
tal C
laim
s (R
s. in
cro
re)
Cla
ims t
o pr
emiu
m ra
tio
Lost
-cos
t rat
io
Nas
ik
5971
2239
5.54
16
.13
19.5
5 1.
21
4.94
O
sman
abad
16
0881
574
7.01
18
.82
117.
11
6.22
15
.67
Parb
hani
86
6440
466.
15
187.
87
20.0
0 1.
06
4.29
Pu
ne
2679
3926
72.6
9 7.
01
100.
17
1.42
3.
74
Rai
gad
3985
26.
90
0.16
0.
057
0.35
0.
82
Rat
nagi
ri 21
6102
8.38
2.
99
0.34
0.
16
0.48
Sa
ngli
4232
2217
.43
4.04
2.
71
6.71
15
.53
Sata
ra
6656
4024
7.13
7.
95
29.2
8 3.
68
11.8
4 Si
ndhu
durg
10
4084
52.5
1 1.
3l
0.06
0.
04
0.11
So
lapu
r 41
5595
180.
74
5.18
82
.93
16.0
1 45
.88
Than
e 14
3053
116.
38
3.20
43
.80
1.50
4.
11
War
dha
1774
5912
2.71
6.
60
0.58
0.
08
0.47
W
ashi
m
4653
1623
8.61
13
.60
4.04
0.
29
1.09
Y
avat
mal
53
5876
476.
28
30.0
4 21
.41
0.71
4.
49
Mah
aras
htra
stat
e 16
6356
6294
56.6
2 35
9.11
74
5.86
2.
07
7.89
So
urce
: A
gric
ultu
re In
sura
nce
Com
pany
, Mum
bai
23

Tabl
e 3.
Cro
pwis
e To
tals
for 1
4 Se
ason
s in
Mah
aras
htra
, Rab
i 199
9-20
00 to
Kha
rif 2
005-
06.
Cro
ps
Farm
ers
Cov
ered
Su
m in
sure
d (R
s. in
cro
re)
Prem
ium
(R
s. in
cro
re)
Cla
ims
(Rs.
in c
rore
) C
laim
s to
prem
ium
ratio
Lo
st-c
ost r
atio
Baj
ra
1086
323
313.
11
11.6
9 35
.85
3.06
11
.45
Ben
gal g
ram
41
0865
161.
97
3.74
62
.56
16.7
1 38
.62
Bla
ck g
ram
81
7259
258.
87
8.45
49
.00
5.79
18
.93
Cot
ton
2887
535
2331
.11
162.
56
58.1
1 0.
35
2.49
G
reen
gra
m
8346
802.
32
7.26
27
.31
3.76
11
.78
Gro
undn
ut
1577
900
870.
60
30.6
9 36
.90
1.20
4.
23
Jow
ar
2707
783
874.
59
22.1
4 16
3.60
7.
38
18.7
0 M
aize
12
087
2.67
0.
07
0.05
2.
27
5.77
N
iger
19
814
1.55
0.
05
0.11
1.
90
6.95
O
nion
25
4044
2.64
17
.22
18.4
4 1.
07
6.99
O
rang
e 4
0.00
7 0.
001
0 -
- Pa
ddy
1790
018
1203
.87
30.9
4 73
.12
2.36
6.
07
Rag
i 15
390
100.
82
0.26
0.
81
3.08
8.
05
Saff
low
er
1117
8024
.56
0.73
4.
13
5.63
16
.80
Sesa
mum
12
7143
20.1
3 0.
74
1.32
1.
78
6.54
So
yabe
an
1536
232
973.
44
30.4
8 10
0.82
3.
30
10.3
5 Su
garc
ane
1164
164
1754
.00
24.6
5 59
.63
2.41
3.
39
Sunf
low
er
2766
738.
58
0.27
9.
72
3.61
11
.32
Tur
1088
750
376.
04
10.2
7 19
.46
1.89
5.
17
Whe
at
2937
3313
2.25
2.
07
21.1
9 10
.24
16.0
1 So
urce
: A
gric
ultu
re In
sura
nce
Com
pany
, Mum
bai
24
Tabl
e 4.
Sea
sona
l Rai
nfal
l Ins
uran
ce in
Aur
anga
bad
Dis
trict
Dur
ing
Kha
rif 2
005
Seas
on.
Cro
p N
orm
al
rain
fall
inde
x (m
m)
Ass
ured
ra
infa
ll (m
m)
Act
ual
rain
fall
(mm
)
Farm
ers
cove
red
Are
a co
vere
d
ha.
Sum
insu
red
(Rs.)
Pr
emiu
m le
ss
sale
s tax
(R
s.)
Shor
tfall
/ Exc
ess
Rai
nfal
l (m
m)
1.
Gre
en g
ram
59
7.6
478.
08
915.
4 1
1.0
0
500
0 28
0 +9
1.47
2. T
ur
698.
7 55
8.96
97
3.9
16
10.6
5 7
4550
41
53.5
0 +
74.2
7
3. S
oyab
ean
69
8.7
558.
96
973.
9 28
16
.01
1024
80
7404
.50
+74.
27
4. B
ajra
66
8.8
535.
04
973.
9 7
6.31
3
1550
15
83.8
1 +8
2.02
Sour
ce: A
nnua
l Rep
ort,
Aur
anga
bad
Dis
trict
Cen
tral C
oope
rativ
e B
ank
Ltd.
, Aur
anga
bad,
200
5-06
.
25