performance metrics and example applications: orbitrap ... · pdf file500k, full scan, agc 5e4...
TRANSCRIPT
653.78 653.80 653.82 653.84 653.86 653.88 653.90
m/z
0
20
40
60
80
100
0
20
40
60
80
100
0
20
40
60
80
100
Re
lative
Ab
un
da
nce
0
20
40
60
80
100
0
20
40
60
80
100
653.8029R=70741
653.7707R=68199
653.8031R=136928
653.8247R=153121
653.8034R=243449
653.8039R=591659
653.8018R=589119
653.7977R=539419
653.8040R=593824
653.8016R=599008
653.7977R=596861
653.8070R=594065
NL:3.81E5
met_120K_5e4#1652-1668 RT: 8.91-9.00 AV: 17 T: FTMS + p ESI Full ms [150.0000-1000.0000]
NL:2.28E5
met_240k_5e4#920-932 RT: 8.88-9.00 AV: 13 T: FTMS + p ESI Full ms [150.0000-1000.0000]
NL:1.78E5
met_500k_5e4_ic_20ul#493-496 RT: 8.95-9.01 AV: 4 T: FTMS + p ESI Full ms [150.0000-1000.0000]
NL:1.06E5
met_1m_5e4_ic_20ul#247-251 RT: 8.91-9.06 AV: 5 T: FTMS + p ESI Full ms [150.0000-1000.0000]
NL:2.42E2
C 15 H12 I3 NO4 +H: C 15 H13 I3 N1 O4
p (gss, s /p:40) Chrg 1R: 600000 Res .Pwr . @FWHM
500K, Full Scan, AGC 5e4
1M, Full Scan, AGC 5e4
Simulation, 600K
779.690 779.695 779.700 779.705 779.710 779.715
m/z
0
20
40
60
80
100
0
20
40
60
80
100
0
20
40
60
80
100
Re
lative
Ab
un
da
nce
0
20
40
60
80
100
0
20
40
60
80
100
779.7000R=230550
779.7004R=522954
779.6979R=510670
779.6940R=689868
779.7005R=549176
779.6981R=515043
779.6944R=582233
779.7162R=524131
779.7104R=570932
779.7003R=518070
779.6983R=565962
779.6945R=723343
779.7007R=540434
779.6982R=539804
779.6944R=547080
779.7037R=435971
779.7067R=302769
NL:1.61E5
met_500k_5e4_ic_20ul#535-543 RT: 9.72-9.87 AV: 9 T: FTMS + p ESI Full ms [150.0000-1000.0000]
NL:6.35E4
met_1m_tsim#50-54 RT: 9.75-9.89 AV: 5 T: FTMS + p ESI SIM ms [197.0777-781.2000]
NL:3.64E4
met_1m_tsim_1e3#49-54 RT: 9.69-9.86 AV: 6 T: FTMS + p ESI SIM ms [197.0777-781.2000]
NL:1.32E5
met_1M_5e4_IC_20ul#270-272 RT: 9.75-9.82 AV: 3 T: FTMS + p ESI Full ms [150.0000-1000.0000]
NL:2.43E2
C 15 H11 I4 NO4 +H: C 15 H12 I4 N1 O4
p (gss, s /p:40) Chrg 1R: 550000 Res .Pwr . @FWHM
RESULTS
Performance considerations and validation
In FTMS measurements, ion cloud coherence determines the length of time over which useful
measurements can be made. Cloud coherence can be compromised especially for less dense ion
clouds, and this can lead to intensity-dependent decay. This in turn can lead to inaccurate isotope
abundances, as shown below.
ABSTRACT
Purpose: This work surveys key performance problems and their solutions in Orbitrap mass
spectrometry at high resolving powers and presents example applications benefiting from high-
resolution Orbitrap analysis.
Methods: A Thermo Scientific™ Orbitrap Fusion™ Lumos™ Tribrid™ mass spectrometer was modified
by (1) ultra-precisely machined Orbitrap electrodes; and (2) carefully controlled injection conditions.
Results: Improvements in performance enabling routine analysis at resolving power 1,000,000 (at m/z
200), are presented, along with results from applications in metabolomics and lipid fluxomics.
INTRODUCTION Since its commercial introduction in 2005, the Orbitrap mass analyzer has been widely adopted by the
mass spectrometry community. Historically, applications in which Orbitrap analysis has been
particularly useful are those which require high resolving power. For example, in many proteomics
studies, resolution of 60k or 120k (at m/z 200) is more than sufficient to accurately determine the
monoisotopic mass of multiply charged peptides across the mass range of interest. However, some
applications require higher resolutions and until now they remained served only by Fourier Transform
Ion Cyclotron Resonance (FT-ICR) instruments. Here we describe an Orbitrap-based mass
spectrometer capable of dependable and routine analysis at a resolving power of 1M. Performance
criteria are discussed and applications examples are provided.
MATERIALS AND METHODS Samples. For calibration and characterization, a standard calibration solution was used, which
consisted of n-butylamine, caffeine, MRFA, and Ultramark 1621 dissolved in 50:49:1 acetonitrile,
methanol, and formic acid. For the metabolite standards experiment, 24 common metabolites were
mixed at a concentration of 100 pg/µL. 20 µL were then injected on to a Thermo Scientific™ Hypersil
GOLD™ column (100x2.1 mm). Analytes were separated using a 20-min gradient starting at 5% buffer
B (99.9:0.1 acetonitrile:formic acid) and increasing to 35% B (buffer A was 99.9:0.1 water:formic acid),
at a flow rate of 300 µL/min. For the flavonoid and lipid fluxomics work, sample information can be
found in the referenced presentations.
Mass spectrometry. All mass spectrometry was performed on a Orbitrap Fusion Lumos Tribrid mass
spectrometer equipped with the 1M Option (Fig. 1). The 1M Option consists of ultra-precisely machined
high-field Orbitrap electrodes used in combination with a C-trap and injection optics with improved
manufacturing tolerances. The UHV system was baked at a temperature of approximately 120oC until
the base pressure was ≤ 5 × 10-11 torr. Applied voltages were calibrated according to an automated
calibration routine as described below.
B
A
FIGURE 1. Orbitrap Fusion Lumos mass spectrometer equipped with the 1M Option:
(A) high-precision Orbitrap electrodes; (B) C-trap and injection optics with improved
manufacturing tolerances.
C-trap
Lenses
Deflector
The problem described above is worse for longer transients, i.e., high resolving powers. To
ensure quantitative accuracy and adherence to all performance objectives, we employ an
automated calibration routine. This builds upon the routine previously described [1], which
employs a genetic algorithm and tailored scoring in order to navigate the multidimensional
optimization surface that arises in C-trap/Orbitrap calibration.
FIGURE 2. Intensity-dependent signal decay can lead to inaccurate isotopic
abundances for smaller ion clouds (green) relative to larger (red).
time
amp
litu
de
time
amp
litu
de
m/z
m/z
Ideal isotope ratio
Low isotope ratio
Caffeine, m/z 195
A+1
A+2
Avg Rp = 1100197
MRFA, m/z 524
FIGURE 4. With the improvements shown described in methods and with proper
calibration, good results can be obtained as shown above. Each species is quad-
isolated (20 m/z isolation width), AGC target 5e4 ions.
Avg Rp = 654752
A+2
A+3
FIGURE 5. The above results can
be improved slightly by
exercising more control over the
ion population. At right is the
quad-isolated A+2 peak of MRFA,
(isolation width 1 Da), AGC target
2000 ions. With internal
calibration turned on, mass
accuracy is << 1 ppm.
Avg Rp = 650031
Avg S/N = 1647
FIGURE 6. We characterize
the high-resolution
behavior of the C-
trap/Orbitrap combination
by finding the signal-to-
noise ratio at which the 18O
and 13C2 peaks start to lose
baseline separation. This
starts when the mass
difference (Δm) between
the two reaches about 1.75
mDa (about 2.5 mDa
theoretical), as the number
of ions in the peak cluster
increases.
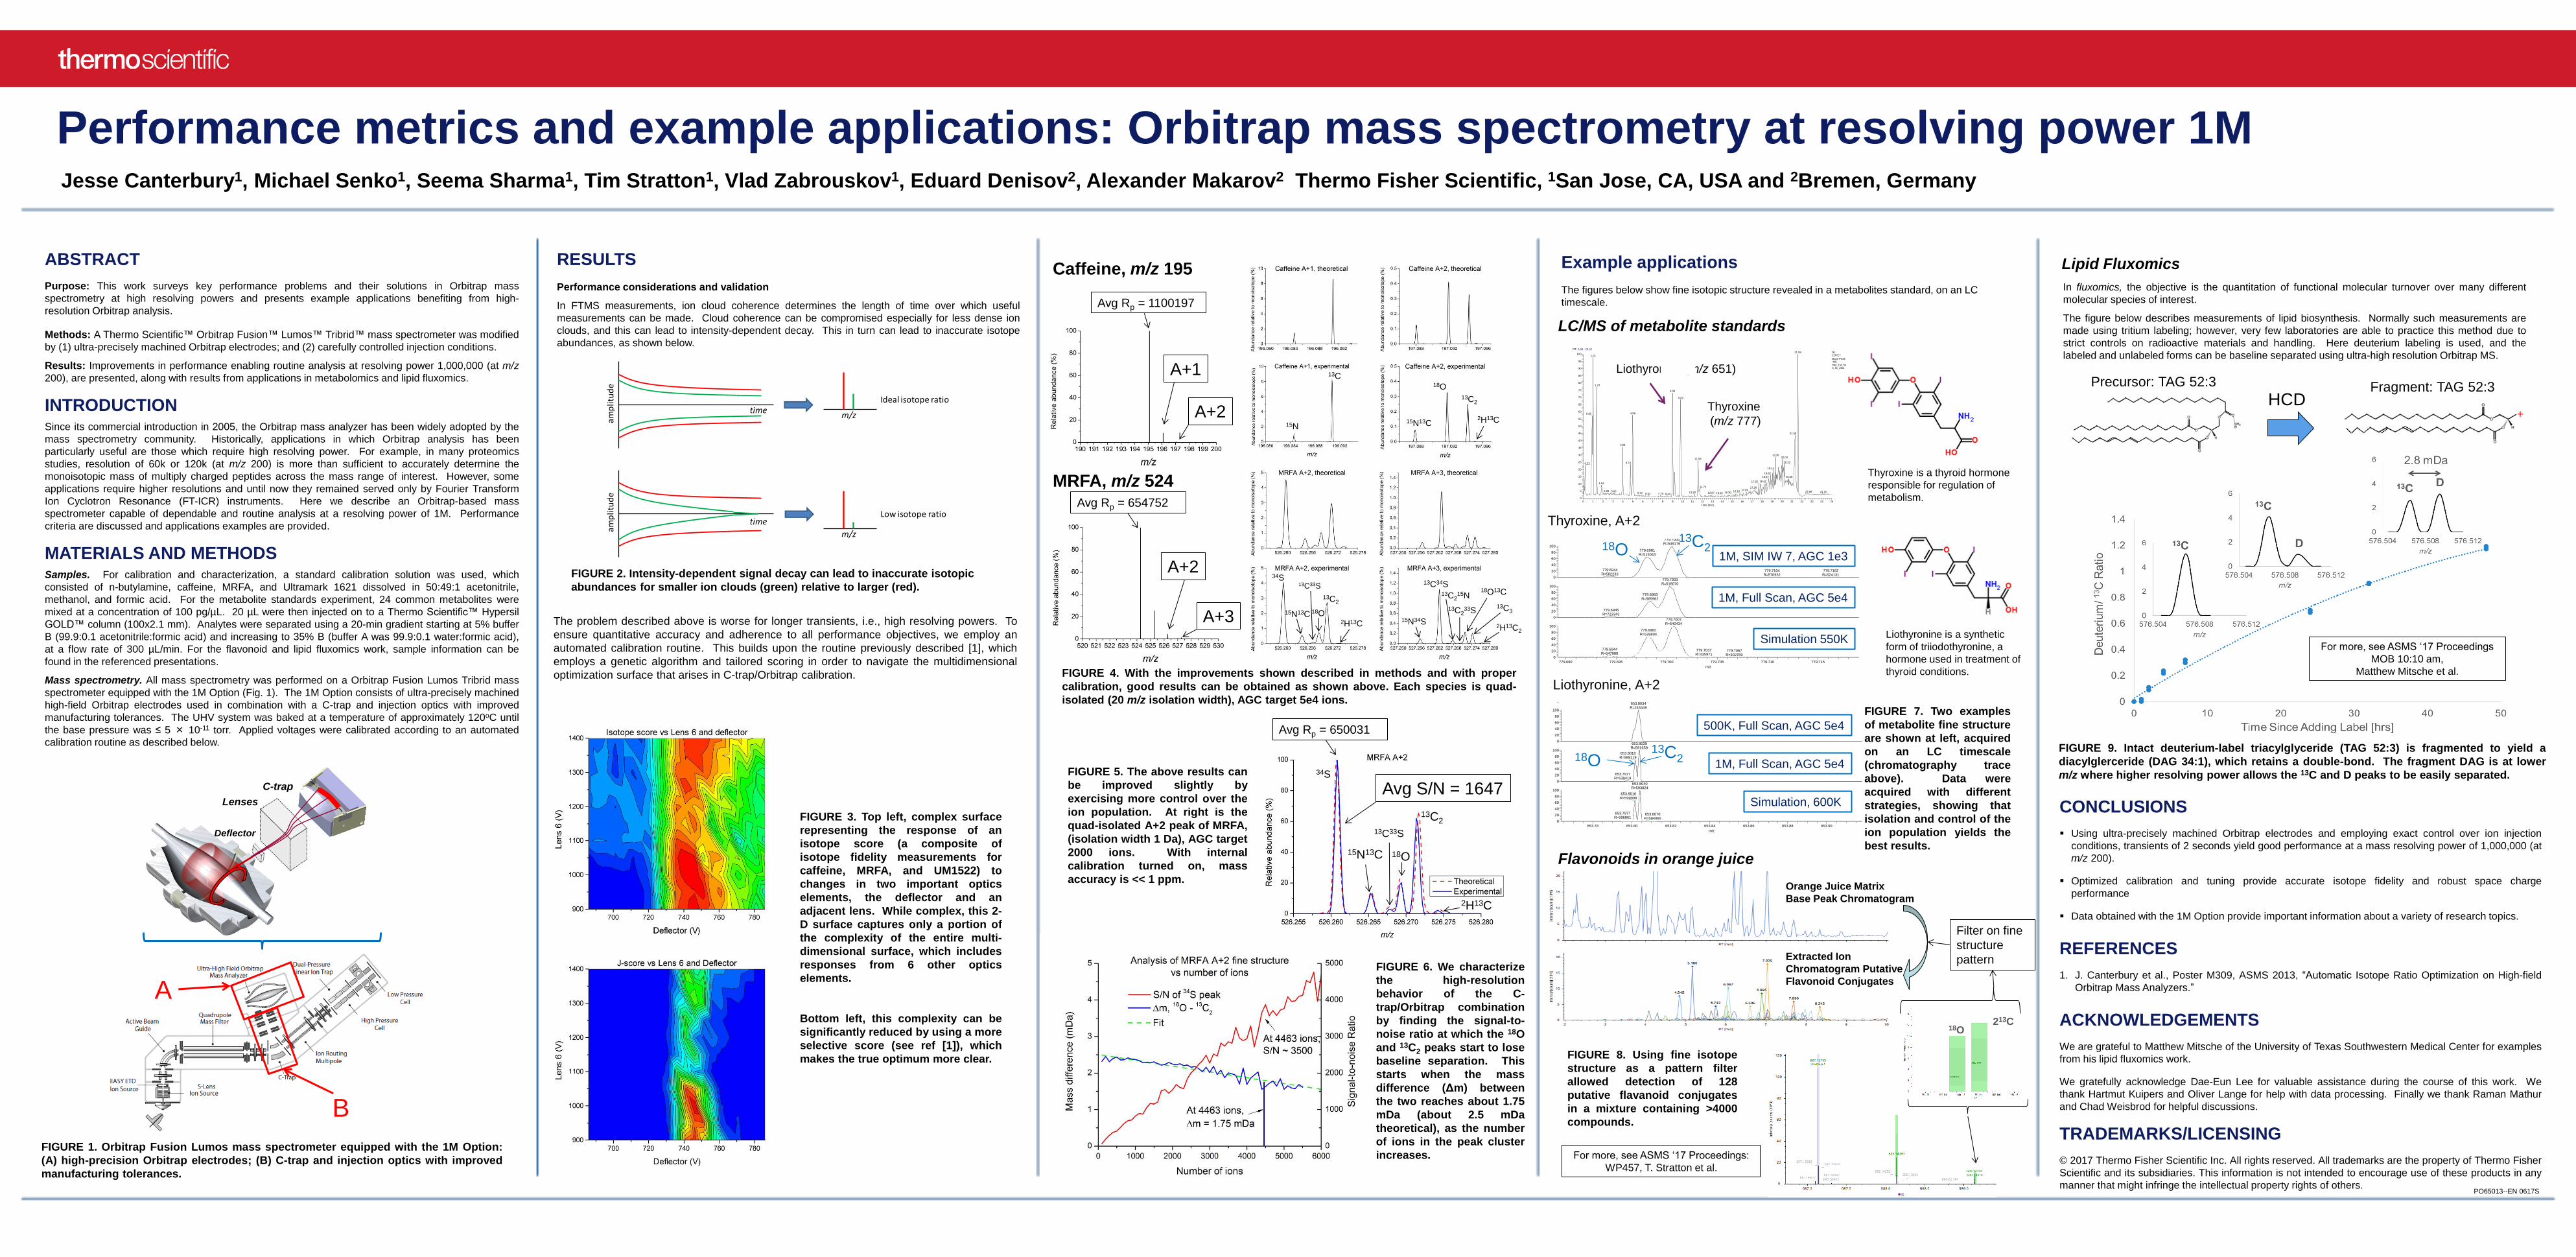
Example applications
The figures below show fine isotopic structure revealed in a metabolites standard, on an LC
timescale.
Liothyronine (m/z 651)
Thyroxine
(m/z 777)
Simulation 550K
1M, SIM IW 7, AGC 1e3
1M, Full Scan, AGC 5e4
Liothyronine, A+2
Orange Juice Matrix
Base Peak Chromatogram
Extracted Ion
Chromatogram Putative
Flavonoid Conjugates
FIGURE 7. Two examples
of metabolite fine structure
are shown at left, acquired
on an LC timescale
(chromatography trace
above). Data were
acquired with different
strategies, showing that
isolation and control of the
ion population yields the
best results.
Thyroxine, A+2
Liothyronine is a synthetic
form of triiodothyronine, a
hormone used in treatment of
thyroid conditions.
LC/MS of metabolite standards
Flavonoids in orange juice
18O 213C
Filter on fine
structure
pattern
FIGURE 8. Using fine isotope
structure as a pattern filter
allowed detection of 128
putative flavanoid conjugates
in a mixture containing >4000
compounds.
For more, see ASMS ‘17 Proceedings:
WP457, T. Stratton et al.
Lipid Fluxomics
In fluxomics, the objective is the quantitation of functional molecular turnover over many different
molecular species of interest.
The figure below describes measurements of lipid biosynthesis. Normally such measurements are
made using tritium labeling; however, very few laboratories are able to practice this method due to
strict controls on radioactive materials and handling. Here deuterium labeling is used, and the
labeled and unlabeled forms can be baseline separated using ultra-high resolution Orbitrap MS.
Precursor: TAG 52:3 Fragment: TAG 52:3 HCD
FIGURE 9. Intact deuterium-label triacylglyceride (TAG 52:3) is fragmented to yield a
diacylglerceride (DAG 34:1), which retains a double-bond. The fragment DAG is at lower
m/z where higher resolving power allows the 13C and D peaks to be easily separated.
CONCLUSIONS
Using ultra-precisely machined Orbitrap electrodes and employing exact control over ion injection
conditions, transients of 2 seconds yield good performance at a mass resolving power of 1,000,000 (at
m/z 200).
Optimized calibration and tuning provide accurate isotope fidelity and robust space charge
performance
Data obtained with the 1M Option provide important information about a variety of research topics.
REFERENCES
1. J. Canterbury et al., Poster M309, ASMS 2013, “Automatic Isotope Ratio Optimization on High-field
Orbitrap Mass Analyzers.”
ACKNOWLEDGEMENTS
We are grateful to Matthew Mitsche of the University of Texas Southwestern Medical Center for examples
from his lipid fluxomics work.
We gratefully acknowledge Dae-Eun Lee for valuable assistance during the course of this work. We
thank Hartmut Kuipers and Oliver Lange for help with data processing. Finally we thank Raman Mathur
and Chad Weisbrod for helpful discussions.
TRADEMARKS/LICENSING
© 2017 Thermo Fisher Scientific Inc. All rights reserved. All trademarks are the property of Thermo Fisher
Scientific and its subsidiaries. This information is not intended to encourage use of these products in any
manner that might infringe the intellectual property rights of others.
For more, see ASMS ‘17 Proceedings
MOB 10:10 am,
Matthew Mitsche et al.
FIGURE 3. Top left, complex surface
representing the response of an
isotope score (a composite of
isotope fidelity measurements for
caffeine, MRFA, and UM1522) to
changes in two important optics
elements, the deflector and an
adjacent lens. While complex, this 2-
D surface captures only a portion of
the complexity of the entire multi-
dimensional surface, which includes
responses from 6 other optics
elements.
Bottom left, this complexity can be
significantly reduced by using a more
selective score (see ref [1]), which
makes the true optimum more clear.
Thyroxine is a thyroid hormone
responsible for regulation of
metabolism.
18O 13C2
18O 13C2
13C
15N
13C2
18O
15N13C 2H13C
15N34S
13C34S 13C2
15N
13C233S
18O13C
13C3
2H13C2
34S
15N13C
13C33S
18O
13C2
2H13C
RT: 0.00 - 25.02
0 1 2 3 4 5 6 7 8 9 10 11 12 13 14 15 16 17 18 19 20 21 22 23 24 25
Time (min)
0
5
10
15
20
25
30
35
40
45
50
55
60
65
70
75
80
85
90
95
100
Re
lative
Ab
un
da
nce
21.59
1.01
1.37
8.99
9.82
4.990.90
21.30
3.98
19.3620.04
11.56
20.224.740.22
19.14
18.82
20.5818.67
18.4217.661.84
11.71 17.2617.01
2.28 16.103.00 22.68 24.1611.20 15.3012.87 13.925.72 6.52 7.79 8.44
NL:2.97E7
Base Peak MS met_1M_5e4_IC_20ul
34S
13C33S
18O
13C2
2H13C
15N13C
Jesse Canterbury1, Michael Senko1, Seema Sharma1, Tim Stratton1, Vlad Zabrouskov1, Eduard Denisov2, Alexander Makarov2 Thermo Fisher Scientific, 1San Jose, CA, USA and 2Bremen, Germany
Performance metrics and example applications: Orbitrap mass spectrometry at resolving power 1M
PO65013--EN 0617S