performance measures key results and measures annual report · performance measures key results and...
TRANSCRIPT

P E R F O R M A N C E M E A S U R E S
K E Y R E S U L T S A N D M E A S U R E S
A N N U A L RE P O R T
September, 2012
Prepared by State Court Administrator’s Office
Court Services Division, Research & Evaluation

2
TABLE OF CONTENTS
Executive Summary ............................................................................................................................................... 5
Analysis Notes ............................................................................................................................................................. 6
Definition of Terms ................................................................................................................................................... 7
Positive Performance Measure Results By Goal ........................................................................................... 8
Possible Areas of Concern .................................................................................................................................... 11
Using Performance Measures for Administration ..................................................................................... 12
Figure 1.1: Example of Age of Pending Stoplight Report Results .............................................. 13
Access to Justice ..................................................................................................................................................... 14
Access and Fairness Survey ................................................................................................................................. 14
Timeliness ................................................................................................................................................................. 15
Clearance Rates ........................................................................................................................................................ 15
Figure 2.1: Statewide Clearance Rates 2008-2011 ......................................................................... 15
Figure 2.2: 2011 Overall Clearance Rates by District ..................................................................... 15
Figure 2.3: Statewide Clearance Rates 2007-2011 – By Case Group ....................................... 16
Figure 2.4: Statewide Active Pending Caseload, Major Cases 2007- 2011 ............................ 17
Time To Disposition ............................................................................................................................................... 18
Figure 2.5: Statewide Time to Disposition Cases Disposed in MNCIS in 2011 .................... 18
Figure 2.6: Time To Disposition 2011 By Case Group By District ............................................. 19
Figure 2.7: Percent of Cases Disposed Statewide Beyond 99th Percentile 2007- 2011 by Case Category .................................................................................................................................................. 20
Figure 2.8: 5th Degree Assault Cases Time to Disposition 2011 by District .......................... 20
Figure 2.9: Other Gross Misdemeanor Case Dispositions Beyond the 99th Percentile Objective 2011 by County .......................................................................................................................... 21
Figure 2.10: Percent Cases Disposed With Jury Trial Beyond 99th Percentile 2011 ......... 22
Figure 2.11: Statewide Percent Cases Disposed in MNCIS Beyond 99th Percentile by Disposition Activity Type - 2007-2011 ................................................................................................ 22
Age of Pending Cases .............................................................................................................................................. 23
Figure 2.12: Statewide Age of Pending (MNCIS Cases) As Of 6/30/2012 ............................. 23
Figure 2.13: Age of Pending Beyond 99th Percentile All Case Types ........................................ 23
Figure 2.14: Other Non-Traffic Cases Pending Beyond 99th Percentile (9 months) By District (as of 6/30/2012) ......................................................................................................................... 24
Figure 2.15: Percent of Other Non-Traffic Cases Pending Beyond 99th Percentile (9 months) By County (As of 6-30-2012) ................................................................................................. 25
Backlog Index ............................................................................................................................................................ 26

3
Figure 2.16: Backlog Index by Case Type Statewide 2007-2011 ............................................. 27
Figure 2.17: 2011 Backlog Index for Minor Criminal Cases By District ................................. 27
Length of Time to Permanency .......................................................................................................................... 28
Figure 2.18: Length of Time for Children to Reach Permanency in 2011 by District ....... 29
Figure 2.19: Length of Time for Children with TPR or Non-TPR Permanency Case to Reach Permanency, Statewide, 2008 to 2011 ................................................................................................. 29
Figure 2.20: Length of Time To Permanency Statewide 2011 CHIPS Cases By Perm Type30
Court of Appeals Dispositions Within Time Standards ............................................................................ 31
Figure 2.21: Percent of Court of Appeals Cases Disposed Within 290 Days of Filing ....... 31
Figure 2.22: Percent of Court of Appeals Cases Disposed Within 365 Days of Filing ....... 32
Supreme Court Dispositions Within Time Standards ............................................................................... 33
Figure 2.23: Number of Days Elapsed at 50th Percentile of Supreme Court Cases ’07-‘1133
Figure 2.24: Number of Days Elapsed at 90th Percentile of Supreme Court Cases ’07- ‘1134
Integrity and Accountability ........................................................................................................................... 35
Data Quality Program............................................................................................................................................. 35
Excellence .................................................................................................................................................................. 37
Access and Fairness Survey ................................................................................................................................. 37
Fairness and Equity ............................................................................................................................................. 38
Access and Fairness Survey ................................................................................................................................. 38
Jury Pools .................................................................................................................................................................... 39
Figure 5.1: 2011 Juror Racial Comparison with 2010 American Community Survey Estimates ........................................................................................................................................................... 39
Figure 5.2: Comparison of 2011 Jurors’ Gender to Census Results .......................................... 40
Quality Court Workplace Environment .................................................................................................... 41
Separation Rates ...................................................................................................................................................... 41
Figure 6.1: Separation Rates for FY2012 ............................................................................................. 41
Figure 6.2: Total Separation Rates by District for FY08 to FY12 ............................................... 42
Figure 6.3: Statewide Separation Rates by Type for FY08 to FY12 .......................................... 42
Quality Court Workplace Survey Results ....................................................................................................... 43
Using Performance Measures for Administration .............................................................................. 44
District/Appellate Courts Review of Results ............................................................................................... 44
Figure 7.1: Example of Time to Disposition Stoplight Report..................................................... 46
Data Details (Appendix) .................................................................................................................................... 47
Judicial Council Policies 505, 505a, 505b ............................................................................................ 47
Statewide Clearance Rates For 2011 ..................................................................................................... 53

4
Clearance Rates By District 2007 - 2011.............................................................................................. 55
Time To Disposition Statewide 2011 .................................................................................................... 57
Time To Disposition By District 2011 ................................................................................................... 58
Time To Disposition By Activity Type Statewide 2011.................................................................. 62
Number of Dispositions per County in 2011, Other Gross Misd Cases .................................... 63
Age of Pending Statewide (As of 6-30-12) .......................................................................................... 64
Age of Pending By District (As of 6-30-2012) .................................................................................... 65
Number of Other Non-Traffic Cases Pending and Avg Days Pending ...................................... 75
Backlog Index 2007-2011 Major Case Categories By District ..................................................... 76
Length of Time to Permanency For Children Reaching Permanency in 2011 on CHIPS and Permanency Cases By County ................................................................................................................... 79
Juror Race and Gender By County 2011 ............................................................................................... 80

5
EXECUTIVE SUMMARY
It is the policy of the Minnesota Judicial Branch to establish core performance goals and to monitor key results that measure progress toward meeting these goals in order to ensure accountability of the branch, improve overall operations of the court, and enhance the public’s trust and confidence in the judiciary. The six core judicial branch goals are:
Access to Justice
Timeliness
Integrity and Accountability
Excellence
Fairness and Equity
Quality Court Workplace Environment
This is the fourth annual report that contains results for the Key Results and Measures of Judicial Council Policy 505, 505a and 505b which were passed in October 2005 and revised in 2006, 2009, 2010 and 2011. This report contains current data along with trends, as available.
The contents of this report are organized into four sections –
1. Executive Summary; 2. Review of Key Results and Measures; 3. Using Performance Measures for Administration and 4. Data Details (Appendix).
The executive summary first provides notes about the details of the data and then discusses results that are positive, followed by possible areas of concern and finishes with a brief summary of how performance measure results are being used by court administration. The results in this report present a barometer of the work of the Branch – an overall picture of how the courts are doing at this point in time and over trends in the last several years.

6
ANALYSIS NOTES
The data in this document come from several sources. The results of timing measures for district courts come from MNJAD (Minnesota Judicial Analytical Database, or data warehouse) reports and the data represents both what exists at a point-in-time and trends over the past months and years. Data changes each week as new and updated information is loaded into the data warehouse from MNCIS. All years noted in the timing area represent calendar years, unless otherwise noted. The Trial Court Reports (MNJAD reports) for Clearance Rates, Time to Disposition, Age of Pending Cases and Length of Time to Permanency are available to judges and staff on CourtNet (the intranet of the Minnesota Judicial Branch). The Clearance Rates, Time to Disposition and Age of Pending Cases reports are now available in the original tabular format as well as in the color-coded “stoplight report” format. Readers of this report are encouraged to look at the data in this report as well as seek additional information using the MNJAD and stoplight reports. Also, please review the Rules of Public Access to Records of the Judicial Branch. Court of Appeals and Supreme Court timing information is reported from MACS (Minnesota Appellate Court System case management system) and reflects calendar year figures.
Separation rate data are reported from the Human Resources Division of SCAO and reflect Fiscal Year 2012 and include trends back to FY07. Juror information comes from the jury management system and includes jurors from calendar year 2011 compared to results of the 2010 American Community Survey (replaces the previous long-form census).
Executive Summary

7
DEFINITION OF TERMS
Definitions of measures used in this report include: Timeliness Measures Clearance Rate – Number of dispositions for a specified period of time divided by the number of filings (multiplied times 100). A Clearance Rate of 100% indicates a court is ‘keeping up’ with cases filed. A Clearance Rate under 100% indicates a possible growing backlog. Time to Disposition – Assesses the length of time it takes to process cases compared to the Judicial Council objectives for timely case processing. The measure is reported as a percentage of cases that has met the timing objectives for when 90% of cases should be disposed, at the 97th percentile and at the 99th percentile. Cases disposed beyond the 99th percentile are considered to have not met timing objectives. Age of Pending – Shows the percent of currently pending cases that are within the timing objectives for timely case processing. Data as of the end of each quarter is archived for trend reporting. Cases pending beyond the 99th percentile objective can be considered as one measure of court backlog. Backlog Index – Number of cases of a given case type pending at the beginning of the year, divided by the total number of cases of the given type disposed during that year. The index represents the part of a year it took to dispose of the cases pending at the beginning of the year if no new cases were filed and provides information about a court’s ability to “keep up” with old cases. The goal for Civil (non-criminal) cases is to be at 1.0 or lower. Criminal cases should be below 1.0. Length of Time to Permanency – Assesses whether or not timely permanency decisions are being made for children. Reports the number of children for whom permanency was achieved on a CHIPS or Permanency case, by type of permanency, and the length of time the child was out of home prior to the permanency order/disposition date for time periods of up to 6 months, up to 12 months, 15 months, 18 months, 24 months and over 24 months. The goal is to achieve permanency by 18 months for 99% of all children. Court of Appeals Dispositions within Time Standards – Reports the number and percent of cases with timing objectives that met the objectives of disposing of 75% of cases within 290 days of filing and disposing of 90% of cases within 365 days of filing. Supreme Court Timing Standards – Reports the number of days to accomplish an event for the case that is at the 50% mark of all cases that are placed in numeric order by the number of days to accomplish the event, and at the 90th percentile.
Quality Court Workplace Environment Turnover Rate - Also called Separation Rate. Number of FTEs who leave the branch during the fiscal year divided by the average number of FTEs employed in a location during that fiscal year (multiplied times 100). Rate excludes Judges, Law Clerks, Bar Exam Monitors and Limited/Temporary Appointments.
Executive Summary

8
95.5% 96.6% 99.5% 98.9%
105.2%
90%
95%
100%
105%
110%
2007 2008 2009 2010 2011
Major Civil Clearance Rate
POSITIVE PERFORMANCE MEASURE RESULTS BY GOAL
Access to Justice
The measure for this goal is the Access and Fairness Survey.
The next round of the survey will be conducted in all courts during late 2012 and early 2013 with statewide results available in mid-2013.
Timeliness
This goal area has several measures to determine if courts are handling cases in a timely manner – Clearance Rates, Time to Disposition, Age of Pending Cases, Backlog Index, Length of Time to Permanency, and Court of Appeals and Supreme Court cases within Time Standards.
Except for Dependency/Neglect cases, all case categories had a clearance rate of at least 99% statewide in 2011 (100% means a court disposed of the same number of cases as were filed).
All judicial districts disposed of more Major Civil cases in calendar year 2011 than were filed (Clearance Rate of 100% or higher) and the statewide Clearance Rate has improved by 10% since 2007.
Clearance Rates continue to be strong for Family, Major Criminal, Minor Civil and Juvenile Delinquency cases with rates being 99% or above. Excluding Minor Criminal Cases, the overall clearance rate in 2011 is 100.1%. (Due to the high volume of Minor Criminal cases, including them in statewide totals produces large fluctuations in the overall Clearance Rate.)
Seven of the districts achieved an overall clearance rate in 2011 of 98% or higher for all cases combined (including Minor Criminal) and all districts have overall Clearance Rates over 93%.
The high Clearance Rates combined with mostly flat case filings has caused the number of pending cases to decline. The number of cases pending has decreased from 2007 to 2011 in all major case groups. The largest decline is for Probate/Mental Health cases which had a 76% decrease in number of cases pending from 2007 to 2011.
Executive Summary
3,000
6,000
9,000
12,000
15,000
18,000
21,000
24,000
27,000
2007 2008 2009 2010 2011
Statewide Pending Caseload 2007-2011
Major Crim Major Civil Family
Juvenile Del Dep/Neg Probate/MH

9
Statewide Time to Disposition results in 2011 are near or above the timing objectives for cases being disposed in four of the six case categories that have time objectives. (Time objectives set by the Judicial Council are noted in Policy 505a in the data details section.) Over 98% of Major Civil, Dissolutions with and without Child, Domestic Abuse and Minor Criminal cases were disposed within the 99th percentile objective.
Statewide Time to Disposition results for all case categories remained consistent or improved from 2007 to 2011. The greatest improvements during that timeframe in the percent of cases disposed beyond the 99th percentile time objectives are for Family cases (47% improvement), Delinquency (38%) and Major Criminal (25%).
Eight of ten districts show consistent or improving numbers of cases pending beyond the 99th percentile for all case types combined.
The minimum goal for the Backlog Index is 1.0 for non-criminal cases, and should be below 1.0 for criminal cases (lower numbers are better). All major case groups have a backlog index for 2011 that is at .45 or less. This means that it took less than half a year to dispose of the number of cases that were pending at the beginning of the year. Minor Civil cases have the lowest backlog index in 2011 at .11.
Over one-fifth (21%) of all permanencies reached for children in 2011 were through Trial Home Visit. Of these permanencies, 89% were achieved before the child was out of home for 12 months or less and 97% were done by 18 months. (Objectives are 90% at 12 months and 99% at 18 months).
All Court of Appeals cases, except in the criminal category, met the timing objective of disposing of 75% of cases within 290 days of filing and 90% of cases within 365 days of filing. Overall, 79% of cases disposed in 2011 met the 290 day objective and 95% of cases disposed in 2011 met the 365 day objective.
WCL Case Type
99th Percentile Objective (Months)
2011 % Cases Disposed at
99th Percentile
Major Civil 24 98.2
Dissolutions 24 99.1
Domestic Abuse 4 99.4
Minor Criminal 9 98.3
Total All Cases
97.7
Permanency Type
% of 2011 Per-
manencies
Perm in up to 6
mo
Cum to 12
mo
Cum to 18
mo
Total Child-
ren
Trial Home Visit
21% 31% 89% 97% 671
Executive Summary

10
Integrity and Accountability
The goal in this area is to ensure that the electronic record system is accurate, complete and timely.
The Data Quality program has been operating for five years. A recent successful project of the program was the development and implementation of a process to pass nearly 4,000 records to the Department of Public Safety that had been affected by a Tyler (MNCIS) system defect, requiring little or no local court administration staff resources.
There are now 20 different Court Data Files which are created weekly to help courts identify cases with potential data quality issues. Nearly all of them have been converted to be automated and court staff can subscribe to receive them. Several districts noted the importance of these files in helping them maintain the integrity of the court record.
Excellence
The goal in this area is to achieve excellence in the resolution of cases by making decisions that are fair, reasoned, understandable, and that resolve the controversy at issue.
The next round of the Access and Fairness survey will be conducted during late 2012 and early 2013 with statewide results available in mid-2013.
Fairness and Equity
Measures for this goal area include juror representativeness and statements from the Access and Fairness survey.
Nearly all jurors complete the race information on questionnaires, and those who report to court are similar racially and ethnically compared to the population of the communities in Minnesota.
Quality Court Workplace
This goal area measures Separation Rates and the results of the Quality Court Workplace survey.
Just under 8% (7.7%) of employees left the Branch in 2011 with 85% all of the departures being resignations and retirements.
Discussions regarding conducting the next QCW survey are underway with the Judicial Council. Results will be available before the end of fiscal year 2013.
Race 2010 ACS*
2011 Jurors
White 89.6% 90.2%
Black 3.4% 3.0%
Asian/Pac Island 2.3% 2.4%
Hispanic 2.1% 1.7%
American Indian 1.0% 1.0%
Other & 2+ Races 1.7% 1.8%
Total Statewide 43,629 *American Comm. Survey: Ages 18-70,citizens, not institutionalized, speak English at home or ‘well’ or ‘very well’
Executive Summary

11
3% 4% 4%
5% 5% 5% 6% 6%
7%
19%
0%
4%
8%
12%
16%
20%
2 7 5 9 1 8 6 4 3 10
% C
ases
Bey
on
d 9
9th
P
erce
nti
le
District
Age of Pending Beyond 99th Percentile Other Non-Traffic Minor Crim Cases
POSSIBLE AREAS OF CONCERN
The measures in this section show possible areas of concern, but do not necessarily reflect poor performance.
Timeliness
The greatest area of concern for timely processing of cases continues to be Major Criminal. The most often-mentioned reason for delays is lack of resources: judicial vacancies, public defender shortages and other justice partner staff reductions.
In 2011, 7.3% of Major Criminal cases and 4.8% of Juvenile Delinquency cases were disposed beyond the 99th percentile objective (objective is 12 mos. for Major Criminal, 6 mos. for Juv. Delinquency).
Only 52% of Major Criminal cases are disposed at the 90th percentile objective of four months.
Clearance Rates for Dependency/Neglect cases have declined the last two years. The rate is 95.6% for 2011.
Statewide figures for large volume case categories can mask differences by location and case type. For instance, while the statewide minor criminal cases past the 99th percentile objective is 6%, there are large differences among districts for Age of Pending cases in the Other Non-Traffic case group beyond the 99th percentile (as of 6/30/12) – from 3% up to 19%. The objective is to dispose of 99% of these cases within 9 months.
The Minor Criminal Backlog Index is the highest of all case groups at .45 for 2011 statewide. However, it is above .50 in two districts. The 4th District has the highest backlog index in Minor Criminal and the index for Other Non-Traffic cases is 1.17. This means that the number of cases disposed in 2011 was smaller than the number of these cases that were pending at the beginning of the year. Basically, higher index numbers reflect larger backlogs. (Numbers in Hennepin may reflect methods for counting ViBES case activities that changed in 2010.)
Nearly one-fourth of all children reaching permanency on a CHIPS or Permanency case in 2011 did so after being out of home longer than 12 months (76% reached permanency by 12 months) while 92% reached permanency by 18 months. The goal is that 90% reach permanency by 12 months and 99% by 18 months.
WCL Case Type
99th Percentile Objective (Months)
2011 % Cases Disposed at
99th Percentile
Major Criminal 12 92.7
Juvenile Del. 6 95.2
Total All Cases
97.7
Executive Summary
Cases Pending as of 6/30/12

12
“Our district has one report with a “red light” and this is the Length of Time to Permanency (LOTP) report. … The following is a review of what the District did…to provide better service to…families.”
Cleaned up incorrect data
Judges received results of LOTP report to understand why practice changes were necessary
Judges agreed to a unified approach to holding social services accountable
Judges receive and review a monthly pending report
Judges and court administration have quarterly meetings to review the LOTP report and consider system barriers
2nd District
USING PERFORMANCE MEASURES FOR ADMINISTRATION
Reporting to the Judicial Council on results of Performance Measures is done twice per year.
A written report is submitted in the spring an oral update is provided in the fall. The written reports from April 2012 are available here.
The written reports from April 2012 noted some of the work being done to review performance measures as well as tactical strategies implemented to improve results:
The 1st District looked at timing measures compared to numbers of hearings, number of judge days assigned and percent of judge need filled to help understand variances in performance between counties in a district. The district determined that more detailed analysis is needed about the type of activity and when it occurs in the life of a case.
Continuing shortage of Public Defender resources and Source Code cases are contributing to criminal case processing delays in many districts.
Several districts mentioned expanded use of Early Neutral Evaluation and ICMCs (Initial Case Management Conference) although it is too early to see if performance measure results change.
Meetings have been held with County Attorneys to find ways to improve the length of time cases are pending.
The 4th District is reviewing current business processes and analysis of new, more efficient methods as eFiling is implemented.
The 5th District noted that it is implementing Children’s Justice Initiative (CJI) strategies for improving outcomes for CHIPS and Permanency matters.
The 7th District is developing a new calendar system and working with stakeholders to develop a strategic plan for dealing with a high percentage of major criminal cases pending.
Data cleanup is occurring in several locations and case areas where many cases are pending beyond their time objective.
Performance Measures are a standing agenda item on 9th District Judges’ Meetings and Court Administrator meetings. District staff works with individual counties on data clean-up.
The 10th District noted that it is implementing a new civil block assignment system expected to improve civil results.
Executive Summary

13
Work continues to assist the bench and court administration in districts and counties to review timing data regularly.
Interactive stoplight reports are now available on-line and were used for the first time to prepare the April reports to the Council. These reports can be run at any time and are available to all judges and court administration staff. An example of a map that can be produced with the report is shown in Figure 1.1.
Figure 1.1: Example of Age of Pending Stoplight Report Results
Customized consultation about specific data quality issues has allowed counties and districts to identify problem areas and devise strategies for fixing cases.
CJI and data quality staff have done specific training with court administration staff on how to run the Length of Time to Permanency report, how to analyze the results and developing data cleanup plans as needed. Consultation is also provided by CJI managers for how CJI teams can improve outcomes for children.
Performance Measures have become a regular part of doing business in district courts. Several districts are reviewing results at bench meetings and court administrator meetings. All districts mentioned increasing collaboration with criminal justice partners, the local bar, CJI teams and others. Most districts are using some or all available reports for various aspects of data monitoring.
Executive Summary

14
ACCESS TO JUSTICE
The Minnesota Judicial Branch will be open, affordable and understandable to ensure access to justice.
Do participants perceive the courts to be accessible?
ACCESS AND FAIRNESS SURVEY
The next round of the survey will be conducted during late 2012 and early 2013 with statewide results available in mid-2013.
Planning for the 2012-2013 Access and Fairness Survey process is underway. Surveys will be conducted statewide in all court locations, including CPC users over the next eight months.
The Access and Fairness Survey conducted statewide in 2008 was adapted from the National Center for State Courts (NCSC) CourTools Access and Fairness Survey. A total of 7,769 surveys were completed by court customers over a period of six months, between January and June 2008. The survey contained fifteen questions, divided into two sections: (1) Access and (2) Fairness. There were also demographic questions that respondents were asked to complete, so their responses could be categorized.
There were 10 questions in the Access section of the survey, and the statements with the highest numbers of respondents who agreed or strongly agreed were:
Finding the courthouse was easy (90% agree of strongly agree)
I easily found the courtroom or office I needed (90%)
I was treated with courtesy and respect (89%)
Three statements had fewer than eight in ten respondents who agreed or strongly agreed with them:
The court’s hours of operation made it easy for me to do business (77%)
I was able to get my court business done in a reasonable amount of time (71%)
I viewed the Court’s website and found it useful (58%)
Complete results of the 2008 survey are posted on CourtNet and in the first Performance Measures Annual Report on the public web site.
Access to Justice

15
93.0% 96.5% 96.6%
97.5% 97.8% 98.4% 99.0% 99.1%
105.5% 111.5%
113.3%
75% 85% 95% 105% 115%
61
1098735
State42
Dis
tric
t
TIMELINESS
The Minnesota Judicial Branch will resolve cases and controversies in a timely and expeditious way without unnecessary delays.
Are trial courts handling cases in a timely manner?
CLEARANCE RATES
District courts disposed of 106% of the number of cases filed in 2011. If Minor Criminal cases are excluded, courts disposed of 101% of the number of cases filed.
The 2011 statewide overall clearance rate, excluding minor criminal (101%), is the highest it has been in the past five years.
Clearance rates for Probate/Mental Health cases have declined to 99% after being well above 100% over the past few years.
Figure 2.1: Statewide Clearance Rates 2008-2011
The 2011 clearance rate is much higher (better) than the previous five years. This improved rate is driven by the Minor Criminal area, especially parking, which had a clearance rate of 127%. There were a very high number of dispositions on parking cases in Hennepin and Ramsey Counties during three months in early 2011 leading to high Clearance Rates. (ViBES data reporting shifted to the data warehouse during this time.) Data for early 2012 indicates a return to Clearance Rates for Minor Criminal that are similar to previous years. In 2011, the overall clearance rate, excluding Minor
Criminal cases, is 100.1%. Major Civil cases have the highest clearance rate, following Minor Criminal, at 105% with Condemnation cases showing the highest rate within that group (136%) (see appendix). Dependency/Neglect cases have the lowest clearance rate in 2011 at 96% with Permanency-TPR cases having the lowest rate within that group (94%).
Figure 2.2: 2011 Overall Clearance Rates by District
The 2011 Clearance Rate by district for all cases ranges from 93% in the 6th District to just over 113% in the 2nd. These numbers show improvement from 2010 when the range was from just under 87% up to 102%. See the appendix for 2007 to 2011 district trends by case groups and see Figure 2.3 for statewide trends by case group.
Case Group
Clearance Rates
2007 2008 2009 2010 2011
Major Crim 99% 101% 103% 99% 100%
Major Civil 96% 97% 100% 99% 105%
Prob/MH 107% 113% 110% 110% 99%
Family 101% 102% 100% 101% 101%
Juvenile 99% 103% 105% 100% 99%
Minor Civil 97% 99% 100% 101% 99%
Minor Crim 99% 93% 95% 92% 107%
State 99% 95% 96% 94% 106%
Timeliness

16
Figure 2.3: Statewide Clearance Rates 2007-2011 – By Case Group
99.0%
94.6% 96.0%
94.0%
105.5%
90%
95%
100%
105%
110%
2007 2008 2009 2010 2011
Overall Clearance Rate (All Case Types)
99.8% 100.8% 103.1%
99.2% 99.9%
90%
95%
100%
105%
110%
2007 2008 2009 2010 2011
Major Criminal Clearance Rate
95.5% 96.6% 99.5% 98.9%
105.2%
90%
95%
100%
105%
110%
2007 2008 2009 2010 2011
Major Civil Clearance Rate
101.3% 101.9% 100.1% 100.6% 101.0%
90%
95%
100%
105%
110%
2007 2008 2009 2010 2011
Family Clearance Rate
97.1% 100.6% 100.3% 101.1%
99.1%
90%
95%
100%
105%
110%
2007 2008 2009 2010 2011
Minor Civil Clearance Rate
98.9%
93.2% 94.6%
92.4%
106.9%
90%
95%
100%
105%
110%
2007 2008 2009 2010 2011
Minor Criminal Clearance Rate
107.0%
112.8% 109.6% 109.6%
98.5%
90%
95%
100%
105%
110%
115%
2007 2008 2009 2010 2011
Probate/Mental Health Clearance Rate
100.4% 103.0%
104.6%
100.5% 100.2%
90%
95%
100%
105%
110%
2007 2008 2009 2010 2011
Juvenile Delinquency Clearance Rate
94.8%
105.3% 106.9%
98.1% 95.6%
90%
95%
100%
105%
110%
2007 2008 2009 2010 2011
Dependency Neglect Clearance Rate
Timeliness
17
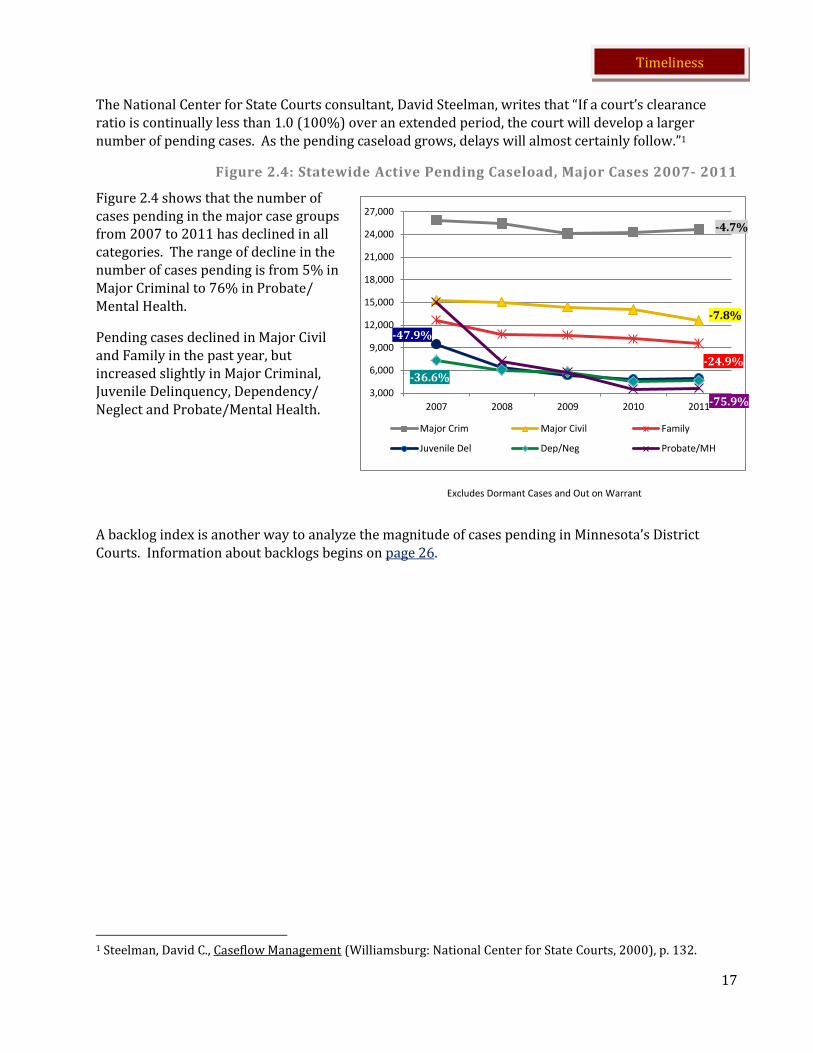
The National Center for State Courts consultant, David Steelman, writes that “If a court’s clearance ratio is continually less than 1.0 (100%) over an extended period, the court will develop a larger number of pending cases. As the pending caseload grows, delays will almost certainly follow.”1
Figure 2.4: Statewide Active Pending Caseload, Major Cases 2007- 2011
Figure 2.4 shows that the number of cases pending in the major case groups from 2007 to 2011 has declined in all categories. The range of decline in the number of cases pending is from 5% in Major Criminal to 76% in Probate/ Mental Health.
Pending cases declined in Major Civil and Family in the past year, but increased slightly in Major Criminal, Juvenile Delinquency, Dependency/ Neglect and Probate/Mental Health.
A backlog index is another way to analyze the magnitude of cases pending in Minnesota’s District Courts. Information about backlogs begins on page 26.
1 Steelman, David C., Caseflow Management (Williamsburg: National Center for State Courts, 2000), p. 132.
3,000
6,000
9,000
12,000
15,000
18,000
21,000
24,000
27,000
2007 2008 2009 2010 2011
Major Crim Major Civil Family
Juvenile Del Dep/Neg Probate/MH
Timeliness
Excludes Dormant Cases and Out on Warrant
-4.7%
-7.8%
-24.9%
-75.9%
-36.6%
-47.9%

18
TIME TO DISPOSITION
Statewide, nearly 98% of all cases disposed in MNCIS in 2011 were disposed within the 99th percentile of the time objective. Conversely, just over 2% of all cases were disposed later than the objective.
Seven percent (7%) of Major Criminal cases were disposed beyond the 12 month objective in 2011 which is a 3% improvement compared to five years ago (10% in 2007). However, only 52% of Major Criminal cases disposed in 2011 met the 90th percentile objective of 4 months.
Use of overall statewide averages masks the large variation in Time to Disposition by District and by County.
Figure 2.5: Statewide Time to Disposition Cases Disposed in MNCIS in 2011
WCL Case Group 90th Percentile 97th Percentile 99th Percentile
Beyond 99th Total
Obj Cases % Obj Cases Cum
% Obj Cases Cum
% Cases % Cases Avg
Days
Major Criminal 4 29,030 52.2 6 10,129 70.4 12 12,408 92.7 4,041 7.3 55,608 156
Major Civil 12 39,313 92.7 18 1,777 96.9 24 574 98.2 748 1.8 42,412 132
Dissolutions 12 16,097 92.7 18 873 97.7 24 242 99.1 154 .9 17,366 121
Domestic Abuse 2 10,698 98.1 3 97 99.0 4 45 99.4 63 .6 10,903 10
Juvenile Del 3 13,449 80.5 5 2,017 92.6 6 432 95.2 801 4.8 16,699 62
Minor Criminal 3 386,944 87.8 6 36,203 96.0 9 9,854 98.3 7,643 1.7 440,644 50
Grand Total
495,531 84.9
51,096 93.7
23,555 97.7 13,450 2.3 583,632 68
Objectives are in months Only cases disposed in MNCIS are included (100% of Major Case types; approx. 31% of Minor Criminal disposed cases, rest in ViBES)
Minor Criminal case counts are cases, rather than charges as on other case statistics reports
The Time to Disposition measure assesses the length of time it takes a court to process cases. It compares a court’s performance with state objectives for timely case processing. This measure takes into account (subtracts out) periods during which cases are dormant.
The appendix contains data on statewide time to disposition by case type as well as district level time to disposition by case group. The Major Criminal category has the highest percent of cases disposed past the 99th percentile objective (7%). Within Major Criminal, 27% of the serious felony dispositions in 2011 occurred beyond the 99th percentile objective of 12 months. The percent of cases disposed beyond the 99th percentile time objective improved for Major Criminal cases in 2011 (7.3%) compared to 2010 (8.1%).
Other case categories with 10% or more of cases disposed beyond the 99th percentile include Condemnation (20%), Felony DWI (11%), Other Felony (10%) and Delinquency Felony (10%). Six case categories exceed the 99th percentile goal (Conciliation Appeal, Harassment, Dissolution without Child, Domestic Abuse, Other Traffic, and Juvenile Traffic).
The following charts, Figure 2.6, show Time to Disposition by Case Group for 2011 by District. The greatest variation among districts is in Major Criminal with the 3rd District disposing of 12.7% of Major Criminal cases beyond the 99th percentile objective (compared to 15.2% in 2010) down to the 2nd and 8th Districts disposing of 3.4% of Major Criminal cases beyond the 99th percentile.
Timeliness

19
Figure 2.6: Time To Disposition 2011 By Case Group By District
Major Crim. Time To Disp. 2011 90th 97th 99th > 99th
District % Cum % Cum % %
3 45.1% 64.0% 87.3% 12.7%
10 36.1% 56.5% 90.1% 9.9%
7 42.8% 61.9% 90.2% 9.8%
1 46.4% 65.8% 91.6% 8.4%
5 53.5% 71.1% 92.5% 7.5%
9 54.1% 72.9% 92.5% 7.5%
6 56.1% 74.3% 93.8% 6.2%
4 64.6% 80.3% 96.1% 3.9%
2 64.1% 81.3% 96.6% 3.4%
8 60.3% 79.6% 96.6% 3.4%
State 52.2% 70.4% 92.7% 7.3%
*Excludes dispositions in ViBES
Major Civil Time to Disp. 2011 90th 97th 99th > 99th
District % Cum % Cum % %
10 88.1% 93.5% 95.8% 4.2%
5 89.8% 95.1% 96.7% 3.3%
9 92.3% 95.7% 97.0% 3.0%
6 93.0% 96.7% 98.0% 2.0%
3 92.8% 96.9% 98.5% 1.5%
7 93.2% 97.1% 98.6% 1.4%
2 92.2% 97.3% 98.9% 1.1%
8 94.4% 98.1% 99.1% 0.9%
1 94.8% 98.3% 99.2% 0.8%
4 94.9% 98.6% 99.5% 0.5%
State 92.7% 96.9% 98.2% 1.8%
Dissolution Time to Disp. 2011 90th 97th 99th > 99th
District % Cum % Cum % %
10 89.5% 95.8% 98.1% 1.9%
6 93.0% 97.0% 98.3% 1.7%
9 91.8% 97.2% 98.9% 1.1%
3 91.3% 97.2% 98.9% 1.1%
5 93.6% 98.1% 99.4% 0.6%
2 94.5% 98.5% 99.4% 0.6%
1 93.7% 98.3% 99.5% 0.5%
7 93.5% 98.6% 99.5% 0.5%
4 94.4% 98.8% 99.6% 0.4%
8 93.0% 98.6% 99.8% 0.2%
State 92.7% 97.7% 99.1% 0.9%
Dom. Abuse Time to Disp. 2011 90th 97th 99th > 99th
District % Cum % Cum % %
6 96.3% 97.7% 98.4% 1.6%
9 96.6% 97.9% 98.8% 1.2%
7 98.4% 98.9% 99.0% 1.0%
1 97.8% 98.7% 99.2% 0.8%
3 98.6% 99.0% 99.3% 0.7%
10 96.3% 98.4% 99.4% 0.6%
5 98.6% 99.5% 99.5% 0.5%
8 99.1% 99.4% 99.7% 0.3%
2 98.4% 99.4% 99.8% 0.2%
4 99.5% 99.9% 99.9% 0.1%
State 98.1% 99.0% 99.4% 0.6%
Juv. Del. Time to Disposition 2011 90th 97th 99th > 99th
District % Cum % Cum % %
8 80.2% 89.7% 93.0% 7.0%
3 70.9% 89.3% 93.2% 6.8%
9 77.9% 90.4% 93.7% 6.3%
5 81.1% 91.3% 94.2% 5.8%
4 75.4% 91.3% 94.3% 5.7%
7 76.5% 91.1% 94.9% 5.1%
10 82.6% 93.9% 95.7% 4.3%
1 84.8% 94.3% 96.1% 3.9%
6 83.4% 94.3% 96.2% 3.8%
2 89.2% 96.2% 97.7% 2.3%
State 80.5% 92.6% 95.2% 4.8%
Minor Crim.* Time to Disp. 2011 90th 97th 99th > 99th
District % Cum % Cum % %
2 58.1% 87.0% 95.0% 5.0%
4 72.2% 91.1% 96.5% 3.5%
6 86.6% 94.4% 97.0% 3.0%
10 87.3% 95.9% 98.0% 2.0%
3 90.2% 96.3% 98.3% 1.7%
5 94.3% 97.9% 98.8% 1.2%
7 92.7% 97.7% 98.9% 1.1%
9 92.7% 97.8% 99.1% 0.9%
1 92.7% 97.9% 99.3% 0.7%
8 94.7% 98.7% 99.5% 0.5%
State 87.8% 96.0% 98.3% 1.7%
Timeliness
Minor Criminal Time to Disposition excludes
ViBES data.

20
0
1
2
3
4
5
6
7
8
9
10
2007 2008 2009 2010 2011
% o
ver
99
th P
erc
en
tile
Major Crim
Juv Delinq
Major Civil
Minor Crim
Family
Figure 2.7: Percent of Cases Disposed Statewide Beyond 99th Percentile 2007- 2011 by Case Category
The trends for the percent of cases disposed beyond the 99th percentile time objective by case category are steady or improving over the past five years. The greatest improvements from 2007 to 2011 are Family (.8% in 2011 down from 1.5% in 2007), Delinquency (4.8% from 7.7%) and Major Criminal (7.3% down from 9.7%).
Minor Criminal dispositions from ViBES excluded.
Figure 2.8: 5th Degree Assault Cases Time to Disposition 2011 by District While statewide numbers tend to even out many variances, district and county level information shows more variation. For example, statewide, nearly seven percent (6.8%) of 5th Degree Assault cases were disposed beyond the 99th percentile objective of 9 months in 2011. But, there are many differences among districts ranging from the 4th District with 3% of 5th Degree Assault cases disposed beyond the objective (this district has 26% of statewide 5th Degree Assault dispositions for the year) to the 3rd District recording nearly 16% of these cases disposed after 9 months.
Figure 2.9 illustrates county variation in time to disposition for the WCL type of Other Gross Misdemeanor cases. It shows that the percent of cases disposed in 2011 beyond the 12 month objective (99th percentile) ranges from 0% to 38%.
Steele County has the highest percent of Other Gross Misdemeanor cases disposed beyond the 99th percentile, disposing 37 of 98 cases after 12 months (see appendix for number of cases disposed by county). This number of dispositions compares to Kittson County which disposed of three (3) Other Gross Misdemeanor cases in 2011 and Hennepin County with 3,956 dispositions.
This variation in number of cases by county illustrates that with small numbers, the percentage may appear distorted, but there are still cases that were disposed beyond the timing objectives to be monitored and acted upon.
District >99th %
(9 mo.) Total Cases
Disposed 3 15.7% 903
10 8.5% 1,790
7 7.9% 944
6 7.8% 689
1 7.6% 1,151
2 6.7% 1,157
5 6.4% 562
9 4.5% 889
8 4.5% 291
4 3.2% 2,902
State 6.8% 11,278
Timeliness

21
Figure 2.9: Other Gross Misdemeanor Case Dispositions Beyond the 99th Percentile Objective 2011 by County
The appendix contains the total number of dispositions by county for Other Gross Misdemeanor cases in 2011. If a county is not shown on this chart, no cases were disposed beyond the 99th percentile objective.
0% 5% 10% 15% 20% 25% 30% 35% 40%
RiceCass
Otter TailMcLeod
KandiyohiHubbard
BeckerVirginia
ClayLyonTodd
SherburneHennepin
MowerChisago
MahnomenPennington
HoustonBentonNicolletMartinRoseauAnoka
CarltonKoochiching
ItascaFreeborn
PopeGoodhue
WasecaNobles
ScottDuluth
MorrisonBeltrami
LakeHibbingMurray
WashingtonDakotaStearns
CookMarshallWadena
Blue EarthStevens
IsantiWatonwan
CarverWinonaWright
KanabecCrow Wing
AitkinOlmsted
PineJacksonDouglas
Mille LacsFaribault
Lake of the WoodsSteele
% disposed over 99th percentile
Timeliness

22
As would be expected, there are also differences in time to disposition based on the type of activity that closed the case (see appendix).
Over a quarter (26%) of the 2,512 cases disposed (of all case types that have timing objectives) in 2011 with a jury trial were disposed beyond the 99th percentile. The differences among case groups are shown in Figure 2.10.
Figure 2.10: Percent Cases Disposed With Jury Trial Beyond 99 th Percentile 2011
Case Group % Cases Disposed
Beyond 99th Percentile
Total Cases Disposed with Jury Trial (.2%
of all cases) Major Criminal 27.8% 1,365
Major Civil 10.5% 353
Juvenile Delinquency 100.0% 4
Minor Criminal 29.2% 790
Total 26.0% 2,512
In contrast, just over 4% of cases disposed (of all cases that have timing objectives) with only hearing activity and no trial (257,853 total cases disposed with this activity) were disposed beyond the 99th percentile and only .5% of cases without any hearing activity (315,729 total dispositions) beyond the 99th percentile. Figure 2.11: Statewide Percent Cases Disposed in MNCIS Beyond 99th Percentile by Disposition Activity Type - 2007-2011
Only dispositions recorded in MNCIS are included in Figure 2.11 (no dispositions done in TCIS or ViBES are included). In 2007, approximately 75% of all Non Minor Criminal cases are included, about 98% in 2008, and 100% in years thereafter except for Minor Criminal cases disposed in ViBES in Hennepin and Ramsey Counties.
19.1%
21.9%
26.9% 26.6% 26.0%
8.9% 9.2% 7.3%
9.1% 10.3%
4.7% 4.5%
4.0% 4.4% 4.2% 4.8% 6.8%
3.4% 2.5% 2.4% 0.6% 0.9% 0.5%
0.4% 0.5% 0%
5%
10%
15%
20%
25%
30%
2007 2008 2009 2010 2011
% C
ases
Dis
po
sed
Bey
on
d
99
th P
erce
nti
le
Jury Trial
Court Trial
With HearingActivity
Change ofVenue
Without HrgActivity
Timeliness
23
0% 2% 4% 6% 8% 10% 12%
8
2
5
7
6
1
State
9
4
3
10
% Cases Beyond 99th Percentile
6/30/2012 6/30/2011
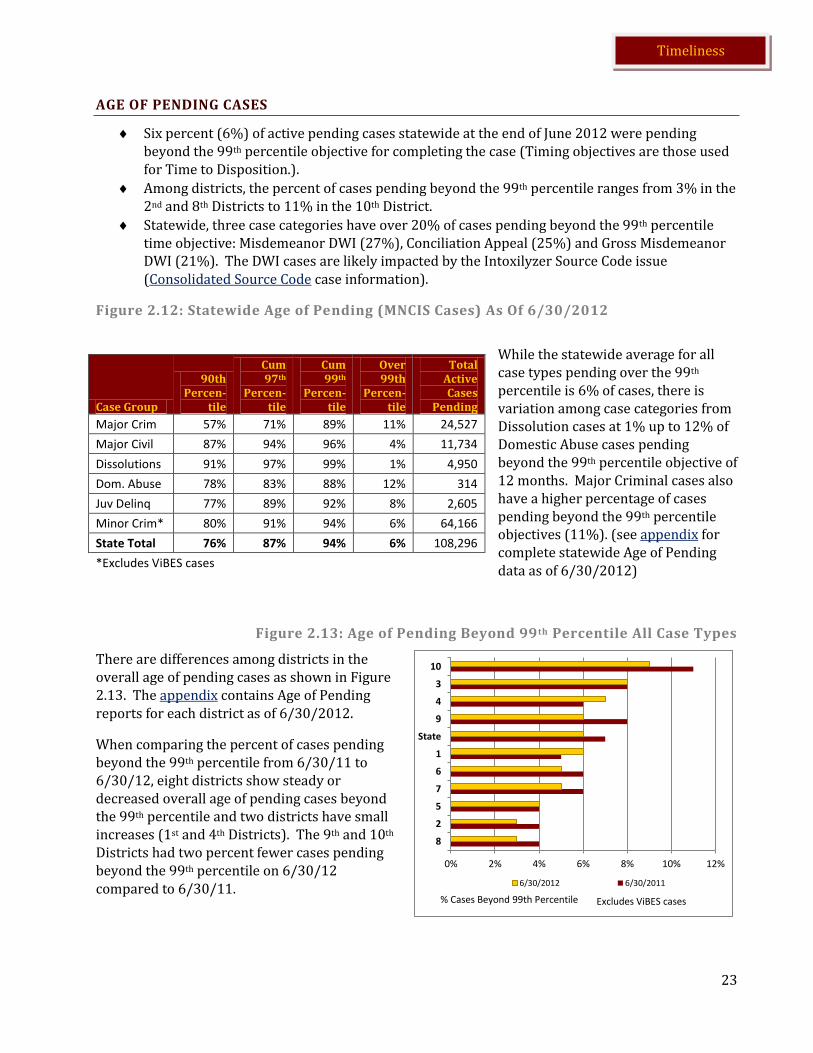
AGE OF PENDING CASES
Six percent (6%) of active pending cases statewide at the end of June 2012 were pending beyond the 99th percentile objective for completing the case (Timing objectives are those used for Time to Disposition.).
Among districts, the percent of cases pending beyond the 99th percentile ranges from 3% in the 2nd and 8th Districts to 11% in the 10th District.
Statewide, three case categories have over 20% of cases pending beyond the 99th percentile time objective: Misdemeanor DWI (27%), Conciliation Appeal (25%) and Gross Misdemeanor DWI (21%). The DWI cases are likely impacted by the Intoxilyzer Source Code issue (Consolidated Source Code case information).
Figure 2.12: Statewide Age of Pending (MNCIS Cases) As Of 6/30/2012
While the statewide average for all case types pending over the 99th percentile is 6% of cases, there is variation among case categories from Dissolution cases at 1% up to 12% of Domestic Abuse cases pending beyond the 99th percentile objective of 12 months. Major Criminal cases also have a higher percentage of cases pending beyond the 99th percentile objectives (11%). (see appendix for complete statewide Age of Pending data as of 6/30/2012)
Figure 2.13: Age of Pending Beyond 99th Percentile All Case Types
There are differences among districts in the overall age of pending cases as shown in Figure 2.13. The appendix contains Age of Pending reports for each district as of 6/30/2012.
When comparing the percent of cases pending beyond the 99th percentile from 6/30/11 to 6/30/12, eight districts show steady or decreased overall age of pending cases beyond the 99th percentile and two districts have small increases (1st and 4th Districts). The 9th and 10th Districts had two percent fewer cases pending beyond the 99th percentile on 6/30/12 compared to 6/30/11.
Case Group
90th Percen-
tile
Cum 97th
Percen-tile
Cum 99th
Percen-tile
Over 99th
Percen-tile
Total Active Cases
Pending
Major Crim 57% 71% 89% 11% 24,527
Major Civil 87% 94% 96% 4% 11,734
Dissolutions 91% 97% 99% 1% 4,950
Dom. Abuse 78% 83% 88% 12% 314
Juv Delinq 77% 89% 92% 8% 2,605
Minor Crim* 80% 91% 94% 6% 64,166
State Total 76% 87% 94% 6% 108,296
*Excludes ViBES cases
Timeliness
Excludes ViBES cases

24
Within each statewide result, there is a lot of variation found among districts and among the counties within the districts.
An example of variation is shown in the Age of Pending of Other Non-Traffic cases. Statewide, 8% of the cases in this WCL group are pending beyond the 99th percentile (as of 6/30/2012). But, district results range from 3% of these cases pending beyond the 9 month objective in the 2nd District to 19% in the 10th District. Within the 10th District, the county results vary on these cases pending beyond 9 months from 0% of cases in Sherburne to 30% in Anoka County where over 56% of the district’s cases are pending.
Figure 2.14: Other Non-Traffic Cases Pending Beyond 99th Percentile (9 months) By District (as of 6/30/2012)
District
% over 99th
Percentile
Tot # of Pending
Cases
10 19% 3,791
State 8% 17,536
3 7% 1,240
4 6% 3,745
6 6% 1,177
8 5% 341
1 5% 2,271
9 5% 1,220
5 4% 663
7 4% 1,574
2 3% 1,514
Statewide, by county, the percent of Other Non-Traffic cases pending beyond the 9-month objective ranges from 30% to 0% as shown in Figure 2.15. The appendix contains information about the number of cases pending in each location and the average number of days each case that is beyond the 99th percentile has been pending.
10th District Counties
% over 99th
Percentile
Tot # of Pending
Cases
Anoka 30% 2148 Isanti 10% 77 Pine 5% 74 Chisago 5% 134 Wright 5% 328 Kanabec
4% 47 Washington
3% 800 Sherburne
0% 183
Timeliness

25
Figure 2.15: Percent of Other Non-Traffic Cases Pending Beyond 99th Percentile (9 months) By County (As of 6-30-2012)
The Other Non-Traffic case category includes misdemeanor charges for prostitution, theft, trespass, insurance fraud and many others. If a county is not listed above, no cases were pending beyond the 99th percentile on 6/30/2012. The Appendix contains total number of Other Non-Traffic cases pending by county and average number of days cases beyond the 99th percentile have been pending as of 6/30/2012.
0% 4% 8% 12% 16% 20% 24% 28% 32%
BeltramiRice
CarltonBecker
DouglasBlue EarthLeSueur
WabashaRoseau
WadenaHubbardMeeker
WashingtonRamsey
ClayHouston
PolkChippewa
CassItasca
KoochichingLake of the Woods
CarverTodd
KandiyohiPennington
KanabecScottCook
StearnsBentonWright
MowerDakotaChisagoNobles
WatonwanPine
Otter TailWilkin
Mille LacsMcLeod
St. LouisHennepinWinona
GoodhueGrantRockSwiftSibleyAitkinLyon
FreebornCrow Wing
IsantiMartin
OlmstedYellow Medicine
Lac qui ParleSteele
JacksonStevensAnoka
Percent Cases Beyond 99th Percentile Time Objective (9 months)
Timeliness

26
BACKLOG INDEX
All Backlog Index scores are below .5. The lower the index score, the better, as the maximum index score should be 1.0.
The Major Criminal and Probate/Mental Health Backlog Index scores are the only categories that have risen from 2010 to 2011 while the Major and Minor Civil Index scores show fairly large declines in the last year.
As with other timing measures, results vary by district and by counties within districts.
There are several ways to assess court backlog. Within the Age of Pending analysis, those cases that are past the time objective of the 99th percentile are considered to be “delayed” or “backlogged.” Clearance Rates also provide a measure of how well a court is “keeping up” with the incoming caseload as it compares the number of cases disposed during a time period with the total number of cases filed during that same period. “Backlog” has also been used to describe the time it takes to get a trial scheduled.
Another useful measure is the Backlog Index “which is one of the quickest and most reliable indicators of court wide performance relating to case-processing times. It measures the pending caseload against the court’s capacity to dispose of the caseload during a given time period.”2 The specific measurement is the number of cases of a given case type pending at the beginning of the year, divided by the total number of cases of that case type disposed during the year.
The major difference between clearance rates and backlog index is that clearance rates compare dispositions to filings (keeping up with ‘new’ work) while the backlog index compares dispositions to previously pending cases (taking care of ‘old’ work). In other words, the backlog index represents the part of a year it would take to dispose of the cases pending at the beginning of the year if no new cases were filed – how long it would take to dispose of ‘the backlog’.
For example, if a court had 500 pending Felony cases at the beginning of the year and disposed of 1,000 Felony cases that year, it would have a backlog index of .5. This means that the court “turned over” or disposed of the equivalent of the pending caseload within six months (.5 equals a half-year).
“A backlog index of 1.0 means that the court disposed of the equivalent of the pending caseload in one year.”3 The minimum goal for a civil (non-criminal) backlog index is 1.0 or less which would mean disposing the number of cases that are in ‘backlog’ at the beginning of the year, without regard to the number of newly filed cases. Criminal cases should be disposed more quickly, so the backlog index should be lower for criminal cases than civil cases.
This index is less useful as a current operational measure of productivity but more useful as a trend measure over time. It can show the case areas that need focused attention, regardless of current filing numbers.
2 Steelman, David C., Caseflow Management (Williamsburg: National Center for State Courts, 2000), p. 93. 3 Ibid.
Timeliness
“…the backlog index … is
one of the … most reliable
indicators of courtwide
performance relating to
case-processing times.”
David Steelman

27
0.12 0.13 0.14 0.15 0.15
0.17 0.18
0.41 0.45
0.52 0.68
.00 .10 .20 .30 .40 .50 .60 .70
89135
1072
State64
Dis
tric
t
2011 Backlog Index
Figure 2.16: Backlog Index by Case Type Statewide 2007-2011
Figure 2.16 shows that the highest backlog index scores statewide are for Minor and Major Criminal, although they are less than .5 (.45 and .44 respectively).
The backlog index has been declining for most major case groups in the past five years. Exceptions to the decline in 2011 are Major Criminal and Probate. The Minor Civil data is available
only since 2010, and Minor Criminal data is only available for 2011 (ViBES data is now being included programmatically in pending and disposition counts). Minor Civil has the lowest backlog index at .11. District backlog index data for 2007-2011 is available in the appendix.
Figure 2.17: 2011 Backlog Index for Minor Criminal Cases By District
Figure 2.17 shows the Minor Criminal backlog index for 2011 as low as .12 in the 8th District to a high of .68 in the 4th District. This means that the 8th District was able to dispose of the number of cases pending at the beginning of 2011 in under 1½ months (.12 of a year) while the 4th District needed over 8 months to dispose of an equivalent number of cases as those pending at the beginning of 2011 (.68 of a year).
The large backlog index in the 4th is concentrated in Other Non-Traffic and Parking as shown in the chart below. However, cases that are in MNCIS (due to court activity) show a backlog index of .42 compared to the overall .68, while the ViBES only cases (no court activity) have a backlog index of .73. Because Parking tickets have such high volume, removing them brings the ViBES Minor Criminal (no court activity cases) backlog index down to .34.
The number of pending parking and other citation cases will likely be changing during the transition to CPC and when the ViBES to MNCIS project is complete.
4th District, WCL Case Categories
2011 Backlog in Minor Criminal Cases
Other Non-Traffic 1.17
Parking 1.03
Misdemeanor DWI 0.26
5th Degree Assault 0.25
Other Traffic 0.20
Juvenile Traffic 0.16
Minor Crim Total 0.68
0.0
0.1
0.2
0.3
0.4
0.5
0.6
0.7
0.8
2007 2008 2009 2010 2011
Bac
klo
g In
de
x
MinorCriminalMajorCriminalProbate/MH
Major Civil
Juvenile
Family
Minor Civil
Timeliness
Timeliness

28
“It is the policy of the Judicial Branch that juvenile protection cases… be expedited in conformance with state and federal requirements with the goal of serving the best interests of children by providing safe, stable, and permanent homes for abused and neglected children. … CJI judges accept shared
responsibility for monitoring and
improving performance on federal
and judicial branch child welfare
measures and are encouraged to
develop and implement local plans
to improve such performance.”
Judicial Policy 601
LENGTH OF TIME TO PERMANENCY
Just over three-fourths (76%) of children who reached permanency in 2011 did so after being out of home for 12 months or less (across all types of CHIPS/Permanency cases).
Just over six in ten children (61%) who reached permanency on one of the Permanency case types did so in 12 months (TPR (old case type), Permanency-TPR, and Permanency-Non-TPR).
There is a 10% improvement in the percent of children with a TPR or non-TPR permanency reaching permanency within 12 months from 51% in 2008 (first year results are available) to 61% in 2011.
Because of the complexity of CHIPS and Permanency cases, training continues to be provided to CJI teams and other MNCIS users to make sure the data accurately and thoroughly reflects all activities on the case. Data files with possible errors are available on CourtNet for court administration to use for local data quality work.
Many counties and districts have had hands-on training for accurate recording of events in MNCIS for CHIPS and Permanency cases. The Length of Time to Permanency report drill-through feature provides cases to review to see why some are taking longer than others.
Since one of the goals of the Children’s Justice Initiative (CJI) is for children removed from a custodial parent to have permanency and stability in their living situation, the Length of Time to Permanency report was developed to assist courts in determining the length of time it takes, over the lives of children, to provide permanency to those who are removed from home.
The Judicial Council also set an objective that 60% of all children who are under State Guardianship should reach adoption with 24 months. The data quality review period is nearly complete for the Time to Adoption for Children under State Guardianship report (Length of Time to Adoption), so results are currently available for review by judges or court administration staff.
Timeliness

29
Figure 2.18: Length of Time for Children to Reach Permanency in 2011 by District Figure 2.18 shows that, statewide, 76% of children who reached permanency in 2011 did so after being out of home a total of 12 months or less (2,343 children out of 3,093 total). The goal is to have 90% of children reaching permanency by 12 months and 99% by 18 months. See the appendix for county listings of the number of and timing of 2011 CHIPS and Permanency cases reaching permanency by 12 and 18 months’ time. There is variation among districts for the percent of children reaching permanency within 12 months as shown in Figure 2.18. The range is from 61% in the 6th District to 83% reaching permanency within 12 months in the 3rd District. There are also over 500 more permanencies recorded in 2011 compared to 2010. This large increase is likely influenced by the data quality work to make all CHIPS/Permanency cases in MNCIS more thorough and accurate.
While 76% of all children reached permanency by 12 months and 92% by 18 months, those who were part of a Permanency TPR or Non-TPR case (likely in addition to a CHIPS case), did not achieve permanency as quickly. Figure 2.19 shows that 61% percent of children on a TPR or Non-TPR Permanency case reached permanency by 12 months and 88% did so by 18 months. These results indicate improvement from year to year except for being flat from 2010 to 2011.
Figure 2.19: Length of Time for Children with TPR or Non-TPR Permanency Case to Reach Permanency, Statewide, 2008 to 2011
85%
51%
86%
59%
88%
61%
88%
61%
40% 50% 60% 70% 80% 90% 100%
By 18 Months
By 12 Months
Statewide Percent of Children Reaching Permanency by 12 and 18 months
Permanency- TPR or Non-TPR only, 2008-2011 2011
2010
2009
2008
District % reaching
perm by 12 months
Cum % reaching perm by 18
months
Tot Number of Children
Reaching Perm
1 78% 90% 289
2 67% 86% 237
3 83% 96% 279
4 79% 94% 581
5 73% 90% 258
6 61% 86% 305
7 82% 97% 283
8 78% 95% 134
9 75% 95% 364
10 79% 93% 363
State 76% 92% 3,093
Goal 90% 99%
Timeliness

30
As may be expected, the time for children to reach permanency varies by type of permanency achieved. Figure 2.20 shows that by 12 months of being out of home, 89% of children reaching permanency via a Trial Home Visit did so while only 41% of children with Long-Term Foster Care achieved permanency by 12 months. Eleven percent (11%) of children reaching a permanency of Long-Term Foster Care in 2011 needed over 24 months to achieve permanency and 6% of children who became State Wards for Adoption took longer than 24 months.
Figure 2.20: Length of Time To Permanency Statewide 2011 CHIPS Cases By Perm Type
About 20% of all children reaching permanency in 2011 had only a Termination of Jurisdiction as the last permanency type entered. A large majority of these cases may have data entry issues which could be reviewed to show more accurately the type of permanency achieved for each child.
Permanency Type*
% of All
Perms
Up to 6 months
Cum to 12 mo
Cum to 15 mo
Cum to 18 mo
Cum to 24 mo
Cum >24 mo
Total Child-
ren Protective Supervision
22% 444 35% 150 88% 37 94% 9 95% 21 98% 11 100% 672
Trial Home Visit 21% 384 31% 187 89% 38 95% 11 97% 18 99% 4 100% 671
Reunified 4% 33 3% 56 72% 17 86% 7 92% 7 98% 3 100% 123
State Ward for Adoption
12% 61 5% 168 60% 73 79% 33 87% 27 94% 22 100% 383
Non State Ward for Adoption
1% 6 1% 6 63% 6 95% 1 100% 0 100% 0 100% 19
Transfer of Custody
17% 111 9% 251 69% 80 84% 41 91% 38 99% 7 100% 527
Long-Term Foster Care
3% 11 1% 33 41% 23 62% 13 74% 16 89% 12 100% 108
Foster Care for a Specified Time
1% 2 0% 12 67% 2 76% 2 86% 2 95% 1 100% 21
Dismissed w/o Permanency Order
4% 69 5% 40 88% 6 93% 7 98% 0 98% 2 100% 124
Term of Jurisdiction w/o Perm Order
15% 135 11% 186 68% 62 81% 39 89% 32 96% 20 100% 475
Total 100% 1254 41% 1089 76% 344 87% 163 92% 161 97% 82 100% 3093
Timing Objectives
50% 90% 99%
*Permanency types include those that are now obsolete.
Timeliness

31
COURT OF APPEALS DISPOSITIONS WITHIN TIME STANDARDS
In 2011, the Court of Appeals exceeded its goal by disposing of 79% of its cases within 290 days (goal is 75%). This is an improvement compared to 2010 when 69% were disposed within 290 days, and compared to 2009, when 53% of cases were disposed within 290 days.
The Court of Appeals also exceeded the goal by disposing of 95% of its cases within 365 days (goal is 90%) in 2011. This result has improved since 2010 when 92% of cases were disposed within 365 days, and an improvement over 2009, when 79% of cases were disposed within one year.
The original timing objectives for the Court of Appeals were approved in August 2007, and updated in March 2011. The Court has adopted the ABA measure of ‘case clearance’, which measures cases from beginning (filing) to end (disposition). The goals are to have 75% of cases disposed within 290 days of filing and 90% disposed within 365 days of filing.
Figure 2.21: Percent of Court of Appeals Cases Disposed Within 290 Days of Filing
Court of Appeals Percentage of Cases Disposed Within 290 Days of Filing From Filing to Disposition Goal = 75% of Cases
2009 2010 2011
% of cases
meeting objective
% of cases
meeting objective
% of cases meeting
objective Civil # Cases # Cases # Cases
General Civil 888 58% 815 75% 725 89% Unemployment 227 62% 341 77% 329 87%
Family 230 71% 223 95% 243 96% Other 105 98% 82 100% 91 100%
Total Civil 1,450 64% 1,461 80% 1,388 90%
Criminal
Criminal 877 32% 691 45% 677 53%
Juvenile Protection
Protection 62 100% 42 100% 50 100%
Juv. Delinquency
Delinquency 43 42% 25 76% 17 94%
Total Cases 2,432 53% 2,219 69% 2,132 79%
The court disposed of 79% of its cases within 290 days in 2011. This is a significant improvement over 2010, when 69% of cases were disposed within 290 days, and further improvement over 2009 when 53% of cases were disposed in that timeframe. The 2009 results were due to a pre-existing backlog and because of various delays in criminal cases, including court reporters’ need for more time to prepare transcripts, and public defenders’ frequent requests for extension of deadlines.
While only 53% of Criminal cases were disposed within 290 days in 2011, the court exceeded the 75% goal for all other categories.
Timeliness
32
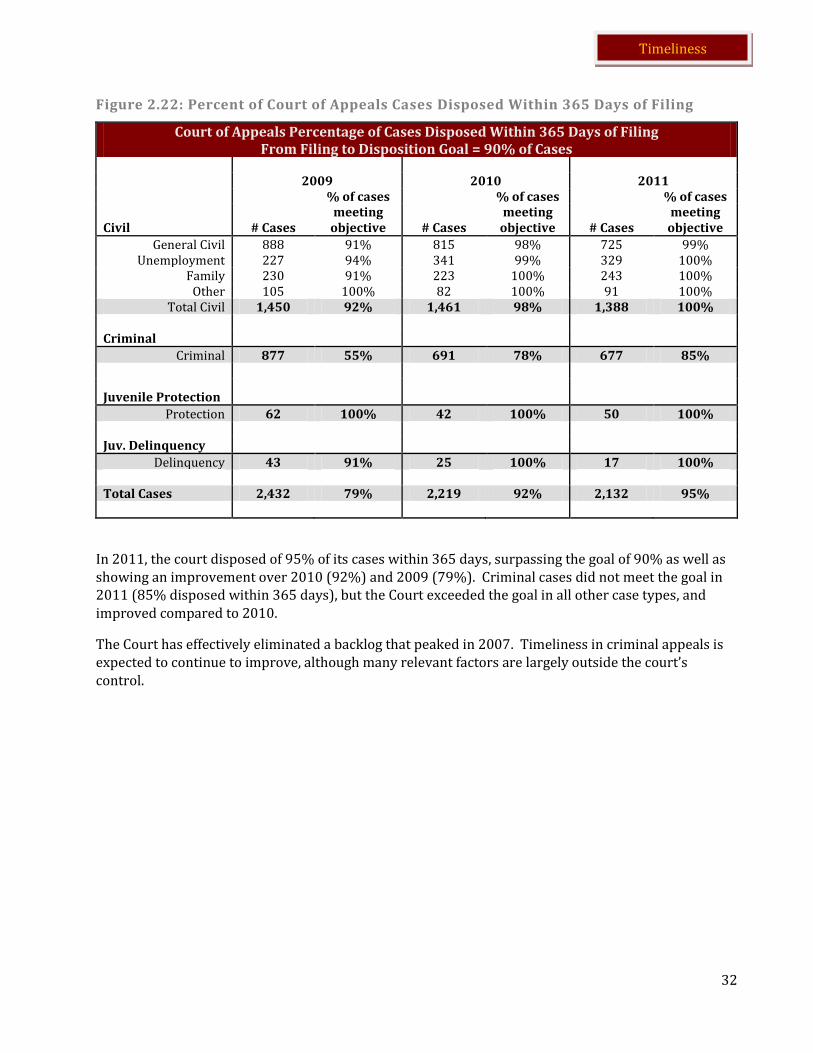
Figure 2.22: Percent of Court of Appeals Cases Disposed Within 365 Days of Filing
Court of Appeals Percentage of Cases Disposed Within 365 Days of Filing From Filing to Disposition Goal = 90% of Cases
2009 2010 2011
% of cases
meeting objective
% of cases
meeting objective
% of cases meeting
objective Civil # Cases # Cases # Cases
General Civil 888 91% 815 98% 725 99% Unemployment 227 94% 341 99% 329 100%
Family 230 91% 223 100% 243 100% Other 105 100% 82 100% 91 100%
Total Civil 1,450 92% 1,461 98% 1,388 100%
Criminal
Criminal 877 55% 691 78% 677 85%
Juvenile Protection
Protection 62 100% 42 100% 50 100%
Juv. Delinquency
Delinquency 43 91% 25 100% 17 100%
Total Cases 2,432 79% 2,219 92% 2,132 95%
In 2011, the court disposed of 95% of its cases within 365 days, surpassing the goal of 90% as well as showing an improvement over 2010 (92%) and 2009 (79%). Criminal cases did not meet the goal in 2011 (85% disposed within 365 days), but the Court exceeded the goal in all other case types, and improved compared to 2010.
The Court has effectively eliminated a backlog that peaked in 2007. Timeliness in criminal appeals is expected to continue to improve, although many relevant factors are largely outside the court’s control.
Timeliness

33
SUPREME COURT DISPOSITIONS WITHIN TIME STANDARDS
The Supreme Court meets most timing objectives Filing of PFR to Disposition of PFR.
The number of days from submission of oral argument to circulation of majority standard and submission to disposition have increased at the 90th percentile in 2011 compared to 2010 for Murder, Civil and Professional Reg. cases.
The Supreme Court approved timing objectives in March, 2007 and the Judicial Council adopted them in August, 2007. The time allocated to each function is considered as aspirational but achievable. The categories are taken generally from the ABA standards and the points of measurement conform to the ABA use of the 50th percentile and the 90th percentile for state supreme courts.
Although separate time standards were adopted for Circulation of Majority to Dissent; Submission to Disp with Dissent, and Final Processing, and the court monitors progress of cases on that basis, MACS is not programmed to provide statistics for cases with and without dissents separately.
Figure 2.23: Number of Days Elapsed at 50 th Percentile of Supreme Court Cases ’07-‘11
* Tax Court and Workers’ Compensation Cases; ** Days from filing to disposition
Minnesota Supreme Court Time Standards (Days)
50th Percentile
Mandatory/Original (Non-PFRs) Discretionary
Event
Num Num Num Num Num Num Num Crim Num
Mur- of Civil* Of Prof. of Writs of Review of Review of Child of Pre- of
der I Cases Cases Reg. Cases Cases Granted Cases Denied Cases Prot. Cases trial Cases
Filing of PFR to Disp of PFR Standard
-- -- -- -- -- -- -- -- 50 50 20 30
2011 47 71 47 531 19 14 40 7
2010 -- -- -- -- -- -- -- -- 49 66 46 592 18 10 39 17
2009 -- -- -- -- -- -- -- -- 47 60 47 728 23 15 41 10
2008 -- -- -- -- -- -- -- -- 47 63 43 543 29 14 41 8
2007 -- -- -- -- -- -- -- -- 47 71 47 587 32 26 42 12 Submission (oral arg.) to Circulation of Majority Standard
50 40 15 10 60 -- -- 20 30
2011 55 21 47 23 28 51 -- -- 77 71 -- -- -- -- -- --
2010 59 37 42 26 53 48 -- -- 80 66 -- -- -- -- -- --
2009 63 40 57 23 37 59 -- 11 71 60 -- -- -- -- 67 3
2008 38 41 23 28 28 54 -- 7 50 63 -- -- -- -- 29 1
2007 34 44 34 37 20 46 -- 6 57 71 -- -- 27 6 29 5 Submission to Disposition without/with Dissent Standard
90/ 105
75/ 105
50/ 60
30/ 40
90/ 105
-- -- 30/ 40
45/ 60
2011 114 21 79 23 77 51 -- -- 184 71 -- -- -- -- -- --
2010 121 37 36 26 98 48 -- -- 169 66 -- -- -- -- -- --
2009 129 40 35 23 70 59 15** 11 176 60 -- -- -- -- 223 3
2008 79 41 2 28 65 54 13** 7 112 63 -- -- -- -- 79 1
2007 73 44 49 37 50 46 12** 6 129 71 -- -- 77 6 79 5
Timeliness

34
To report the points of measurement, MACS, the Supreme Court case management system, calculates the number of days a case took for particular events at the 50th percentile and 90th percentile of all of the cases handled of a particular type and by event. This means that if there were 100 cases of a certain type, the number of days to accomplish an event (i.e. filing of PFR to disposition of PFR) would be put in numeric order by number of days that event took to accomplish and the days at case number 50 is then recorded as the 50th percentile number of days and the days at case number 90 is recorded as the 90th percentile number of days.
Figure 2.24: Number of Days Elapsed at 90 th Percentile of Supreme Court Cases ’07- ‘11
* Tax Court and Workers’ Compensation Cases; ** Days from filing to disposition
Minnesota Supreme Court Time Standards (Days)
90th Percentile
Mandatory/Original (Non-PFRs) Discretionary
Event
Num
Num
Num
Num
Num
Num
Num Crim. Num
Mur- of Civil* of Prof. of Writs of Review of Review of Child of Pre- of
der I Cases Cases Reg. Cases Cases Granted Cases Denied Cases Prot. Cases trial Cases
Filing of PFR to Disposition of PFR Standard
-- -- -- -- -- -- -- -- 60 60 20 40
2011 -- -- -- -- -- -- -- -- 55 71 56 531 25 14 44 7
2010 -- -- -- -- -- -- -- -- 56 66 56 592 26 10 43 7
2009 -- -- -- -- -- -- -- -- 57 60 57 728 34 15 54 10
2008 -- -- -- -- -- -- -- -- 56 63 55 543 36 14 60 8
2007 -- -- -- -- -- -- -- -- 57 71 56 587 40 26 54 12
Submission (oral arg.) to Circulation of Majority Standard
125 90 40 20 125 -- -- 20 45
2011 191 21 219 23 78 51 -- -- 161 71 -- -- -- -- -- --
2010 110 37 105 26 64 48 -- -- 138 66 -- -- -- -- -- --
2009 96 40 95 23 75 59 -- 11 141 60 -- -- -- -- 67 3
2008 62 41 56 28 37 54 -- 7 98 63 -- -- -- -- 29 1
2007 77 44 98 37 28 46 -- 6 113 71 -- -- 86 6 41 5
Submission to Disposition without/with Dissent Standard
170/ 200
110/ 140
60/ 90
35/ 45
160/ 190
-- -- 40/ 40
65/ 90
2011 273 21 247 21 141 51 -- -- 324 71 -- -- -- -- -- --
2010 225 37 142 26 129 48 -- -- 288 66 -- -- -- -- -- --
2009 198 40 164 23 127 59 55** 11 302 60 -- -- -- -- 223 3
2008 136 41 99 28 92 54 25** 7 183 63 -- -- -- -- 79 1
2007 134 44 136 37 225 46 39** 6 225 71 -- -- 183 6 122 5
Timeliness

35
INTEGRITY AND ACCOUNTABILITY
The Minnesota Judicial Branch will ensure the integrity and accountability of its performance by maintaining a record system that is accurate, complete and timely.
Is the electronic record system accurate, complete and timely?
DATA QUALITY PROGRAM
The Data Quality program has been functioning for five years and has been instrumental in leading several significant data quality efforts.
Many districts noted that their use of data quality reports and trainings on data quality have resulted in improved performance measure results.
Several automated data quality reports have been made available recently to assist court staff with assessing the accuracy of the court records.
Over 6,000 cases were affected by one or more Tyler (MNCIS) system defects that have been cleaned up by the Data Quality program and have now been successfully passed to the BCA, DNR and DVS.
Mission: The Data Quality program was created in July 2007 to define data quality standards, identify data quality issues and determine when it is necessary to develop standard business practices to be implemented statewide. The Data Quality Steering Committee provides leadership for the program by setting priorities for focusing efforts, determining acceptable levels of data quality in particular areas, ensuring resources are prioritized to implement solutions, and determining when to move issues to Court Operations Advisory Workgroup (COAW) or other groups to pursue required business practices in order to achieve the necessary level of data quality.
One of the services provided by the Data Quality Program has been making Court Data Files available to courts to use to find data for possible updating or correction. These lists of cases and information about them had been manually produced and available via a SharePoint site. These reports became available via automated subscriptions in early 2012 and they deal with various components of Adult Criminal, Juvenile and CHIPS cases.
Additional manual reports that will be converted to automated reports include cases with a disposition date that is prior to the filing date, juvenile cases with a missing confidential status and criminal cases with invalid statute and level combinations.
“…The Minnesota Judicial Branch will ensure the integrity and accountability of its performance by maintaining a record system that is accurate, complete and timely.”
Judicial Council Policy 505 Core Judicial Branch Goals
Integrity and Accountability

36
● ● ●
“With assistance from SCAO staff, the 5th District participated in an extensive data
quality review of CHIPS and Permanency case types to insure all placements were being
reported accurately.”
5th District
● ● ●
An example of a recent data quality initiative was a focus on cases where an Interim Disposition was used, but a Probation Component was not complete in MNCIS which could cause problematic criminal history records. There were 27,000 Adult Criminal cases with this issue, which has been reduced to 1,400 cases with work underway to address the 5,000 Juvenile cases with similar issues.
The data quality group also coordinated the manual clean-up of over 6,000 cases that a Tyler (MNCIS) defect caused cases to not be properly sent to DVS (Driver and Vehicle Services of the Department of Public Safety), BCA (Bureau of Criminal Apprehension) and DNR (Department of Natural Resources).
The Length of Time to Permanency (LOTP) report is an important. Ongoing efforts to support the improvement of data quality of CHIPS and Permanency cases have resulted in more children being appropriately represented on the LOTP report. These efforts include the development and weekly posting of CHIPS Data Quality Reports and Court Data Files for local courts to use in monitoring their data, and technical assistance with local courts to help them develop the ability to review and improve CHIPS data.
All of the reports, tools, data files and other resources of the Data Quality Program are available on CourtNet. The Data Quality staff are also available for customized consultation.
Integrity and Accountability

37
EXCELLENCE
The Minnesota Judicial Branch will achieve excellence in the resolution of cases by making decisions that are fair, reasoned, understandable, and that resolve the controversy at issue.
Do participants understand the orders given by the Court?
ACCESS AND FAIRNESS SURVEY
The next round of the survey will be conducted during late 2012 and early 2013 with statewide results available in mid-2013.
The measure for the Excellence goal is the final statement in the Fairness section of the Access and Fairness survey conducted in 2008 - “As I leave the court, I know what to do next in my case.” The Fairness Section of the survey was targeted to respondents who answered “Yes” to the question “Did you appear in front of a judicial officer today?” Overall, eighty-five percent (85%) of respondents agreed or strongly agreed with the statement.
Results from the first Access and Fairness survey are available on CourtNet and on the Public Web Site.
Excellence
38
FAIRNESS AND EQUITY
The Minnesota Judicial Branch will provide due process and equal protection of the law, and will ensure that individuals called for jury duty are representative of the population from which the jury is drawn.
Do participants perceive they were treated fairly, listened to and are they satisfied with the Court’s decision?
ACCESS AND FAIRNESS SURVEY
When the Access and Fairness Survey was conducted in 2008, at least 80% of respondents agreed or strongly agreed with all fairness section statements.
Responses varied by demographic groups and locations, specifically role and race of respondents, as well as by county size4 and response rate.
The next round of the survey will be conducted during late 2012 and early 2013 with statewide results available in mid-2013.
The Fairness Section of the Access and Fairness survey was targeted to respondents who answered “Yes” to the question of “Did you appear in front of a judicial officer today?”
Statewide, at least eight in ten (80%) respondents agreed or strongly agreed with all statements in the fairness section. The statements with the highest percentage of agreement were:
As I leave the court, I know what to do next about my case (85%)
I was treated the same as everyone else (84%)
An index score was calculated to put all questions in the Fairness section together on a scale of 0-100. There was wider variation in index scores by respondents in various demographic groups, ranging from 89 to 79. The highest index scores belonged to the following demographic groups:
Attorneys representing a client (89)
Law enforcement/probation/social service staff (87)
Respondents in Small Courts5 (86)
The demographic groups with the lowest fairness index scores statewide were:
Locations with response rates of less than 50% (79)
Asian or Native Hawaiian or Pacific Islander respondents (79)
Victims (79)
Complete results from the first Access and Fairness survey are available on CourtNet and on the Public Web Site.
4 County size categories from the 2nd quarter 2008 judicial WCL (Small, Medium, Large) 5 Responses from court customers in counties categorized as Small in the 2008/2 WCL.
Fairness and Equity

39
Are jurors representative of our communities?
JURY POOLS
The jurors who report to court are similar racially and ethnically compared to the population of the communities in Minnesota.
Nearly all jurors complete the race and Hispanic/Latino ethnicity information on questionnaires. Data collected for ethnicity has improved from missing 12% in 2007 to missing only 1% in 2011.
There are slightly more female jurors and slightly fewer male jurors than are in communities in Minnesota.
Demographics of jurors based on returned questionnaires come from the jury management system. The chart below compares the racial breakdown of the population as reported in the 2010 American Community Survey to the jurors who reported for service in calendar year 2011, returned their questionnaires, and reported their race.
The decennial census no longer collects the detailed information that is needed to match as many criteria as possible to the characteristics of people eligible to serve on juries. Instead, the American Community Survey (ACS) is conducted annually on a portion of the population to collect much of the information that used to be on the ‘long form’ census. Only larger locations and the state as a whole can be reported by race using the specific criteria that closely resemble those eligible for jury service (see appendix for all county-level juror data).
Figure 5.1: 2011 Juror Racial Comparison with 2010 American Community Survey Estimates
* Total Jurors with and without race reported.
Source: 2010 American Community Survey micro data estimates compiled by Minnesota State Demographic Center Population ages 18 to 70, not institutionalized, citizens, speak English at home or speak English "very well" or "well"
Reported Jurors = All jurors who report for service and return questionnaire (may or may not be in voir dire) (Source: JURY+ Next Generation reports)
White Black Hispanic
American Indian
Asian/Pacific Islander
Other & 2+ Races
Total*
2010 ACS
CY11 Jurors
2010 ACS
CY11 Jurors
2010 ACS
CY11 Jurors
2010 ACS
CY11 Jurors
2010 ACS
CY11 Jurors
2010 ACS
CY11 Jurors
CY11 Jurors
Minnesota 89.6% 90.2% 3.4% 3.0% 2.1% 1.7% 1.0% 1.0% 2.3% 2.4% 1.7% 1.8% 43,629
Anoka 90.4% 90.7 % 3.4% 2.4 % 1.9% 1.7% .5% .9% 2.4% 2.6% 1.3% 1.7% 1,154
Carver-Scott 92.9% 94.2% 1.4% .5% .9% .8% .7% .9% 3.2% 2.6% .9% 1.0% 1,329
Dakota 88.5% 91.4% 2.3% 1.8% 2.9% 1.9% .3% .3% 3.2% 2.5% 2.8% 2.0% 1,787
Hennepin 82.4% 81.2% 8.1% 7.9% 2.6% 2.4% .7% 1.0% 3.5% 4.2% 2.7% 3.3% 8,304
Olmsted 90.9% 91.2% 2.6% 1.4% 2.0% 2.2% 0% .7% 3.3% 2.7% 1.2% 1.8% 1,472
Ramsey 80.0% 80.1% 7.8% 6.9% 3.7% 3.1% .7% .7% 5.6% 6.4% 2.2% 2.8% 6,265
St. Louis 93.1% 96.5% .9% .3% 1.4% .8% 2.3% 1.0% .4% 0.4% 1.8% 1.0% 2,912
Stearns-Benton 94.0% 97.7% 3.4% .6% .6% .7% .2% .2% 1.6% .4% .2% .4% 2,527
Washington 92.0% 92.4% 1.7% 1.4% 1.8% 1.8% .3% .5% 2.9% 2.4% 1.2% 1.4% 1,320
Fairness and Equity

40
Of the counties or areas that are large enough to meet the demographic criteria, White jurors are very slightly over-represented compared to the population in Carver-Scott, Dakota, St. Louis and Stearns-Benton Counties as well as the state as a whole. White jurors are very slightly under-represented in Hennepin County. Hennepin and Ramsey Counties have more Asian/Pacific Islander and Multi-racial/Other jurors than in the population.
Statewide, only 1% of jurors had missing race information for 2011. The calculation for percent of jurors by race excludes those who did not report race6. There is very little variation on missing race among districts (.1% to 2.2%) as shown in the appendix. The percent of jurors with missing race has improved dramatically since 2007 when a district had 60% of jurors with missing race data. Hispanic ethnicity is asked separately on the juror questionnaire. Three percent of all jurors (3.3%) did not answer the ethnicity question – (Hispanic/Latino) - which is an improvement compared to 8% of Hispanic/Latino missing data in 2008 and 12% in 2007.
Figure 5.2: Comparison of 2011 Jurors’ Gender to Census Results
There are slightly more female jurors than are in communities across the state with some variation by location as shown in Figure 5.2. Statewide, the overrepresentation of females is less than 1%. Carver-Scott, St. Louis and Stearns-Benton Counties have the largest difference between the census and female jurors in areas for which census information is available. Hennepin, Olmsted and Ramsey Counties have a very slight underrepresentation of female jurors/ overrepresentation of males compared to the census estimates.
6 Percent of race for jurors is calculated by subtracting out those who did not complete the race question so it equals the number of jurors by race divided by the total number of jurors who completed the race section.
% Female % Male
2010 ACS
2011 Jurors
2010 ACS
2011 Jurors
Minnesota 50.4% 51.2% 49.6% 48.8%
Anoka 51.0% 52.1% 49.0% 47.9%
Carver-Scott 50.9% 53.5% 49.1% 46.5%
Dakota 50.7% 52.0% 49.3% 48.0%
Hennepin 51.0% 50.1% 49.0% 49.9%
Olmsted 53.0% 52.7% 47.0% 47.3%
Ramsey 51.9% 51.5% 48.1% 48.5%
St Louis 48.8% 51.6% 51.2% 48.4%
Stearns-Benton 48.2% 52.0% 51.8% 48.0%
Washington 50.6% 52.3% 49.4% 47.7%
Fairness and Equity
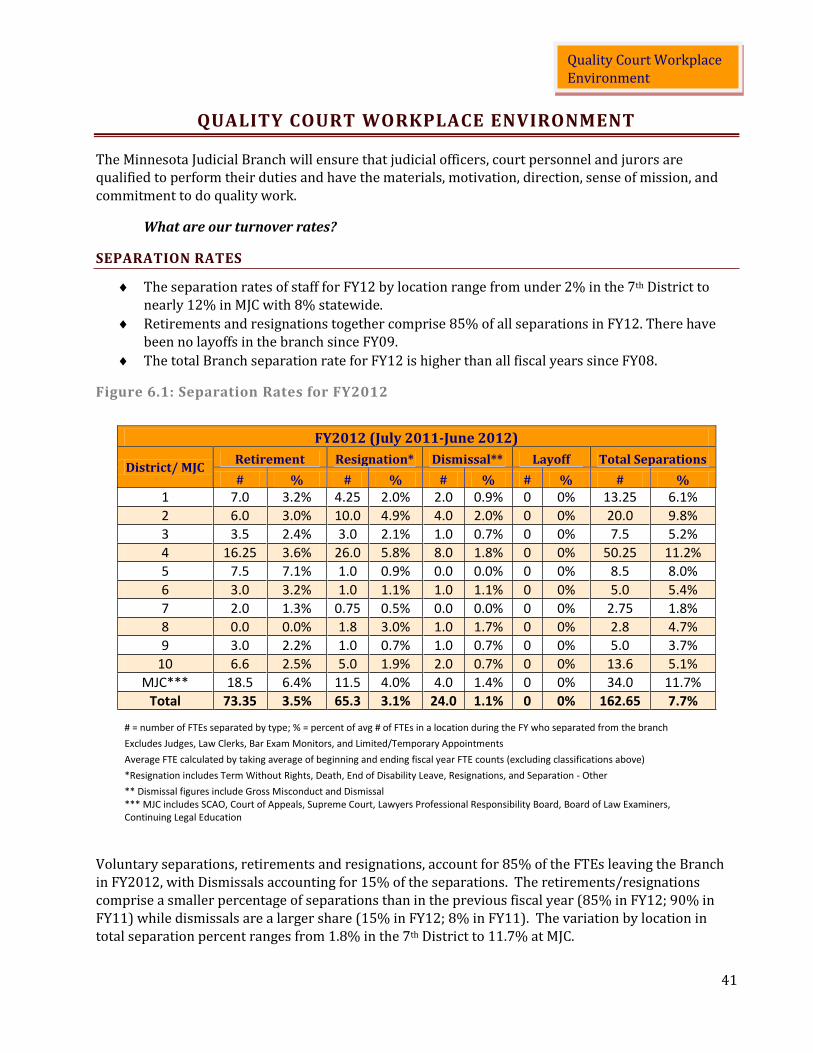
41
QUALITY COURT WORKPLACE ENVIRONMENT
The Minnesota Judicial Branch will ensure that judicial officers, court personnel and jurors are qualified to perform their duties and have the materials, motivation, direction, sense of mission, and commitment to do quality work.
What are our turnover rates?
SEPARATION RATES
The separation rates of staff for FY12 by location range from under 2% in the 7th District to nearly 12% in MJC with 8% statewide.
Retirements and resignations together comprise 85% of all separations in FY12. There have been no layoffs in the branch since FY09.
The total Branch separation rate for FY12 is higher than all fiscal years since FY08.
Figure 6.1: Separation Rates for FY2012
Voluntary separations, retirements and resignations, account for 85% of the FTEs leaving the Branch in FY2012, with Dismissals accounting for 15% of the separations. The retirements/resignations comprise a smaller percentage of separations than in the previous fiscal year (85% in FY12; 90% in FY11) while dismissals are a larger share (15% in FY12; 8% in FY11). The variation by location in total separation percent ranges from 1.8% in the 7th District to 11.7% at MJC.
FY2012 (July 2011-June 2012)
District/ MJC Retirement Resignation* Dismissal** Layoff Total Separations
# % # % # % # % # %
1 7.0 3.2% 4.25 2.0% 2.0 0.9% 0 0% 13.25 6.1%
2 6.0 3.0% 10.0 4.9% 4.0 2.0% 0 0% 20.0 9.8%
3 3.5 2.4% 3.0 2.1% 1.0 0.7% 0 0% 7.5 5.2%
4 16.25 3.6% 26.0 5.8% 8.0 1.8% 0 0% 50.25 11.2%
5 7.5 7.1% 1.0 0.9% 0.0 0.0% 0 0% 8.5 8.0%
6 3.0 3.2% 1.0 1.1% 1.0 1.1% 0 0% 5.0 5.4%
7 2.0 1.3% 0.75 0.5% 0.0 0.0% 0 0% 2.75 1.8%
8 0.0 0.0% 1.8 3.0% 1.0 1.7% 0 0% 2.8 4.7%
9 3.0 2.2% 1.0 0.7% 1.0 0.7% 0 0% 5.0 3.7%
10 6.6 2.5% 5.0 1.9% 2.0 0.7% 0 0% 13.6 5.1%
MJC*** 18.5 6.4% 11.5 4.0% 4.0 1.4% 0 0% 34.0 11.7%
Total 73.35 3.5% 65.3 3.1% 24.0 1.1% 0 0% 162.65 7.7%
# = number of FTEs separated by type; % = percent of avg # of FTEs in a location during the FY who separated from the branch Excludes Judges, Law Clerks, Bar Exam Monitors, and Limited/Temporary Appointments
Average FTE calculated by taking average of beginning and ending fiscal year FTE counts (excluding classifications above) *Resignation includes Term Without Rights, Death, End of Disability Leave, Resignations, and Separation - Other
** Dismissal figures include Gross Misconduct and Dismissal *** MJC includes SCAO, Court of Appeals, Supreme Court, Lawyers Professional Responsibility Board, Board of Law Examiners, Continuing Legal Education
Quality Court Workplace Environment

42
Figure 6.2: Total Separation Rates by District for FY08 to FY12
There are many different ways to calculate turnover rates (or separation rates.) So, not all numbers are exactly comparable, especially those that report figures by month instead of annually. The annual separation rate of 7.7% for the Branch is roughly estimated at .6% per month. This compares to a rough average of 3% per month for all industries across the U.S. in 2011 and early 2012.
The total separation rate has increased to 7.7% in FY12 from 6.2% in FY11 and even lower rates in FY09 and FY10.
Figure 6.3: Statewide Separation Rates by Type for FY08 to FY12
The trends by type of separation from the branch have remained fairly steady over the past five fiscal years; however, retirements and dismissals increased in FY12 compared to FY11.
District/MJC
FY12 %
FY11 %
FY10 %
FY09 %
FY08 %
1 6.1% 4.4% 3.2% 5.4% 7.7% 2 9.8% 7.1% 2.3% 4.7% 10.2% 3 5.2% 6.6% 1.4% 4.9% 16.3% 4 11.2% 8.4% 4.6% 5.4% 9.2% 5 8.0% 1.8% 7.7% .8% 8.7% 6 5.4% 9.3% 7.7% 11.2% 7.2% 7 1.8% 4.8% 2.6% 6.4% 3.2% 8 4.7% 7.9% 1.5% 8.1% 4.2% 9 3.7% 7.8% 4.0% 5.1% 4.9%
10 5.1% 5.5% 4.9% 4.6% 8.5% MJC 11.7% 3.9% 2.3% 4.2% 6.7% Total 7.7% 6.2% 3.8% 5.2% 8.2%
Separation Type
FY12 %
FY11 %
FY10 %
FY09 %
FY08 %
Retirement 3.5% 2.5% 1.4% 2.3% 2.6%
Resignation 3.1% 3.1% 1.5% 2.4% 4.3%
Dismissal 1.1% .5% .9% .3% 1.0%
Layoff 0% 0% 0% .3% .3%
Total 7.7% 6.2% 3.8% 5.2% 8.2%
Quality Court Workplace Environment

43
Do employees and judicial officers express satisfaction in their positions?
QUALITY COURT WORKPLACE SURVEY RESULTS
Over 2,200 survey responses were received from employees and justices/judges when the Quality Court Workplace (QCW) survey was conducted in September 2008.
Discussions regarding conducting the next QCW survey are underway with the Judicial Council. Results will be available before the end of fiscal year 2013.
The Quality Court Workplace Survey was conducted September 8 – 24, 2008. The employee version of the survey had 2,036 responses and the judge/justice version received 213 responses. Results from the survey are available on CourtNet.
The Priority Measure for the Quality Court Workplace Environment goal, in the review process, was to internally review the results of the QCW survey within a district/office (e.g. MJC) and report on action plans developed and progress toward meeting the goals of the plan.
Quality Court Workplace Environment

44
“Minor Civil cases declined in their clearance rate in 2011 …
and did not meet the 100% objective as they did in 2010 … because many Implied Consent cases were unresolved due to
the source code issue.” 4th District
The continuing shortage of district public defense resources has had an impact on major criminal case dispositions.
1st District
USING PERFORMANCE MEASURES FOR ADMINISTRATION
Reviews of performance measure results are reported twice per year to the Judicial Council.
Lack of Public Defender and other justice partner resources, and the Intoxilyzer Source Code issue are mentioned most frequently for Criminal cases for timing measures that exceed the objectives.
Some of the tactical strategies implemented based on results are district-specific plans for reviewing and handling of continuances; greater use of reports by judges and court administration; and several actions related to CHIPS cases including staff training on data quality and case management system issues, reviewing processes, and increased collaboration with social service and county attorney partners.
The Key Results and Measures, Priority Measures for Implementation plan was updated for FY2012-FY2013 to include direction to review timing and survey measures and report any actions taken based on the results to the Judicial Council two times each year. This reporting includes a written review due in March of each year and an oral review in September. DISTRICT/APPELLATE COURTS REVIEW OF RESULTS
For the Spring 2012 written reviews, each district received a template with statewide results included to use to summarize their district results and compare them to the statewide figures. Online stoplight reports were available for the first time for this review. These stoplight reports provide current and trend data for Age of Pending Cases, Time to Disposition and Clearance Rates and show county-level results in data form and with green, yellow or red lights in tabular and map formats. These online reports allow users to see at a glance where problems might exist.
Included in the template was a place to provide narrative feedback from districts and appellate courts based on findings of their reviews. These completed forms are available on CourtNet.
Red Lights Statewide, at the end of 2011 results show only two measures with “red lights,” Age of Pending for Major Criminal cases, and Length of Time to Permanency for children on Permanency TPR or non-TPR cases. Several districts also had red lights in these same two areas, but few others. Most districts noted improvements compared to 2010 or consistently positive results. Shortage of Resources and Source Code Cases
Shortages of judicial resources, public defenders and other justice partner staff reductions were mentioned less frequently in reports of 2011 results than in 2010. However, these shortages and vacancies due to judicial retirements, in addition to the ongoing appellate review of source code cases are still a concern.
Implementation

45
Judicial Resources, Business Practices and Data Quality Changes Districts and Appellate Courts also noted that business practice and/or data quality issues have sometimes contributed to timing measures being below objectives, in the past or currently. Examples include:
The 2nd District studied cases on the Length of Time to Permanency report since it was the one area in the district with a red light. Older cases were given a great deal of scrutiny by judges and staff to better understand the data in the 2011 report. Several improvement efforts were implemented including cleaning up incorrect data, training for judges and court staff to understand the importance of managing these cases and ongoing review of pending reports. Results are showing improvement after these efforts; as much as a 34% improvement in moving children to permanency in 0-6 months.
The 3rd District moved judicial resources within the district and utilized retired judges which have “helped us to generally remain above water with the exception of major criminal.” There has also been close collaboration with prosecutors in Steele County to deal with the large percent of cases pending past the timing objectives.
The 4th District is “in the process of becoming a paperless or paper-on-demand court”, as well as utilizing e-filing in Civil and Family court. These initiatives necessitate reviews of business processes which have brought “new, more efficient methods” into these courts.
The 5th District reviewed Juvenile Delinquency cases that were pending beyond the 99th percentile. Some of the cases have been closed, some were set for hearings in the next two months and the remaining are being reviewed for reporting accuracy.
The 6th District reviewed Minor Criminal cases since the time to disposition results were not as high as the state average. These results may have been impacted by continuing cleanup activity in the district.
The 9th District has performance measures as a standing agenda item on District Judges’ and Court Administrator meetings. District staff is also working with individual counties on data clean-up.
The Anoka Bench approved a new civil block assignment system which was to go into effect July 1 and civil numbers were expected to improve as a result.
Implementation

46
Figure 7.1: Example of Time to Disposition Stoplight Report
On-going Review Several districts report that they have implemented on-going review of results and the underlying data. Continuous review of timing measures can be accomplished using the Trial Court Reports (MNJAD reports) on CourtNet.
All Trial Court Reports include the ability to “drill-through” to individual case names and numbers to assist with finding causes for particular results. Three reports are also available in a “stoplight report” version as shown in Figure 7.1
The following chart lists the reports for four of the timeliness measures:
Performance Measure Report Title (MNJAD Reports)
Summary or Details Date Availability Locations/ Breakdowns Available (plus statewide)
Clearance Rates – Tabular and Stoplight Version
Summary or drill-through to details
Monthly or Annually District, County or Court
Time to Disposition – Tabular and Stoplight Version
Summary or drill-through to details
Calendar year or any rolling 12 months
District, County or Court
Age of Pending – Tabular and Stoplight Version
Summary (Details available via Pending Caseload Report)
Current as of most recent warehouse load (loads weekly); quarterly archived data available by request
District, County, Court or Judge
Length of Time to Permanency
Summary or drill-through to details
Any month or year combination
District, County, Court or Judge
Implementation

47
DATA DETAILS (APPENDIX)
JUDICIAL COUNCIL POLICIES 505, 505A, 505B
Minnesota Judicial Branch Policy
Policy Source: Judicial Council
Policy Number: 505
Category: Court Operations
Title: Core Judicial Branch Goals
Effective Date: October 21, 2005
Revision Date(s): July 21, 2006
Supersedes:
Core Judicial Branch Goals
I. POLICY STATEMENT
It is the policy of the Minnesota Judicial Branch to establish core performance goals and to monitor key results that measure progress toward meeting these goals in order to ensure accountability of the branch, improve overall operations of the court, and enhance the public’s trust and confidence in the judiciary. The six core judicial branch goals are:
1. Access to Justice: The Minnesota Judicial Branch will be open, affordable and understandable to ensure access to justice.
2. Timeliness: The Minnesota Judicial Branch will resolve cases and controversies in a timely and expeditious way without unnecessary delays.
3. Integrity and Accountability: The Minnesota Judicial Branch will ensure the integrity and accountability of its performance by maintaining a record system that is accurate, complete and timely.
Data Details

48
4. Excellence: The Minnesota Judicial Branch will achieve excellence in the resolution of cases by making decisions that are fair, reasoned, understandable, and that resolve the controversy at issue.
5. Fairness and Equity: The Minnesota Judicial Branch will provide due process and equal protection of the law, and will ensure that individuals called for jury duty are representative of the population from which the jury is drawn.
6. Quality Court Workplace Environment: The Minnesota Judicial Branch will ensure that judicial officers, court personnel and jurors are qualified to perform their duties and have the materials, motivation, direction, sense of mission, and commitment to do quality work.
II. IMPLEMENTATION AUTHORITY Implementation of this policy shall be the responsibility of the State Court Administrator and the chief judges of the respective judicial districts and appellate courts.
III. EXECUTIVE LIMITATION The State Court Administrator and the chief judges of the respective judicial districts and appellate courts will develop a plan for identifying key results, and collecting and reporting data that measure performance in meeting these results. This plan will be presented to the Judicial Council for approval before the beginning of each biennium.
Related Documents:
See documents 5.05a and 5.05b, which define the key results and measures for the Core Judicial Branch Goals.
Data Details

49
505a. TIMING OBJECTIVES FOR CASE DISPOSITIONS
Adopted by the Judicial Council on July 22, 20067
Amended by the Judicial Council on August 19, 2010
The Timing Objectives for Case Dispositions and Permanency Orders8 by Judicial District are as
follows:
Type of Case
Percentage of Cases to be Disposed of Within Set Time
Major Criminal Felony, Gross Misdemeanor 90% in 4 months 97% in 6 months 99% in 12 months Major Civil 90% in 12 months Personal Injury, Contract, Property Damage, Harassment, Other Civil 97% in 18 months 99% in 24 months Major Family Domestic Violence (Orders for Protection) 90% in 2 months 97% in 3 months 99% in 4 months Length of Time to State Ward Adoptions
9 60% in 24 months
Dissolution 90% in 12 months 97% in 18 months 99% in 24 months Major Juvenile 90% in 3 months Delinquency: Felony, Gross Misdemeanor, Misdemeanor 97% in 5 months 99% in 6 months Length of Time to Permanency Order 50% in 6 months 90% in 12 months 99% in 18 months Minor Criminal 90% in 3 months 5th Deg. Assault, Non-Traffic Misd or Petty, Misd. DWI, Other Traffic 97% in 6 months 99% in 9 months
7These timing objectives were formerly established by the Conference of Chief Judges, with the exception of
Minor Criminal. 8 “Permanency orders” means an order for one of the following: protective supervision with a parent after the
child was removed from the parent, trial home visit, reunification, transfer of permanent legal and physical custody to a relative, termination of parental rights, or long-term foster care. 9 Results not yet available
Data Details
Data Details

50
Minnesota Judicial Branch Policy
Policy Source: Minnesota Judicial Council Policy Number: 505b Category: Court Operations Title: Key Results and Measures Priority Measures for Implementation Effective Date: October 21, 2005 Revision Date(s): July 21, 2006; August 25, 2006, September 18, 2009 August 19, 2010; June 24, 2011
Supersedes:
Key Results and Measures: FY 2012-FY 2013
Priority Measures for Implementation
I. Goal 1: Access to Justice
Do participants perceive the courts to be accessible?
Conduct Access and Fairness Survey and report results by county.
Implement the next Access and Fairness Survey during FY12-FY13. The last statewide Access and Fairness surveys were conducted January – June 2008.
II. Goal 2: Timeliness
Do the trial courts hear and decide cases in a timely manner? Clearance rates reported by district, county and/or court house. Time to disposition reported by district, county and/or court house using timing
objectives approved by the Judicial Council. Age of pending reported by district, county and/or court house using timing
objectives approved by the Judicial Council. Backlog index reported by district, county and/or court house. Length of time to permanency for children placed out-of-home reported by district,
county and/or court house. Length of time to finalize adoption for children under the guardianship of the
Commissioner of Human Services reported by district, county, and/or court house. (when available)
Districts are to review these timing measures and report actions taken based on the results to the Judicial Council two times per year. One report should be written and the other verbal. Written reports are to be submitted in March of each year. Verbal reports are to be provided in September of each year.
Data Details

51
Does the Court of Appeals hear and decide cases in a timely manner?
Percent of dispositions using timing objectives approved by the Judicial Council. The Court of Appeals should review these timing measures and report actions taken based on the results to the Judicial Council two times per year. One report should be written and the other verbal. Written reports are to be submitted in March of each year. Verbal reports are to be provided in September of each year.
Does the Supreme Court hear and decide cases in a timely manner?
Percent of dispositions within time standards set by the Supreme Court.
The Supreme Court should review these timing measures and report actions taken based on the results to the Judicial Council two times per year. One report should be written and the other verbal. Written reports are to be submitted in March of each year. Verbal reports are to be provided in September of each year.
III. Goal 3: Integrity and Accountability
Is the electronic record system accurate, complete and timely?
Review of the Data Quality program and results.
IV. Goal 4: Excellence
Do participants understand the orders given by the Court?
Conduct Access and Fairness Survey. Implement the next Access and Fairness Survey during FY12-FY13. The last statewide Access and Fairness surveys were conducted January – June 2008.
V. Goal 5: Fairness and Equity
Do participants perceive they were treated fairly, listened to and are they satisfied with the Court’s decision?
Conduct Access and Fairness Survey. Implement the next Access and Fairness Survey during FY12-FY13. The last statewide Access and Fairness surveys were conducted January – June 2008.
Are jurors representative of our communities?
Race and gender breakdowns of jury pools compared to population data available by county using jury management system and Census data.
Data Details

52
VI. Goal 6: Quality Court Workplace Environment
Do employees and judicial officers express satisfaction in their positions?
Conduct Court Employee Satisfaction Survey and report results by county or clusters of counties for small counties.
The Judicial Council postponed future implementation of the Quality Court Workplace survey in September 2010. No specific date has been set to resume planning for this survey.
What are our turn-over rates?
Percent of employees who leave the courts each year reported by district.
VII. Reporting of Key Results and Measures
An annual report will be produced that measures progress toward meeting these six goals in order to ensure accountability of the branch, improve overall operations of the court, and enhance the public’s trust and confidence in the judiciary. The first annual report was finalized in January, 2009. The second annual report was presented in August 2010 and the third annual report will be presented to the Council in Summer 2011. Districts and Appellate Courts should report results and action plans developed based on results two times per year. Written reports shall be submitted in March and verbal reports shall be given in September.
Data Details

53
STATEWIDE CLEARANCE RATES FOR 2011
WCL Category Clearance
Rate Beginning
Pending Filings Dispositions
Ending Pending
Serious Felony 104.2 % 1,563 1,276 1,329 1,510
Felony DWI 99.7 % 527 730 728 529
Other Felony 98.5 % 23,442 25,962 25,582 23,823
Gross Misdemeanor DWI 99.3 % 9,108 13,652 13,555 9,205
Other Gross Misdemeanor 102.7 % 11,243 14,059 14,444 10,858
Major Criminal Total: 99.9 % 45,883 55,679 55,638 45,925
Personal Injury 102.5 % 4,618 3,339 3,424 4,533
Contract 109.3 % 4,683 9,982 10,911 3,754
Wrongful Death 113.5 % 165 178 202 141
Malpractice 100.9 % 103 106 107 102
Property Damage 86.5 % 143 377 326 194
Condemnation 135.7 % 190 112 152 150
Conciliation Appeal 106.3 % 404 697 741 360
Harassment 99.3 % 229 9,915 9,845 300
Employment 103.5 % 218 375 388 205
Other Civil 107.2 % 6,602 15,258 16,355 5,504
Major Civil Total: 105.2 % 17,355 40,339 42,451 15,243
Trust 102.3 % 491 432 442 481
Supervised Administration 99.4 % 789 538 535 792
Unsupervised Administration 97.7 % 539 2,950 2,882 606
Special Administration 89.8 % 163 226 203 186
Informal Probate 98.4 % 227 3,235 3,182 279
Estate/Other Probate 96.5 % 252 950 917 285
Guardianship/Conservatorship 98.4 % 772 2,671 2,627 811
Commitment 100.0 % 253 4,110 4,109 254
Major Probate Total: 98.6 % 3,486 15,112 14,897 3,694
Dissolution with Child 104.0 % 3,918 8,846 9,197 3,565
Dissolution without Child 101.3 % 1,771 8,075 8,178 1,666
Support 101.8 % 3,226 15,391 15,669 2,944
Adoption 99.3 % 275 1,500 1,489 286
Other Family 94.9 % 1,174 3,550 3,368 1,353
Other Juvenile 0.0% 1 0 0 1
Domestic Abuse 99.6 % 235 10,959 10,918 275
Major Family Total: 101.0 % 10,600 48,321 48,819 10,090
Delinquency Felony 100.5 % 1,304 4,059 4,078 1,285
Delinquency Gross Misdemeanor 102.5 % 430 1,491 1,529 392
Delinquency Misdemeanor 99.8 % 2,223 11,120 11,099 2,244
Status Offense 97.8 % 3,159 17,157 16,784 3,531
Dependency/Neglect 95.0 % 3,184 4,587 4,356 3,414
Term. of Parental Rights 0.0% 24 0 6 18
Permanency 0.0% 0 0 0 0
Permanency - TPR 94.4 % 414 1,145 1,081 478
Permanency - Non TPR 100.3 % 198 773 775 196
Data Details

54
CHIPS - Delinquency Under 10 0.0% 7 0 0 7
Truancy 101.9 % 541 1,918 1,955 505
Runaway 103.5 % 108 400 414 94
Major Juvenile Total: 98.7 % 11,592 42,650 42,077 12,164
Unlawful Detainer 100.0 % 796 22,437 22,444 793
Implied Consent 89.2 % 3,843 4,749 4,234 4,358
Transcript Judgment 96.4 % 155 24,459 23,569 619
Default Judgment 99.5 % 783 34,237 34,060 958
Conciliation 100.5 % 10,234 53,072 53,350 9,955
Minor Civil Total: 99.1 % 15,811 138,954 137,657 16,683
5th Degree Assault 101.6 % 7,483 13,109 13,321 7,271
Other Non-Traffic 101.1 % 108,936 128,092 129,519 107,505
Misdemeanor DWI 94.8 % 11,788 27,158 25,754 13,192
Other Traffic 97.7 % 237,249 759,829 742,401 254,661
Juvenile Traffic 97.4 % 3,747 9,385 9,145 3,991
Parking 127.0 % 429,004 406,375 516,126 319,250
Minor Criminal Total: 106.9 % 798,207 1,343,948 1,436,266 705,870
Grand Total: 105.5 % 902,934 1,685,003 1,777,805 809,669
Data Details

55
CLEARANCE RATES BY DISTRICT 2007 - 2011
District 1 Clearance Rates
Case Group 2007 2008 2009 2010 2011
Major Criminal 98.8% 95.3% 105.1% 106.2% 94.6%
Major Civil 94.8% 97.6% 105.8% 99.8% 99.7%
Probate/MH 111.2% 124.9% 112.1% 181.3% 98.2%
Family 97.0% 111.4% 100.9% 102.3% 100.9%
Juvenile 93.0% 100.6% 100.9% 100.4% 97.9%
Minor Civil 98.2% 99.4% 102.3% 100.4% 100.0%
Minor Criminal 100.4% 97.4% 97.4% 97.1% 95.7%
Total 99.7% 98.3% 98.8% 98.8% 96.5%
District 2 Clearance Rates
Case Group 2007 2008 2009 2010 2011
Major Criminal 103.7% 87.1% 103.5% 96.0% 108.5%
Major Civil 87.3% 89.7% 94.9% 100.3% 105.0%
Probate/MH 106.0% 108.9% 105.8% 96.4% 99.7%
Family 105.1% 96.3% 101.2% 101.4% 101.9%
Juvenile 86.4% 97.4% 119.0% 97.3% 98.2%
Minor Civil 90.5% 101.3% 103.5% 101.4% 99.1%
Minor Criminal 110.7% 82.4% 81.2% 85.1% 114.8%
Total 108.9% 84.0% 83.7% 86.7% 113.3%
District 3 Clearance Rates
Case Group 2007 2008 2009 2010 2011
Major Criminal 104.8% 107.0% 102.4% 101.2% 105.0%
Major Civil 97.9% 99.1% 102.6% 100.2% 103.4%
Probate/MH 104.0% 103.9% 101.2% 101.7% 97.1%
Family 104.3% 100.8% 98.8% 103.4% 102.0%
Juvenile 98.6% 104.7% 100.4% 102.2% 97.9%
Minor Civil 99.4% 97.4% 101.3% 102.8% 100.8%
Minor Criminal 102.2% 103.9% 103.7% 100.4% 97.8%
Total 102.0% 103.5% 102.9% 100.9% 99.0%
District 4 Clearance Rates
Case Group 2007 2008 2009 2010 2011
Major Criminal 91.5% 100.0% 99.7% 96.9% 97.5%
Major Civil 98.2% 91.6% 95.3% 96.7% 111.1%
Probate/MH 99.4% 106.3% 110.0% 99.2% 99.4%
Family 103.6% 101.1% 100.9% 99.0% 100.4%
Juvenile 112.3% 104.2% 111.5% 97.8% 96.8%
Minor Civil 99.1% 100.3% 99.8% 102.8% 96.5%
Minor Criminal 93.9% 91.8% 95.8% 91.9% 113.3%
Total 94.7% 92.8% 96.5% 92.9% 111.5%
District 5 Clearance Rates
Case Group 2007 2008 2009 2010 2011
Major Criminal 102.2% 104.8% 101.8% 102.3% 96.2%
Major Civil 98.4% 101.0% 101.8% 97.9% 105.5%
Probate/MH 104.3% 105.8% 111.3% 114.6% 102.8%
Family 98.5% 100.1% 99.4% 98.8% 101.3%
Juvenile 93.8% 102.6% 101.4% 100.0% 100.9%
Minor Civil 98.1% 101.2% 99.4% 101.7% 97.7%
Minor Criminal 97.6% 99.6% 102.4% 102.2% 98.8%
Total 97.9% 100.3% 102.0% 102.0% 99.1%
District 6 Clearance Rates
Case Group 2007 2008 2009 2010 2011
Major Criminal 100.3% 104.2% 97.6% 97.1% 96.7%
Major Civil 102.2% 101.4% 99.3% 94.6% 103.4%
Probate/MH 135.0% 124.6% 101.1% 101.4% 100.9%
Family 104.7% 101.3% 99.9% 102.2% 98.8%
Juvenile 97.0% 101.8% 96.9% 104.3% 95.1%
Minor Civil 93.5% 109.4% 93.3% 100.2% 98.5%
Minor Criminal 96.5% 101.6% 88.0% 80.4% 90.1%
Total 97.1% 102.1% 90.7% 86.8% 93.0%
Data Details

56
District 7 Clearance Rates
Case Group 2007 2008 2009 2010 2011
Major Criminal 99.0% 105.0% 106.0% 98.0% 100.5%
Major Civil 96.1% 104.9% 102.8% 101.3% 101.5%
Probate/MH 120.6% 122.3% 103.6% 110.7% 97.7%
Family 99.8% 101.9% 98.3% 101.5% 100.8%
Juvenile 93.7% 103.8% 100.1% 100.1% 100.5%
Minor Civil 96.2% 100.9% 100.6% 102.6% 101.4%
Minor Criminal 97.5% 97.9% 101.4% 98.8% 97.1%
Total 97.7% 99.7% 101.5% 99.2% 98.4%
District 8 Clearance Rates
Case Group 2007 2008 2009 2010 2011
Major Criminal 104.3% 99.7% 101.4% 98.6% 96.5%
Major Civil 98.9% 103.8% 101.8% 100.8% 102.4%
Probate/MH 121.1% 108.9% 105.2% 98.6% 97.5%
Family 100.4% 100.6% 100.2% 97.4% 102.6%
Juvenile 100.9% 104.8% 98.0% 98.1% 105.0%
Minor Civil 99.1% 99.8% 101.6% 98.3% 100.3%
Minor Criminal 100.1% 102.5% 100.6% 98.8% 96.5%
Total 100.7% 102.3% 100.8% 98.7% 97.8%
District 9 Clearance Rates
Case Group 2007 2008 2009 2010 2011
Major Criminal 102.8% 108.1% 102.6% 97.3% 102.5%
Major Civil 96.8% 96.3% 101.6% 101.7% 99.5%
Probate/MH 100.5% 131.4% 105.1% 99.3% 95.5%
Family 97.9% 101.6% 101.2% 100.7% 98.7%
Juvenile 98.3% 107.7% 100.0% 101.5% 103.1%
Minor Civil 99.0% 98.6% 98.3% 100.2% 101.0%
Minor Criminal 100.3% 103.5% 100.4% 99.2% 95.8%
Total 100.0% 103.7% 100.4% 99.5% 97.5%
District 10 Clearance Rates
Case Group 2007 2008 2009 2010 2011
Major Criminal 104.6% 102.8% 108.6% 100.1% 101.0%
Major Civil 91.6% 100.7% 100.3% 99.8% 106.8%
Probate/MH 98.1% 107.3% 128.0% 97.9% 96.9%
Family 99.7% 100.8% 99.9% 99.7% 102.6%
Juvenile 94.6% 105.5% 104.5% 100.9% 99.3%
Minor Civil 96.7% 99.4% 99.7% 100.5% 99.9%
Minor Criminal 98.4% 96.3% 100.4% 97.3% 94.7%
Total 98.3% 97.9% 101.0% 98.2% 96.6%
Data Details

57
TIME TO DISPOSITION STATEWIDE 2011
This statewide report of 2011 dispositions includes dispositions entered in MNCIS (regardless of system where case was filed) but excludes dispositions in ViBES.
WCL Case Category 90th Percentile 97th Percentile 99th Percentile Beyond 99th Total
Obj Cases % Obj Cases Cum
% Obj Cases Cum % Cases % Cases
Avg Days
Serious Felony 4 221 16.6% 6 220 33.2% 12 531 73.1% 357 26.9% 1,329 294
Felony DWI 4 277 38.0% 6 169 61.3% 12 203 89.1% 79 10.9% 728 197
Other Felony 4 11,136 43.5% 6 4,986 63.0% 12 6,948 90.2% 2,507 9.8% 25,577 181
Gross Misd DWI 4 8,481 62.6% 6 2,414 80.5% 12 2,165 96.4% 481 3.6% 13,541 122
Other Gross Misd 4 8,915 61.8% 6 2,340 78.0% 12 2,561 95.7% 617 4.3% 14,433 128
Major Criminal Total:
29,030 52.2%
10,129 70.4%
12,408 92.7% 4,041 7.3% 55,608 156
Personal Injury 12 2,653 77.5% 18 503 92.2% 24 140 96.3% 128 3.7% 3,424 331
Contract 12 10,162 93.1% 18 460 97.4% 24 156 98.8% 132 1.2% 10,910 134
Wrongful Death 12 146 72.3% 18 31 87.6% 24 8 91.6% 17 8.4% 202 271
Malpractice 12 54 50.5% 18 30 78.5% 24 15 92.5% 8 7.5% 107 412
Property Damage 12 281 86.2% 18 34 96.6% 24 5 98.2% 6 1.8% 326 175
Condemnation 12 94 61.8% 18 22 76.3% 24 6 80.3% 30 19.7% 152 483
Conciliation Appeal 12 667 90.0% 18 53 97.2% 24 15 99.2% 6 0.8% 741 197
Harassment 12 9,795 99.9% 18 7 99.9% 24 3 100.0% 3 0.0% 9,808 10
Employment 12 328 84.5% 18 48 96.9% 24 6 98.5% 6 1.5% 388 199
Other Civil 12 15,133 92.5% 18 589 96.1% 24 220 97.5% 412 2.5% 16,354 149
Major Civil Total:
39,313 92.7%
1,777 96.9%
574 98.2% 748 1.8% 42,412 132
Dissolution w/Child 12 8,253 89.8% 18 639 96.7% 24 194 98.8% 109 1.2% 9,195 158
Dissolution w/o Child 12 7,844 96.0% 18 234 98.9% 24 48 99.4% 45 0.6% 8,171 80
Domestic Abuse 2 10,698 98.1% 3 97 99.0% 4 45 99.4% 63 0.6% 10,903 10
Major Family Total:
26,795 94.8%
970 98.2%
287 99.2% 217 0.8% 28,269 78
Delinquency Felony 3 2,766 67.9% 5 729 85.7% 6 193 90.5% 388 9.5% 4,076 86
Delinq Gross Misd 3 1,171 76.6% 5 209 90.3% 6 42 93.0% 107 7.0% 1,529 70
Delinquency Misd 3 9,512 85.7% 5 1,079 95.5% 6 197 97.2% 306 2.8% 11,094 51
Major Juvenile Total:
13,449 80.5%
2,017 92.6%
432 95.2% 801 4.8% 16,699 62
5th Degree Assault 3 6,164 54.7% 6 3,152 82.6% 9 1,191 93.2% 771 6.8% 11,278 111
Other Non-Traffic 3 67,779 76.3% 6 13,477 91.4% 9 4,113 96.1% 3,493 3.9% 88,862 77
Misdemeanor DWI 3 11,264 71.9% 6 2,992 91.0% 9 821 96.2% 595 3.8% 15,672 82
Other Traffic 3 296,732 92.9% 6 16,332 98.0% 9 3,695 99.1% 2,747 0.9% 319,506 39
Juvenile Traffic 3 5,005 94.0% 6 250 98.7% 9 34 99.3% 37 0.7% 5,326 40
Minor Criminal Total:
386,944 87.8%
36,203 96.0%
9,854 98.3% 7,643 1.7% 440,644 50
Grand Total 495,531 84.9 51,096 93.7 23,555 97.7 13,450 2.3 583,632 68
Data Details

58
TIME TO DISPOSITION BY DISTRICT 2011
1st District-Time to Disposition 2011
WCL Case Type 90th Percentile 97th Percentile 99th Percentile Beyond 99th Total
Obj Cases % Obj Cases Cum
% Obj Cases
Cum %
Cases % Cases Avg
Days
Major Criminal 4 2,949 46.4 6 1,230 65.8 12 1,641 91.6 535 8.4 6,355 168
Major Civil 12 4,532 94.8 18 170 98.3 24 40 99.2 39 .8 4,781 110
Dissolutions 12 2,416 93.7 18 118 98.3 24 33 99.5 12 .5 2,579 97
Domestic Abuse 2 1,313 97.8 3 12 98.7 4 7 99.2 11 1.2 1,343 12
Juvenile 3 2,104 84.8 5 235 94.3 6 44 96.1 97 4.5 2,480 75
Minor Criminal 3 81, 621 92.7 6 4,585 97.9 9 1,176 99.3 657 1.1 88,039 44
Grand Total
94,935 89.9
6,350 95.9
2,941 98.7 1,351 1.3 105,577 58
2nd District-Time to Disposition 2011 – Includes all dispositions in MNCIS, but no Minor Criminal cases disposed in ViBES
WCL Case Type 90th Percentile 97th Percentile 99th Percentile Beyond 99th Total
Obj Cases % Obj Cases Cum
% Obj Cases
Cum %
Cases % Cases Avg
Days
Major Criminal 4 3,650 64.1 6 978 81.3 12 871 96.6 196 3.4 5,695 121
Major Civil 12 3,784 92.2 18 211 97.3 24 65 98.9 46 1.1 4,106 147
Dissolutions 12 1,347 94.5 18 58 98.5 24 13 99.4 8 0.6 1,426 118
Domestic Abuse 2 1,385 98.4 3 14 99.4 4 5 99.8 3 0.2 1,407 7
Juvenile 3 1,940 89.2 5 153 96.2 6 34 97.7 49 2.3 2,176 48
Minor Criminal 3 9,021 58.1 6 4,486 87.0 9 1,238 95.0 772 5.0 15,517 101
Grand Total
21,127 69.7
5,900 89.1
2,226 96.5 1,074 3.5 30,327 104
3rd District-Time to Disposition 2011
WCL Case Type 90th Percentile 97th Percentile 99th Percentile Beyond 99th Total
Obj Cases % Obj Cases Cum
% Obj Cases
Cum %
Cases % Cases Avg
Days
Major Criminal 4 2,303 45.1 6 967 64.0 12 1,188 87.3 649 12.7 5,107 185
Major Civil 12 3,057 92.8 18 136 96.9 24 52 98.5 49 1.5 3,294 97
Dissolutions 12 1,441 91.3 18 93 97.2 24 27 98.9 17 1.0 1,579 127
Domestic Abuse 2 757 98.6 3 3 99.0 4 3 99.3 5 .7 768 8
Juvenile 3 871 70.9 5 226 89.3 6 49 93.2 83 6.8 1,229 74
Minor Criminal 3 39,091 90.2 6 2,631 96.3 9 872 98.3 738 1.7 43,332 46
Grand Total
47,521 85.9
4,056 93.3
2,191 97.2 1,541 2.8 65.309 64
Data Details

59
4th District-Time to Disposition 2011– Includes all dispositions in MNCIS, but no Minor Criminal cases disposed in ViBES
WCL Case Type 90th Percentile 97th Percentile 99th Percentile Beyond
99th Total
Obj Cases % Obj Cases Cum
% Obj Cases
Cum %
Cases % Cases Avg
Days
Major Criminal 4 7,788 64.6 6 1,893 80.3 12 1,900 96.1 474 3.9 12,055 123
Major Civil 12 10,858 94.9 18 420 98.6 24 97 99.5 61 .5 11,436 138
Dissolutions 12 3,391 94.4 18 156 98.8 24 31 99.6 13 .4 3,591 105
Domestic Abuse 2 2,692 99.5 3 10 99.9 4 2 99.9 2 .1 2,706 7
Juvenile 3 2,334 75.4 5 494 91.3 6 94 94.3 175 5.7 3,097 71
Minor Criminal 3 33,146 72.2 6 8,695 91.1 9 2,494 96.5 1,594 3.5 45,929 78
Grand Total
60,209 76.4
11,668 91.2
4,618 97.1 2,319 2.9 78,814 92
5th District-Time to Disposition 2011
WCL Case Type 90th Percentile 97th Percentile 99th Percentile Beyond
99th Total
Obj Cases % Obj Cases Cum
% Obj Cases
Cum %
Cases % Cases Avg
Days
Major Criminal 4 1,557 53.5 6 510 71.1 12 623 92.5 218 7.5 2,908 157
Major Civil 12 1,911 89.8 18 111 95.1 24 35 96.7 70 3.3 2,127 129
Dissolutions 12 791 93.6 18 38 98.1 24 11 99.4 5 .6 845 100
Domestic Abuse 2 582 98.6 3 5 99.5 4 0 99.5 3 .5 590 7
Juvenile 3 1,042 81.1 5 131 91.3 6 38 94.2 74 5.8 1,285 67
Minor Criminal 3 30,814 94.3 6 1,182 97.9 9 281 98.8 389 1.2 32,666 38
Grand Total
36,697 90.8
1,977 95.7
988 98.1 759 1.9 40,421 53
6th District-Time to Disposition 2011
WCL Case Type 90th Percentile 97th Percentile 99th Percentile Beyond
99th Total
Obj Cases % Obj Cases Cum
% Obj Cases
Cum %
Cases % Cases Avg
Days
Major Criminal 4 1,817 56.1 6 590 74.3 12 632 93.8 200 6.2 3,239 145
Major Civil 12 2,454 93.0 18 100 96.7 24 34 98.0 52 2.0 2,640 102
Dissolutions 12 815 93.0 18 35 97.0 24 11 98.3 15 1.7 876 116
Domestic Abuse 2 598 96.3 3 9 97.7 4 4 98.4 10 1.6 621 16
Juvenile 3 664 83.4 5 87 94.3 6 15 96.2 30 3.8 796 54
Minor Criminal 3 25,288 86.6 6 2,269 94.4 9 762 97.0 867 3.0 29,186 54
Grand Total
31,636 84.7
3,090 93.0
1458 96.9 1,174 3.1 37,358 66
Data Details

60
7th District-Time to Disposition 2011
WCL Case Type 90th Percentile 97th Percentile 99th Percentile Beyond
99th Total
Obj Cases % Obj Cases Cum
% Obj Cases
Cum %
Cases % Cases Avg
Days
Major Criminal 4 2,464 42.8 6 1,099 61.9 12 1,634 90.2 563 9.8 5,760 183
Major Civil 12 2,872 93.2 18 122 97.1 24 46 98.6 42 1.4 3,082 101
Dissolutions 12 1,433 93.5 18 78 98.6 24 15 99.5 7 .5 1,533 117
Domestic Abuse 2 856 98.4 3 4 98.9 4 1 99.0 9 1.0 870 9
Juvenile 3 1,046 76.5 5 199 91.1 6 52 94.9 70 5.1 1,367 66
Minor Criminal 3 43,549 92.7 6 2,368 97.7 9 579 98.9 498 1.1 46,994 41
Grand Total
52,220 87.6
3,870 94.1
2,327 98.0 1,189 2.0 59,606 60
8th District-Time to Disposition 2011
WCL Case Type 90th Percentile 97th Percentile 99th Percentile Beyond
99th Total
Obj Cases % Obj Cases Cum
% Obj Cases
Cum %
Cases % Cases Avg
Days
Major Criminal 4 991 60.3 6 317 79.6 12 280 96.6 56 3.4 1,644 125
Major Civil 12 970 94.4 18 38 98.1 24 11 99.1 9 .9 1,028 89
Dissolutions 12 467 93.0 18 28 98.6 24 6 99.8 1 .2 502 111
Domestic Abuse 2 348 99.1 3 1 99.4 4 1 99.7 1 .3 351 6
Juvenile 3 311 80.2 5 37 89.7 6 13 93.0 27 7.0 388 64
Minor Criminal 3 14,790 94.7 6 636 98.7 9 118 99.5 81 .5 15,625 34
Grand Total
17,877 91.5
1,057 96.9
429 99.1 175 .9 19,538 47
9th District-Time to Disposition 2011
WCL Case Type 90th Percentile 97th Percentile 99th Percentile Beyond
99th Total
Obj Cases % Obj Cases Cum
% Obj Cases
Cum %
Cases % Cases Avg
Days
Major Criminal 4 2,629 54.1 6 911 72.9 12 954 92.5 363 7.5 4,857 156
Major Civil 12 2,955 92.3 18 107 95.7 24 43 97.0 95 3.0 3,200 142
Dissolutions 12 1,006 91.8 18 59 97.2 24 19 98.9 12 1.1 1,096 142
Domestic Abuse 2 917 96.6 3 12 97.9 4 9 98.8 11 1.2 949 13
Juvenile 3 1,144 77.9 5 183 90.4 6 48 93.7 93 6.3 1,468 67
Minor Criminal 3 33,895 92.7 6 1,856 97.8 9 494 99.1 323 .9 36,568 36
Grand Total
42,546 88.4
3,128 94.9
1,567 98.1 897 1.9 48,138 58
Data Details

61
10th District-Time to Disposition 2011
WCL Case Type 90th Percentile 97th Percentile 99th Percentile Beyond
99th Total
Obj Cases % Obj Cases
Cum %
Obj Cases Cum
% Cases % Cases
Avg Days
Major Criminal 4 2,882 36.1 6 1,634 56.5 12 2,685 90.1 787 9.9 7,988 194
Major Civil 12 5,920 88.1 18 362 93.5 24 151 95.8 285 4.2 6,718 172
Dissolutions 12 2,989 89.5 18 210 95.8 24 76 98.1 64 1.9 3,339 160
Domestic Abuse 2 1,250 96.3 3 27 98.4 4 13 99.4 8 .6 1,298 15
Juvenile 3 1,993 82.6 5 272 93.9 6 45 95.7 103 4.3 2,413 61
Minor Criminal 3 75,729 87.3 6 7,495 95.9 9 1,840 98.0 1,724 2.0 86,788 55
Grand Total
90,763 83.6
10,000 92.8
4,810 97.3 2,971 2.7 108,544 75
Data Details

62
TIME TO DISPOSITION BY ACTIVITY TYPE STATEWIDE 2011
Closed By Activity 90th
Percentile 97th Percentile 99th Percentile Beyond 99th Avg Tot
Cases % of
Case Type Cases % Cases Cum% Cases Cum% Cases % Days Disposed Total
Without Hrg Activity (64.8% of '11 Disps)
Major Criminal 963 94.0 11 95.6 13 97.4 18 2.6 89 705 .2%
Major Civil 18,540 96.3 386 98.3 88 98.8 234 1.2 86 19,248 6%
Major Family 12,551 99.2 73 99.8 10 99.9 16 0.1 26 12,650 4%
Major Juvenile 796 94.3 17 96.3 7 97.2 24 2.8 32 844 .3%
Minor Criminal 275,066 97.4 5,237 99.3 821 99.6 1,158 0.4 31 282,282 89%
State Total 307,616 97.4 5,724 99.2 939 99.5 1,450 0.5 33 315,729 100%
With Hrg Activity (34.3% of '11 Disps)
Major Criminal 28,155 52.8 9,834 71.3 11,746 93.3 3,578 6.7 152 53,313 21%
Major Civil 19,993 91.3 1,113 96.4 369 98.1 423 1.9 159 21,898 8%
Major Family 13,802 93.4 654 97.8 190 99.1 135 0.9 106 14,781 6%
Major Juvenile 11,109 80.9 1,667 93.0 337 95.4 626 4.6 62 13,739 5%
Minor Criminal 110,182 71.5 29,557 90.7 8,417 96.1 5,966 3.9 83 154,122 60%
State Total 183,241 71.1 42,825 87.7 21,059 95.8 10,728 4.2 104 257,853 100%
Court Trial (.5% of '11 Disps)
Major Criminal 87 12.4 33 27.1 99 71.1 65 28.9 300 225 4%
Major Civil 560 70.7 116 85.4 62 93.2 54 6.8 314 792 14%
Major Family 397 50.3 240 80.6 87 91.6 66 8.4 389 790 14%
Major Juvenile 107 27.3 140 63.0 45 74.5 100 25.5 149 392 7%
Minor Criminal 1,517 45.2 1,134 78.9 419 91.4 288 8.6 131 3,358 60%
State Total 2,609 46.9 1,663 76.9 712 89.7 573 10.3 202 5,557 100%
Jury Trial (.2% of '11 Disps)
Major Criminal 184 13.5 251 31.9 550 72.2 380 27.8 302 1,365 54%
Major Civil 99 28.0 162 73.9 55 89.5 37 10.5 487 353 14%
Major Juvenile 0 0.0 0 0.0 0 0.0 4 100.0 280 4 0%
Minor Criminal 93 11.8 270 45.9 196 70.8 231 29.2 229 790 31%
State Total 376 15.0 683 42.2 801 74.0 652 26.0 305 2,512 100%
Change of Venue (.2% of '11 Disps)
Major Criminal 0 0 0 0 0 0 0 0.0 0 0 0%
Major Civil 122 100.0 0 100.0 0 100.0 0 0.0 47 122 6%
Major Family 45 93.8 3 100.0 0 100.0 0 0.0 68 48 2%
Major Juvenile 1,436 83.5 194 94.8 43 97.3 47 2.7 52 1,720 87%
Minor Criminal 88 94.6 5 100.0 0 100.0 0 0.0 36 93 5%
State Total 1,691 85.3 202 95.5 43 97.6 47 2.4 51 1,983 100%
Includes all dispositions from MNCIS, excludes dispositions in ViBES.
Data Details

63
NUMBER OF DISPOSITIONS PER COUNTY IN 2011, OTHER GROSS MISD CASES
County
# Dispositions Other Gross Misd
Cases 2011
County
# Dispositions Other Gross Misd
Cases 2011 Aitkin 69
Martin 35
Anoka 839
McLeod 97
Becker 135
Meeker 28
Beltrami 166
Mille Lacs 140
Benton 76
Morrison 74
Big Stone 8
Mower 85
Blue Earth 156
Murray 17
Brown 46
Nicollet 37
Carlton 98
Nobles 41
Carver 133
Norman 7
Cass 127
Olmsted 386
Chippewa 35
Otter Tail 105
Chisago 84
Pennington 40
Clay 171
Pine 74
Clearwater 36
Pipestone 14
Cook 15
Polk 84
Cottonwood 22
Pope 25
Crow Wing 231
Red Lake 9
Dakota 863
Redwood 65
Dodge 30
Renville 44
Douglas 95
Rice 162
Faribault 35
Rock 12
Fillmore 21
Roseau 35
Freeborn 75
St. Louis Duluth 323
Goodhue 209
St. Louis Hibbing 105
Grant 9
St. Louis Virginia 130
Hennepin 3,956
Scott 285
Houston 39
Sherburne 156
Hubbard 79
Sibley 42
Isanti 82
Stearns 361
Itasca 125
Steele 98
Jackson 9
Stevens 14
Kanabec 49
Swift 39
Kandiyohi 90
Todd 53
Kittson 3
Traverse 12
Koochiching 28
Wabasha 43
Lac qui Parle 5
Wadena 43
Lake 18
Waseca 41
Lake of the Woods 13
Washington 488
LeSueur 29
Watonwan 27
Lincoln 7
Wilkin 6
Lyon 55
Winona 128
Mahnomen 81
Wright 260
Marshall 15
Yellow Medicine 37
Data Details

64
AGE OF PENDING STATEWIDE (AS OF 6-30-12)
Excludes cases pending in ViBES.
90th Percentile
97th Percentile
99th Percentile
Beyond 99th
Percentile
WCL Group/Category Cases % Cases Cum
% Cases Cum
% Cases %
Total Cases
Pending
Serious Felony 395 40% 138 54% 277 83% 170 17% 980
Felony DWI 202 50% 54 64% 79 84% 66 16% 401
Other Felony 7414 56% 1963 71% 2697 92% 1094 8% 13168
Gross Misdemeanor DWI 2901 55% 607 66% 712 79% 1097 21% 5317
Other Gross Misd 3132 67% 654 81% 664 95% 211 5% 4661
Major Criminal Total 14044 57% 3416 71% 4429 89% 2638 11% 24527
Personal Injury 1965 87% 178 95% 53 97% 69 3% 2265
Contract 2665 91% 152 96% 57 98% 55 2% 2929
Wrongful Death 90 76% 18 92% 5 96% 5 4% 118
Property Damage 85 83% 10 93% 3 96% 4 4% 102
Condemnation 186 90% 16 98% 3 100% 1 0% 206
Conciliation Appeal 71 50% 17 62% 18 75% 35 25% 141
Harassment 304 94% 15 98% 5 100% 1 0% 325
Employment 312 97% 8 99% 2 100% 0 0% 322
Other Civil 176 88% 17 96% 6 99% 2 1% 201
Malpractice 4408 86% 294 92% 132 94% 291 6% 5125
Major Civil Total 10262 87% 725 94% 284 96% 463 4% 11734
Dissolution with Child 2964 90% 232 97% 63 99% 38 1% 3297
Dissolution without Child 1544 93% 80 98% 18 99% 11 1% 1653
Domestic Abuse 246 78% 16 83% 13 88% 39 12% 314
Major Family 4754 90% 328 97% 94 98% 88 2% 5264
Delinquency Felony 647 69% 144 85% 32 88% 113 12% 936
Delinquency Gross Misd 157 72% 40 91% 4 93% 16 7% 217
Delinquency Misd 1203 83% 134 92% 38 95% 77 5% 1452
Juvenile Delinq Total 2007 77% 318 89% 74 92% 206 8% 2605
5th Degree Assault 2048 63% 722 85% 261 93% 220 7% 3251
Other Non-Traffic 12421 71% 2709 86% 991 92% 1415 8% 17536
Misdemeanor DWI 2230 50% 736 66% 286 73% 1209 27% 4461
Other Traffic 34316 89% 2580 96% 762 98% 701 2% 38359
Juvenile Traffic 483 86% 37 93% 16 96% 23 4% 559
Minor Criminal Total 51498 80% 6784 91% 2316 94% 3568 6% 64166
Statewide Total 82565 76% 11571 87% 7197 94% 6963 6% 108,296
Data Details

65
AGE OF PENDING BY DISTRICT (AS OF 6-30-2012)
District 1 Age of Pending Cases (As of 6-30-2012)
Case Group Case Category
90th Percen-
tile
97th Percen-
tile Cum
%
99th Percen-
tile Cum
%
Over 99th
Percen-tile
Total Cases
Pending
Major Serious Felony 44 16 60 21 81 19 115
Criminal Felony DWI 39 8 47 31 78 22 49
Other Felony 47 15 61 27 88 12 1703
Gross Misdemeanor DWI 47 11 58 15 74 26 803
Other Gross Misd 57 16 73 21 95 5 701
Major Personal Injury 89 8 96 1 97 3 273
Civil Contract 93 4 98 2 99 1 455
Wrongful Death 67 22 89 0 89 11 9
Malpractice 78 11 89 0 89 11 9
Property Damage 86 14 100 0 100 0 22
Condemnation 71 0 71 7 79 21 28
Conciliation Appeal 100 0 100 0 100 0 28
Harassment 97 3 100 0 100 0 32
Employment 89 0 89 6 94 6 18
Other Civil 85 9 94 2 96 4 529
Major Dissolution with Child 91 6 97 2 99 1 391
Family Dissolution without Child 94 5 99 1 100 0 143
Domestic Abuse 56 8 64 5 69 31 64
Major Delinquency Felony 63 12 75 2 78 22 129
Juvenile Delinquency Gross Misd 65 16 81 0 81 19 37
Delinq Misdemeanor 73 16 89 5 94 6 211
Minor 5th Degree Assault 57 28 85 9 94 6 423
Criminal Other Non-Traffic 78 14 92 3 95 5 2271
Misdemeanor DWI 44 14 57 7 64 36 792
Other Traffic 94 4 98 1 99 1 8319
Juvenile Traffic 87 6 93 2 95 5 112
District 1 Total 79 9 88 6 94 6 17666
Data Details

66
District 2 Age of Pending Cases (As of 6-30-2012)
Case Group Case Category
90th Percen-
tile
97th Percen-
tile Cum
%
99th Percen-
tile Cum
%
Over 99th
Percen-tile
Total Cases
Pending
Major Serious Felony 66 15 80 16 97 3 61
Criminal Felony DWI 77 23 100 0 100 0 26
Other Felony 73 13 86 10 97 3 1043
Gross Misd DWI 70 17 87 10 98 2 334
Other Gross Misd 77 12 88 10 98 2 425
Major Personal Injury 87 6 93 2 95 5 327
Civil Contract 93 4 98 0 98 2 204
Wrongful Death 89 11 100 0 100 0 9
Malpractice 88 6 94 0 94 6 16
Property Damage 83 17 100 0 100 0 12
Condemnation 40 10 50 10 60 40 10
Conciliation Appeal 97 3 100 0 100 0 61
Harassment 100 0 100 0 100 0 7
Employment 78 19 96 4 100 0 27
Other Civil 89 5 93 4 97 3 520
Major Dissolution with Child 93 6 98 1 99 1 242
Family
Dissolution without Child 95 5 100 0 100 0 149
Domestic Abuse 83 6 89 3 92 8 36
Major Delinquency Felony 74 18 92 3 95 5 39
Juvenile Delinquency Gross Misd 94 6 100 0 100 0 16
Delinquency Misd 84 10 94 1 95 5 178
Minor 5th Degree Assault 68 23 90 7 97 3 314
Criminal Other Non-Traffic 75 17 92 5 97 3 1514
Misdemeanor DWI 65 25 90 7 97 3 329
Other Traffic 71 22 93 5 98 2 1332
Juvenile Traffic 99 1 100 0 100 0 96
District 2 Total (Excludes ViBES) 77 15 92 6 97 3 7327
Data Details

67
District 3 Age of Pending Cases (As of 6-30-2012)
Case Group Case Category
90th Percen-
tile
97th Percen-
tile Cum
%
99th Percen-
tile Cum
%
Over 99th
Percen-tile
Total Cases
Pending
Major Serious Felony 32 11 43 24 66 34 110
Criminal Felony DWI 38 14 51 19 70 30 37
Other Felony 51 14 65 20 85 15 1416
Gross Misd DWI 55 10 65 14 79 21 431
Other Gross Misd 61 16 77 12 89 11 358
Major Personal Injury 72 13 84 7 91 9 120
Civil Contract 90 6 96 3 99 1 226
Wrongful Death 85 8 92 8 100 0 13
Malpractice 60 20 80 20 100 0 5
Property Damage 93 7 100 0 100 0 14
Condemnation 75 0 75 0 75 25 4
Conciliation Appeal 91 9 100 0 100 0 11
Harassment 100 0 100 0 100 0 6
Employment 100 0 100 0 100 0 8
Other Civil 82 6 88 3 90 10 235
Major Dissolution with Child 91 5 95 3 99 1 300
Family
Dissolution without Child 94 3 97 2 98 2 131
Domestic Abuse 81 0 81 6 88 13 16
Major Delinquency Felony 59 20 78 6 84 16 116
Juvenile Delinquency Gross Misd 75 19 94 0 94 6 16
Delinquency Misd 88 6 94 1 95 5 171
Minor 5th Degree Assault 50 22 72 12 84 16 317
Criminal Other Non-Traffic 74 14 88 5 93 7 1240
Misdemeanor DWI 52 11 64 7 71 29 414
Other Traffic 95 3 98 1 99 1 3992
Juvenile Traffic 89 9 97 0 97 3 35
District 3 Total 77 9 86 6 92 8 9742
Data Details
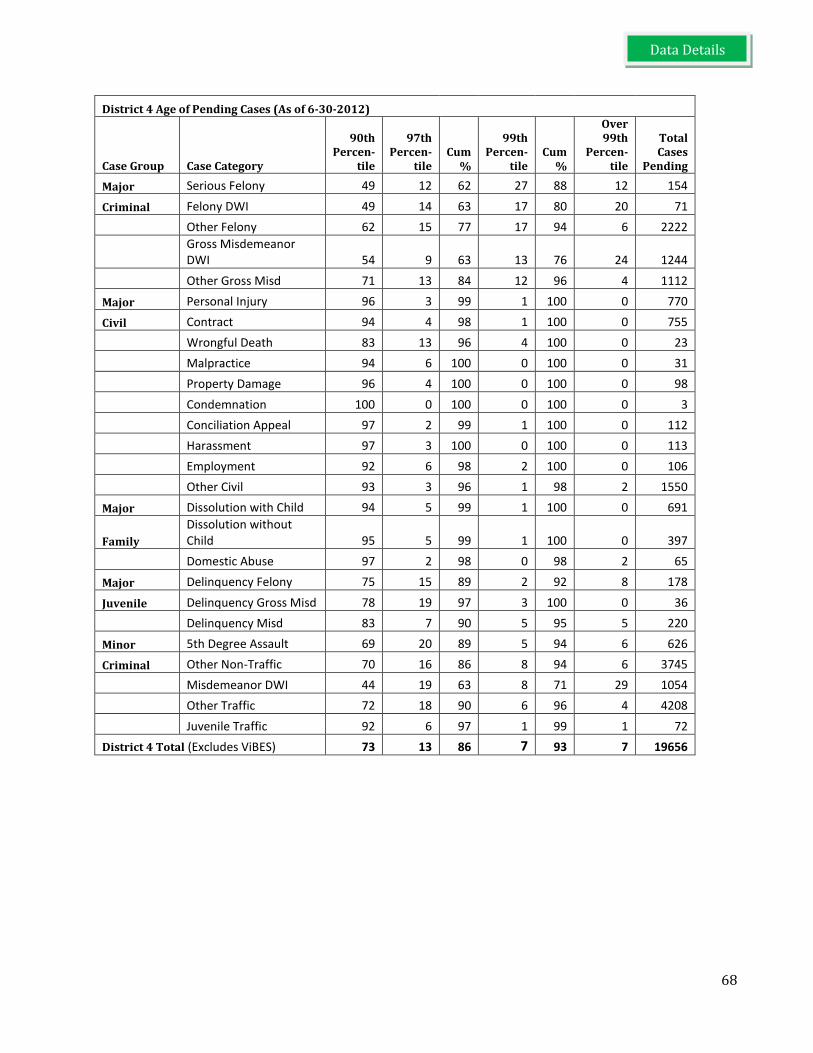
68
District 4 Age of Pending Cases (As of 6-30-2012)
Case Group Case Category
90th Percen-
tile
97th Percen-
tile Cum
%
99th Percen-
tile Cum
%
Over 99th
Percen-tile
Total Cases
Pending
Major Serious Felony 49 12 62 27 88 12 154
Criminal Felony DWI 49 14 63 17 80 20 71
Other Felony 62 15 77 17 94 6 2222
Gross Misdemeanor DWI 54 9 63 13 76 24 1244
Other Gross Misd 71 13 84 12 96 4 1112
Major Personal Injury 96 3 99 1 100 0 770
Civil Contract 94 4 98 1 100 0 755
Wrongful Death 83 13 96 4 100 0 23
Malpractice 94 6 100 0 100 0 31
Property Damage 96 4 100 0 100 0 98
Condemnation 100 0 100 0 100 0 3
Conciliation Appeal 97 2 99 1 100 0 112
Harassment 97 3 100 0 100 0 113
Employment 92 6 98 2 100 0 106
Other Civil 93 3 96 1 98 2 1550
Major Dissolution with Child 94 5 99 1 100 0 691
Family
Dissolution without Child 95 5 99 1 100 0 397
Domestic Abuse 97 2 98 0 98 2 65
Major Delinquency Felony 75 15 89 2 92 8 178
Juvenile Delinquency Gross Misd 78 19 97 3 100 0 36
Delinquency Misd 83 7 90 5 95 5 220
Minor 5th Degree Assault 69 20 89 5 94 6 626
Criminal Other Non-Traffic 70 16 86 8 94 6 3745
Misdemeanor DWI 44 19 63 8 71 29 1054
Other Traffic 72 18 90 6 96 4 4208
Juvenile Traffic 92 6 97 1 99 1 72
District 4 Total (Excludes ViBES) 73 13 86 7 93 7 19656
Data Details

69
District 5 Age of Pending Cases (As of 6-30-2012)
Case Group Case Category
90th Percen-
tile
97th Percen-
tile Cum
%
99th Percen-
tile Cum
%
Over 99th
Percen-tile
Total Cases
Pending
Major Serious Felony 37 17 54 31 85 15 54
Criminal Felony DWI 70 10 80 15 95 5 20
Other Felony 54 15 69 24 93 7 675
Gross Misdemeanor DWI 65 16 81 15 96 4 203
Other Gross Misd 71 15 86 12 97 3 195
Major Personal Injury 83 8 92 4 95 5 84
Civil Contract 87 7 94 3 98 2 143
Wrongful Death 67 0 67 22 89 11 9
Malpractice 0 50 50 0 50 50 2
Property Damage 90 10 100 0 100 0 10
Condemnation 33 17 50 0 50 50 6
Conciliation Appeal 88 0 88 13 100 0 8
Harassment 90 10 100 0 100 0 21
Employment 40 40 80 20 100 0 5
Other Civil 85 6 91 8 98 2 160
Major Dissolution with Child 90 6 96 2 98 2 156
Family
Dissolution without Child 90 6 96 4 100 0 67
Domestic Abuse 75 6 81 0 81 19 16
Major Delinquency Felony 72 18 90 3 93 7 61
Juvenile Delinquency Gross Misd 64 29 93 7 100 0 14
Delinquency Misd 80 12 93 2 95 5 97
Minor 5th Degree Assault 67 16 83 12 95 5 153
Criminal Other Non-Traffic 76 14 89 7 96 4 663
Misdemeanor DWI 61 18 79 6 85 15 170
Criminal Other Traffic 92 5 97 2 99 1 2585
Juvenile Traffic 77 6 84 10 94 6 31
District 5 Total 80 9 89 7 97 3 5608
Data Details

70
District 6 Age of Pending Cases (As of 6-30-2012)
Case Group Case Category
90th Percen-
tile
97th Percen-
tile Cum
%
99th Percen-
tile Cum
%
Over 99th
Percen-tile
Total Cases
Pending
Major Serious Felony 34 7 41 29 70 30 56
Criminal Felony DWI 68 8 76 12 88 12 25
Other Felony 63 14 77 15 92 8 851
Gross Misdemeanor DWI 63 12 75 10 85 15 239
Other Gross Misd 63 12 75 18 93 7 257
Major Personal Injury 75 15 90 7 97 3 137
Civil Contract 75 12 88 6 93 7 169
Wrongful Death 100 0 100 0 100 0 8
Malpractice 92 8 100 0 100 0 13
Property Damage 63 25 88 13 100 0 8
Condemnation 33 33 67 0 67 33 9
Conciliation Appeal 85 0 85 15 100 0 13
Harassment 96 0 96 4 100 0 27
Employment 67 33 100 0 100 0 3
Other Civil 79 6 85 4 89 11 281
Major Dissolution with Child 88 9 97 3 100 0 121
Family
Dissolution without Child 89 7 96 0 96 4 57
Domestic Abuse 75 19 94 0 94 6 16
Major Delinquency Felony 77 6 83 3 86 14 35
Juvenile Delinquency Gross Misd 67 11 78 0 78 22 9
Delinquency Misd 70 11 82 5 86 14 44
Minor 5th Degree Assault 61 19 80 13 93 7 286
Criminal Other Non-Traffic 73 15 88 6 94 6 1177
Misdemeanor DWI 64 13 78 6 84 16 171
Other Traffic 95 2 97 1 98 2 2597
Juvenile Traffic 67 17 83 17 100 0 18
District 6 Total 79 9 88 6 95 5 6627
Data Details
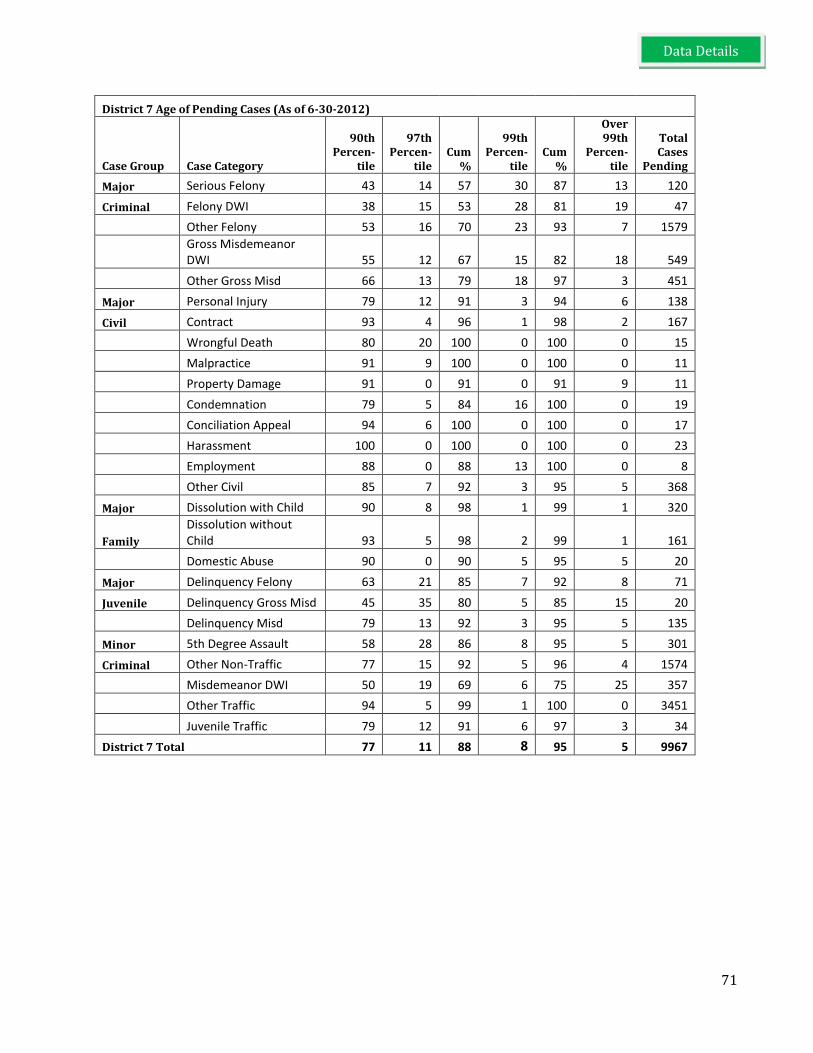
71
District 7 Age of Pending Cases (As of 6-30-2012)
Case Group Case Category
90th Percen-
tile
97th Percen-
tile Cum
%
99th Percen-
tile Cum
%
Over 99th
Percen-tile
Total Cases
Pending
Major Serious Felony 43 14 57 30 87 13 120
Criminal Felony DWI 38 15 53 28 81 19 47
Other Felony 53 16 70 23 93 7 1579
Gross Misdemeanor DWI 55 12 67 15 82 18 549
Other Gross Misd 66 13 79 18 97 3 451
Major Personal Injury 79 12 91 3 94 6 138
Civil Contract 93 4 96 1 98 2 167
Wrongful Death 80 20 100 0 100 0 15
Malpractice 91 9 100 0 100 0 11
Property Damage 91 0 91 0 91 9 11
Condemnation 79 5 84 16 100 0 19
Conciliation Appeal 94 6 100 0 100 0 17
Harassment 100 0 100 0 100 0 23
Employment 88 0 88 13 100 0 8
Other Civil 85 7 92 3 95 5 368
Major Dissolution with Child 90 8 98 1 99 1 320
Family
Dissolution without Child 93 5 98 2 99 1 161
Domestic Abuse 90 0 90 5 95 5 20
Major Delinquency Felony 63 21 85 7 92 8 71
Juvenile Delinquency Gross Misd 45 35 80 5 85 15 20
Delinquency Misd 79 13 92 3 95 5 135
Minor 5th Degree Assault 58 28 86 8 95 5 301
Criminal Other Non-Traffic 77 15 92 5 96 4 1574
Misdemeanor DWI 50 19 69 6 75 25 357
Other Traffic 94 5 99 1 100 0 3451
Juvenile Traffic 79 12 91 6 97 3 34
District 7 Total 77 11 88 8 95 5 9967
Data Details

72
District 8 Age of Pending Cases (As of 6-30-2012)
Case Group Case Category
90th Percen-
tile
97th Percen-
tile Cum
%
99th Percen-
tile Cum
%
Over 99th
Percen-tile
Total Cases
Pending
Major Serious Felony 27 15 42 48 91 9 33
Criminal Felony DWI 70 0 70 20 90 10 10
Other Felony 66 12 78 18 96 4 366
Gross Misdemeanor DWI 65 12 78 8 86 14 98
Other Gross Misd 82 14 96 4 100 0 77
Major Personal Injury 76 20 95 0 95 5 41
Civil Contract 90 8 99 0 99 1 73
Wrongful Death 50 50 100 0 100 0 2
Malpractice 100 0 100 0 100 0 1
Property Damage 100 0 100 0 100 0 2
Condemnation 100 0 100 0 100 0 2
Conciliation Appeal 88 13 100 0 100 0 8
Harassment 100 0 100 0 100 0 8
Employment 100 0 100 0 100 0 4
Other Civil 91 5 96 3 99 1 74
Major Dissolution with Child 93 6 99 1 100 0 80
Family
Dissolution without Child 98 2 100 0 100 0 46
Domestic Abuse 71 14 86 14 100 0 7
Major Delinquency Felony 94 3 97 0 97 3 33
Juvenile Delinquency Gross Misd 100 0 100 0 100 0 3
Delinquency Misd 96 0 96 0 96 4 23
Minor 5th Degree Assault 78 16 94 5 98 2 64
Criminal Other Non-Traffic 84 9 93 2 95 5 341
Misdemeanor DWI 68 18 86 4 90 10 79
Other Traffic 96 2 98 0 99 1 1168
Juvenile Traffic 83 9 91 4 96 4 23
District 8 Total 86 7 93 5 97 3 2666
Data Details

73
District 9 Age of Pending Cases (As of 6-30-2012)
Case Group Case Category
90th Percen-
tile
97th Percen-
tile Cum
%
99th Percen-
tile Cum
%
Over 99th
Percen-tile
Total Cases
Pending
Major Serious Felony 43 17 60 25 85 15 110
Criminal Felony DWI 65 18 83 13 95 5 40
Other Felony 60 16 76 17 93 7 1097
Gross Misdemeanor DWI 64 12 76 13 89 11 294
Other Gross Misd 71 12 83 12 95 5 355
Major Personal Injury 80 9 90 7 97 3 87
Civil Contract 85 4 90 4 94 6 182
Wrongful Death 56 22 78 0 78 22 9
Malpractice 56 22 78 22 100 0 9
Property Damage 86 14 100 0 100 0 7
Condemnation 20 33 53 7 60 40 15
Conciliation Appeal 82 12 94 0 94 6 17
Harassment 91 6 97 3 100 0 32
Employment 67 33 100 0 100 0 3
Other Civil 68 8 76 4 79 21 456
Major Dissolution with Child 88 7 95 1 96 4 188
Family
Dissolution without Child 93 3 96 1 96 4 137
Domestic Abuse 77 8 85 8 92 8 26
Major Delinquency Felony 68 13 81 5 86 14 125
Juvenile Delinquency Gross Misd 79 17 96 0 96 4 24
Delinquency Misd 92 3 94 1 95 5 154
Minor 5th Degree Assault 72 19 91 3 94 6 190
Criminal Other Non-Traffic 82 10 92 4 95 5 1220
Misdemeanor DWI 58 10 68 6 74 26 235
Other Traffic 92 4 97 1 98 2 2376
Juvenile Traffic 79 17 96 0 96 4 24
District 9 Total 78 9 88 6 94 6 7412
Data Details

74
District 10 Age of Pending Cases (As of 6-30-2012)
Case Group Case Category
90th Percen-
tile
97th Percen-
tile Cum
%
99th Percen-
tile Cum
%
Over 99th
Percen-tile
Total Cases
Pending
Major Serious Felony 28 16 44 38 81 19 167
Criminal Felony DWI 42 14 57 25 82 18 76
Other Felony 51 15 66 25 91 9 2216
Gross Misdemeanor DWI 48 12 60 14 74 26 1122
Other Gross Misd 66 17 82 15 97 3 730
Major Personal Injury 80 13 93 3 96 4 288
Civil Contract 92 5 97 1 98 2 555
Wrongful Death 67 24 90 5 95 5 21
Malpractice 80 0 80 0 80 20 5
Property Damage 82 9 91 9 100 0 22
Condemnation 36 13 49 24 73 27 45
Conciliation Appeal 86 12 98 2 100 0 50
Harassment 100 0 100 0 100 0 53
Employment 84 11 95 0 95 5 19
Other Civil 86 7 93 2 95 5 952
Major Dissolution with Child 86 10 95 3 98 2 808
Family
Dissolution without Child 92 6 98 1 100 0 365
Domestic Abuse 77 2 79 8 88 13 48
Major Delinquency Felony 70 18 88 2 90 10 149
Juvenile
Delinquency Gross Misd 76 17 93 2 95 5 42
Delinquency Misd 86 9 95 1 96 4 219
Minor 5th Degree Assault 63 22 85 7 93 7 577
Criminal Other Non-Traffic 56 18 75 7 81 19 3791
Misdemeanor DWI 48 16 63 4 68 32 860
Other Traffic 88 7 95 2 97 3 8331
Juvenile Traffic 82 6 88 4 91 9 114
District 10 Total 72 11 84 7 91 9 21625
Data Details

75
NUMBER OF OTHER NON-TRAFFIC CASES PENDING AND AVG DAYS PENDING
District County Total
Pending Cases
Avg # Days Pending for
Cases Beyond 99th Percentile
District County Total
Pending Cases
Avg # Days Pending for
Cases Beyond 99th Percentile
1 Carver 139 320
7 Morrison 46 n/a
1 Dakota 1285 430
7 Otter Tail 126 380
1 Goodhue 168 409
7 Stearns 751 393
1 LeSueur 55 292
7 Todd 53 1197
1 McLeod 132 695
7 Wadena 53 367
1 Scott 444 479
8 Big Stone 16 n/a
1 Sibley 48 343
8 Chippewa 32 304
2 Ramsey 1514 334
8 Grant 14 283
3 Dodge 25 n/a
8 Kandiyohi 96 1471
3 Fillmore 23 n/a
8 Lac qui Parle 14 1864
3 Freeborn 93 388
8 Meeker 41 273
3 Houston 37 330
8 Pope 18 n/a
3 Mower 131 419
8 Renville 15 n/a
3 Olmsted 306 530
8 Stevens 8 319
3 Rice 174 316
8 Swift 25 390
3 Steele 175 389
8 Traverse 20 n/a
3 Wabasha 55 282
8 Wilkin 17 336
3 Waseca 54 n/a
8 Yellow Medicine 25 335
3 Winona 167 397
9 Aitkin 58 382
4 Hennepin 3745 438
9 Beltrami 203 273
5 Blue Earth 224 333
9 Cass 125 371
5 Brown 22 n/a
9 Clearwater 16 n/a
5 Cottonwood 25 n/a
9 Crow Wing 312 642
5 Faribault 34 n/a
9 Hubbard 43 310
5 Jackson 37 357
9 Itasca 125 334
5 Lincoln 1 n/a
9 Kittson 1 n/a
5 Lyon 23 606
9 Koochiching 31 329
5 Martin 88 607
9 Lake of the Woods 31 283
5 Murray 8 n/a
9 Mahnomen 44 n/a
5 Nicollet 69 n/a
9 Marshall 8 n/a
5 Nobles 38 756
9 Norman 14 n/a
5 Pipestone 10 n/a
9 Pennington 48 327
5 Redwood 40 n/a
9 Polk 97 373
5 Rock 25 358
9 Red Lake 9 n/a
5 Watonwan 19 281
9 Roseau 55 374
6 Carlton 142 297
10 Anoka 2148 1784
6 Cook 23 282
10 Chisago 134 326
6 Lake 21 409
10 Isanti 77 403
6 St. Louis 991 n/a
10 Kanabec 47 298
7 Becker 93 598
10 Pine 74 406
7 Benton 22 351
10 Sherburne 183 n/a
7 Clay 225 360
10 Washington 800 364
7 Douglas 87 274
10 Wright 328 520
7 Mille Lacs 118 501
Cases pending as of 6-30-2012
Data Details

76
BACKLOG INDEX 2007-2011 MAJOR CASE CATEGORIES BY DISTRICT
District One Backlog Index 2007-2011
YE 06 Pend
CY 07 Disps
2007 Backlog
Index YE 07 Pend
CY 08 Disps
2008 Backlog
Index YE 08 Pend
YE 09 Disps
2009 Backlog
Index YE 09 Pend
YE 10 Disps
2010 Backlog
Index YE 10 Pend
YE 11 Disps
2011 Backlog
Index
Maj Crim 3,154 7,930 0.40 3,306 7,281 0.45 3,723 6,990 0.53 3,428 6,711 0.51 3,126 6,363 0.49
Maj Civ 1,702 4,915 0.35 1,882 5,640 0.33 1,905 5,995 0.32 1,546 5,486 0.28 1,523 4,787 0.32
Prob/MH 2,517 1,788 1.41 977 1,984 0.49 1,605 1,784 0.90 1414 2,691 0.53 197 1,500 0.13
Family 2,453 5,960 0.41 2,476 7,075 0.35 1,344 6,182 0.22 1284 6,325 0.20 1133 6,310 0.18
Juvenile 3,104 8,061 0.39 3,735 7,696 0.49 1,659 7,137 0.23 1484 6,637 0.22 1185 6,014 0.20
District Three Backlog Index 2007-2011
YE 06 Pend
CY 07 Disps
2007 Backlog
Index YE 07 Pend
CY 08 Disps
2008 Backlog
Index YE 08 Pend
YE 09 Disps
2009 Backlog
Index YE 09 Pend
YE 10 Disps
2010 Backlog
Index YE 10 Pend
YE 11 Disps
2011 Backlog
Index
Maj Crim 3,514 5,990 0.59 3,220 5,711 0.56 2,774 5,115 0.54 2,813 5,189 0.54 2,742 5,107 0.54
Maj Civ 851 3,024 0.28 904 3,126 0.29 934 3,446 0.27 838 3,599 0.23 836 3,302 0.25
Prob/MH 399 1,615 0.25 323 1,578 0.20 266 1,413 0.19 190 1,294 0.15 165 1,294 0.13
Family 1,199 4,303 0.28 933 4,119 0.23 909 4,309 0.21 952 4,348 0.22 810 4,130 0.20
Juvenile 1,048 4,578 0.23 1,141 4,084 0.28 940 3,300 0.28 861 3,348 0.26 785 3,093 0.25
District Two Backlog Index 2007-2011
YE 06 Pend
CY 07 Disps
2007 Backlog
Index YE 07 Pend
CY 08 Disps
2008 Backlog
Index YE 08 Pend
YE 09 Disps
2009 Backlog
Index YE 09 Pend
YE 10 Disps
2010 Backlog
Index YE 10 Pend
YE 11 Disps
2011 Backlog
Index
Maj Crim 1,560 5,862 0.27 1,464 5,326 0.27 2,081 5,733 0.36 1,836 5,400 0.34 1,775 5,695 0.31
Maj Civ 2,120 3,991 0.53 2,508 4,363 0.57 1,826 4,443 0.41 1,793 4,247 0.42 1,626 4,107 0.40
Prob/MH 1,029 1,936 0.53 779 2,012 0.39 614 1,781 0.34 508 1,570 0.32 555 1,709 0.32
Family 2,003 4,644 0.43 1,032 4,954 0.21 1,168 5,240 0.22 1075 5,249 0.20 1009 5,231 0.19
Juvenile 1,295 3,735 0.35 1,241 4,165 0.30 1,394 4,285 0.33 619 3,320 0.19 697 3,385 0.21
District Four Backlog Index 2007-2011
YE 06 Pend
CY 07 Disps
2007 Backlog
Index YE 07 Pend
CY 08 Disps
2008 Backlog
Index YE 08 Pend
YE 09 Disps
2009 Backlog
Index YE 09 Pend
YE 10 Disps
2010 Backlog
Index YE 10 Pend
YE 11 Disps
2011 Backlog
Index
Maj Crim 3,093 13,123 0.24 3,865 13,464 0.29 3,937 12,761 0.31 3,988 11,847 0.34 4,275 12,055 0.35
Maj Civ 3,032 9,096 0.33 3,232 10,682 0.30 4,028 11,874 0.34 4,038 10,621 0.38 4,046 11,447 0.35
Prob/MH 1,147 4,355 0.26 946 4,429 0.21 684 3,850 0.18 335 3,343 0.10 345 3,410 0.10
Family 2,570 10,332 0.25 2,318 9,966 0.23 2,238 10,850 0.21 2127 11,107 0.19 2238 10,757 0.21
Juvenile 4,185 17,834 0.23 2,689 14,472 0.19 2,241 13,862 0.16 1666 11,461 0.15 1915 11,025 0.17
Data Details

77
District Seven Backlog Index 2007-2011
YE 06 Pend
CY 07 Disps
2007 Backlog Index
YE 07 Pend
CY 08 Disps
2008 Backlog Index
YE 08 Pend
YE 09 Disps
2009 Backlog Index
YE 09 Pend
YE 10 Disps
2010 Backlog
Index YE 10 Pend
YE 11 Disps
2011 Backlog
Index
Maj Crim 3,209 6,846 0.47 3,220 6,308 0.51 3,001 6,023 0.50 2,777 5,668 0.49 2,855 5,760 0.50
Maj Civ 1,046 2,874 0.36 1,083 3,155 0.34 924 3,045 0.30 825 2,972 0.28 779 3,082 0.25
Prob/MH 2,446 1,839 1.33 919 1,869 0.49 575 1,421 0.40 422 1,505 0.28 277 1,343 0.21
Family 1,037 3,880 0.27 955 4,060 0.24 871 4,026 0.22 916 4,041 0.23 867 4,162 0.21
Juvenile 1,607 4,941 0.33 1,413 4,889 0.29 1,247 4,244 0.29 1079 4,099 0.26 970 3,606 0.27
District Eight Backlog Index 2007-2011
YE 06 Pend
CY 07 Disps
2007 Backlog Index
YE 07 Pend
CY 08 Disps
2008 Backlog Index
YE 08 Pend
YE 09 Disps
2009 Backlog Index
YE 09 Pend
YE 10 Disps
2010 Backlog
Index YE 10 Pend
YE 11 Disps
2011 Backlog
Index
Maj Crim 653 1,892 0.35 574 1,743 0.33 549 1,609 0.34 517 1,645 0.31 553 1,644 0.34
Maj Civ 303 1,231 0.25 317 1,040 0.30 279 1,151 0.24 249 970 0.26 241 1,029 0.23
Prob/MH 409 838 0.49 253 833 0.30 185 649 0.29 151 636 0.24 157 650 0.24
Family 238 1,360 0.18 229 1,363 0.17 219 1,403 0.16 216 1,434 0.15 248 1,464 0.17
Juvenile 405 1,811 0.22 364 1,581 0.23 296 1,300 0.23 311 1,317 0.24 326 1,072 0.30
District Five Backlog Index 2007-2011
YE 06 Pend
CY 07 Disps
2007 Backlog
Index YE 07 Pend
CY 08 Disps
2008 Backlog
Index YE 08 Pend
YE 09 Disps
2009 Backlog
Index YE 09 Pend
YE 10 Disps
2010 Backlog
Index YE 10 Pend
YE 11 Disps
2011 Backlog
Index
Maj Crim 1,543 3,586 0.43 1,457 3,364 0.43 1,286 3,186 0.40 1,283 2,985 0.43 1,231 2,908 0.42
Maj Civ 615 1,841 0.33 642 2,036 0.32 620 2,234 0.28 525 2,183 0.24 574 2,137 0.27
Prob/MH 1,237 1,409 0.88 1,148 1,286 0.89 1,075 1,327 0.81 592 1,282 0.46 429 1,202 0.36
Family 465 2,659 0.17 468 2,685 0.17 460 2,763 0.17 438 2,702 0.16 456 2,630 0.17
Juvenile 929 3,266 0.28 1,120 3,370 0.33 1,038 2,933 0.35 747 2,585 0.29 728 2,709 0.27
District Six Backlog Index 2007-2011
YE 06 Pend
CY 07 Disps
2007 Backlog
Index YE 07 Pend
CY 08 Disps
2008 Backlog
Index YE 08 Pend
YE 09 Disps
2009 Backlog
Index YE 09 Pend
YE 10 Disps
2010 Backlog
Index YE 10 Pend
YE 11 Disps
2011 Backlog
Index
Maj Crim 1,291 3,309 0.39 1,272 3,406 0.37 1,191 3,273 0.36 1,240 3,288 0.38 1,318 3,239 0.41
Maj Civ 813 1,928 0.42 768 2,153 0.36 731 2,124 0.34 710 2,240 0.32 800 2,642 0.30
Prob/MH 1,056 1,443 0.73 638 1,180 0.54 395 810 0.49 358 807 0.44 334 816 0.41
Family 697 2,700 0.26 570 2,722 0.21 525 2,666 0.20 544 2,850 0.19 480 2,696 0.18
Juvenile 871 2,719 0.32 860 2,633 0.33 817 2,434 0.34 721 2,473 0.29 593 2,298 0.26
Data Details
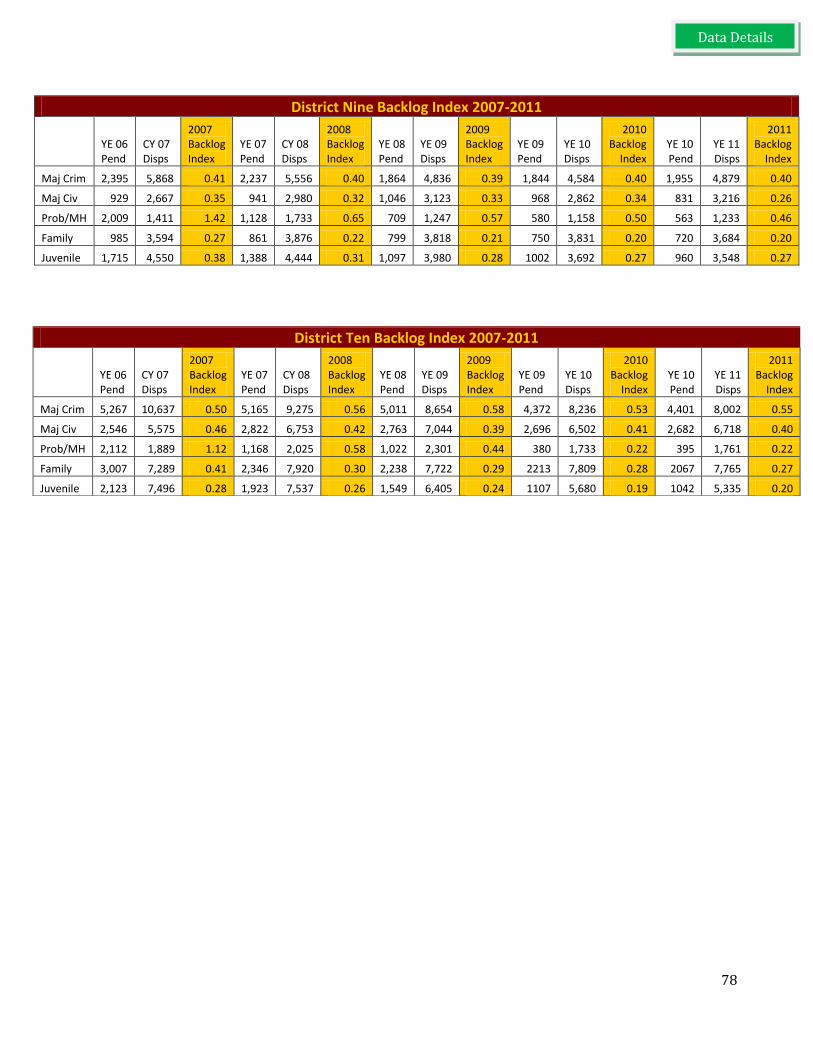
78
District Nine Backlog Index 2007-2011
YE 06 Pend
CY 07 Disps
2007 Backlog Index
YE 07 Pend
CY 08 Disps
2008 Backlog Index
YE 08 Pend
YE 09 Disps
2009 Backlog Index
YE 09 Pend
YE 10 Disps
2010 Backlog
Index YE 10 Pend
YE 11 Disps
2011 Backlog
Index
Maj Crim 2,395 5,868 0.41 2,237 5,556 0.40 1,864 4,836 0.39 1,844 4,584 0.40 1,955 4,879 0.40
Maj Civ 929 2,667 0.35 941 2,980 0.32 1,046 3,123 0.33 968 2,862 0.34 831 3,216 0.26
Prob/MH 2,009 1,411 1.42 1,128 1,733 0.65 709 1,247 0.57 580 1,158 0.50 563 1,233 0.46
Family 985 3,594 0.27 861 3,876 0.22 799 3,818 0.21 750 3,831 0.20 720 3,684 0.20
Juvenile 1,715 4,550 0.38 1,388 4,444 0.31 1,097 3,980 0.28 1002 3,692 0.27 960 3,548 0.27
District Ten Backlog Index 2007-2011
YE 06 Pend
CY 07 Disps
2007 Backlog Index
YE 07 Pend
CY 08 Disps
2008 Backlog Index
YE 08 Pend
YE 09 Disps
2009 Backlog Index
YE 09 Pend
YE 10 Disps
2010 Backlog
Index YE 10 Pend
YE 11 Disps
2011 Backlog
Index
Maj Crim 5,267 10,637 0.50 5,165 9,275 0.56 5,011 8,654 0.58 4,372 8,236 0.53 4,401 8,002 0.55
Maj Civ 2,546 5,575 0.46 2,822 6,753 0.42 2,763 7,044 0.39 2,696 6,502 0.41 2,682 6,718 0.40
Prob/MH 2,112 1,889 1.12 1,168 2,025 0.58 1,022 2,301 0.44 380 1,733 0.22 395 1,761 0.22
Family 3,007 7,289 0.41 2,346 7,920 0.30 2,238 7,722 0.29 2213 7,809 0.28 2067 7,765 0.27
Juvenile 2,123 7,496 0.28 1,923 7,537 0.26 1,549 6,405 0.24 1107 5,680 0.19 1042 5,335 0.20
Data Details

79
LENGTH OF TIME TO PERMANENCY FOR CHILDREN REACHING PERMANENCY IN 2011 ON CHIPS AND PERMANENCY CASES BY COUNTY
County % thru
12 months
Cum % thru 18 months
Total Number
of Children
County % thru
12 months
Cum % thru 18 months
Total Number
of Children
Aitkin 70% 100% 10 McLeod 81% 92% 26
Anoka 73% 89% 142 Meeker 38% 100% 8
Becker 77% 93% 30 Mille Lacs 86% 86% 14
Beltrami 64% 87% 92 Morrison 76% 100% 33
Benton 93% 100% 27 Mower 93% 98% 43
Big Stone 68% 100% 22 Murray 50% 100% 2
Blue Earth 74% 83% 66 Nicollet 67% 100% 15
Brown 75% 100% 24 Nobles 67% 80% 15
Carlton 75% 89% 64 Norman 75% 88% 8
Carver 84% 96% 25 Olmsted 80% 93% 75
Cass 79% 97% 29 Otter Tail 71% 93% 28
Chippewa 100% 100% 8 Pennington 87% 100% 15
Chisago 94% 94% 17 Pine 92% 96% 26
Clay 95% 97% 38 Pipestone 58% 92% 12
Clearwater 100% 100% 3 Polk 82% 95% 39
Cook 25% 50% 8 Pope 86% 100% 14
Cottonwood 33% 67% 6 Ramsey 67% 86% 237
Crow Wing 66% 97% 76 Red Lake 67% 83% 6
Dakota 76% 89% 171 Redwood 56% 88% 16
Dodge 100% 100% 5 Renville 80% 80% 5
Douglas 64% 91% 11 Rice 80% 96% 46
Faribault 76% 100% 21 Rock 71% 100% 7
Fillmore 100% 100% 4 Roseau 83% 100% 6
Freeborn 96% 100% 26 Scott 81% 94% 32
Goodhue 85% 85% 13 Sherburne 94% 94% 32
Grant 100% 100% 7 Sibley 57% 79% 14
Hennepin 79% 94% 581 St. Louis, Duluth 57% 87% 169
Houston 75% 92% 12 St. Louis, Hibbing 45% 76% 33
Hubbard 100% 100% 11 St. Louis, Virginia 67% 92% 24
Isanti 93% 100% 30 Stearns 88% 100% 83
Itasca 86% 100% 42 Steele 95% 100% 21
Jackson 64% 64% 11 Stevens 25% 100% 4
Kanabec 70% 100% 10 Swift 85% 92% 13
Kandiyohi 74% 78% 23 Todd 53% 93% 15
Kittson 67% 100% 3 Traverse 50% 100% 4
Koochiching 83% 92% 12 Wabasha 76% 100% 17
Lac qui Parle 0% 100% 1 Wadena 100% 100% 4
Lake 100% 100% 7 Waseca 100% 100% 10
Lake o’ Woods 100% 100% 6 Washington 78% 96% 45
LeSueur 100% 100% 8 Watonwan 50% 88% 8
Lincoln 80% 100% 5 Wilkin 86% 100% 7
Lyon 100% 100% 40 Winona 45% 85% 20
Mahnomen 100% 100% 5 Wright 72% 92% 61
Marshall 100% 100% 1 Yellow Medicine 100% 100% 18
Martin 60% 70% 10 State Total 76% 92% 3093
Goal: 90% by 12 months; 99% by 18 months Data for Permanencies occurring Jan-Dec 2011, any counties not listed had no children reaching permanency in 2011.
Data Details

80
JUROR RACE AND GENDER BY COUNTY 2011
Percent of Jurors by Race by County for 2011
District County % White % Black % Asian % Hispanic % Am Indian
% Multi or Other
Race
% With No Race
Data
1 Carver 96.0% 0.5% 1.5% 0.8% 0.5% 0.8%
1.5%
1 Dakota 91.4% 1.8% 2.5% 1.9% 0.3% 2.0%
0.8%
1 Goodhue 96.6% 0.0% 0.0% 0.8% 0.8% 1.7%
0.8%
1 LeSueur 98.1% 0.0% 0.0% 1.3% 0.6% 0.0%
3.8%
1 McLeod 97.5% 0.2% 0.2% 1.0% 0.5% 0.5%
1.0%
1 Scott 93.4% 0.5% 3.1% 0.8% 1.1% 1.1%
0.9%
1 Sibley 96.1% 0.0% 0.0% 2.6% 1.3% 0.0%
0.0%
Dist 1 Total 93.5% 1.1% 2.1% 1.4% 0.6% 1.4%
1.0%
2 Dist 2 Total 80.1% 6.9% 6.4% 3.1% 0.7% 2.8%
1.9%
3 Dodge 97.0% 0.0% 0.0% 1.8% 0.6% 0.6%
1.2%
3 Fillmore 98.2% 0.0% 0.5% 0.5% 0.5% 0.5%
1.4%
3 Freeborn 96.5% 0.0% 0.0% 3.0% 0.0% 0.5%
2.5%
3 Houston 97.9% 0.0% 1.0% 0.0% 0.0% 1.0%
2.0%
3 Mower 94.3% 0.0% 0.4% 2.9% 1.2% 1.2%
0.8%
3 Olmsted 91.2% 1.4% 2.7% 2.2% 0.7% 1.8%
0.8%
3 Rice 96.7% 0.4% 0.7% 1.1% 0.7% 0.4%
1.3%
3 Steele 95.7% 0.0% 0.8% 2.2% 0.4% 0.8%
0.6%
3 Wabasha 97.9% 0.0% 2.1% 0.0% 0.0% 0.0%
0.0%
3 Waseca 99.5% 0.0% 0.0% 0.5% 0.0% 0.0%
1.1%
3 Winona 95.4% 1.1% 0.7% 0.7% 0.7% 1.4%
1.1%
Dist 3 Total 94.5% 0.7% 1.4% 1.8% 0.6% 1.1%
1.0%
4 Dist 4 Total 81.2% 7.9% 4.2% 2.4% 1.0% 3.3%
0.1%
5 Blue Earth 96.5% 0.5% 0.7% 0.7% 0.8% 0.8%
1.3%
5 Brown 99.0% 0.0% 0.0% 1.0% 0.0% 0.0%
0.5%
5 Cottonwood 95.9% 0.0% 0.0% 2.7% 0.0% 1.4%
1.4%
5 Faribault 98.4% 0.0% 0.0% 0.0% 0.0% 1.6%
0.0%
5 Jackson 98.5% 0.0% 0.0% 1.0% 0.0% 0.5%
0.5%
5 Lincoln 100.0% 0.0% 0.0% 0.0% 0.0% 0.0%
0.0%
5 Lyon 96.1% 0.6% 1.1% 1.1% 0.6% 0.6%
0.6%
5 Martin 98.1% 0.0% 0.0% 1.9% 0.0% 0.0%
3.8%
5 Murray 100.0% 0.0% 0.0% 0.0% 0.0% 0.0%
3.8%
5 Nicollet 94.2% 0.0% 1.7% 1.7% 0.6% 1.7%
0.0%
5 Nobles 93.5% 0.6% 1.2% 4.2% 0.0% 0.6%
2.4%
5 Pipestone 95.5% 0.0% 0.0% 1.5% 1.5% 1.5%
0.0%
5 Redwood 92.4% 0.0% 1.0% 2.4% 2.4% 1.9%
1.0%
5 Rock n/a n/a n/a n/a n/a n/a
n/a
5 Watonwan 88.0% 0.5% 0.5% 6.6% 1.1% 3.3%
1.7%
Dist 5 Total 95.5% 0.3% 0.6% 1.8% 0.7% 1.1%
1.1%
6 Carlton 95.3% 0.0% 0.0% 1.4% 1.4% 2.0%
3.9%
6 Cook 93.7% 0.0% 0.0% 0.0% 5.3% 1.1%
1.0%
6 Lake 98.6% 0.0% 0.0% 0.0% 1.4% 0.0%
2.8%
6 St. Louis - Duluth 96.2% 0.3% 0.4% 0.8% 1.1% 1.1%
2.1%
Data Details

81
6 St. Louis - Hibbing 97.9% 0.0% 0.7% 0.7% 0.0% 0.7%
1.7%
6 St. Louis - Virginia 97.4% 0.3% 0.0% 0.9% 0.9% 0.6%
1.7%
Dist 6 Total 96.4% 0.3% 0.4% 0.8% 1.1% 1.0%
2.1%
7 Becker 92.6% 0.3% 0.0% 0.9% 5.9% 0.3%
0.9%
7 Benton 97.7% 1.5% 0.0% 0.6% 0.0% 0.2%
1.0%
7 Clay 95.9% 0.4% 0.2% 1.0% 0.9% 1.5%
1.5%
7 Douglas 95.5% 0.4% 0.0% 1.8% 0.0% 2.2%
0.0%
7 Mille Lacs 96.4% 0.2% 0.2% 0.7% 2.5% 0.1%
0.8%
7 Morrison 95.7% 0.0% 0.0% 0.9% 2.6% 0.9%
2.1%
7 Otter Tail 96.3% 0.0% 0.3% 0.7% 2.0% 0.7%
0.7%
7 Stearns 97.7% 0.4% 0.5% 0.7% 0.3% 0.4%
1.1%
7 Todd 99.0% 0.0% 0.0% 1.0% 0.0% 0.0%
2.1%
7 Wadena 100.0% 0.0% 0.0% 0.0% 0.0% 0.0%
1.7%
Dist 7 Total 96.8% 0.4% 0.3% 0.8% 1.2% 0.6%
1.1%
8 Big Stone n/a n/a n/a n/a n/a n/a n/a
8 Chippewa n/a n/a n/a n/a n/a n/a n/a
8 Grant n/a n/a n/a n/a n/a n/a n/a
8 Kandiyohi 94.2% 0.3% 0.0% 2.3% 1.0% 2.3%
1.0%
8 Lac Qui Parle 100.0% 0.0% 0.0% 0.0% 0.0% 0.0%
4.8%
8 Meeker 98.3% 0.8% 0.0% 0.8% 0.0% 0.0%
1.7%
8 Pope 100.0% 0.0% 0.0% 0.0% 0.0% 0.0%
0.0%
8 Renville 97.5% 0.0% 1.3% 1.3% 0.0% 0.0%
0.0%
8 Stevens 98.1% 0.0% 0.0% 1.2% 0.0% 0.6%
1.8%
8 Swift 98.8% 1.2% 0.0% 0.0% 0.0% 0.0%
0.6%
8 Traverse 100.0% 0.0% 0.0% 0.0% 0.0% 0.0%
0.0%
8 Wilkin 98.4% 0.0% 1.6% 0.0% 0.0% 0.0%
0.0%
8 Yellow Medicine n/a n/a n/a n/a n/a n/a
n/a
Dist 8 Total 97.2% 0.4% 0.2% 1.1% 0.3% 0.8%
1.0%
9 Aitkin 97.4% 0.0% 0.0% 1.0% 1.0% 0.5%
2.5%
9 Beltrami 88.1% 0.4% 0.4% 0.4% 9.2% 1.5%
2.9%
9 Cass 94.9% 0.0% 0.0% 1.0% 2.5% 1.5%
2.0%
9 Clearwater 90.2% 0.0% 0.0% 1.0% 6.7% 2.1%
3.5%
9 Crow Wing 97.8% 0.0% 0.9% 0.3% 0.3% 0.6%
2.4%
9 Hubbard 97.1% 0.0% 0.0% 1.3% 1.0% 0.6%
0.7%
9 Itasca 97.0% 0.2% 0.2% 0.2% 1.2% 1.2%
1.8%
9 Kittson 90.9% 0.0% 0.0% 3.0% 3.0% 3.0%
3.0%
9 Koochiching 98.7% 0.0% 0.0% 0.0% 1.3% 0.0%
3.8%
9 Lake of the Woods 98.5% 0.0% 0.0% 0.0% 1.5% 0.0%
1.5%
9 Mahnomen 68.8% 0.0% 0.0% 0.0% 24.7% 6.5%
0.0%
9 Marshall 96.1% 0.0% 0.0% 2.4% 0.0% 1.6%
0.8%
9 Norman 95.8% 0.0% 0.0% 0.0% 4.2% 0.0%
4.0%
9 Pennington 90.9% 2.0% 0.0% 2.0% 4.0% 1.0%
2.0%
9 Polk 94.5% 0.0% 0.5% 2.1% 0.5% 2.4%
2.2%
9 Red Lake 100.0% 0.0% 0.0% 0.0% 0.0% 0.0%
3.0%
9 Roseau 100.0% 0.0% 0.0% 0.0% 0.0% 0.0%
3.2%
Dist 9 Total 94.1% 0.1% 0.3% 0.9% 3.1% 1.4%
2.2%
10 Anoka 90.7% 2.4% 2.6% 1.7% 0.9% 1.7%
1.0%
10 Chisago 97.5% 0.4% 0.0% 0.8% 0.4% 0.8%
0.8%
Data Details

82
10 Isanti 94.5% 0.8% 0.5% 1.3% 1.8% 1.3%
1.3%
10 Kanabec 96.4% 0.0% 0.4% 1.1% 1.1% 1.1%
0.7%
10 Pine 97.0% 0.0% 0.0% 0.6% 1.8% 0.6%
1.8%
10 Sherburne 96.9% 0.2% 0.6% 0.6% 0.7% 1.1%
0.8%
10 Washington 92.4% 1.4% 2.4% 1.8% 0.5% 1.4%
1.7%
10 Wright 96.3% 0.4% 0.7% 0.9% 0.7% 0.9%
0.7%
Dist 10 Total 94.0% 1.1% 1.5% 1.3% 0.8% 1.3%
1.2%
Statewide 90.2% 3.0% 2.4% 1.7% 1.0% 1.8%
1.2%
* Percent of each race is calculated based on the total number of responses to the race question. The number of non-respondents is not included in the calculation. There were 43,110 jurors statewide in 2011 who reported race data.
Data Details

83
Juror Gender for 2011**
District County Name % Female of
Respondents % Male of
Respondents
% gender missing or UnK
1 Carver 53.8% 46.2% 1.5%
1 Dakota 52.0% 48.0% 0.2%
1 Goodhue 59.0% 41.0% 1.7%
1 LeSueur 52.6% 47.4% 2.5%
1 McLeod 54.0% 46.0% 1.2%
1 Scott 53.4% 46.6% 0.9%
1 Sibley 45.9% 54.1% 0.0%
Dist 1 Total 52.9% 47.1% 0.7%
2 Dist 2 Total 51.5% 48.5% 1.1%
3 Dodge 53.6% 46.4% 0.6%
3 Fillmore 52.5% 47.5% 0.5%
3 Freeborn 44.9% 55.1% 1.5%
3 Houston 46.9% 53.1% 2.0%
3 Mower 49.4% 50.6% 0.0%
3 Olmsted 52.7% 47.3% 0.4%
3 Rice 49.5% 50.5% 1.5%
3 Steele 47.5% 52.5% 0.6%
3 Wabasha 40.4% 59.6% 0.0%
3 Waseca 49.7% 50.3% 1.1%
3 Winona 46.4% 53.6% 1.4%
Dist 3 Total 50.2% 49.8% 0.0%
4 Dist 4 Total 50.1% 49.9% 0.0%
5 Blue Earth 50.8% 49.2% 1.8%
5 Brown 54.5% 45.5% 1.6%
5 Cottonwood 42.3% 57.7% 2.7%
5 Faribault 54.8% 45.2% 0.0%
5 Jackson 55.7% 44.3% 0.5%
5 Lincoln 48.5% 51.5% 1.5%
5 Lyon 59.1% 40.9% 0.6%
5 Martin 51.0% 49.0% 3.8%
5 Murray 40.0% 60.0% 3.8%
5 Nicollet 51.2% 48.8% 0.0%
5 Nobles 52.4% 47.6% 0.6%
5 Pipestone 48.5% 51.5% 0.0%
5 Redwood 54.9% 45.1% 0.5%
5 Rock n/a n/a n/a
5 Watonwan 56.4% 43.6% 1.1%
Dist 5 Total 52.7% 47.3% 0.0%
6 Carlton 51.7% 48.3% 3.3%
6 Cook 54.3% 45.7% 2.1%
6 Lake 56.5% 43.5% 2.8%
6 St. Louis - Duluth 51.9% 48.1% 2.2%
6 St. Louis - Hibbing 47.4% 52.6% 1.4%
6 St. Louis - Virginia 52.6% 47.4% 1.2%
Dist 6 Total 51.8% 48.2% 0.0%
7 Becker 53.0% 47.0% 1.2%
7 Benton 51.9% 48.1% 1.5%
7 Clay 51.4% 48.6% 1.2%
7 Douglas 47.7% 52.3% 0.0%
7 Mille Lacs 53.0% 47.0% 0.9%
7 Morrison 47.9% 52.1% 0.4%
7 Otter Tail 49.8% 50.2% 0.3%
7 Stearns 52.1% 47.9% 1.5%
7 Todd 42.7% 57.3% 1.0%
Data Details
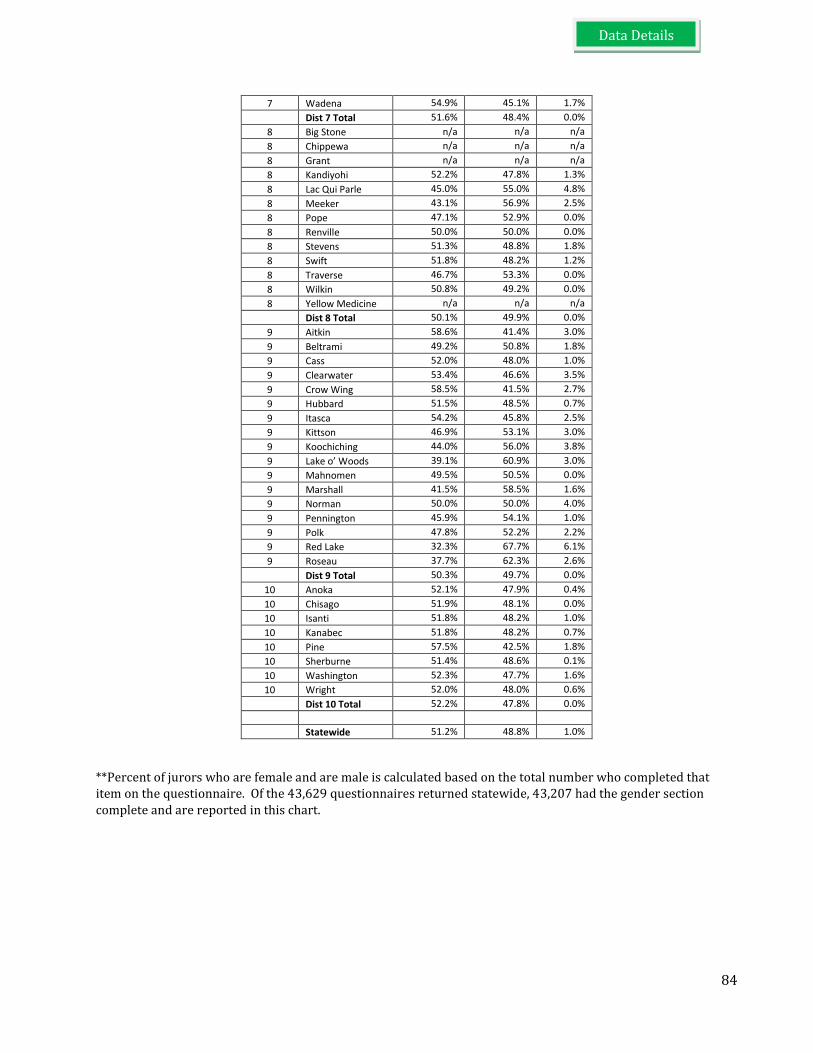
84
7 Wadena 54.9% 45.1% 1.7%
Dist 7 Total 51.6% 48.4% 0.0%
8 Big Stone n/a n/a n/a
8 Chippewa n/a n/a n/a
8 Grant n/a n/a n/a
8 Kandiyohi 52.2% 47.8% 1.3%
8 Lac Qui Parle 45.0% 55.0% 4.8%
8 Meeker 43.1% 56.9% 2.5%
8 Pope 47.1% 52.9% 0.0%
8 Renville 50.0% 50.0% 0.0%
8 Stevens 51.3% 48.8% 1.8%
8 Swift 51.8% 48.2% 1.2%
8 Traverse 46.7% 53.3% 0.0%
8 Wilkin 50.8% 49.2% 0.0%
8 Yellow Medicine n/a n/a n/a
Dist 8 Total 50.1% 49.9% 0.0%
9 Aitkin 58.6% 41.4% 3.0%
9 Beltrami 49.2% 50.8% 1.8%
9 Cass 52.0% 48.0% 1.0%
9 Clearwater 53.4% 46.6% 3.5%
9 Crow Wing 58.5% 41.5% 2.7%
9 Hubbard 51.5% 48.5% 0.7%
9 Itasca 54.2% 45.8% 2.5%
9 Kittson 46.9% 53.1% 3.0%
9 Koochiching 44.0% 56.0% 3.8%
9 Lake o’ Woods 39.1% 60.9% 3.0%
9 Mahnomen 49.5% 50.5% 0.0%
9 Marshall 41.5% 58.5% 1.6%
9 Norman 50.0% 50.0% 4.0%
9 Pennington 45.9% 54.1% 1.0%
9 Polk 47.8% 52.2% 2.2%
9 Red Lake 32.3% 67.7% 6.1%
9 Roseau 37.7% 62.3% 2.6%
Dist 9 Total 50.3% 49.7% 0.0%
10 Anoka 52.1% 47.9% 0.4%
10 Chisago 51.9% 48.1% 0.0%
10 Isanti 51.8% 48.2% 1.0%
10 Kanabec 51.8% 48.2% 0.7%
10 Pine 57.5% 42.5% 1.8%
10 Sherburne 51.4% 48.6% 0.1%
10 Washington 52.3% 47.7% 1.6%
10 Wright 52.0% 48.0% 0.6%
Dist 10 Total 52.2% 47.8% 0.0%
Statewide 51.2% 48.8% 1.0%
**Percent of jurors who are female and are male is calculated based on the total number who completed that item on the questionnaire. Of the 43,629 questionnaires returned statewide, 43,207 had the gender section complete and are reported in this chart.
Data Details