performance measures for - nccommunitycolleges.edu · by most recent term program area 28...
TRANSCRIPT

MEASURES forSTUDENT SUCCESS
2018 PERFORMANCE

THIS PAGE INTENTIONALLY LEFT “BLANK”

2018 PERFORMANCE
MEASURES for STUDENT SUCCESS
July 2018
NORTH CAROLINA COMMUNITY COLLEGE SYSTEM
Peter Hans, President
Jennifer Haygood, Chief of Staff
RESEARCH & PERFORMANCE MANAGEMENT
Bill Schneider, Associate Vice President
Katie Bao, Planning and Research Associate
Ashley Sieman, Director of Program Evaluation
Courtney Burns, National Reporting Coordinator
Bob Hemond, Education Research Analyst
7/11/18
CONTENTS
Introduction 2
Performance Summary 3
1. Basic Skills Student Progress 4
TABLE 1. BASIC SKILLS STUDENT PROGRESS, 2016-2017 5
2. Student Success Rate in College‐Level English Courses 6
TABLE 2. STUDENT SUCCESS RATE IN COLLEGE-LEVEL ENGLISH COURSES, FALL 2015 COHORT
7
3. Student Success Rate in College‐Level Math Courses 8
TABLE 3. STUDENT SUCCESS RATE IN COLLEGE-LEVEL MATH COURSES, FALL 2015 COHORT
9
4. First Year Progression 10
TABLE 4. FIRST YEAR PROGRESSION, FALL 2016 COHORT 11
5. Curriculum Student Completion 12
TABLE 5. CURRICULUM STUDENT COMPLETION, FALL 2011 COHORT 13
6. Licensure and Certification Passing Rate 14
TABLE 6. LICENSURE AND CERTIFICATION PASSING RATE, 2016-2017 15
7. College Transfer Performance 16
TABLE 7. COLLEGE TRANSFER PERFORMANCE, 2015-2016 COMMUNITY COLLEGE STUDENTS
17
Appendix – Additional Performance Measure Descriptions and Tables 19
FIRST-TIME FALL COHORT DESCRIPTION 21
BASIC SKILLS STUDENT PROGRESS, 2016-2017
- TABLE 1A‐1B. BY PLACEMENT LEVEL 22
STUDENT SUCCESS RATE IN COLLEGE-LEVEL ENGLISH COURSES, FALL 2015 COHORT
‐ TABLE 2A. BY AGE 24
STUDENT SUCCESS RATE IN COLLEGE-LEVEL MATH COURSES, FALL 2015 COHORT
‐ TABLE 3A. BY AGE 25
FIRST YEAR PROGRESSION, FALL 2016 COHORT
‐ TABLE 4A. BY RACE/ETHNICITY AND GENDER 26
‐ TABLE 4B. BY AGE 27
CURRICULUM STUDENT COMPLETION, FALL 2011 COHORT
‐ TABLE 5A-5B. BY MOST RECENT TERM PROGRAM AREA 28
‐ TABLE 5C. BY RACE/ETHNICITY AND GENDER 30
‐ TABLE 5D. BY AGE 31
LICENSURE AND CERTIFICATION PASSING RATE, JULY 2016- JUNE 2017
- TABLE 6A. AVIATION, MASSAGE & BODY WORK 32
- TABLE 6B. NUC. MED. TECH, RADIATION THERAPY, RADIOGRAPHY, REAL ESTATE SALES
33
LICENSURE AND CERTIFICATION PASSING RATE, JANUARY 2017- DECEMBER 2017
- TABLE 6C. COSMETIC ARTS 34
- TABLE 6D. BLET, DETENTION OFFICER, EMT, EMT-I, EMT-P 35
- TABLE 6E. DENTAL HYGIENE, PHYSICAL THERAPIST ASST., NURSING, VET. MED.TECH.
36

Introduction
Performance Measures
The Performance Measures for Student Success Report is the North Carolina Community College System’s major accountability document. This annual performance report is based on data compiled during the previous year and serves to inform colleges and the public on the performance of our 58 community colleges.
In 1993, the State Board of Community Colleges began monitoring performance data on specific measures to ensure public accountability for programs and services. In 1998, the General Assembly directed the State Board to review past performance measures and define standards to ensure programs and services offered by community colleges in North Carolina were of sufficient quality.
In 2010, a Performance Measures Committee was established to develop new performance‐based student success measures to go into effect in 2013. During the development of these measures, it was determined that it was important to establish a three-year review process to ensure the measures and methods for evaluating colleges were current and remained focused on improving student success.
To facilitate the first three-year review of the measures, the Performance Measures Adjustment Committee was appointed to review the current set of measures and recommend deletions, revisions, and additions. This included individuals representing college leadership and research. The Committee formally presented the following seven measures to the State Board in March 2015:
• Basic Skills Student Progress
• Student Success Rate in College‐Level English Courses
• Student Success Rate in College‐Level Math Courses
• First Year Progression
• Curriculum Student Completion
• Licensure and Certification Passing Rate
• College Transfer Performance
These measures were approved by the State Board and adopted by the General Assembly in 2016 through Section 10.1 of S.L.2016-94.
Baselines and Excellence Levels
As previous performance measures were being finalized in 2012, a Performance Funding Committee was appointed to develop a performance funding model incorporated into colleges’ regular formula budget allocations. One of the outcomes of this committee was the establishment of system‐wide baseline and excellence levels for each measure. The committee recommended using consistent, statistically‐defined levels to promote transparency, simplicity, and objectivity. This utilization of the levels is a departure from the System’s historical use of “standards.”
Based on three years of data (if available) for each measure, baseline levels are set two standard deviations below the system mean, and excellence levels are set one standard deviation above the system mean. These levels remain static for three years and are reset every three years.
The performance summary on the following page provides each college with an overview of its results as compared to its peers. Color indicators represent various levels of performance within each measure:
Met or exceeded the excellence level Above the baseline level, but below the college avg.
Above the college avg., but below the excellence level Below the baseline level
Note: Color shading in the appendix is not associated with excellence and baseline levels
2

Performance Summary
Met or Exceeded Excellence Level
Above College Avg, Below Excellence
Above Baseline Level, Below Average
Below Baseline Level
BASIC SKILLS
PROGRESS
CREDIT
ENGLISH
SUCCESS
CREDIT MATH
SUCCESS
FIRST YEAR PROGRESSION
CURR
COMPLETION
RATE
LICENSURE
PASSING
RATE
TRANSFER PERFORMANCE
System Excellence Level 68.3% 55.9% 32.5% 75.0% 51.9% 90.9% 87.6%
System Baseline 34.5% 23.8% 10.1% 54.1% 35.9% 69.9% 65.1%
Average College Percentage 60.1% 53.0% 32.5% 70.9% 43.4% 79.8% 83.7%
System Totals (All Students) 58.4% 55.0% 33.8% 69.6% 43.9% 81.6% 83.4%
Alamance CC 49.8% 62.6% 41.1% 77.5% 44.1% 76.7% 80.8% 3 1 3 0
Asheville-Buncombe TCC 55.8% 39.5% 28.2% 71.6% 46.8% 86.8% 90.9% 1 3 3 0
Beaufort County CC 56.3% 49.5% 45.9% 79.4% 36.3% 74.6% 89.7% 3 0 4 0
Bladen CC 62.7% 54.9% 30.9% 57.4% 30.5% 80.7% 83.6% 0 3 3 1
Blue Ridge CC 62.6% 48.4% 28.7% 66.4% 38.2% 75.3% 93.5% 1 1 5 0
Brunswick CC 69.0% 53.1% 44.5% 73.3% 47.8% 87.2% 80.8% 2 4 1 0
Caldwell CC & TI 51.9% 40.6% 36.6% 73.5% 38.7% 88.8% 79.1% 1 2 4 0
Cape Fear CC 51.9% 62.0% 40.8% 67.1% 45.8% 84.0% 81.3% 2 2 3 0
Carteret CC 53.9% 53.7% 30.9% 67.9% 43.7% 79.8% 83.1% 0 2 5 0
Catawba Valley CC 65.8% 68.1% 31.9% 78.6% 42.0% 86.3% 82.9% 2 2 3 0
Central Carolina CC 72.9% 41.6% 34.9% 75.8% 41.4% 80.4% 80.9% 3 1 3 0
Central Piedmont CC 54.3% 65.6% 41.2% 69.2% 44.5% 86.4% 80.2% 2 2 3 0
Cleveland CC 76.8% 36.0% 43.1% 81.1% 44.1% 79.6% 88.9% 4 1 2 0
Coastal Carolina CC 61.9% 70.3% 36.0% 71.3% 52.0% 95.4% 86.5% 4 3 0 0
College of The Albemarle 61.1% 55.0% 30.5% 76.7% 48.4% 75.7% 84.4% 1 4 2 0
Craven CC 59.4% 64.0% 31.7% 74.2% 42.7% 74.3% 82.2% 1 1 5 0
Davidson County CC 69.3% 64.4% 42.7% 75.5% 50.8% 76.6% 79.9% 4 1 2 0
Durham TCC 51.1% 55.9% 35.9% 65.1% 44.6% 88.9% 84.5% 2 3 2 0
Edgecombe CC 72.1% 61.8% 23.7% 72.3% 30.7% 80.9% 79.5% 2 2 2 1
Fayetteville TCC 55.0% 43.7% 21.8% 65.1% 41.3% 87.0% 83.9% 0 2 5 0
Forsyth TCC 52.0% 61.0% 32.4% 72.6% 42.1% 86.7% 86.1% 1 3 3 0
Gaston College 57.6% 52.1% 27.1% 67.2% 42.9% 90.8% 79.8% 0 1 6 0
Guilford TCC 41.5% 51.0% 27.5% 56.6% 41.2% 83.1% 80.4% 0 1 6 0
Halifax CC 55.4% 67.3% 24.8% 66.7% 33.2% 70.9% 72.0% 1 0 5 1
Haywood CC 88.0% 51.9% 25.0% 76.5% 46.6% 87.7% 90.0% 3 2 2 0
Isothermal CC 54.1% 63.8% 17.7% 80.6% 43.7% 76.2% 90.0% 3 1 3 0
James Sprunt CC 60.6% 46.6% 31.4% 80.4% 53.9% 65.1% 88.4% 3 1 2 1
Johnston CC 78.3% 57.6% 44.4% 72.4% 49.1% 84.7% 87.6% 3 4 0 0
Lenoir CC 63.6% 50.8% 31.8% 64.5% 41.9% 70.6% 82.0% 0 1 6 0
Martin CC 55.2% 32.7% 32.0% 64.1% 35.7% 61.7% 81.0% 0 0 5 2
Mayland CC 65.4% 28.8% 22.5% 73.6% 46.3% 82.0% 70.6% 0 4 3 0
McDowell TCC 63.8% 66.7% 37.6% 76.5% 42.1% 87.3% 93.1% 4 2 1 0
Mitchell CC 54.1% 50.7% 29.8% 71.2% 52.1% 75.5% 83.3% 1 1 5 0
Montgomery CC 51.4% 53.8% 18.8% 68.2% 47.5% 86.8% 70.0% 0 3 4 0
Nash CC 54.3% 35.7% 37.8% 67.0% 44.0% 73.9% 91.5% 2 1 4 0
Pamlico CC 83.1% 40.4% 50.0% 75.3% 54.1% 54.5% 88.9% 5 0 1 1
Piedmont CC 55.1% 63.0% 35.5% 75.3% 38.9% 69.2% 76.5% 3 0 3 1
Pitt CC 60.8% 49.1% 28.3% 62.1% 42.6% 78.1% 74.7% 0 1 6 0
Randolph CC 59.8% 61.9% 33.6% 76.2% 44.3% 86.3% 79.0% 3 2 2 0
Richmond CC 48.4% 52.3% 46.4% 64.9% 48.2% 87.5% 81.3% 1 2 4 0
Roanoke-Chowan CC 38.0% 41.6% 7.9% 66.7% 40.9% 75.0% 71.4% 0 0 6 1
Robeson CC 52.6% 46.6% 40.1% 56.1% 28.9% 74.7% 86.6% 1 1 4 1
Rockingham CC 66.9% 54.9% 29.9% 68.5% 44.9% 70.1% 86.2% 0 4 3 0
Rowan-Cabarrus CC 54.0% 59.7% 24.8% 65.3% 41.6% 73.1% 85.9% 1 1 5 0
Sampson CC 56.6% 48.3% 25.5% 73.2% 46.7% 71.4% 87.9% 1 2 4 0
Sandhills CC 54.8% 56.5% 29.6% 66.7% 42.2% 85.6% 83.2% 1 1 5 0
South Piedmont CC 57.0% 44.3% 30.5% 70.0% 39.4% 79.0% 81.3% 0 0 7 0
Southeastern CC 67.1% 47.7% 28.9% 70.0% 35.4% 79.0% 81.9% 0 1 5 1
Southwestern CC 55.4% 60.3% 40.5% 69.6% 45.5% 85.0% 93.7% 3 2 2 0
Stanly CC 49.3% 44.6% 30.8% 75.1% 43.2% 78.8% 89.7% 2 0 5 0
Surry CC 49.4% 47.0% 20.9% 77.9% 41.2% 93.9% 85.0% 2 1 4 0
Tri-County CC 67.7% 72.4% 25.2% 84.8% 44.7% 63.2% 93.0% 3 2 1 1
Vance-Granville CC 58.7% 48.0% 23.7% 66.6% 43.4% 84.3% 85.9% 0 2 5 0
Wake TCC 66.5% 55.6% 37.1% 67.7% 48.2% 92.4% 85.2% 2 4 1 0
Wayne CC 74.5% 63.0% 30.3% 69.9% 49.4% 88.6% 80.1% 2 2 3 0
Western Piedmont CC 82.9% 65.0% 46.0% 79.2% 42.4% 81.5% 84.1% 4 2 1 0
Wilkes CC 65.0% 52.8% 48.9% 80.9% 51.2% 66.3% 87.5% 2 3 1 1
Wilson CC 51.8% 37.8% 29.8% 53.9% 45.1% 81.8% 85.9% 0 3 3 1
Note: Color indicators are based on the precise percentages and not the rounded percentages as displayed
Me
t o
r Ex
ceed
ed
Exce
llen
ce L
evel
Bel
ow
Bas
elin
e Le
vel
Bel
ow
Co
llege
Ave
rage
,
Ab
ove
Bas
elin
e Le
vel
Bel
ow
Exc
elle
nce
Lev
el,
Ab
ove
Co
llege
Ave
rage
3

1. Basic Skills Student Progress
Purpose
To ensure adult students with low literacy skills are progressing academically toward basic skill attainment necessary for employment and self-sufficiency.
Description
Percentage of Basic Skills students who achieve an Educational Functioning Level gain during the program year (July 1 – June 30).
Calculation
Denominator: Basic Skills students (excluding those with an entering Educational Functioning Level of Adult Secondary Education High) who have completed a pre-test and post-test and accumulated 12 or more contact hours during the program year (July 1, 2016 – June 30, 2017).
Numerator: Of those in the denominator, the number who achieve an Educational Functioning Level that is higher than their entering Educational Functioning Level by the end of the program year.
Data Sources
Literacy Education Information System (LEIS) annual data file.
Additional Details
To be included, students must have been enrolled in a class during the Basic Skills program year (July 1 – June 30), have accumulated 12 or more contact hours across all classes enrolled, have an initial placement based on a pre-test, and have a completed post-test. Students with an initial placement of Adult Secondary Education High (ASE High) are excluded because this is the highest Educational Functioning Level and a gain is not possible.
A student’s Entering Educational Functioning Level is determined based on the student’s performance on the first NRS approved test(s) taken during the program year. Per National Reporting System (NRS) guidelines, initial placement is based on the lowest Educational Functioning Level of the tests given within 3 days of the first test of the program year. A pre-test is considered if it occurs up to 90 days prior to the program year and the test code and component match the test code and component of the test having the lowest Educational Functioning Level of the first test(s) in the program year.
Colleges receive credit for all students who test at a higher Educational Functioning Level than their entering Educational Functioning Level at any point during the Basic Skills program year.
Excellence level: 68.3%
Baseline level: 34.5%
4

TABLE 1. BASIC SKILLS STUDENT PROGRESS, 2016-2017
Excellence: 68.3%
Baseline: 34.5% STUDENTS
(Denominator) 16-17 15-16 14-15 13-14 12-13
System Totals 34,226 20,002 58.4% 58% 56% 58% 58%
Alamance CC 969 483 49.8% 49% 46% 44% 35%
Asheville-Buncombe TCC 799 446 55.8% 56% 54% 61% 54%
Beaufort County CC 215 121 56.3% 45% 51% 52% 50%
Bladen CC 150 94 62.7% 69% 62% 63% 57%
Blue Ridge CC 398 249 62.6% 49% 54% 61% 57%
Brunswick CC 261 180 69.0% 70% 69% 66% 65%
Caldwell CC & TI 374 194 51.9% 40% 42% 53% 56%
Cape Fear CC 835 433 51.9% 52% 56% 56% 56%
Carteret CC 167 90 53.9% 68% 69% 56% 61%
Catawba Valley CC 401 264 65.8% 61% 50% 57% 59%
Central Carolina CC 1,056 770 72.9% 77% 68% 60% 63%
Central Piedmont CC 3,303 1,794 54.3% 56% 55% 60% 61%
Cleveland CC 125 96 76.8% 79% 81% 81% 87%
Coastal Carolina CC 616 381 61.9% 74% 82% 82% 79%
College of The Albemarle 252 154 61.1% 56% 53% 53% 59%
Craven CC 286 170 59.4% 55% 53% 59% 50%
Davidson County CC 892 618 69.3% 63% 63% 60% 65%
Durham TCC 1,451 742 51.1% 55% 53% 50% 49%
Edgecombe CC 362 261 72.1% 63% 64% 74% 67%
Fayetteville TCC 2,212 1,217 55.0% 60% 54% 56% 54%
Forsyth TCC 896 466 52.0% 54% 54% 65% 65%
Gaston College 689 397 57.6% 59% 57% 60% 59%
Guilford TCC 1,796 746 41.5% 40% 38% 45% 47%
Halifax CC 175 97 55.4% 51% 49% 57% 52%
Haywood CC 83 73 88.0% 74% 66% 63% 69%
Isothermal CC 170 92 54.1% 43% 40% 55% 55%
James Sprunt CC 132 80 60.6% 78% 73% 80% 82%
Johnston CC 469 367 78.3% 76% 69% 60% 61%
Lenoir CC 728 463 63.6% 70% 64% 64% 66%
Martin CC 172 95 55.2% 58% 49% 52% 44%
Mayland CC 431 282 65.4% 63% 45% 45% 48%
McDowell TCC 224 143 63.8% 70% 63% 52% 50%
Mitchell CC 351 190 54.1% 50% 39% 44% 51%
Montgomery CC 138 71 51.4% 59% 57% 60% 51%
Nash CC 282 153 54.3% 44% 45% 51% 48%
Pamlico CC 65 54 83.1% 87% 67% 73% 55%
Piedmont CC 198 109 55.1% 51% 49% 47% 49%
Pitt CC 587 357 60.8% 53% 57% 48% 50%
Randolph CC 592 354 59.8% 58% 47% 47% 59%
Richmond CC 632 306 48.4% 47% 57% 57% 53%
Roanoke-Chowan CC 100 38 38.0% 41% 41% 31% 51%
Robeson CC 612 322 52.6% 58% 60% 57% 62%
Rockingham CC 284 190 66.9% 76% 67% 50% 61%
Rowan-Cabarrus CC 884 477 54.0% 55% 48% 57% 69%
Sampson CC 516 292 56.6% 49% 54% 49% 57%
Sandhills CC 334 183 54.8% 48% 38% 36% 38%
South Piedmont CC 762 434 57.0% 50% 53% 59% 62%
Southeastern CC 489 328 67.1% 54% 59% 65% 67%
Southwestern CC 370 205 55.4% 65% 64% 63% 65%
Stanly CC 223 110 49.3% 64% 58% 67% 65%
Surry CC 318 157 49.4% 43% 43% 48% 50%
Tri-County CC 99 67 67.7% 52% 46% 43% 38%
Vance-Granville CC 491 288 58.7% 57% 57% 57% 76%
Wake TCC 3,069 2,040 66.5% 65% 62% 62% 54%
Wayne CC 875 652 74.5% 80% 69% 77% 79%
Western Piedmont CC 228 189 82.9% 73% 58% 28% 32%
Wilkes CC 360 234 65.0% 49% 49% 48% 55%
Wilson CC 278 144 51.8% 67% 65% 77% 92%
% COMPLETINGCOMPLETING
LEVEL
5

2. Student Success Rate in College-Level English Courses
Purpose
To ensure students are successfully completing credit-bearing English courses within their first two academic years.
Description
Percentage of first-time Associate Degree seeking and transfer pathway students passing a credit-bearing English course with a “C” or better within two years of their first term of enrollment.
Calculation
Denominator: First-time fall 2015 curriculum students who are enrolled in an associate degree program or a transfer pathway program (i.e., their curriculum code begins with an “A” or “P”) during the fall of 2015.
Numerator: Of those in the denominator, the number of students earning a grade of “C” or better in at least one credit-bearing English course during their first two academic years (through the end of the summer 2017 term).
Note: See appendix for first-time fall cohort definition.
Data Sources
Curriculum Registration, Progress, Financial Aid Report (CRPFAR) data file
National Student Clearinghouse (NSC)
Excellence level: 55.9%
Baseline level: 23.8%
6

TABLE 2. STUDENT SUCCESS RATE IN COLLEGE-LEVEL ENGLISH COURSES, FALL 2015 COHORT
Excellence: 55.9%
Baseline: 23.8%2015 2014 2013 2012
System Totals 37,635 26,371 20,704 55.0% 52% 48% 47%
Alamance CC 738 553 462 62.6% 58% 57% 50%
Asheville-Buncombe TCC 929 471 367 39.5% 38% 38% 35%
Beaufort County CC 218 136 108 49.5% 36% 34% 40%
Bladen CC 175 135 96 54.9% 61% 40% 30%
Blue Ridge CC 289 185 140 48.4% 50% 41% 46%
Brunswick CC 337 218 179 53.1% 64% 63% 61%
Caldwell CC & TI 756 389 307 40.6% 50% 49% 45%
Cape Fear CC 1558 1226 966 62.0% 58% 58% 56%
Carteret CC 259 165 139 53.7% 58% 55% 57%
Catawba Valley CC 930 721 633 68.1% 63% 64% 57%
Central Carolina CC 786 461 327 41.6% 41% 38% 37%
Central Piedmont CC 3918 3111 2570 65.6% 59% 54% 55%
Cleveland CC 397 179 143 36.0% 35% 32% 42%
Coastal Carolina CC 778 654 547 70.3% 64% 64% 60%
College of The Albemarle 522 344 287 55.0% 55% 45% 43%
Craven CC 583 465 373 64.0% 61% 55% 48%
Davidson County CC 691 535 445 64.4% 61% 65% 64%
Durham TCC 660 481 369 55.9% 55% 48% 41%
Edgecombe CC 207 163 128 61.8% 45% 43% 31%
Fayetteville TCC 1714 1114 749 43.7% 37% 34% 30%
Forsyth TCC 1306 1001 797 61.0% 57% 55% 52%
Gaston College 1075 714 560 52.1% 56% 55% 53%
Guilford TCC 1846 1345 942 51.0% 48% 44% 41%
Halifax CC 202 167 136 67.3% 50% 46% 47%
Haywood CC 208 138 108 51.9% 50% 46% 49%
Isothermal CC 243 178 155 63.8% 61% 58% 58%
James Sprunt CC 191 100 89 46.6% 41% 31% 29%
Johnston CC 894 599 515 57.6% 54% 51% 52%
Lenoir CC 425 268 216 50.8% 44% 30% 36%
Martin CC 150 72 49 32.7% 30% 29% 34%
Mayland CC 160 75 46 28.8% 28% 40% 28%
McDowell TCC 186 136 124 66.7% 66% 55% 53%
Mitchell CC 685 459 347 50.7% 56% 45% 45%
Montgomery CC 80 54 43 53.8% 64% 47% 59%
Nash CC 518 251 185 35.7% 35% 39% 36%
Pamlico CC 52 29 21 40.4% 37% 32% 41%
Piedmont CC 138 102 87 63.0% 63% 56% 42%
Pitt CC 1142 728 561 49.1% 44% 42% 49%
Randolph CC 565 425 350 61.9% 62% 59% 55%
Richmond CC 457 301 239 52.3% 60% 44% 46%
Roanoke-Chowan CC 101 48 42 41.6% 36% 29% 21%
Robeson CC 459 328 214 46.6% 35% 33% 23%
Rockingham CC 388 304 213 54.9% 53% 54% 50%
Rowan-Cabarrus CC 1174 848 701 59.7% 57% 56% 55%
Sampson CC 267 167 129 48.3% 43% 38% 28%
Sandhills CC 524 369 296 56.5% 45% 45% 46%
South Piedmont CC 531 312 235 44.3% 57% 41% 48%
Southeastern CC 277 170 132 47.7% 37% 33% 30%
Southwestern CC 378 258 228 60.3% 52% 44% 45%
Stanly CC 312 174 139 44.6% 49% 46% 50%
Surry CC 321 219 151 47.0% 49% 54% 48%
Tri-County CC 210 180 152 72.4% 77% 64% 65%
Vance-Granville CC 596 347 286 48.0% 44% 41% 39%
Wake TCC 3306 2488 1837 55.6% 52% 49% 52%
Wayne CC 684 538 431 63.0% 58% 53% 44%
Western Piedmont CC 417 329 271 65.0% 65% 62% 62%
Wilkes CC 460 302 243 52.8% 46% 58% 50%
Wilson CC 262 142 99 37.8% 41% 40% 35%
FALL COHORT
(Denominator)CRED ENG ENROLLMENT
CREDIT ENG SUCCESS
(Numerator)
% SUCCESSFUL
7

3. Student Success Rate in College-Level Math Courses Purpose
To ensure students are successfully completing credit-bearing Math courses within their first two academic years.
Description
Percentage of first-time Associate Degree seeking and transfer pathway students passing a credit-bearing Math course with a “C” or better within two years of their first term of enrollment.
Calculation
Denominator: First-time fall 2015 curriculum students who are enrolled in an associate degree program or a transfer pathway program (i.e., their curriculum code begins with an “A” or “P”) during the fall of 2015.
Numerator: Of those in the denominator, the number earning a grade of “C” or better in at least one credit-bearing Math course (not including the lab record) within their first two academic years (through the end of the summer 2017 term).
Note: See appendix for first-time fall cohort definition
Data Sources
Curriculum Registration, Progress, Financial Aid Report (CRPFAR) data file
National Student Clearinghouse (NSC)
Excellence level: 32.5%
Baseline level: 10.1%
8

TABLE 3. STUDENT SUCCESS RATE IN COLLEGE-LEVEL MATH COURSES, FALL 2015 COHORT
Excellence: 32.5%
Baseline: 10.1%2015 2014 2013 2012
System Totals 37,635 17,137 12,711 33.8% 30% 28% 26%
Alamance CC 738 391 303 41.1% 33% 33% 29%
Asheville-Buncombe TCC 929 338 262 28.2% 26% 29% 30%
Beaufort County CC 218 121 100 45.9% 28% 29% 32%
Bladen CC 175 70 54 30.9% 43% 22% 18%
Blue Ridge CC 289 109 83 28.7% 32% 26% 24%
Brunswick CC 337 187 150 44.5% 46% 43% 41%
Caldwell CC & TI 756 320 277 36.6% 41% 47% 37%
Cape Fear CC 1558 859 635 40.8% 36% 39% 34%
Carteret CC 259 114 80 30.9% 29% 28% 23%
Catawba Valley CC 930 412 297 31.9% 29% 30% 24%
Central Carolina CC 786 358 274 34.9% 29% 29% 38%
Central Piedmont CC 3918 2120 1616 41.2% 37% 35% 34%
Cleveland CC 397 199 171 43.1% 38% 26% 24%
Coastal Carolina CC 778 352 280 36.0% 32% 44% 27%
College of The Albemarle 522 228 159 30.5% 27% 24% 25%
Craven CC 583 243 185 31.7% 27% 26% 26%
Davidson County CC 691 381 295 42.7% 33% 30% 29%
Durham TCC 660 293 237 35.9% 33% 33% 24%
Edgecombe CC 207 72 49 23.7% 14% 16% 14%
Fayetteville TCC 1714 563 374 21.8% 19% 18% 15%
Forsyth TCC 1306 563 423 32.4% 27% 27% 28%
Gaston College 1075 377 291 27.1% 29% 26% 20%
Guilford TCC 1846 734 508 27.5% 28% 19% 17%
Halifax CC 202 81 50 24.8% 21% 12% 14%
Haywood CC 208 77 52 25.0% 26% 25% 23%
Isothermal CC 243 57 43 17.7% 22% 19% 21%
James Sprunt CC 191 80 60 31.4% 25% 21% 16%
Johnston CC 894 458 397 44.4% 38% 33% 32%
Lenoir CC 425 186 135 31.8% 29% 17% 23%
Martin CC 150 68 48 32.0% 32% 28% 32%
Mayland CC 160 43 36 22.5% 16% 28% 23%
McDowell TCC 186 77 70 37.6% 51% 40% 31%
Mitchell CC 685 299 204 29.8% 31% 28% 26%
Montgomery CC 80 22 15 18.8% 23% 26% 20%
Nash CC 518 226 196 37.8% 34% 33% 26%
Pamlico CC 52 31 26 50.0% 36% 30% 23%
Piedmont CC 138 66 49 35.5% 29% 27% 26%
Pitt CC 1142 457 323 28.3% 22% 23% 27%
Randolph CC 565 246 190 33.6% 30% 28% 24%
Richmond CC 457 267 212 46.4% 40% 30% 35%
Roanoke-Chowan CC 101 10 8 7.9% 5% 9% 11%
Robeson CC 459 235 184 40.1% 20% 17% 9%
Rockingham CC 388 175 116 29.9% 29% 28% 27%
Rowan-Cabarrus CC 1174 476 291 24.8% 22% 21% 17%
Sampson CC 267 116 68 25.5% 26% 33% 21%
Sandhills CC 524 222 155 29.6% 20% 22% 27%
South Piedmont CC 531 240 162 30.5% 24% 16% 19%
Southeastern CC 277 122 80 28.9% 21% 18% 15%
Southwestern CC 378 181 153 40.5% 30% 28% 28%
Stanly CC 312 117 96 30.8% 32% 33% 31%
Surry CC 321 81 67 20.9% 26% 34% 19%
Tri-County CC 210 70 53 25.2% 18% 17% 28%
Vance-Granville CC 596 199 141 23.7% 20% 10% 11%
Wake TCC 3306 1850 1226 37.1% 32% 31% 28%
Wayne CC 684 289 207 30.3% 27% 28% 20%
Western Piedmont CC 417 219 192 46.0% 38% 36% 37%
Wilkes CC 460 283 225 48.9% 38% 45% 43%
Wilson CC 262 107 78 29.8% 29% 28% 25%
CRED MAT ENROLLMENTFALL COHORT
(Denominator)
CREDIT MAT SUCCESS
(Numerator)
% SUCCESSFUL
9

4. First-Year Progression Purpose
To ensure first-year students reach an academic momentum point that helps predict future credential completion.
Description
Percentage of first-time fall curriculum students attempting at least 12 credit hours who successfully complete at least 12 hours within their first academic year (fall, spring, summer).
Calculation
Denominator: First-time fall 2016 curriculum students attempting at least 12 hours during the 2017 academic year (fall 2016, spring 2017, summer 2017). Hours attempted are calculated for all courses (including developmental and course withdraws) in which the student earned a standard letter grade of A, B, C, D, F, P or W. Hours attempted do not include courses in which the student earned a standard letter grade of AU (Audit), CE (Credit by Exam), I or IP (Incomplete), O (Other), or U (Unknown).
Numerator: Of those in the denominator, the number who complete at least 12 hours (including developmental courses) with a standard letter grade of A, B, C, or P, within their first academic year.
Note: See appendix for new first-time fall cohort definition.
Data Sources
Curriculum Registration, Progress, Financial Aid Report (CRPFAR) data file
National Student Clearinghouse (NSC)
Excellence level: 75.0%
Baseline level: 54.1%
10

TABLE 4. FIRST YEAR PROGRESSION, FALL 2016 COHORT
Excellence: 75.0%
Baseline: 54.1%16-17 15-16 14-15 13-14 12-13
System Totals 49,355 30,766 21,401 69.6% 70% 68% 68% 69%
Alamance CC 1,160 748 580 77.5% 74% 71% 75% 70%
Asheville-Buncombe TCC 1,474 649 465 71.6% 70% 74% 73% 73%
Beaufort County CC 287 126 100 79.4% 67% 64% 56% 62%
Bladen CC 176 129 74 57.4% 70% 69% 60% 57%
Blue Ridge CC 537 345 229 66.4% 64% 77% 70% 71%
Brunswick CC 253 191 140 73.3% 78% 73% 73% 77%
Caldwell CC & TI 890 408 300 73.5% 76% 70% 72% 70%
Cape Fear CC 1,808 1,378 925 67.1% 71% 72% 70% 71%
Carteret CC 363 209 142 67.9% 69% 66% 67% 52%
Catawba Valley CC 1,369 889 699 78.6% 79% 74% 76% 69%
Central Carolina CC 1,646 887 672 75.8% 73% 73% 70% 68%
Central Piedmont CC 4,496 3,209 2220 69.2% 72% 69% 70% 73%
Cleveland CC 786 512 415 81.1% 78% 71% 70% 68%
Coastal Carolina CC 802 568 405 71.3% 76% 74% 76% 75%
College of The Albemarle 649 395 303 76.7% 76% 69% 70% 72%
Craven CC 615 325 241 74.2% 75% 72% 75% 72%
Davidson County CC 890 591 446 75.5% 74% 74% 75% 80%
Durham TCC 902 634 413 65.1% 65% 63% 63% 65%
Edgecombe CC 254 155 112 72.3% 68% 64% 54% 58%
Fayetteville TCC 2,053 1,493 972 65.1% 63% 56% 53% 61%
Forsyth TCC 1,558 1,146 832 72.6% 68% 68% 73% 73%
Gaston College 1,367 806 542 67.2% 72% 71% 74% 73%
Guilford TCC 1,934 1,538 870 56.6% 60% 59% 64% 64%
Halifax CC 345 141 94 66.7% 68% 57% 60% 65%
Haywood CC 326 204 156 76.5% 68% 70% 65% 69%
Isothermal CC 364 217 175 80.6% 75% 75% 76% 70%
James Sprunt CC 316 148 119 80.4% 75% 74% 76% 64%
Johnston CC 1,101 706 511 72.4% 77% 73% 75% 77%
Lenoir CC 567 313 202 64.5% 70% 64% 61% 66%
Martin CC 162 64 41 64.1% 69% 72% 61% 68%
Mayland CC 339 87 64 73.6% 60% 65% 62% 75%
McDowell TCC 257 119 91 76.5% 74% 78% 70% 60%
Mitchell CC 816 486 346 71.2% 67% 71% 65% 74%
Montgomery CC 208 107 73 68.2% 72% 67% 70% 84%
Nash CC 731 318 213 67.0% 69% 63% 65% 64%
Pamlico CC 110 81 61 75.3% 74% 78% 75% 83%
Piedmont CC 354 162 122 75.3% 73% 72% 81% 77%
Pitt CC 1,322 936 581 62.1% 60% 55% 58% 66%
Randolph CC 807 407 310 76.2% 75% 72% 70% 62%
Richmond CC 594 225 146 64.9% 67% 62% 70% 74%
Roanoke-Chowan CC 226 81 54 66.7% 71% 59% 65% 68%
Robeson CC 533 351 197 56.1% 52% 53% 39% 48%
Rockingham CC 438 267 183 68.5% 67% 63% 68% 72%
Rowan-Cabarrus CC 1,422 851 556 65.3% 64% 62% 62% 61%
Sampson CC 398 190 139 73.2% 72% 67% 71% 78%
Sandhills CC 997 517 345 66.7% 69% 65% 67% 67%
South Piedmont CC 774 337 236 70.0% 69% 67% 62% 64%
Southeastern CC 297 200 140 70.0% 57% 63% 47% 53%
Southwestern CC 604 250 174 69.6% 74% 73% 71% 71%
Stanly CC 472 301 226 75.1% 77% 69% 69% 74%
Surry CC 490 154 120 77.9% 75% 73% 77% 68%
Tri-County CC 305 178 151 84.8% 78% 68% 68% 69%
Vance-Granville CC 775 443 295 66.6% 69% 71% 65% 70%
Wake TCC 4,185 3,244 2197 67.7% 68% 68% 68% 72%
Wayne CC 766 445 311 69.9% 69% 73% 71% 72%
Western Piedmont CC 434 322 255 79.2% 78% 74% 73% 78%
Wilkes CC 735 392 317 80.9% 78% 71% 74% 77%
Wilson CC 516 191 103 53.9% 72% 65% 67% 68%
% SUCCESSFULFALL COHORT
12 HOURS ATTEMPTED
(Denominator)
12 HOURS SUCCESSFUL
(Numerator)
11

5. Curriculum Completion Purpose
To ensure student completion and/or persistence toward a post-secondary credential.
Description
Percentage of first-time fall curriculum students who, within six years of first term of enrollment, have either graduated, transferred, or are still enrolled with at least 36 non-developmental credit hours.
Calculation
Denominator: First-time fall 2011 curriculum students.
Numerator: Of those in the denominator, the number who graduate, transfer to a four-year institution, or are still enrolled but have completed 36 non-developmental credit hours before the end of the 6th fall term (Fall 2017) following their first term of enrollment.
Note: See appendix for new first-time fall cohort definition.
Data Sources
Curriculum Registration, Progress, Financial Aid Report (CRPFAR) data file
National Student Clearinghouse (NSC)
Additional Details
Denominator: First-time fall curriculum students
Numerator: Of those in the denominator, number of students who achieve at least one of the following:
Graduation: Has earned an Associates degree, diploma, or certificate from a North Carolina Community College before the end of the 6th fall term following their first term of enrollment.
Transfer: Has an enrollment record at a four-year college in the National Student Clearinghouse’s database at any point through the end of the 6th fall term following their first term of enrollment.
Persistence: Has an enrollment record at any North Carolina Community College during the 6th fall term following their first term of enrollment and has successfully completed at least 36 non-developmental credits prior to that semester. Successful credit completion is counted for any course in which the student has earned a standard letter grade of A, B, C or P.
Excellence level: 51.9%
Baseline level: 35.9%
12

TABLE 5. CURRICULUM COMPLETION, FALL 2011 COHORT
Excellence: 51.9%
Baseline: 35.9%
2011 2010 2009 2008 2011 2010 2009 2008 2011 2010 2009 2008 2011 2010 2009 2008 2011 2010 2009 2008
System Totals 46,578 9% 8% 7% 7% 13% 14% 14% 14% 19% 20% 20% 24% 2% 2% 2% 2% 20,453 43.9% 44% 43% 47%
Alamance CC 1080 5% 3% 4% 6% 13% 10% 11% 13% 25% 29% 24% 28% 2% 1% 2% 3% 476 44.1% 43% 40% 50%
Asheville-Buncombe TCC 1308 10% 9% 6% 7% 16% 11% 14% 10% 19% 23% 23% 28% 2% 2% 2% 2% 612 46.8% 45% 45% 47%
Beaufort County CC 386 4% 5% 4% 6% 10% 13% 13% 15% 19% 13% 17% 26% 4% 4% 4% 3% 140 36.3% 35% 39% 50%
Bladen CC 210 4% 2% 4% 6% 8% 8% 11% 13% 14% 11% 14% 19% 5% 3% 3% 2% 64 30.5% 24% 33% 40%
Blue Ridge CC 519 9% 7% 6% 7% 13% 16% 13% 15% 15% 14% 14% 19% 1% 1% 2% 2% 198 38.2% 39% 35% 44%
Brunswick CC 297 15% 14% 10% 9% 15% 15% 18% 12% 14% 11% 12% 17% 4% 2% 1% 1% 142 47.8% 41% 41% 39%
Caldwell CC & TI 926 12% 12% 8% 13% 9% 13% 14% 14% 14% 12% 18% 16% 3% 3% 2% 3% 358 38.7% 40% 42% 46%
Cape Fear CC 1785 10% 10% 9% 9% 14% 16% 18% 16% 19% 16% 17% 22% 2% 3% 2% 2% 817 45.8% 45% 46% 49%
Carteret CC 316 7% 6% 7% 6% 11% 18% 12% 15% 22% 17% 16% 18% 3% 1% 2% 1% 138 43.7% 42% 36% 41%
Catawba Valley CC 1107 13% 11% 11% 10% 12% 12% 15% 15% 15% 25% 18% 19% 2% 2% 2% 3% 465 42.0% 50% 46% 46%
Central Carolina CC 1115 5% 4% 5% 7% 13% 15% 19% 18% 21% 21% 19% 23% 2% 2% 2% 2% 462 41.4% 41% 45% 49%
Central Piedmont CC 3159 9% 9% 7% 7% 8% 9% 8% 7% 25% 24% 24% 30% 2% 2% 2% 2% 1405 44.5% 44% 40% 46%
Cleveland CC 694 8% 7% 6% 6% 12% 12% 14% 13% 23% 28% 30% 32% 2% 2% 2% 2% 306 44.1% 49% 52% 53%
Coastal Carolina CC 863 12% 7% 9% 9% 14% 15% 19% 15% 24% 23% 23% 27% 2% 2% 1% 1% 449 52.0% 48% 51% 53%
College of The Albemarle 684 6% 10% 7% 6% 14% 12% 12% 15% 27% 25% 23% 31% 2% 1% 1% 1% 331 48.4% 49% 44% 53%
Craven CC 604 12% 9% 8% 7% 11% 12% 13% 11% 18% 21% 23% 26% 2% 3% 2% 3% 258 42.7% 46% 45% 47%
Davidson County CC 853 14% 11% 12% 10% 20% 21% 23% 19% 15% 14% 13% 20% 3% 2% 1% 1% 433 50.8% 48% 48% 50%
Durham TCC 772 6% 4% 4% 4% 7% 6% 11% 9% 29% 18% 19% 28% 2% 2% 2% 2% 344 44.6% 31% 36% 42%
Edgecombe CC 401 4% 3% 3% 3% 9% 6% 15% 14% 15% 20% 17% 24% 2% 3% 2% 2% 123 30.7% 32% 37% 43%
Fayetteville TCC 1965 6% 7% 5% 5% 10% 9% 10% 8% 22% 25% 26% 33% 3% 2% 2% 2% 812 41.3% 42% 44% 49%
Forsyth TCC 1966 10% 8% 8% 9% 12% 13% 16% 16% 18% 20% 21% 22% 3% 2% 2% 2% 828 42.1% 43% 47% 49%
Gaston College 1366 7% 7% 6% 6% 15% 14% 15% 14% 18% 19% 17% 25% 2% 3% 2% 3% 586 42.9% 43% 40% 48%
Guilford TCC 2448 6% 6% 7% 7% 13% 12% 14% 15% 19% 18% 17% 21% 3% 2% 2% 2% 1008 41.2% 39% 40% 45%
Halifax CC 313 5% 5% 7% 5% 11% 14% 12% 17% 15% 18% 20% 30% 2% 2% 1% 2% 104 33.2% 39% 40% 54%
Haywood CC 479 9% 4% 5% 5% 24% 24% 17% 15% 11% 14% 14% 14% 3% 3% 1% 3% 223 46.6% 44% 37% 36%
Isothermal CC 552 9% 8% 8% 10% 12% 10% 16% 15% 21% 21% 16% 22% 1% 2% 1% 3% 241 43.7% 42% 41% 49%
James Sprunt CC 317 10% 9% 7% 5% 17% 17% 19% 22% 25% 26% 24% 26% 2% 4% 3% 1% 171 53.9% 56% 54% 54%
Johnston CC 754 13% 11% 6% 6% 19% 21% 13% 17% 14% 16% 19% 21% 3% 1% 2% 2% 370 49.1% 50% 41% 45%
Lenoir CC 812 9% 5% 8% 8% 10% 9% 13% 14% 21% 27% 18% 23% 2% 2% 3% 3% 340 41.9% 43% 42% 49%
Martin CC 207 7% 1% 3% 1% 12% 17% 12% 18% 14% 13% 26% 28% 2% 3% 2% 4% 74 35.7% 35% 43% 51%
Mayland CC 296 8% 5% 7% 6% 17% 25% 20% 19% 18% 17% 15% 18% 3% 3% 2% 1% 137 46.3% 50% 44% 43%
McDowell TCC 240 10% 12% 7% 8% 19% 19% 18% 25% 10% 8% 10% 10% 3% 2% 4% 3% 101 42.1% 41% 39% 46%
Mitchell CC 968 14% 12% 8% 11% 12% 13% 14% 15% 25% 26% 22% 27% 1% 2% 2% 3% 504 52.1% 53% 47% 56%
Montgomery CC 99 1% 5% 2% 6% 31% 22% 30% 24% 13% 15% 10% 17% 2% 3% 1% 0% 47 47.5% 45% 43% 48%
Nash CC 853 8% 7% 6% 6% 7% 11% 12% 9% 26% 25% 23% 29% 3% 3% 2% 4% 375 44.0% 46% 43% 47%
Pamlico CC 111 4% 3% 5% 6% 5% 27% 32% 32% 41% 20% 12% 12% 4% 1% 3% 2% 60 54.1% 52% 52% 52%
Piedmont CC 435 2% 6% 4% 5% 11% 18% 18% 23% 24% 20% 19% 17% 2% 3% 2% 2% 169 38.9% 48% 43% 46%
Pitt CC 1304 8% 5% 7% 8% 11% 9% 13% 13% 19% 22% 21% 21% 3% 3% 3% 3% 555 42.6% 39% 44% 45%
Randolph CC 655 11% 9% 8% 8% 18% 18% 19% 14% 12% 16% 16% 21% 4% 2% 2% 3% 290 44.3% 44% 46% 46%
Richmond CC 436 10% 10% 11% 9% 16% 16% 17% 13% 20% 15% 17% 20% 3% 3% 4% 3% 210 48.2% 44% 49% 46%
Roanoke-Chowan CC 149 9% 8% 8% 6% 13% 16% 20% 13% 19% 17% 25% 31% 0% 7% 3% 3% 61 40.9% 47% 55% 53%
Robeson CC 494 4% 3% 4% 4% 8% 14% 16% 19% 14% 10% 21% 11% 4% 3% 2% 3% 143 28.9% 31% 42% 38%
Rockingham CC 546 11% 8% 9% 7% 19% 17% 17% 14% 13% 13% 15% 21% 2% 2% 2% 2% 245 44.9% 41% 43% 45%
Rowan-Cabarrus CC 1357 12% 10% 8% 8% 13% 14% 14% 13% 14% 15% 15% 21% 2% 2% 1% 2% 565 41.6% 41% 38% 45%
Sampson CC 319 7% 10% 10% 8% 14% 14% 18% 15% 24% 30% 24% 28% 3% 4% 1% 3% 149 46.7% 59% 53% 54%
Sandhills CC 688 8% 10% 8% 8% 11% 12% 12% 11% 19% 25% 25% 27% 3% 3% 2% 1% 290 42.2% 50% 47% 48%
South Piedmont CC 574 10% 5% 5% 6% 10% 10% 18% 19% 16% 19% 19% 20% 3% 1% 1% 3% 226 39.4% 35% 43% 48%
Southeastern CC 308 6% 6% 7% 6% 12% 16% 11% 21% 15% 12% 16% 15% 2% 3% 3% 2% 109 35.4% 38% 37% 44%
Southwestern CC 499 12% 13% 12% 9% 19% 16% 15% 14% 12% 13% 16% 16% 2% 2% 1% 2% 227 45.5% 43% 44% 41%
Stanly CC 505 11% 8% 8% 10% 19% 19% 24% 24% 11% 21% 13% 20% 3% 2% 2% 2% 218 43.2% 50% 48% 56%
Surry CC 590 11% 10% 10% 9% 16% 19% 15% 19% 11% 11% 15% 16% 3% 2% 3% 3% 243 41.2% 41% 43% 48%
Tri-County CC 257 11% 12% 10% 7% 13% 8% 13% 12% 17% 26% 27% 29% 4% 3% 0% 2% 115 44.7% 51% 50% 50%
Vance-Granville CC 995 10% 8% 6% 5% 14% 15% 10% 13% 17% 20% 19% 21% 2% 3% 1% 2% 432 43.4% 45% 37% 41%
Wake TCC 3612 11% 9% 7% 7% 13% 13% 12% 10% 22% 22% 21% 23% 2% 2% 2% 3% 1742 48.2% 47% 43% 43%
Wayne CC 725 13% 12% 13% 15% 17% 18% 15% 16% 18% 21% 25% 29% 2% 2% 2% 2% 358 49.4% 53% 55% 62%
Western Piedmont CC 488 17% 15% 11% 13% 14% 15% 16% 23% 10% 12% 13% 17% 3% 3% 3% 2% 207 42.4% 45% 43% 54%
Wilkes CC 467 12% 10% 7% 8% 21% 18% 15% 14% 17% 17% 20% 25% 2% 2% 2% 2% 239 51.2% 47% 45% 49%
Wilson CC 350 10% 9% 7% 6% 13% 15% 14% 15% 20% 16% 27% 29% 3% 2% 2% 2% 158 45.1% 43% 50% 52%
% CC GRADUATE, NOT
UNIV TRANSFER
% GRADUATE, TRANSFER,
OR RETAINED (36 HRS)
CO
HO
RT
(De
no
min
ato
r)
% CC GRADUATE AND
UNIV TRANSFER
% UNIV TRANSFER,
NOT CC GRADUATE
GR
AD
/ TR
AN
/RET
(Nu
mer
ato
r)% RETAINED (36 HRS), DID
NOT CC GRADUATE OR
UNIV TRANSFER
13

6. Licensure and Certification Passing Rate Purpose
To ensure programmatic coursework prepares students to competently practice in their chosen profession.
Description
Aggregate institutional passing rate of first-time test-takers on licensure and certification exams. Exams included in this measure are state mandated exams which candidates must pass before becoming active practitioners.
Calculation
Denominator: All licensure and certification exams taken for the first-time during the licensure agency’s most recent reporting year. Only includes state mandated exams which candidates must pass before becoming active practitioners.
Numerator: Of those in the denominator, the number passing the exam on their first attempt during the licensure agency’s most recent reporting year.
Data Sources
JULY – JUNE RESULTS
American Registry of Radiologic Technologists Nuclear Medicine Technology Exam Radiation Therapy Exam Radiography Exam
Federal Aviation Administration Airframe Exam General Exam Power Plant Exam
NC Board of Massage & Bodywork Therapy Massage & Body Work Therapist
NC Real Estate Commission Provisional Real Estate Broker
JANUARY – DECEMBER RESULTS
Council of Interstate Testing Dental Hygiene Exam
NC Board of Cosmetic Art Examiners Apprentice Exam Cosmetology Exam Cosmetology Instructor Exam Esthetician Exam Manicurist Exam
NC Board of Nursing Practical Nursing Exam Registered Nursing Exam
NC Board of Physical Therapy Examiners Physical Therapist Assistant Exam
JANUARY – DECEMBER RESULTS
NC Department of Justice, Criminal Justice Standards Division Basic Law Enforcement Training (BLET) Exam
NC Department of Justice Sheriff’s Standards Division Detention Officer
NC Office of Emergency Medical Services EMT Exam EMTI-I Exam EMT-P Exam
NC Veterinary Medical Board Veterinary Medicine Technology Exam
Additional Details
The number of first-time test-takers and passers were provided to the System Office by agencies issuing the license or certification and were validated by the colleges. Depending on the exam, data may be provided on a fiscal or calendar year. Exams are listed above in italics.
Excellence level: 90.9%
Baseline level: 69.9%
14

TABLE 6. LICENSURE AND CERTIFICATION PASSING RATE, 2016-2017
Excellence: 90.9%
Baseline: 69.9%16-17 15-16 14-15 13-14 12-13
System Totals 11,427 9,322 81.6% 84% 84% 85% 85%
Alamance CC 206 158 76.7% 76% 83% 80% 82%
Asheville-Buncombe TCC 370 321 86.8% 94% 91% 86% 87%
Beaufort County CC 142 106 74.6% 79% 77% 89% 85%
Bladen CC 88 71 80.7% 85% 77% 78% 69%
Blue Ridge CC 170 128 75.3% 82% 81% 83% 87%
Brunswick CC 109 95 87.2% 83% 75% 82% 78%
Caldwell CC & TI 215 191 88.8% 77% 76% 79% 78%
Cape Fear CC 489 411 84.0% 91% 89% 93% 91%
Carteret CC 163 130 79.8% 87% 79% 80% 84%
Catawba Valley CC 168 145 86.3% 87% 84% 82% 80%
Central Carolina CC 275 221 80.4% 88% 86% 94% 86%
Central Piedmont CC 513 443 86.4% 83% 88% 87% 91%
Cleveland CC 201 160 79.6% 79% 85% 85% 87%
Coastal Carolina CC 240 229 95.4% 92% 95% 91% 91%
College of The Albemarle 173 131 75.7% 83% 84% 91% 89%
Craven CC 261 194 74.3% 80% 83% 75% 80%
Davidson County CC 214 164 76.6% 86% 87% 87% 89%
Durham TCC 199 177 88.9% 89% 88% 88% 87%
Edgecombe CC 110 89 80.9% 73% 70% 87% 78%
Fayetteville TCC 493 429 87.0% 88% 90% 87% 88%
Forsyth TCC 390 338 86.7% 89% 90% 89% 93%
Gaston College 303 275 90.8% 94% 91% 93% 91%
Guilford TCC 479 398 83.1% 87% 85% 86% 87%
Halifax CC 79 56 70.9% 75% 74% 80% 83%
Haywood CC 73 64 87.7% 85% 78% 69% 79%
Isothermal CC 147 112 76.2% 72% 86% 87% 81%
James Sprunt CC 63 41 65.1% 85% 80% 81% 84%
Johnston CC 209 177 84.7% 83% 84% 82% 82%
Lenoir CC 602 425 70.6% 80% 78% 78% 77%
Martin CC 60 37 61.7% 56% 67% 69% 64%
Mayland CC 50 41 82.0% 78% 89% 77% 77%
McDowell TCC 118 103 87.3% 92% 92% 89% 90%
Mitchell CC 192 145 75.5% 79% 83% 81% 87%
Montgomery CC 38 33 86.8% 76% 79% 100% 89%
Nash CC 184 136 73.9% 81% 73% 78% 73%
Pamlico CC 11 6 54.5% 80% 77% 92% 81%
Piedmont CC 52 36 69.2% 70% 60% 66% 73%
Pitt CC 302 236 78.1% 80% 84% 85% 87%
Randolph CC 146 126 86.3% 86% 84% 81% 82%
Richmond CC 80 70 87.5% 84% 74% 72% 67%
Roanoke-Chowan CC 44 33 75.0% 58% 67% 75% 74%
Robeson CC 170 127 74.7% 71% 75% 82% 90%
Rockingham CC 107 75 70.1% 79% 83% 74% 68%
Rowan-Cabarrus CC 458 335 73.1% 76% 79% 83% 84%
Sampson CC 63 45 71.4% 87% 84% 88% 85%
Sandhills CC 243 208 85.6% 88% 92% 88% 87%
South Piedmont CC 124 98 79.0% 77% 84% 78% 85%
Southeastern CC 81 64 79.0% 72% 77% 78% 75%
Southwestern CC 147 125 85.0% 89% 89% 89% 92%
Stanly CC 160 126 78.8% 82% 87% 80% 88%
Surry CC 197 185 93.9% 92% 93% 90% 92%
Tri-County CC 68 43 63.2% 81% 73% 68% 80%
Vance-Granville CC 172 145 84.3% 88% 80% 81% 88%
Wake TCC 448 414 92.4% 91% 94% 92% 91%
Wayne CC 202 179 88.6% 91% 87% 87% 83%
Western Piedmont CC 81 66 81.5% 86% 88% 86% 94%
Wilkes CC 175 116 66.3% 75% 86% 86% 86%
Wilson CC 110 90 81.8% 80% 78% 87% 72%
TEST TAKERS
(Denominator)
NUMBER PASSING
1st ATTEMPT
AGGREGATE INSTITUTIONAL PASSING RATE
15
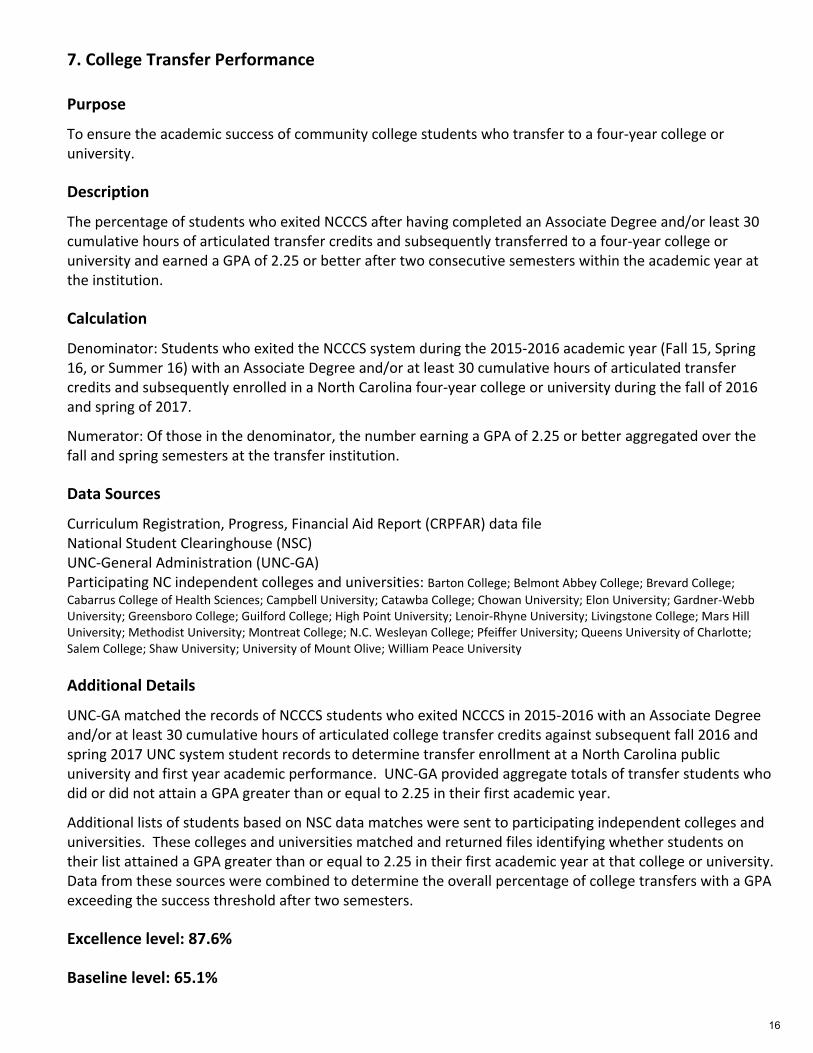
7. College Transfer Performance Purpose
To ensure the academic success of community college students who transfer to a four-year college or university.
Description
The percentage of students who exited NCCCS after having completed an Associate Degree and/or least 30 cumulative hours of articulated transfer credits and subsequently transferred to a four-year college or university and earned a GPA of 2.25 or better after two consecutive semesters within the academic year at the institution.
Calculation
Denominator: Students who exited the NCCCS system during the 2015-2016 academic year (Fall 15, Spring 16, or Summer 16) with an Associate Degree and/or at least 30 cumulative hours of articulated transfer credits and subsequently enrolled in a North Carolina four-year college or university during the fall of 2016 and spring of 2017.
Numerator: Of those in the denominator, the number earning a GPA of 2.25 or better aggregated over the fall and spring semesters at the transfer institution.
Data Sources
Curriculum Registration, Progress, Financial Aid Report (CRPFAR) data file National Student Clearinghouse (NSC) UNC-General Administration (UNC-GA) Participating NC independent colleges and universities: Barton College; Belmont Abbey College; Brevard College;
Cabarrus College of Health Sciences; Campbell University; Catawba College; Chowan University; Elon University; Gardner-Webb University; Greensboro College; Guilford College; High Point University; Lenoir-Rhyne University; Livingstone College; Mars Hill University; Methodist University; Montreat College; N.C. Wesleyan College; Pfeiffer University; Queens University of Charlotte; Salem College; Shaw University; University of Mount Olive; William Peace University
Additional Details
UNC-GA matched the records of NCCCS students who exited NCCCS in 2015-2016 with an Associate Degree and/or at least 30 cumulative hours of articulated college transfer credits against subsequent fall 2016 and spring 2017 UNC system student records to determine transfer enrollment at a North Carolina public university and first year academic performance. UNC-GA provided aggregate totals of transfer students who did or did not attain a GPA greater than or equal to 2.25 in their first academic year.
Additional lists of students based on NSC data matches were sent to participating independent colleges and universities. These colleges and universities matched and returned files identifying whether students on their list attained a GPA greater than or equal to 2.25 in their first academic year at that college or university. Data from these sources were combined to determine the overall percentage of college transfers with a GPA exceeding the success threshold after two semesters.
Excellence level: 87.6%
Baseline level: 65.1%
16

TABLE 7. COLLEGE TRANSFER PERFORMANCE, 2015-2016 COMMUNITY COLLEGE STUDENTS
Excellence: 87.6%
Baseline: 65.1%
Students % ≥ 2.25 Students % ≥ 2.25Students
(Denominator)# ≥ 2.25 % ≥ 2.25 14-15 13-14 12-13 11-12 10-11
System Totals 5,220 79% 6,397 87% 11,617 9,694 83.4% 83% 82% 82% 82% 81%
Alamance CC 87 80% 121 81% 208 168 80.8% 86% 83% 83% 80% 79%
Asheville-Buncombe TCC 141 88% 243 93% 384 349 90.9% 91% 89% 87% 90% 92%
Beaufort County CC 28 86% 59 92% 87 78 89.7% 81% 82% 78% 85% 89%
Bladen CC 35 86% 26 81% 61 51 83.6% 71% 66% 60% 70% 67%
Blue Ridge CC 47 94% 45 93% 92 86 93.5% 90% 91% 85% 84% 92%
Brunswick CC 47 83% 73 79% 120 97 80.8% 84% 73% 76% 85% 83%
Caldwell CC & TI 90 76% 163 81% 253 200 79.1% 79% 83% 80% 78% 80%
Cape Fear CC 243 74% 376 86% 619 503 81.3% 81% 81% 79% 84% 81%
Carteret CC 16 81% 43 84% 59 49 83.1% 95% 80% 83% 84% 81%
Catawba Valley CC 141 80% 181 85% 322 267 82.9% 83% 88% 87% 84% 85%
Central Carolina CC 49 65% 124 87% 173 140 80.9% 76% 84% 74% 84% 85%
Central Piedmont CC 745 76% 502 86% 1,247 1,000 80.2% 81% 78% 79% 78% 77%
Cleveland CC 64 89% 44 89% 108 96 88.9% 77% 83% 82% 84% 80%
Coastal Carolina CC 68 78% 176 90% 244 211 86.5% 86% 88% 88% 85% 83%
College of The Albemarle 54 81% 55 87% 109 92 84.4% 86% 90% 87% 81% 83%
Craven CC 60 75% 109 86% 169 139 82.2% 81% 86% 82% 84% 88%
Davidson County CC 89 79% 85 81% 174 139 79.9% 83% 82% 81% 80% 78%
Durham TCC 115 77% 130 91% 245 207 84.5% 86% 82% 87% 83% 84%
Edgecombe CC 36 78% 47 81% 83 66 79.5% 87% 91% 91% 73% 72%
Fayetteville TCC 169 80% 222 87% 391 328 83.9% 83% 89% 82% 85% 82%
Forsyth TCC 192 81% 268 90% 460 396 86.1% 86% 80% 83% 84% 76%
Gaston College 92 74% 180 83% 272 217 79.8% 79% 80% 78% 77% 79%
Guilford TCC 237 75% 264 85% 501 403 80.4% 77% 76% 80% 80% 78%
Halifax CC 18 67% 32 75% 50 36 72.0% 70% 69% 71% 84% 63%
Haywood CC 28 79% 32 100% 60 54 90.0% 86% 92% 78% 81% 88%
Isothermal CC 68 90% 32 91% 100 90 90.0% 89% 85% 87% 87% 79%
James Sprunt CC 17 88% 26 88% 43 38 88.4% 76% 80% 78% 76% 89%
Johnston CC 104 84% 114 91% 218 191 87.6% 77% 80% 75% 79% 75%
Lenoir CC 74 77% 65 88% 139 114 82.0% 84% 79% 79% 80% 73%
Martin CC 13 85% 8 75% 21 17 81.0% 78% 79% 75% * *
Mayland CC 10 60% 7 86% 17 12 70.6% 93% 86% 87% 95% 90%
McDowell TCC 14 86% 15 100% 29 27 93.1% 85% 86% 85% 73% 64%
Mitchell CC 81 78% 128 87% 209 174 83.3% 82% 81% 83% 79% 80%
Montgomery CC 6 50% 4 * 10 7 70.0% 83% 91% 63% 100% 86%
Nash CC 48 85% 93 95% 141 129 91.5% 84% 78% 81% 81% 85%
Pamlico CC 6 83% 3 * 9 8 88.9% 80% 100% 86% 70% 60%
Piedmont CC 12 67% 22 82% 34 26 76.5% 72% 76% 75% 65% 72%
Pitt CC 250 68% 213 83% 463 346 74.7% 81% 80% 78% 80% 81%
Randolph CC 64 73% 55 85% 119 94 79.0% 87% 84% 81% 91% 78%
Richmond CC 62 82% 61 80% 123 100 81.3% 73% 67% 78% 85% 80%
Roanoke-Chowan CC 11 64% 17 76% 28 20 71.4% 81% 59% 88% 69% *
Robeson CC 19 79% 48 90% 67 58 86.6% 72% 76% 84% 79% 66%
Rockingham CC 41 85% 46 87% 87 75 86.2% 85% 84% 82% 75% 86%
Rowan-Cabarrus CC 133 83% 171 88% 304 261 85.9% 81% 81% 82% 75% 75%
Sampson CC 14 79% 44 91% 58 51 87.9% 84% 81% 70% 67% 55%
Sandhills CC 63 79% 127 85% 190 158 83.2% 87% 79% 82% 77% 78%
South Piedmont CC 57 74% 23 100% 80 65 81.3% 89% 89% 81% 89% 81%
Southeastern CC 27 74% 45 87% 72 59 81.9% 83% 88% 74% 77% 82%
Southwestern CC 39 92% 119 94% 158 148 93.7% 89% 89% 94% 90% 88%
Stanly CC 39 90% 78 90% 117 105 89.7% 87% 90% 75% 77% 81%
Surry CC 67 79% 66 91% 133 113 85.0% 84% 85% 90% 85% 75%
Tri-County CC 32 97% 25 88% 57 53 93.0% 88% 89% 82% 85% 88%
Vance-Granville CC 101 83% 83 89% 184 158 85.9% 83% 83% 78% 73% 80%
Wake TCC 677 81% 703 90% 1,380 1,176 85.2% 85% 85% 86% 85% 88%
Wayne CC 49 71% 142 83% 191 153 80.1% 84% 80% 75% 87% 78%
Western Piedmont CC 59 80% 73 88% 132 111 84.1% 81% 83% 82% 83% 75%
Wilkes CC 54 87% 74 88% 128 112 87.5% 76% 85% 79% 81% 88%
Wilson CC 18 89% 67 85% 85 73 85.9% 75% 90% 79% 83% 86%*Less than 5Note: 10-11, 11-12, and 12-13 is UNC Only; 13-14 GPA ≥ 2.25 includes independent transfers with GPA ≥ 2.00
2015-2016 TOTALASSOC DEGREE RECIPENT30 OR MORE HOURS % ≥ 2.25
17

THIS PAGE INTENTIONALLY LEFT “BLANK”
18

Appendix
Additional Performance Measure Descriptions and Tables
19

THIS PAGE INTENTIONALLY LEFT “BLANK”
20

FIRST-TIME FALL COHORT DESCRIPTION First-time cohorts are fall credential seeking and dual enrollment (Career and College Promise) students enrolled in curriculum courses at a North Carolina Community College for the first-time.
Fall first-time students are identified based on the following criteria:
• Fall semester is first curriculum enrollment term (at any North Carolina Community College)
• First term curriculum code is not Basic Skills Plus (T90950) or Special Credit (T90990)
• No previous post‐secondary enrollment as verified from the National Student Clearinghouse before the start date of the fall semester (August 15)
The fall first-time cohorts are used in the following measures:
2. Student Success Rate in College-Level English Courses* 3. Student Success Rate in College-Level Math Courses* 4. First-Year Progression 5. Curriculum Completion
* Cohorts are further narrowed down for measures 2 and 3. For specifics, see measure details.
Data Sources
Curriculum Registration, Progress, Financial Aid Report (CRPFAR) data file
National Student Clearinghouse (NSC)
Additional Details
• Identify student’s first NCCCS registration term since fall 2001 (Note: Fall 2001 is the first semester student level data is accessible at the System Office)
• Students with a first registration term that is earlier than fall 2001 are excluded from the cohort because their registration records cannot be verified by the System Office.
• Students with a curriculum code of Basic Skills Plus (T90950) or Special Credit (T90990) in their first registration term are excluded from the cohort
• Remaining students are sent to the NSC to check for prior enrollment based upon the first semester the student is registered at NCCCS
• Students identified with post-secondary enrollment in the NSC prior to first NCCCS registration term are removed from the cohort
• Of those who remain, the first NCCCS registration term is assigned as the student’s first-time cohort
• Those assigned to a fall cohort are tracked to calculate various performance measure success rates
21

TABLE 1A. BASIC SKILLS STUDENT PROGRESS, 2016-2017 - BY PLACEMENT LEVEL
Students Progress Students Progress Students Progress Students Progress Students Progress
System Totals 2301 33% 3131 59% 6600 64% 7017 57% 3415 53%
Alamance CC 30 40% 79 41% 162 43% 205 49% 116 60%
Asheville-Buncombe TCC 118 8% 33 45% 108 69% 139 64% 77 66%
Beaufort County CC 5 20% 27 63% 78 74% 66 45% 22 36%
Bladen CC 26 46% 21 52% 21 76% 28 79% 47 64%
Blue Ridge CC 1 * 37 86% 126 74% 90 51% 18 39%
Brunswick CC 111 34% 18 100% 36 97% 48 88% 34 97%
Caldwell CC & TI 54 17% 42 48% 76 68% 96 61% 35 57%
Cape Fear CC 44 68% 138 49% 161 57% 186 48% 51 63%
Carteret CC 22 18% 14 50% 18 61% 35 66% 62 55%
Catawba Valley CC 21 14% 25 68% 76 75% 83 72% 48 58%
Central Carolina CC 50 68% 65 72% 166 79% 234 71% 179 49%
Central Piedmont CC 114 27% 196 62% 556 60% 395 46% 74 28%
Cleveland CC 2 * 30 77% 31 81% 28 82% 19 74%
Coastal Carolina CC 9 33% 29 59% 185 70% 219 59% 100 66%
College of The Albemarle 9 67% 29 55% 55 65% 64 61% 64 50%
Craven CC 11 91% 40 70% 81 60% 78 56% 10 30%
Davidson County CC 19 84% 102 69% 275 77% 280 64% 118 69%
Durham TCC 37 46% 154 49% 177 56% 120 39% 11 45%
Edgecombe CC 55 16% 28 54% 62 84% 102 90% 91 82%
Fayetteville TCC 50 26% 111 25% 243 49% 770 60% 685 51%
Forsyth TCC 169 17% 106 63% 136 65% 116 72% 50 50%
Gaston College 6 67% 37 65% 138 61% 178 59% 158 48%
Guilford TCC 166 19% 153 48% 229 49% 171 44% 51 22%
Halifax CC 15 27% 22 18% 39 72% 44 66% 41 59%
Haywood CC 0 * 7 86% 24 92% 31 97% 9 67%
Isothermal CC 2 * 7 43% 38 66% 44 52% 43 51%
James Sprunt CC 14 71% 17 53% 29 69% 36 50% 12 42%
Johnston CC 12 83% 54 81% 100 80% 74 64% 27 70%
Lenoir CC 55 45% 72 75% 184 73% 222 66% 103 47%
Martin CC 28 32% 28 50% 41 68% 56 55% 19 68%
Mayland CC 46 46% 52 69% 151 71% 103 59% 32 66%
McDowell TCC 32 31% 36 69% 30 90% 51 67% 19 74%
Mitchell CC 54 17% 36 58% 79 76% 58 57% 20 60%
Montgomery CC 19 11% 16 56% 24 71% 31 55% 16 50%
Nash CC 2 * 28 64% 99 64% 68 41% 22 41%
Pamlico CC 6 83% 8 63% 29 83% 15 87% 7 100%
Piedmont CC 8 75% 24 79% 49 73% 89 45% 25 32%
Pitt CC 28 61% 54 59% 161 68% 147 56% 24 63%
Randolph CC 48 52% 58 55% 130 57% 117 47% 46 63%
Richmond CC 45 13% 30 40% 117 62% 167 54% 129 33%
Roanoke-Chowan CC 3 * 19 47% 30 47% 27 30% 17 18%
Robeson CC 117 24% 72 53% 126 63% 104 58% 32 50%
Rockingham CC 3 * 23 61% 103 71% 91 68% 32 53%
Rowan-Cabarrus CC 35 23% 63 59% 177 46% 163 29% 60 20%
Sampson CC 33 73% 93 55% 115 68% 102 46% 22 55%
Sandhills CC 44 48% 30 70% 48 71% 83 31% 19 42%
South Piedmont CC 16 25% 44 64% 139 55% 110 46% 34 41%
Southeastern CC 55 56% 68 49% 106 78% 135 68% 116 69%
Southwestern CC 31 45% 43 58% 94 56% 106 45% 16 44%
Stanly CC 9 78% 38 50% 74 47% 54 39% 12 25%
Surry CC 64 14% 33 55% 69 59% 63 49% 21 57%
Tri-County CC 29 52% 15 47% 23 87% 20 75% 9 78%
Vance-Granville CC 71 18% 63 70% 125 74% 145 57% 41 41%
Wake TCC 73 49% 221 56% 477 49% 397 43% 130 48%
Wayne CC 24 96% 138 83% 219 76% 156 74% 64 64%
Western Piedmont CC 19 63% 16 81% 42 93% 50 80% 22 68%
Wilkes CC 58 26% 68 69% 60 67% 73 62% 23 74%
Wilson CC 74 14% 21 38% 53 77% 54 72% 31 48%
Color shading is to assist
college efforts to identify
subgroup strengths and
weaknesses
ADULT BASIC AND SECONDARY EDUCATION
BEGINNING ABE LITERACYBEGINNING BASIC
EDUCATION
LOW INTERMEDIATE BASIC
EDUCATION
HIGH INTERMEDIATE
BASIC EDUCATION
LOW ADULT SECONDARY
EDUCATION
22

TABLE 1B. BASIC SKILLS STUDENT PROGRESS, 2016-2017 - BY PLACEMENT LEVEL
Students Progress Students Progress Students Progress Students Progress Students Progress Students Progress
System Totals 1145 71% 1403 77% 2001 75% 2696 63% 2457 60% 2060 39%
Alamance CC 16 56% 178 46% 74 76% 36 69% 68 37% 5 40%
Asheville-Buncombe TCC 13 85% 42 93% 65 80% 85 62% 53 55% 66 35%
Beaufort County CC * 0 * 4 * 4 * 4 * 5 40%
Bladen CC 0 * 3 * 1 * 0 * 3 * 0 *
Blue Ridge CC 4 * 6 100% 31 81% 34 50% 26 62% 25 8%
Brunswick CC * * 1 * 3 * 7 100% 3 *
Caldwell CC & TI 1 * 6 83% 11 73% 25 48% 18 44% 10 10%
Cape Fear CC 11 73% 17 71% 55 58% 63 46% 63 56% 46 17%
Carteret CC 1 * 6 67% 6 83% 2 * 1 * *
Catawba Valley CC 2 * 6 100% 12 92% 53 74% 42 81% 33 21%
Central Carolina CC 117 86% 74 81% 31 87% 46 78% 58 88% 36 83%
Central Piedmont CC 154 43% 135 77% 367 69% 476 60% 433 56% 403 38%
Cleveland CC * 1 * 3 * 5 80% 4 * 2 *
Coastal Carolina CC 0 * 1 * 13 62% 18 44% 25 64% 17 18%
College of The Albemarle 0 * 1 * 7 86% 10 80% 9 89% 4 *
Craven CC 3 * 3 * 12 92% 19 47% 12 67% 17 12%
Davidson County CC 2 * 9 78% 16 81% 18 56% 31 71% 22 27%
Durham TCC 51 84% 75 80% 145 72% 264 53% 208 48% 209 25%
Edgecombe CC * * 5 100% 6 100% 9 78% 4 *
Fayetteville TCC 21 86% 33 79% 62 85% 51 59% 88 65% 98 56%
Forsyth TCC 10 80% 16 75% 60 70% 89 60% 56 61% 88 27%
Gaston College 3 * 10 90% 27 81% 47 53% 38 68% 47 40%
Guilford TCC 162 37% 94 61% 212 60% 225 46% 175 38% 158 18%
Halifax CC 2 * 4 * 4 * 1 * 3 * *
Haywood CC 1 * 1 * * 4 * 4 * 2 *
Isothermal CC 1 * 0 * 4 * 5 60% 14 71% 12 17%
James Sprunt CC 3 * 2 * 4 * 6 67% 4 * 5 60%
Johnston CC 5 100% 24 92% 47 83% 38 84% 51 80% 37 76%
Lenoir CC 5 100% 4 * 19 74% 24 58% 16 63% 24 29%
Martin CC * * * * * *
Mayland CC * 2 * 5 100% 12 75% 15 87% 13 54%
McDowell TCC 1 * 5 100% 10 60% 20 60% 13 46% 7 43%
Mitchell CC 3 * 4 * 21 57% 30 50% 27 63% 19 32%
Montgomery CC 1 * 1 * 6 83% 13 62% 6 33% 5 20%
Nash CC 0 * * 16 69% 17 53% 18 56% 12 42%
Pamlico CC * * * * * *
Piedmont CC * * 2 * 0 * 0 * 1 *
Pitt CC 6 100% 5 100% 27 78% 49 61% 38 58% 48 33%
Randolph CC 73 78% 26 88% 36 67% 29 66% 23 52% 6 67%
Richmond CC 25 68% 22 73% 23 74% 40 60% 18 44% 16 0%
Roanoke-Chowan CC 0 * 0 * 1 * 3 * * 0 *
Robeson CC 3 * 15 93% 27 78% 69 68% 27 41% 20 25%
Rockingham CC 0 * 3 * 6 83% 8 38% 9 89% 6 33%
Rowan-Cabarrus CC 22 95% 44 95% 59 86% 109 83% 94 66% 58 43%
Sampson CC 1 * 7 100% 40 63% 52 42% 34 68% 17 12%
Sandhills CC 1 * 5 80% 14 79% 24 58% 34 82% 32 47%
South Piedmont CC 36 92% 41 76% 76 68% 95 65% 99 57% 72 36%
Southeastern CC 2 * 0 * 0 * 3 * 4 * *
Southwestern CC 2 * 2 * 10 90% 20 90% 26 73% 20 40%
Stanly CC * 1 * 9 78% 17 71% 6 83% 3 *
Surry CC * 1 * 15 93% 17 71% 20 65% 15 47%
Tri-County CC * * 1 * 0 * 2 * 0 *
Vance-Granville CC 16 100% 16 81% 6 100% 6 67% 1 * 1 *
Wake TCC 348 81% 401 86% 185 88% 281 80% 323 73% 233 72%
Wayne CC 13 92% 32 88% 62 94% 71 72% 55 53% 41 32%
Western Piedmont CC 2 * 10 80% 13 92% 17 94% 23 87% 14 86%
Wilkes CC 2 * 8 100% 25 96% 28 82% 7 86% 8 88%
Wilson CC * 1 * 8 63% 9 67% 12 83% 15 60%
* Less than 5 students
Color shading is to assist
college efforts to identify
subgroup strengths and
weaknesses
ENGLISH AS A SECOND LANGUAGE
LOW INTERMEDIATE
ESLADVANCED ESL
BEGINNING ESL
LITERACYHIGH BEGINNING ESL
HIGH INTERMEDIATE
ESLLOW BEGINNING ESL
23

TABLE 2A. STUDENT SUCCESS RATE IN COLLEGE-LEVEL ENGLISH COURSES, FALL 2015 COHORT - BY AGE
Students Success Students Success Students Success Students Success Students Success Students Success
System Totals 3,648 41% 9,528 55% 13,596 64% 7,610 49% 2,140 52% 1,113 44%
Alamance CC 9 89% 201 64% 312 69% 164 53% 37 41% 15 47%
Asheville-Buncombe TCC 187 6% 209 33% 262 60% 175 46% 66 61% 30 33%
Beaufort County CC 48 46% 85 49% 46 61% 28 36% 7 43% 4 *
Bladen CC 7 100% 39 69% 64 52% 39 33% 14 64% 12 58%
Blue Ridge CC 4 * 68 29% 111 63% 69 43% 24 50% 13 46%
Brunswick CC 81 4% 59 66% 128 73% 49 65% 11 55% 9 56%
Caldwell CC & TI 176 9% 261 34% 187 70% 96 56% 23 61% 13 38%
Cape Fear CC 86 51% 333 56% 742 70% 300 57% 62 55% 35 40%
Carteret CC 2 * 112 36% 74 70% 56 70% 9 56% 6 50%
Catawba Valley CC 132 86% 259 66% 379 69% 121 51% 29 72% 10 40%
Central Carolina CC 22 45% 290 41% 259 49% 161 30% 33 45% 21 48%
Central Piedmont CC 76 72% 986 67% 1,672 70% 889 60% 215 56% 80 46%
Cleveland CC 61 7% 176 32% 78 55% 49 61% 18 28% 15 27%
Coastal Carolina CC 2 * 133 61% 245 75% 265 65% 105 82% 28 79%
College of The Albemarle 24 71% 283 56% 127 55% 64 42% 13 69% 11 55%
Craven CC 90 60% 141 70% 144 67% 141 57% 48 69% 19 53%
Davidson County CC 67 91% 206 51% 249 71% 115 56% 33 67% 21 71%
Durham TCC 22 73% 174 65% 210 59% 164 46% 55 49% 35 43%
Edgecombe CC 14 86% 51 69% 65 69% 43 47% 16 31% 18 61%
Fayetteville TCC 26 42% 445 40% 463 48% 466 41% 213 48% 101 47%
Forsyth TCC 115 28% 161 74% 598 69% 304 54% 90 56% 38 58%
Gaston College 72 25% 258 54% 437 64% 205 41% 62 37% 41 32%
Guilford TCC 21 48% 321 54% 837 56% 458 44% 138 45% 71 42%
Halifax CC 29 86% 46 85% 69 58% 40 60% 15 47% 3 *
Haywood CC 43 51% 45 47% 70 63% 24 33% 19 58% 7 29%
Isothermal CC 54 80% 51 67% 66 73% 45 42% 16 44% 11 36%
James Sprunt CC 55 22% 74 66% 26 42% 25 60% 6 17% 5 20%
Johnston CC 85 18% 406 66% 217 68% 152 43% 21 71% 13 31%
Lenoir CC 85 26% 151 62% 104 59% 56 39% 16 56% 13 62%
Martin CC 71 18% 50 44% 13 54% 13 38% 3 * * *
Mayland CC 43 19% 67 33% 17 35% 18 33% 7 14% 8 38%
McDowell TCC 67 88% 57 63% 25 60% 25 40% 6 17% 6 50%
Mitchell CC 100 20% 190 45% 247 66% 114 57% 22 50% 12 25%
Montgomery CC 4 * 32 69% 23 30% 11 45% 5 60% 5 40%
Nash CC 67 13% 134 25% 174 52% 97 34% 30 43% 16 31%
Pamlico CC 1 * 32 47% 7 29% 2 * 5 40% 5 0%
Piedmont CC 3 * 63 79% 39 62% 23 26% 7 43% 3 *
Pitt CC 78 5% 146 56% 513 60% 275 43% 87 43% 43 28%
Randolph CC 97 73% 113 51% 202 72% 117 50% 21 38% 15 67%
Richmond CC 73 33% 153 50% 110 67% 77 52% 30 60% 14 50%
Roanoke-Chowan CC 32 41% 13 54% 26 46% 19 37% 4 * 7 14%
Robeson CC 43 79% 134 49% 155 45% 90 34% 27 37% 10 50%
Rockingham CC 82 65% 66 39% 152 58% 69 48% 16 69% 3 *
Rowan-Cabarrus CC 153 80% 289 48% 417 70% 221 51% 51 39% 43 42%
Sampson CC 43 5% 64 52% 90 64% 57 54% 12 42% 1 *
Sandhills CC 76 51% 85 54% 215 59% 106 57% 25 60% 17 59%
South Piedmont CC 70 29% 233 45% 132 53% 68 40% 13 38% 15 47%
Southeastern CC 37 8% 55 67% 116 59% 57 37% 9 33% 3 *
Southwestern CC 85 48% 145 69% 70 70% 53 47% 19 42% 6 83%
Stanly CC 48 25% 90 42% 81 62% 53 47% 26 50% 14 7%
Surry CC 134 40% 50 54% 94 60% 30 40% 7 14% 6 33%
Tri-County CC 51 61% 112 81% 23 74% 13 62% 5 40% 6 50%
Vance-Granville CC 200 25% 121 59% 151 71% 88 41% 17 65% 19 63%
Wake TCC 16 63% 509 56% 1,651 63% 832 45% 193 49% 105 29%
Wayne CC 130 74% 179 65% 193 67% 134 49% 33 45% 15 60%
Western Piedmont CC 13 92% 135 70% 189 68% 59 41% 12 50% 9 67%
Wilkes CC 64 11% 139 51% 168 73% 71 45% 13 69% 5 40%
Wilson CC 72 13% 48 35% 62 71% 55 44% 21 19% 4 *
* Less than 5 students
25-39 40+
Color shading is to assist
college efforts to identify
subgroup strengths and
weaknesses
-15 16-17 18 19-24
24

TABLE 3A. STUDENT SUCCESS RATE IN COLLEGE-LEVEL MATH COURSES, FALL 2015 COHORT - BY AGE
Students Success Students Success Students Success Students Success Students Success Students Success
System Totals 3,648 23% 9,528 44% 13,596 39% 7,610 24% 2,140 21% 1,113 18%
Alamance CC 9 89% 201 49% 312 46% 164 23% 37 30% 15 20%
Asheville-Buncombe TCC 187 12% 209 30% 262 38% 175 30% 66 26% 30 23%
Beaufort County CC 48 46% 85 53% 46 52% 28 14% 7 43% 4 *
Bladen CC 7 57% 39 49% 64 34% 39 13% 14 14% 12 17%
Blue Ridge CC 4 * 68 26% 111 40% 69 12% 24 21% 13 46%
Brunswick CC 81 37% 59 34% 128 57% 49 45% 11 27% 9 22%
Caldwell CC & TI 176 12% 261 48% 187 43% 96 42% 23 39% 13 15%
Cape Fear CC 86 56% 333 51% 742 41% 300 28% 62 34% 35 20%
Carteret CC 2 * 112 29% 74 45% 56 21% 9 11% 6 17%
Catawba Valley CC 132 7% 259 44% 379 38% 121 19% 29 21% 10 10%
Central Carolina CC 22 50% 290 32% 259 40% 161 30% 33 24% 21 43%
Central Piedmont CC 76 71% 986 47% 1672 44% 889 31% 215 28% 80 20%
Cleveland CC 61 31% 176 60% 78 38% 49 27% 18 11% 15 13%
Coastal Carolina CC 2 * 133 44% 245 48% 265 23% 105 31% 28 32%
College of The Albemarle 24 33% 283 34% 127 34% 64 11% 13 23% 11 18%
Craven CC 90 17% 141 40% 144 41% 141 23% 48 33% 19 26%
Davidson County CC 67 10% 206 62% 249 47% 115 28% 33 15% 21 24%
Durham TCC 22 73% 174 56% 210 33% 164 24% 55 13% 35 20%
Edgecombe CC 14 29% 51 27% 65 28% 43 19% 16 0% 18 28%
Fayetteville TCC 26 31% 445 24% 463 25% 466 17% 213 19% 101 18%
Forsyth TCC 115 51% 161 40% 598 35% 304 21% 90 20% 38 18%
Gaston College 72 4% 258 26% 437 39% 205 21% 62 10% 41 2%
Guilford TCC 21 19% 321 38% 837 29% 458 23% 138 17% 71 17%
Halifax CC 29 34% 46 46% 69 22% 40 10% 15 0% 3 *
Haywood CC 43 2% 45 38% 70 39% 24 17% 19 11% 7 14%
Isothermal CC 54 7% 51 31% 66 27% 45 7% 16 13% 11 0%
James Sprunt CC 55 36% 74 39% 26 23% 25 20% 6 0% 5 0%
Johnston CC 85 25% 406 54% 217 47% 152 29% 21 33% 13 23%
Lenoir CC 85 31% 151 47% 104 25% 56 13% 16 13% 13 23%
Martin CC 71 14% 50 56% 13 46% 13 31% 3 * *
Mayland CC 43 21% 67 27% 17 29% 18 17% 7 0% 8 13%
McDowell TCC 67 18% 57 72% 25 40% 25 24% 6 17% 6 0%
Mitchell CC 100 10% 190 38% 247 36% 114 24% 22 14% 12 8%
Montgomery CC 4 * 32 28% 23 9% 11 9% 5 20% 5 0%
Nash CC 67 16% 134 51% 174 48% 97 23% 30 27% 16 13%
Pamlico CC 1 * 32 69% 7 29% 2 * 5 0% 5 0%
Piedmont CC 3 * 63 48% 39 31% 23 17% 7 14% 3 *
Pitt CC 78 63% 146 45% 513 29% 275 15% 87 18% 43 2%
Randolph CC 97 8% 113 37% 202 49% 117 27% 21 19% 15 40%
Richmond CC 73 18% 153 75% 110 45% 77 29% 30 30% 14 29%
Roanoke-Chowan CC 32 0% 13 8% 26 23% 19 5% 4 * 7 0%
Robeson CC 43 79% 134 68% 155 23% 90 19% 27 11% 10 30%
Rockingham CC 82 2% 66 58% 152 33% 69 29% 16 31% 3 *
Rowan-Cabarrus CC 153 19% 289 28% 417 32% 221 16% 51 10% 43 14%
Sampson CC 43 35% 64 20% 90 29% 57 23% 12 8% 1 *
Sandhills CC 76 36% 85 42% 215 28% 106 19% 25 24% 17 35%
South Piedmont CC 70 36% 233 38% 132 27% 68 13% 13 15% 15 13%
Southeastern CC 37 8% 55 51% 116 33% 57 16% 9 22% 3 *
Southwestern CC 85 8% 145 61% 70 54% 53 23% 19 37% 6 17%
Stanly CC 48 2% 90 34% 81 51% 53 32% 26 15% 14 14%
Surry CC 134 0% 50 50% 94 37% 30 20% 7 0% 6 17%
Tri-County CC 51 10% 112 29% 23 39% 13 31% 5 20% 6 17%
Vance-Granville CC 200 13% 121 39% 151 34% 88 14% 17 12% 19 11%
Wake TCC 16 63% 509 39% 1651 43% 832 30% 193 24% 105 12%
Wayne CC 130 8% 179 43% 193 43% 134 22% 33 21% 15 7%
Western Piedmont CC 13 100% 135 70% 189 41% 59 8% 12 0% 9 22%
Wilkes CC 64 50% 139 66% 168 48% 71 28% 13 0% 5 20%
Wilson CC 72 3% 48 50% 62 47% 55 35% 21 14% 4 *
* Less than 5 students
40+
Color shading is to assist
college efforts to identify
subgroup strengths and
weaknesses
-15 16-17 18 19-24 25-39
25

TABLE 4A. FIRST YEAR PROGRESSION, FALL 2016 COHORT - BY RACE/ETHNICITY AND GENDER
Students Success Students Success Students Success Students Success Students Success Students Success Students Success Students Success
System Totals 3,415 58% 2,665 49% 8,947 76% 8,341 72% 2,144 74% 1,756 67% 1,900 73% 1,598 68%
Alamance CC 45 73% 49 65% 250 84% 206 76% 85 79% 55 73% 34 79% 24 63%
Asheville-Buncombe TCC 19 42% 20 65% 253 76% 243 72% 32 78% 31 58% 22 68% 29 66%
Beaufort County CC 14 64% 8 88% 45 78% 34 88% 8 75% 4 * 9 78% 4 *
Bladen CC 16 50% 12 17% 34 71% 23 48% 6 50% 2 * 29 66% 7 71%
Blue Ridge CC 11 55% 4 * 115 76% 153 67% 12 50% 31 55% 9 56% 10 50%
Brunswick CC 21 76% 15 87% 61 69% 59 80% 8 100% 10 50% 9 44% 8 63%
Caldwell CC & TI 14 50% 14 57% 197 76% 141 76% 18 67% 6 67% 11 64% 7 86%
Cape Fear CC 82 44% 64 41% 553 75% 449 65% 59 78% 74 65% 51 65% 46 67%
Carteret CC 11 64% 3 * 110 68% 53 66% 13 77% 4 * 11 82% 4 *
Catawba Valley CC 30 83% 30 57% 329 83% 312 78% 49 80% 38 68% 53 81% 48 67%
Central Carolina CC 88 66% 71 68% 260 81% 251 76% 105 74% 66 70% 23 91% 23 78%
Central Piedmont CC 502 59% 382 53% 597 80% 721 73% 282 77% 280 65% 213 75% 232 70%
Cleveland CC 61 70% 33 70% 183 89% 183 80% 11 82% 14 71% 16 81% 11 73%
Coastal Carolina CC 50 64% 36 53% 192 72% 166 75% 55 73% 34 74% 23 65% 12 83%
College of The Albemarle 33 61% 31 74% 151 85% 115 71% 16 69% 12 83% 24 75% 13 85%
Craven CC 29 69% 19 68% 114 73% 87 76% 17 71% 14 79% 31 81% 14 79%
Davidson County CC 18 50% 28 57% 248 81% 204 74% 27 81% 20 65% 21 71% 25 80%
Durham TCC 103 51% 87 37% 93 77% 111 77% 82 79% 69 55% 53 77% 36 75%
Edgecombe CC 50 68% 21 52% 32 72% 32 88% 10 90% 4 * 6 67% *
Fayetteville TCC 288 58% 222 52% 280 70% 247 72% 122 75% 104 67% 130 69% 100 61%
Forsyth TCC 98 56% 107 54% 303 79% 357 79% 104 71% 84 71% 44 64% 49 78%
Gaston College 57 37% 33 42% 292 76% 231 66% 48 69% 24 67% 71 72% 50 66%
Guilford TCC 301 51% 247 37% 282 63% 348 65% 91 58% 92 52% 84 75% 93 61%
Halifax CC 35 54% 31 48% 41 90% 22 68% 2 * 1 * 6 67% 3 *
Haywood CC 1 * * 92 75% 93 77% 6 83% 0 * 5 100% 7 57%
Isothermal CC 9 56% 7 43% 82 83% 63 84% 5 80% 7 71% 22 82% 22 86%
James Sprunt CC 29 76% 14 64% 30 90% 33 79% 24 88% 12 67% 4 * 2 *
Johnston CC 42 55% 48 50% 246 79% 181 75% 61 75% 31 77% 62 66% 35 69%
Lenoir CC 39 62% 58 50% 95 73% 85 68% 10 50% 16 69% 4 * 6 67%
Martin CC 9 67% 4 * 19 79% 11 64% * * 17 53% 4 *
Mayland CC 1 * 1 * 32 69% 32 81% 5 60% 1 * 6 83% 9 67%
McDowell TCC 3 * * 64 80% 46 76% 4 * 1 * 0 * 1 *
Mitchell CC 31 55% 20 45% 185 77% 148 72% 35 80% 19 68% 24 63% 24 63%
Montgomery CC 11 73% 5 0% 34 82% 39 64% 10 80% 6 67% 1 * 1 *
Nash CC 64 63% 43 49% 96 82% 60 62% 16 81% 10 50% 16 75% 13 46%
Pamlico CC 4 * 12 92% 24 71% 24 67% 3 * 4 * 3 * 7 86%
Piedmont CC 25 80% 26 69% 54 72% 42 86% 3 * 4 * 3 * 5 80%
Pitt CC 247 53% 198 46% 179 75% 176 72% 58 74% 32 78% 29 72% 17 59%
Randolph CC 13 62% 3 * 130 77% 84 73% 45 84% 29 76% 60 87% 43 65%
Richmond CC 27 48% 18 39% 31 77% 35 69% 4 * 5 80% 60 63% 45 71%
Roanoke-Chowan CC 26 65% 14 50% 15 73% 14 79% 1 * 3 * 6 83% 2 *
Robeson CC 45 49% 19 37% 39 59% 24 75% 16 88% 16 69% 122 53% 70 53%
Rockingham CC 19 74% 17 47% 88 75% 89 67% 12 42% 15 87% 9 67% 18 61%
Rowan-Cabarrus CC 77 61% 50 36% 325 70% 232 62% 69 71% 41 63% 31 84% 26 69%
Sampson CC 31 71% 7 57% 49 71% 37 81% 30 70% 17 76% 9 78% 10 70%
Sandhills CC 66 68% 43 47% 137 66% 133 70% 34 74% 28 75% 50 72% 26 54%
South Piedmont CC 30 70% 17 59% 117 75% 91 66% 27 70% 19 58% 25 76% 11 73%
Southeastern CC 29 52% 7 43% 68 78% 64 75% 5 60% 5 40% 13 85% 9 56%
Southwestern CC 1 * 2 * 108 70% 83 80% 8 50% 14 64% 19 53% 15 53%
Stanly CC 10 70% 18 56% 113 76% 91 69% 8 88% 8 88% 17 88% 36 86%
Surry CC 1 * 2 * 53 81% 55 75% 20 85% 18 89% 0 * 5 60%
Tri-County CC 2 * 1 * 91 88% 73 86% 1 * 4 * 1 * 5 60%
Vance-Granville CC 77 57% 47 51% 144 69% 108 73% 16 63% 23 78% 12 75% 16 75%
Wake TCC 356 54% 316 44% 715 76% 914 69% 272 69% 215 66% 231 84% 225 72%
Wayne CC 58 50% 39 41% 129 77% 119 74% 30 80% 43 77% 18 83% 9 78%
Western Piedmont CC 11 82% 8 63% 139 81% 105 77% 21 76% 11 73% 19 79% 8 100%
Wilkes CC 3 * 2 * 171 81% 168 82% 13 92% 15 67% 10 80% 10 80%
Wilson CC 42 48% 32 47% 38 58% 41 68% 10 30% 11 73% 9 33% 8 50%
* Less than 5 students
Color shading is to assist
college efforts to identify
subgroup strengths and
weaknesses
OTHER MALEOTHER FEMALEAFRICAN-AMER
FEMALE
AFRICAN-
AMERIC MALE
HISPANIC
FEMALEHISPANIC MALE
CAUCASIAN
FEMALE
CAUCASIAN
MALE
26

TABLE 4B. FIRST YEAR PROGRESSION, FALL 2016 COHORT - BY AGE
Students Success Students Success Students Success Students Success Students Success Students Success
System Totals 1,098 85% 8,022 76% 12,623 67% 6,239 62% 1,946 73% 838 76%
Alamance CC 55 91% 207 84% 318 75% 124 65% 33 85% 11 82%
Asheville-Buncombe TCC 16 100% 151 75% 256 69% 136 66% 58 79% 32 75%
Beaufort County CC 10 100% 55 76% 37 84% 15 80% 6 50% 3 *
Bladen CC 5 100% 28 68% 41 61% 40 38% 12 67% 3 *
Blue Ridge CC 6 67% 94 71% 146 61% 69 70% 17 76% 13 62%
Brunswick CC 3 * 44 77% 96 74% 37 62% 7 71% 4 *
Caldwell CC & TI 15 80% 92 82% 194 71% 82 66% 16 81% 9 89%
Cape Fear CC 24 83% 275 75% 719 66% 262 61% 68 59% 30 70%
Carteret CC 1 * 68 66% 81 67% 38 66% 18 78% 3 *
Catawba Valley CC 30 90% 302 88% 401 75% 119 67% 28 64% 9 78%
Central Carolina CC 24 96% 381 80% 242 66% 141 72% 57 89% 42 79%
Central Piedmont CC 51 80% 795 76% 1,520 67% 651 64% 145 73% 47 81%
Cleveland CC 63 81% 259 84% 96 79% 55 64% 25 84% 14 100%
Coastal Carolina CC 1 * 75 72% 231 72% 179 65% 71 80% 11 82%
College of The Albemarle 9 100% 140 80% 139 73% 71 70% 30 90% 6 67%
Craven CC 7 86% 108 68% 104 79% 74 77% 21 67% 11 82%
Davidson County CC 22 91% 171 82% 228 72% 117 61% 31 94% 22 95%
Durham TCC 15 93% 155 77% 236 55% 144 63% 61 75% 23 57%
Edgecombe CC 1 * 49 92% 41 76% 45 56% 12 42% 7 71%
Fayetteville TCC 35 86% 412 77% 453 59% 352 56% 172 67% 69 64%
Forsyth TCC 57 89% 206 77% 539 71% 252 68% 57 77% 35 74%
Gaston College 5 100% 178 74% 359 70% 177 56% 55 53% 32 81%
Guilford TCC 10 100% 241 64% 737 54% 390 54% 113 59% 47 70%
Halifax CC 18 89% 34 76% 48 56% 31 52% 7 86% 3 *
Haywood CC 40 83% 30 87% 68 68% 38 74% 17 71% 11 100%
Isothermal CC 69 90% 57 86% 42 67% 34 65% 13 92% 2 *
James Sprunt CC 2 * 55 84% 42 88% 41 63% 4 * 4 *
Johnston CC 24 96% 255 79% 234 68% 132 62% 39 82% 22 59%
Lenoir CC 5 60% 123 73% 108 59% 56 61% 13 38% 8 75%
Martin CC 5 80% 26 85% 8 38% 19 42% 2 * 4 *
Mayland CC 0 * 49 73% 15 73% 12 75% 9 67% 2 *
McDowell TCC 5 80% 53 87% 27 56% 20 75% 12 75% 2 *
Mitchell CC 56 88% 121 76% 199 65% 68 68% 25 76% 17 59%
Montgomery CC 5 60% 36 69% 25 68% 20 55% 15 87% 6 67%
Nash CC 6 100% 80 75% 147 71% 70 43% 11 82% 4 *
Pamlico CC 2 * 43 67% 2 * 7 57% 21 95% 6 83%
Piedmont CC 7 86% 57 75% 41 68% 30 70% 14 86% 13 92%
Pitt CC 5 60% 155 66% 481 62% 198 59% 70 60% 27 74%
Randolph CC 47 74% 81 73% 161 78% 82 76% 24 75% 12 83%
Richmond CC 14 79% 79 62% 69 70% 44 57% 15 73% 4 *
Roanoke-Chowan CC 7 86% 20 65% 21 67% 18 61% 11 64% 4 *
Robeson CC 9 78% 81 60% 129 56% 99 52% 28 57% 5 40%
Rockingham CC 3 * 67 75% 134 65% 46 67% 11 73% 6 83%
Rowan-Cabarrus CC 11 91% 200 73% 390 61% 171 60% 42 74% 37 78%
Sampson CC 11 73% 58 81% 64 78% 44 61% 9 67% 4 *
Sandhills CC 69 77% 166 61% 168 68% 79 63% 24 79% 11 55%
South Piedmont CC 20 85% 151 77% 95 61% 52 54% 14 86% 5 100%
Southeastern CC 10 70% 67 79% 82 70% 32 47% 8 88% 1 *
Southwestern CC 10 40% 100 78% 82 63% 46 65% 9 78% 3 *
Stanly CC 38 97% 60 80% 96 66% 62 63% 31 94% 14 71%
Surry CC 5 80% 67 79% 50 76% 25 72% 6 100% 1 *
Tri-County CC 20 90% 99 93% 30 63% 19 74% 6 83% 4 *
Vance-Granville CC 18 89% 138 69% 161 69% 92 57% 29 66% 5 40%
Wake TCC 15 73% 490 72% 1,683 66% 752 64% 222 75% 82 83%
Wayne CC 27 70% 124 66% 172 75% 86 62% 24 75% 12 83%
Western Piedmont CC 14 100% 113 91% 140 73% 36 53% 17 88% 2 *
Wilkes CC 14 100% 165 88% 138 72% 50 72% 17 88% 8 88%
Wilson CC 22 50% 36 58% 57 56% 58 43% 14 79% 4 *
* Less than 5 students
40+
Color shading is to assist
college efforts to identify
subgroup strengths and
weaknesses
-15 16-17 18 19-24 25-39
27
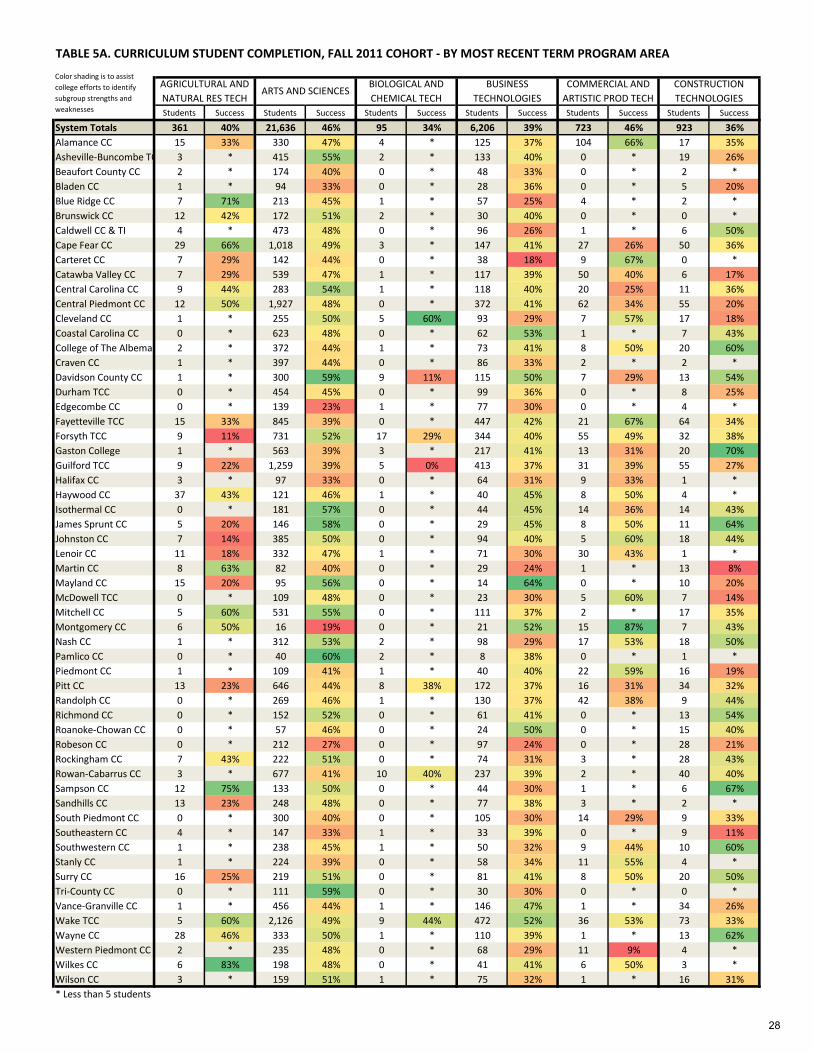
TABLE 5A. CURRICULUM STUDENT COMPLETION, FALL 2011 COHORT - BY MOST RECENT TERM PROGRAM AREA
Students Success Students Success Students Success Students Success Students Success Students Success
System Totals 361 40% 21,636 46% 95 34% 6,206 39% 723 46% 923 36%
Alamance CC 15 33% 330 47% 4 * 125 37% 104 66% 17 35%
Asheville-Buncombe TCC 3 * 415 55% 2 * 133 40% 0 * 19 26%
Beaufort County CC 2 * 174 40% 0 * 48 33% 0 * 2 *
Bladen CC 1 * 94 33% 0 * 28 36% 0 * 5 20%
Blue Ridge CC 7 71% 213 45% 1 * 57 25% 4 * 2 *
Brunswick CC 12 42% 172 51% 2 * 30 40% 0 * 0 *
Caldwell CC & TI 4 * 473 48% 0 * 96 26% 1 * 6 50%
Cape Fear CC 29 66% 1,018 49% 3 * 147 41% 27 26% 50 36%
Carteret CC 7 29% 142 44% 0 * 38 18% 9 67% 0 *
Catawba Valley CC 7 29% 539 47% 1 * 117 39% 50 40% 6 17%
Central Carolina CC 9 44% 283 54% 1 * 118 40% 20 25% 11 36%
Central Piedmont CC 12 50% 1,927 48% 0 * 372 41% 62 34% 55 20%
Cleveland CC 1 * 255 50% 5 60% 93 29% 7 57% 17 18%
Coastal Carolina CC 0 * 623 48% 0 * 62 53% 1 * 7 43%
College of The Albemarle 2 * 372 44% 1 * 73 41% 8 50% 20 60%
Craven CC 1 * 397 44% 0 * 86 33% 2 * 2 *
Davidson County CC 1 * 300 59% 9 11% 115 50% 7 29% 13 54%
Durham TCC 0 * 454 45% 0 * 99 36% 0 * 8 25%
Edgecombe CC 0 * 139 23% 1 * 77 30% 0 * 4 *
Fayetteville TCC 15 33% 845 39% 0 * 447 42% 21 67% 64 34%
Forsyth TCC 9 11% 731 52% 17 29% 344 40% 55 49% 32 38%
Gaston College 1 * 563 39% 3 * 217 41% 13 31% 20 70%
Guilford TCC 9 22% 1,259 39% 5 0% 413 37% 31 39% 55 27%
Halifax CC 3 * 97 33% 0 * 64 31% 9 33% 1 *
Haywood CC 37 43% 121 46% 1 * 40 45% 8 50% 4 *
Isothermal CC 0 * 181 57% 0 * 44 45% 14 36% 14 43%
James Sprunt CC 5 20% 146 58% 0 * 29 45% 8 50% 11 64%
Johnston CC 7 14% 385 50% 0 * 94 40% 5 60% 18 44%
Lenoir CC 11 18% 332 47% 1 * 71 30% 30 43% 1 *
Martin CC 8 63% 82 40% 0 * 29 24% 1 * 13 8%
Mayland CC 15 20% 95 56% 0 * 14 64% 0 * 10 20%
McDowell TCC 0 * 109 48% 0 * 23 30% 5 60% 7 14%
Mitchell CC 5 60% 531 55% 0 * 111 37% 2 * 17 35%
Montgomery CC 6 50% 16 19% 0 * 21 52% 15 87% 7 43%
Nash CC 1 * 312 53% 2 * 98 29% 17 53% 18 50%
Pamlico CC 0 * 40 60% 2 * 8 38% 0 * 1 *
Piedmont CC 1 * 109 41% 1 * 40 40% 22 59% 16 19%
Pitt CC 13 23% 646 44% 8 38% 172 37% 16 31% 34 32%
Randolph CC 0 * 269 46% 1 * 130 37% 42 38% 9 44%
Richmond CC 0 * 152 52% 0 * 61 41% 0 * 13 54%
Roanoke-Chowan CC 0 * 57 46% 0 * 24 50% 0 * 15 40%
Robeson CC 0 * 212 27% 0 * 97 24% 0 * 28 21%
Rockingham CC 7 43% 222 51% 0 * 74 31% 3 * 28 43%
Rowan-Cabarrus CC 3 * 677 41% 10 40% 237 39% 2 * 40 40%
Sampson CC 12 75% 133 50% 0 * 44 30% 1 * 6 67%
Sandhills CC 13 23% 248 48% 0 * 77 38% 3 * 2 *
South Piedmont CC 0 * 300 40% 0 * 105 30% 14 29% 9 33%
Southeastern CC 4 * 147 33% 1 * 33 39% 0 * 9 11%
Southwestern CC 1 * 238 45% 1 * 50 32% 9 44% 10 60%
Stanly CC 1 * 224 39% 0 * 58 34% 11 55% 4 *
Surry CC 16 25% 219 51% 0 * 81 41% 8 50% 20 50%
Tri-County CC 0 * 111 59% 0 * 30 30% 0 * 0 *
Vance-Granville CC 1 * 456 44% 1 * 146 47% 1 * 34 26%
Wake TCC 5 60% 2,126 49% 9 44% 472 52% 36 53% 73 33%
Wayne CC 28 46% 333 50% 1 * 110 39% 1 * 13 62%
Western Piedmont CC 2 * 235 48% 0 * 68 29% 11 9% 4 *
Wilkes CC 6 83% 198 48% 0 * 41 41% 6 50% 3 *
Wilson CC 3 * 159 51% 1 * 75 32% 1 * 16 31%
* Less than 5 students
Color shading is to assist
college efforts to identify
subgroup strengths and
weaknesses
CONSTRUCTION
TECHNOLOGIES
AGRICULTURAL AND
NATURAL RES TECHARTS AND SCIENCES
BIOLOGICAL AND
CHEMICAL TECH
BUSINESS
TECHNOLOGIES
COMMERCIAL AND
ARTISTIC PROD TECH
28

TABLE 5B. CURRICULUM STUDENT COMPLETION, FALL 2011 COHORT - BY MOST RECENT TERM PROGRAM AREA
Students Success Students Success Students Success Students Success Students Success Students Success
System Totals 951 39% 3,153 54% 1,315 34% 6,514 37% 1,513 35% 3,188 53%
Alamance CC 2 * 35 66% 34 26% 138 38% 28 32% 248 41%
Asheville-Buncombe TCC 51 39% 101 66% 23 30% 280 42% 27 22% 254 42%
Beaufort County CC 15 13% 28 64% 24 17% 51 29% 16 25% 26 42%
Bladen CC 0 * 13 54% 19 11% 44 27% 1 * 5 0%
Blue Ridge CC 10 40% 33 33% 14 29% 81 35% 43 21% 54 44%
Brunswick CC 6 33% 20 55% 11 82% 35 31% 1 * 8 50%
Caldwell CC & TI 14 7% 32 72% 6 17% 81 31% 85 19% 128 28%
Cape Fear CC 48 31% 56 66% 60 35% 165 32% 88 59% 94 43%
Carteret CC 0 * 24 75% 1 * 66 38% 11 18% 18 83%
Catawba Valley CC 28 36% 48 65% 44 34% 147 28% 24 17% 96 46%
Central Carolina CC 24 29% 147 41% 33 36% 220 38% 61 26% 188 38%
Central Piedmont CC 65 38% 82 57% 45 36% 374 32% 90 29% 75 77%
Cleveland CC 14 29% 24 67% 52 29% 119 36% 18 11% 89 69%
Coastal Carolina CC 5 80% 31 77% 5 100% 81 52% 20 85% 28 89%
College of The Albemarle 23 22% 32 78% 14 21% 84 57% 4 * 51 76%
Craven CC 5 20% 18 72% 20 25% 40 43% 17 12% 16 88%
Davidson County CC 8 50% 174 46% 17 6% 130 43% 53 49% 26 81%
Durham TCC 14 7% 45 44% 6 33% 68 43% 12 25% 66 68%
Edgecombe CC 2 * 32 41% 13 15% 88 35% 25 28% 20 55%
Fayetteville TCC 31 48% 87 67% 13 46% 327 35% 53 19% 62 77%
Forsyth TCC 59 39% 152 53% 53 42% 420 24% 82 34% 12 100%
Gaston College 35 46% 127 47% 38 39% 161 39% 32 22% 156 63%
Guilford TCC 67 45% 121 59% 26 54% 282 46% 160 46% 20 90%
Halifax CC 2 * 32 38% 35 29% 46 43% 18 11% 6 67%
Haywood CC 7 43% 35 63% 22 77% 96 49% 36 58% 72 24%
Isothermal CC 9 33% 23 74% 48 21% 133 26% 7 0% 79 54%
James Sprunt CC 1 * 9 33% 8 38% 59 47% 0 * 41 68%
Johnston CC 1 * 62 63% 22 27% 83 47% 63 57% 14 50%
Lenoir CC 26 42% 50 50% 44 25% 104 25% 29 45% 113 54%
Martin CC 2 * 15 67% 8 13% 28 36% 4 * 17 41%
Mayland CC 5 60% 28 57% 16 38% 63 41% 6 83% 44 32%
McDowell TCC 2 * 31 39% 12 17% 26 35% 9 22% 16 81%
Mitchell CC 14 43% 58 40% 2 * 134 47% 2 * 92 76%
Montgomery CC 0 * 11 45% 1 * 13 54% 0 * 9 22%
Nash CC 22 27% 42 50% 36 31% 129 40% 19 16% 157 45%
Pamlico CC 1 * 11 64% 3 * 26 35% 0 * 19 74%
Piedmont CC 0 * 47 45% 34 15% 74 43% 2 * 89 36%
Pitt CC 32 44% 107 64% 48 31% 143 40% 21 43% 64 36%
Randolph CC 3 * 37 73% 25 48% 70 47% 37 30% 32 41%
Richmond CC 28 43% 73 53% 31 39% 65 40% 3 * 10 80%
Roanoke-Chowan CC 0 * 8 25% 20 50% 21 14% 0 * 4 *
Robeson CC 1 * 28 54% 16 13% 103 29% 1 * 8 88%
Rockingham CC 12 50% 23 78% 38 47% 125 33% 1 * 13 62%
Rowan-Cabarrus CC 30 23% 43 63% 45 29% 190 47% 54 30% 26 73%
Sampson CC 0 * 20 45% 8 13% 70 37% 0 * 25 76%
Sandhills CC 23 48% 144 39% 5 20% 116 33% 26 27% 31 77%
South Piedmont CC 3 * 33 52% 4 * 72 38% 0 * 34 62%
Southeastern CC 19 53% 32 50% 13 15% 43 26% 0 * 7 71%
Southwestern CC 8 75% 53 70% 2 * 49 45% 20 35% 58 31%
Stanly CC 21 48% 49 57% 16 50% 104 39% 3 * 14 86%
Surry CC 13 38% 27 67% 26 23% 117 29% 39 18% 24 42%
Tri-County CC 3 * 19 37% 33 21% 28 36% 6 50% 27 44%
Vance-Granville CC 15 53% 67 46% 32 56% 148 39% 23 22% 71 51%
Wake TCC 57 47% 297 43% 32 44% 322 40% 70 39% 113 69%
Wayne CC 21 57% 65 66% 27 63% 66 35% 35 29% 25 88%
Western Piedmont CC 27 37% 45 51% 16 31% 54 33% 3 * 23 61%
Wilkes CC 15 60% 55 56% 11 45% 59 47% 22 50% 51 67%
Wilson CC 2 * 12 67% 5 0% 53 43% 3 * 20 75%
* Less than 5 students
Color shading is to assist
college efforts to identify
subgroup strengths and
weaknesses
SPECIAL CATEGORIES(Dual Enrollment)
PUBLIC SERVICE
TECHNOLOGIES
TRANSPORT SYSTEMS
TECHNOLOGIES
ENGINEERING
TECHNOLOGIESHEALTH SCIENCES
INDUSTRIAL
TECHNOLOGIES
29

TABLE 5C. CURRICULUM STUDENT COMPLETION, FALL 2011 COHORT - BY RACE/ETHNICITY AND GENDER
Students Success Students Success Students Success Students Success Students Success Students Success Students Success Students Success
System Totals 6,436 41% 5,098 31% 13,978 49% 12,457 44% 1,872 45% 1,489 42% 2,819 49% 2,429 42%
Alamance CC 128 45% 92 33% 335 48% 312 46% 92 36% 39 31% 40 48% 42 48%
Asheville-Buncombe TCC 46 41% 48 38% 527 51% 504 44% 39 33% 32 31% 57 61% 55 49%
Beaufort County CC 76 37% 56 21% 113 42% 104 32% 10 70% 7 57% 12 33% 8 63%
Bladen CC 62 27% 30 17% 51 41% 30 30% 2 * 6 17% 19 42% 10 30%
Blue Ridge CC 13 38% 4 * 202 41% 190 34% 29 45% 28 39% 26 38% 27 41%
Brunswick CC 20 50% 26 46% 113 50% 107 44% 3 * 8 38% 7 71% 13 46%
Caldwell CC & TI 33 36% 40 15% 355 45% 402 34% 14 43% 20 35% 27 56% 35 40%
Cape Fear CC 134 32% 146 35% 647 53% 667 44% 42 36% 33 36% 58 55% 58 43%
Carteret CC 14 36% 7 29% 153 53% 117 35% 3 * 7 29% 7 57% 8 13%
Catawba Valley CC 62 35% 54 41% 380 42% 373 40% 53 43% 42 40% 71 56% 72 44%
Central Carolina CC 158 41% 110 34% 321 48% 283 39% 94 39% 62 31% 53 51% 34 41%
Central Piedmont CC 580 39% 520 30% 609 53% 669 49% 158 42% 156 45% 236 55% 231 45%
Cleveland CC 98 40% 73 26% 248 52% 233 45% 10 60% 8 38% 13 31% 11 27%
Coastal Carolina CC 85 48% 58 52% 328 53% 267 53% 49 49% 39 54% 26 42% 11 64%
College of The Albemarle 86 63% 66 38% 277 51% 203 43% 11 36% 13 54% 23 48% 5 40%
Craven CC 81 46% 50 36% 176 47% 177 38% 22 55% 26 46% 37 35% 35 46%
Davidson County CC 49 43% 50 42% 385 51% 262 52% 31 55% 24 58% 30 57% 22 55%
Durham TCC 187 41% 141 33% 141 57% 126 46% 32 44% 42 31% 69 61% 34 41%
Edgecombe CC 170 30% 113 22% 62 35% 42 45% 2 * 2 * 8 38% 2 *
Fayetteville TCC 544 42% 365 32% 373 43% 247 45% 114 46% 78 40% 153 45% 91 44%
Forsyth TCC 343 38% 263 27% 529 50% 509 43% 90 42% 64 44% 89 52% 79 44%
Gaston College 113 43% 71 30% 550 43% 441 43% 48 42% 41 41% 52 56% 50 46%
Guilford TCC 591 41% 477 28% 431 46% 504 46% 82 49% 70 46% 159 46% 134 43%
Halifax CC 90 40% 87 23% 43 47% 39 36% 1 * 2 * 33 18% 18 44%
Haywood CC 6 67% 6 50% 192 50% 229 43% 10 50% 13 46% 14 57% 9 33%
Isothermal CC 42 45% 33 33% 218 49% 197 37% 12 50% 16 38% 16 69% 18 50%
James Sprunt CC 79 49% 53 45% 89 56% 46 59% 27 63% 16 69% 3 * 4 *
Johnston CC 73 37% 81 37% 264 49% 219 52% 53 60% 26 62% 26 54% 12 58%
Lenoir CC 155 45% 123 24% 217 47% 228 45% 32 31% 27 37% 13 54% 17 41%
Martin CC 60 40% 28 18% 39 36% 35 31% 3 * 1 * 28 54% 13 38%
Mayland CC 0 * 2 * 78 47% 68 51% 1 * 4 * 73 48% 70 40%
McDowell TCC 4 * 2 * 134 45% 84 38% 6 67% 3 * 5 60% 2 *
Mitchell CC 95 42% 65 29% 455 58% 234 50% 49 55% 16 44% 34 56% 20 50%
Montgomery CC 5 0% 10 20% 27 44% 42 62% 5 80% 6 0% 0 * 4 *
Nash CC 187 39% 146 35% 228 53% 207 45% 15 47% 23 39% 29 41% 18 50%
Pamlico CC 25 72% 11 36% 40 48% 24 50% 4 * 3 * 2 * 2 *
Piedmont CC 68 44% 72 31% 131 45% 132 36% 9 44% 5 40% 7 29% 11 27%
Pitt CC 109 48% 73 30% 90 49% 74 41% 8 75% 8 63% 439 50% 503 35%
Randolph CC 29 41% 17 24% 258 47% 187 43% 41 46% 33 42% 60 43% 30 50%
Richmond CC 99 48% 81 38% 110 60% 81 51% 3 * 8 38% 28 36% 26 38%
Roanoke-Chowan CC 48 38% 55 42% 20 40% 17 53% 6 17% 2 * 0 * 1 *
Robeson CC 106 33% 55 18% 67 30% 28 29% 14 43% 6 50% 139 31% 79 23%
Rockingham CC 63 43% 68 28% 195 49% 185 45% 15 53% 6 33% 8 75% 6 67%
Rowan-Cabarrus CC 151 44% 127 37% 502 43% 414 42% 69 33% 35 34% 34 44% 25 40%
Sampson CC 56 32% 22 23% 114 50% 54 52% 31 52% 12 50% 14 57% 16 69%
Sandhills CC 110 31% 85 29% 207 56% 156 47% 24 25% 23 39% 52 38% 31 26%
South Piedmont CC 63 32% 48 33% 257 41% 119 36% 32 50% 20 30% 20 65% 15 47%
Southeastern CC 71 17% 43 26% 87 48% 78 46% 4 * 1 * 10 30% 14 14%
Southwestern CC 0 * 2 * 216 52% 188 41% 18 39% 13 38% 36 39% 26 38%
Stanly CC 28 25% 28 21% 214 46% 133 40% 9 78% 16 25% 41 61% 36 47%
Surry CC 8 38% 11 9% 237 43% 236 40% 40 58% 31 35% 14 50% 13 15%
Tri-County CC 1 * 0 * 113 50% 127 43% 2 * 1 * 9 33% 4 *
Vance-Granville CC 243 43% 159 38% 255 51% 222 41% 25 44% 27 30% 36 44% 28 39%
Wake TCC 417 48% 471 33% 864 54% 994 51% 202 45% 166 45% 262 53% 236 48%
Wayne CC 129 47% 94 29% 208 56% 184 47% 33 55% 32 63% 25 56% 20 75%
Western Piedmont CC 23 35% 20 20% 208 41% 168 41% 8 63% 15 47% 23 61% 23 61%
Wilkes CC 15 33% 7 57% 219 49% 196 57% 11 18% 14 50% 4 * 1 *
Wilson CC 105 41% 53 25% 76 47% 63 54% 20 50% 12 67% 10 70% 11 64%
* Less than 5 students
Color shading is to assist
college efforts to identify
subgroup strengths and
weaknesses
OTHER FEMALE OTHER MALEAFRICAN-AMER
FEMALE
AFRICAN-
AMERIC MALE
CAUCASIAN
FEMALE
CAUCASIAN
MALE
HISPANIC
FEMALEHISPANIC MALE
30

TABLE 5D. CURRICULUM STUDENT COMPLETION, FALL 2011 COHORT - BY AGE
# % # % # % # % # % # % '10 '09 '10 '09 '10 '09 '10 '09 '10 '09 '10 '09
System Totals 3674 62% 9537 54% 14326 44% 11265 34% 4798 35% 2978 37% 59% 55% 54% 54% 43% 44% 31% 32% 35% 38% 34% 38%
Alamance CC 40 48% 422 50% 284 47% 188 34% 81 30% 65 37% 43% 52% 55% 49% 35% 44% 28% 29% 31% 27% 22% 27%
Asheville-Buncombe TCC 127 57% 482 55% 278 41% 200 36% 141 42% 80 36% 55% 50% 53% 50% 42% 40% 26% 33% 30% 48% 31% 41%
Beaufort County CC 53 47% 91 45% 94 38% 83 28% 39 23% 26 23% 50% 45% 36% 48% 39% 35% 21% 29% 19% 39% 27% 34%
Bladen CC 1 * 45 36% 56 36% 66 26% 30 20% 12 42% 0% * 32% 55% 26% 39% 21% 14% 30% 24% 19% 26%
Blue Ridge CC 73 59% 107 30% 147 41% 115 28% 54 33% 23 52% 41% 35% 37% 31% 36% 42% 33% 30% 29% 35% 36% 34%
Brunswick CC 7 71% 53 57% 142 49% 56 30% 20 50% 19 53% * * 44% 41% 36% 50% 42% 33% 31% 45% 31% 17%
Caldwell CC & TI 192 54% 168 38% 239 44% 189 30% 91 20% 47 26% 53% 58% 35% 46% 45% 46% 28% 28% 23% 31% 35% 30%
Cape Fear CC 31 71% 304 48% 717 50% 454 37% 167 39% 112 52% 50% 45% 47% 48% 49% 49% 32% 33% 47% 49% 49% 50%
Carteret CC 5 100% 63 68% 137 41% 62 26% 32 41% 17 29% * 10% 59% 43% 36% 45% 33% 24% 40% 24% 36% 43%
Catawba Valley CC 142 69% 241 48% 402 41% 208 25% 69 33% 45 31% 66% 70% 59% 55% 43% 47% 29% 31% 38% 35% 39% 33%
Central Carolina CC 71 44% 386 45% 283 38% 203 37% 95 41% 77 47% 38% 54% 46% 48% 45% 38% 34% 37% 34% 50% 32% 47%
Central Piedmont CC 24 83% 505 65% 1204 46% 967 35% 296 33% 163 39% 60% 71% 65% 57% 45% 42% 32% 33% 28% 34% 23% 30%
Cleveland CC 63 81% 245 64% 153 32% 103 22% 77 17% 53 23% 59% 66% 62% 64% 36% 42% 22% 28% 32% 32% 23% 38%
Coastal Carolina CC 0 * 163 58% 270 49% 277 52% 123 49% 30 70% * * 58% 62% 48% 49% 43% 45% 40% 54% 41% 61%
College of The Albemarle 21 57% 212 62% 198 48% 151 34% 67 40% 35 34% 61% 63% 62% 41% 39% 47% 32% 36% 43% 46% 33% 41%
Craven CC 93 54% 71 59% 163 37% 163 41% 77 35% 37 30% 59% 56% 51% 64% 44% 35% 38% 44% 33% 41% 33% 38%
Davidson County CC 88 83% 99 63% 278 46% 229 36% 84 49% 75 63% 78% 87% 60% 52% 42% 44% 31% 40% 45% 45% 51% 41%
Durham TCC 13 69% 170 61% 191 42% 234 41% 109 34% 55 35% 13% 10% 23% 41% 34% 42% 33% 32% 35% 35% 31% 33%
Edgecombe CC 9 44% 78 50% 95 32% 107 21% 60 28% 52 21% 78% 60% 46% 47% 33% 40% 24% 21% 21% 37% 21% 37%
Fayetteville TCC 5 60% 340 67% 445 41% 604 33% 390 35% 181 34% 83% 63% 68% 65% 38% 38% 30% 29% 31% 42% 36% 36%
Forsyth TCC 109 84% 206 58% 698 43% 568 32% 222 32% 163 36% 66% 70% 64% 65% 42% 44% 30% 34% 35% 40% 32% 46%
Gaston College 45 47% 329 60% 408 44% 319 30% 134 31% 131 37% 61% 44% 63% 60% 42% 45% 21% 29% 28% 32% 37% 28%
Guilford TCC 30 80% 251 59% 913 44% 827 34% 273 38% 154 30% 75% 90% 55% 45% 42% 43% 30% 34% 38% 41% 34% 43%
Halifax CC 8 75% 36 50% 89 39% 106 24% 48 23% 26 35% * 63% 59% 62% 36% 34% 31% 31% 27% 36% 48% 36%
Haywood CC 134 39% 126 48% 106 49% 59 53% 29 45% 25 60% 42% 23% 41% 38% 38% 53% 30% 32% 45% 55% 41% 34%
Isothermal CC 100 64% 216 48% 98 36% 65 29% 41 24% 32 31% 56% 61% 47% 38% 31% 42% 29% 37% 21% 38% 25% 37%
James Sprunt CC 78 76% 82 59% 46 43% 52 35% 39 46% 20 40% 83% 70% 56% 55% 45% 45% 24% 43% 49% 34% 46% 53%
Johnston CC 65 77% 138 43% 209 49% 170 44% 87 47% 85 49% 74% 56% 50% 44% 49% 45% 29% 29% 43% 33% 34% 34%
Lenoir CC 128 55% 297 48% 170 42% 131 24% 58 29% 28 21% 49% 45% 51% 48% 34% 43% 29% 33% 25% 33% 27% 43%
Martin CC 48 44% 37 35% 41 37% 40 35% 24 33% 17 18% 60% 47% 35% 48% 29% 39% 31% 43% 21% 32% 56% 31%
Mayland CC 125 39% 88 53% 31 39% 21 52% 25 56% 6 67% 44% 41% 37% 40% 38% 32% 44% 39% 40% 56% 59% 60%
McDowell TCC 36 89% 58 41% 57 44% 44 23% 26 23% 19 21% 69% 52% 43% 60% 26% 37% 35% 19% 18% 23% 39% 33%
Mitchell CC 125 74% 275 66% 263 47% 153 33% 104 38% 48 35% 67% 66% 76% 68% 46% 37% 32% 25% 39% 31% 33% 37%
Montgomery CC 4 * 27 30% 26 46% 20 55% 9 33% 13 77% 62% 31% 47% 36% 68% 68% 29% 58% 25% 33% 37% 44%
Nash CC 103 53% 312 51% 230 45% 132 32% 47 13% 29 31% 53% 39% 52% 52% 43% 44% 29% 28% 45% 33% 42% 48%
Pamlico CC 32 72% 47 57% 11 55% 13 8% 4 * 4 * 52% 61% 40% 44% 29% 9% 36% 50% 79% 68% 56% 74%
Piedmont CC 83 41% 181 43% 64 41% 47 26% 27 26% 33 36% 44% 48% 54% 50% 45% 52% 36% 27% 42% 32% 28% 39%
Pitt CC 34 29% 235 49% 536 44% 357 39% 85 39% 57 39% 39% 36% 49% 52% 41% 47% 32% 32% 36% 42% 22% 35%
Randolph CC 73 74% 98 45% 169 47% 173 33% 76 39% 66 38% 65% 73% 43% 51% 36% 42% 28% 28% 32% 33% 43% 57%
Richmond CC 30 97% 65 74% 127 44% 123 36% 60 38% 31 32% 84% 70% 51% 64% 46% 50% 29% 34% 38% 37% 48% 56%
Roanoke-Chowan CC 24 75% 9 33% 33 24% 43 42% 27 33% 13 38% 54% 63% 65% 31% 57% 50% 43% 58% 27% 64% 46% 60%
Robeson CC 19 84% 50 52% 163 24% 169 20% 67 36% 26 15% * 60% 32% 72% 28% 34% 24% 31% 41% 38% 31% 44%
Rockingham CC 58 76% 81 46% 204 49% 129 30% 40 33% 34 38% 55% 60% 52% 53% 40% 40% 33% 30% 31% 45% 26% 32%
Rowan-Cabarrus CC 128 67% 197 48% 433 45% 357 29% 148 36% 94 31% 73% 66% 50% 46% 40% 41% 25% 25% 27% 31% 27% 31%
Sampson CC 26 62% 82 68% 78 50% 82 29% 27 26% 24 29% 71% 92% 75% 71% 68% 52% 25% 30% 40% 43% 62% 39%
Sandhills CC 6 83% 145 54% 241 51% 178 29% 78 32% 40 20% 80% 76% 62% 65% 42% 40% 36% 30% 32% 31% 24% 31%
South Piedmont CC 89 69% 101 51% 135 33% 133 26% 63 29% 53 32% 50% 60% 48% 66% 34% 38% 22% 28% 24% 37% 36% 51%
Southeastern CC 14 57% 39 56% 130 35% 84 29% 31 26% 10 20% 55% 49% 44% 49% 41% 39% 18% 23% 31% 31% 29% 13%
Southwestern CC 143 54% 104 49% 94 53% 80 28% 44 36% 34 32% 50% 48% 45% 49% 46% 46% 32% 24% 38% 46% 37% 41%
Stanly CC 42 74% 65 63% 182 39% 123 37% 58 29% 35 34% 38% 47% 75% 71% 48% 40% 31% 43% 39% 44% 46% 44%
Surry CC 128 51% 123 48% 202 45% 81 23% 34 21% 22 9% 57% 49% 34% 45% 41% 50% 31% 19% 36% 40% 19% 36%
Tri-County CC 52 69% 87 49% 38 37% 30 27% 33 24% 17 35% 70% 67% 54% 61% 36% 42% 23% 24% 35% 33% 50% 44%
Vance-Granville CC 250 58% 156 55% 276 38% 193 30% 71 27% 49 37% 57% 42% 45% 45% 38% 39% 31% 28% 38% 28% 46% 29%
Wake TCC 90 76% 503 63% 1356 50% 1061 41% 364 38% 238 44% 74% 70% 59% 56% 48% 47% 36% 33% 39% 34% 36% 34%
Wayne CC 74 76% 108 66% 246 48% 175 35% 81 43% 41 37% 73% 81% 68% 73% 50% 50% 37% 34% 48% 54% 45% 49%
Western Piedmont CC 8 88% 135 61% 160 43% 114 29% 47 28% 24 17% 100% 80% 64% 58% 50% 50% 23% 23% 23% 40% 25% 33%
Wilkes CC 12 58% 132 55% 210 51% 64 47% 33 45% 16 38% 44% 34% 65% 64% 39% 41% 26% 32% 41% 29% 35% 37%
Wilson CC 63 76% 71 49% 77 40% 90 32% 32 25% 17 41% 60% 62% 49% 65% 29% 47% 38% 31% 53% 36% 32% 34%
* Less than 5 students
2011 CohortColor shading is to assist
college efforts to identify
subgroup strengths and
weaknesses
-15 16-17 18 19-24 25-39 40+ 18 19-24 25-39 40+
2009-2010 Cohorts-15 16-17
31

TABLE 6A. LICENSURE AND CERTIFICATION PASSING RATE, JULY 2016 - JUNE 2017 - BY EXAM
TEST TEST TEST TEST
16-17 16-17 15-16 14-15 13-14 16-17 16-17 15-16 14-15 13-14 16-17 16-17 15-16 14-15 13-14 16-17 16-17 15-16 14-15 13-14
System Totals 58 86% 92% 90% 97% 49 86% 96% 96% 97% 53 87% 88% 93% 97% 163 77% 83% 83% 90%
Alamance CC * * * * * * * * * * * * * * * *
Asheville-Buncombe TCC * * * * * * * * * * * * 10 80% 100% 90% 100%
Beaufort County CC * * * * * * * * * * * * * * * *
Bladen CC * * * * * * * * * * * * * * * *
Blue Ridge CC 7 86% * * * 6 83% * * * 6 67% * * * * * * *
Brunswick CC * * * * * * * * * * * * 2 * * * *
Caldwell CC & TI * * * * * * * * * * * * 12 67% 78% 86% 100%
Cape Fear CC * * * * * * * * * * * * * * * *
Carteret CC * * * * * * * * * * * * 5 80% * 100% 90%
Catawba Valley CC * * * * * * * * * * * * * * * *
Central Carolina CC * * * * * * * * * * * * 10 30% * * *
Central Piedmont CC * * * * * * * * * * * * * * * *
Cleveland CC * * * * * * * * * * * * * * * *
Coastal Carolina CC * * * * * * * * * * * * 13 100% 85% 81% 100%
College of The Albemarle 2 * * 60% * 2 * * * * * * * * * * * *
Craven CC 25 80% 96% 95% 100% 14 86% 88% 93% 100% 18 78% 90% 100% 100% * * * *
Davidson County CC * * * * * * * * * * * * 8 75% 86% 67% 88%
Durham TCC * * * * * * * * * * * * * * * *
Edgecombe CC * * * * * * * * * * * * * * * *
Fayetteville TCC * * * * * * * * * * * * 9 56% 55% 67% 81%
Forsyth TCC * * * * * * * * * * * * 7 71% 100% 90% 92%
Gaston College * * * * * * * * * * * * 8 88% * 79% *
Guilford TCC 17 94% 93% 92% 100% 19 84% 100% 100% 95% 21 95% 87% 93% 100% * * * *
Halifax CC * * * * * * * * * * * * * * * *
Haywood CC * * * * * * * * * * * * * * * *
Isothermal CC * * * * * * * * * * * * 14 79% 83% 92% 88%
James Sprunt CC * * * * * * * * * * * * * * * *
Johnston CC * * * * * * * * * * * * 8 63% 100% 100% 100%
Lenoir CC * * * * * * * * * * * * 4 * 100% 80% *
Martin CC * * * * * * * * * * * * * * * *
Mayland CC * * * * * * * * * * * * 5 80% 91% * 88%
McDowell TCC * * * * * * * * * * * * * * * *
Mitchell CC * * * * * * * * * * * * * * * *
Montgomery CC * * * * * * * * * * * * * * * *
Nash CC * * * * * * * * * * * * * * * *
Pamlico CC * * * * * * * * * * * * * * * *
Piedmont CC * * * * * * * * * * * * * * * *
Pitt CC * * * * * * * * * * * * 8 100% * 83% 100%
Randolph CC * * * * * * * * * * * * * * * *
Richmond CC * * * * * * * * * * * * * * * *
Roanoke-Chowan CC * * * * * * * * * * * * * * * *
Robeson CC * * * * * * * * * * * * * * * *
Rockingham CC * * * * * * * * * * * * * * * *
Rowan-Cabarrus CC * * * * * * * * * * * * * * * *
Sampson CC * * * * * * * * * * * * * * * *
Sandhills CC * * * * * * * * * * * * 16 100% 85% 80% 86%
South Piedmont CC * * * * * * * * * * * * 4 * 100% 100% 83%
Southeastern CC * * * * * * * * * * * * 1 * * * *
Southwestern CC * * * * * * * * * * * * 10 70% 45% 83% 80%
Stanly CC * * * * * * * * * * * * * * * *
Surry CC * * * * * * * * * * * * * * * *
Tri-County CC * * * * * * * * * * * * 2 * * 40% *
Vance-Granville CC * * * * * * * * * * * * * * * *
Wake TCC * * * * * * * * * * * * 6 67% 100% 100% 100%
Wayne CC 7 86% 93% 83% 86% 8 88% 100% 100% 100% 8 100% 87% 100% 83% * * * *
Western Piedmont CC * * * * * * * * * * * * * * * *
Wilkes CC * * * * * * * * * * * * 1 * 83% 83% *
Wilson CC * * * * * * * * * * * * * * * *
*Less than 5
% PASSING
MASSAGE & BODY WORKColor shading is to assist
college efforts to identify
subgroup strengths and
weaknesses
% PASSING % PASSING% PASSING
AVIATION - GENERAL AVIATION - AIRFRAME AVIATION - POWER PLANT
32

TABLE 6B. LICENSURE AND CERTIFICATION PASSING RATE, JULY 2016 - JUNE 2017 - BY EXAM
TEST TEST TEST TEST
16-17 16-17 15-16 14-15 13-14 16-17 16-17 15-16 14-15 13-14 16-17 16-17 15-16 14-15 13-14 16-17 16-17 15-16 14-15 13-14
System Totals 10 80% 59% 78% 85% 22 82% 71% 100% 92% 308 96% 94% 93% 94% 438 66% 59% 62% 62%
Alamance CC * * * * * * * * * * * * 6 83% * 20% *
Asheville-Buncombe TCC * * * * * * * * 13 100% 100% 100% 100% * * * *
Beaufort County CC * * * * * * * * * * * * * * * *
Bladen CC * * * * * * * * * * * * * * * *
Blue Ridge CC * * * * * * * * * * * * 2 * * * *
Brunswick CC * * * * * * * * * * * * * 38% 50% 75%
Caldwell CC & TI 2 * * 75% 80% * * * * 8 100% 73% 47% 90% * * * *
Cape Fear CC * * * * * * * * 15 100% 100% 100% 100% 14 71% 82% 71% 80%
Carteret CC * * * * * * * * 16 94% 100% 100% 100% 32 56% 87% 50% 50%
Catawba Valley CC * * * * * * * * 7 86% 100% 100% 100% 4 * 13% 33% *
Central Carolina CC * * * * * * * * * * * * * * * 89%
Central Piedmont CC * * * * * * * * * * * * 154 79% 61% 78% 70%
Cleveland CC * * * * * * * * 17 76% 83% 80% 83% * * * *
Coastal Carolina CC * * * * * * * * * * * * * * * *
College of The Albemarle * * * * * * * * * * * * * * * *
Craven CC * * * * * * * * * * * * 11 36% 25% 38% 22%
Davidson County CC * * * * * * * * * * * * * * * *
Durham TCC * * * * * * * * * * * * * * 73% 69%
Edgecombe CC * * * * * * * * 8 100% 69% 95% 74% 2 * * * *
Fayetteville TCC * * * * * * * * 24 100% 100% 100% 100% * * * *
Forsyth TCC * * * * 6 83% * 100% 100% 16 100% 82% 100% 100% * * * *
Gaston College * * * * * * * * * * * * 11 55% 86% 73% 45%
Guilford TCC * * * * * * * * 14 100% 100% 93% 87% 7 57% 25% 49% 65%
Halifax CC * * * * * * * * * * * * * * * *
Haywood CC * * * * * * * * * * * * * * * *
Isothermal CC * * * * * * * * * * * * * * 60% *
James Sprunt CC * * * * * * * * * * * * * * * *
Johnston CC 2 * 86% * * * * * * 23 96% 100% 89% 96% 3 * 33% 60% 25%
Lenoir CC * * * * * * * * 4 * 83% 83% * 1 * * * *
Martin CC * * * * * * * * * * * * * * * *
Mayland CC * * * * * * * * * * * * * * * *
McDowell TCC * * * * * * * * * * * * * * * *
Mitchell CC * * * * * * * * * * * * 41 49% 53% 70% 65%
Montgomery CC * * * * * * * * * * * * * * * *
Nash CC * * * * * * * * * * * * * * * *
Pamlico CC * * * * * * * * * * * * * * * *
Piedmont CC * * * * * * * * * * * * * * * *
Pitt CC 6 83% 33% * 92% 16 81% 73% 100% 90% 23 100% 94% 100% 100% 7 57% 100% 83% 86%
Randolph CC * * * * * * * * 14 100% 100% 78% 100% * * * 67%
Richmond CC * * * * * * * * * * * * * * * *
Roanoke-Chowan CC * * * * * * * * * * * * * * * *
Robeson CC * * * * * * * * 7 100% 88% 100% 78% * * * *
Rockingham CC * * * * * * * * * * * * * * * *
Rowan-Cabarrus CC * * * * * * * * 15 100% 100% 100% 100% 60 70% 57% 64% 64%
Sampson CC * * * * * * * * * * * * * * * *
Sandhills CC * * * * * * * * 15 93% 100% 100% 89% 15 73% 80% 88% 33%
South Piedmont CC * * * * * * * * * * * * 15 53% 44% * *
Southeastern CC * * * * * * * * * * * * * * * *
Southwestern CC * * * * * * * * 11 73% 100% 77% 100% 4 * * * 62%
Stanly CC * * * * * * * * 12 100% 100% 100% 100% 9 44% 78% 25% 43%
Surry CC * * * * * * * * * * * * * * * *
Tri-County CC * * * * * * * * * * * * * * 43% *
Vance-Granville CC * * * * * * * * 15 93% 91% 97% 85% * * * *
Wake TCC * * * * * * * * 27 100% 100% 100% 100% 1 * * * *
Wayne CC * * * * * * * * * * * * 1 * * * 75%
Western Piedmont CC * * * * * * * * * * * * * * * *
Wilkes CC * * * * * * * * 4 * 83% 100% 100% 38 63% 67% 69% 75%
Wilson CC * * * * * * * * * * * * * * * *
*Less than 5
Color shading is to assist
college efforts to identify
subgroup strengths and
weaknesses
% PASSING
REAL ESTATE SALES
% PASSING % PASSING
RADIOGRAPHYRADIATION THERAPYNUC. MED. TECH.
% PASSING
33

TABLE 6C. LICENSURE AND CERTIFICATION PASSING RATE, JANUARY 2017- DECEMBER 2017 - BY EXAM
TEST TEST TEST TEST TEST
'17 '17 '16 '15 '14 '17 '17 '16 '15 '14 '17 '17 '16 '15 '14 '17 '17 '16 '15 '14 '17 '17 '16 '15 '14
System Totals 99 92% 97% 92% 94% 638 85% 91% 90% 93% 211 89% 89% 94% 93% 27 89% 83% 78% 78% 149 79% 82% 79% 79%
Alamance CC 7 86% 100% * 100% 18 89% 88% 79% 90% * * * * * * * * * * * *
Asheville-Buncombe TCC * * * * 11 100% 100% 100% 95% 16 100% 100% 94% 100% 2 * * * * 6 100% 100% * *
Beaufort County CC 1 * * * * 8 63% 89% 100% 91% * * * * * * * 80% 4 * * 60% 100%
Bladen CC 2 * * * * 8 75% 100% 86% 100% * * * * * * * * * * * *
Blue Ridge CC 6 92% 12 92% 100% 93% 100% 6 100% 60% 100% * 1 * * * * * * * *
Brunswick CC 1 * 100% 71% * 2 * 78% 78% 90% 6 100% 93% 100% 100% * * * * 4 * 100% 89% *
Caldwell CC & TI 9 100% 100% 100% 100% 18 94% 92% 100% 100% * * * * * * * * * * * 100%
Cape Fear CC 17 100% 100% 96% 100% 21 90% 89% 91% 88% 21 81% 71% 100% 88% 2 * * * * * 80% 56% 83%
Carteret CC * * * * 13 100% 100% 100% 92% 8 100% * * 60% 2 * * * * * * * *
Catawba Valley CC * * * * 8 75% 100% 100% 100% * * * * 1 * * * * * * * *
Central Carolina CC 13 92% 100% 88% 88% 32 91% 94% 88% 89% 23 91% 100% 87% 94% 5 100% * 80% 100% * * * *
Central Piedmont CC * * * * 23 91% 89% 95% * * * * * * * * * 1 * * * *
Cleveland CC * 100% * * 16 88% 94% 83% 92% 12 83% 67% 100% * * * * * 5 100% * 89% 80%
Coastal Carolina CC * * * * 22 91% 84% 97% 92% * * * * * * * * * * * *
College of The Albemarle * * * 93% 8 88% 93% * 100% * * * * * * * * * * * *
Craven CC 5 60% 100% 100% * 12 75% 92% 83% 56% 7 86% 75% * 83% * * * * 1 * * * 71%
Davidson County CC * * * * 9 100% 100% 96% 96% 7 100% 88% 92% 89% * * * * * * * *
Durham TCC * * * * * * * * 17 94% 88% 100% 100% * * * * * * * *
Edgecombe CC * * * * 10 90% 60% 55% 100% 3 * * 100% * * * * * * * * *
Fayetteville TCC * * * * 19 74% 94% 94% 93% 22 82% 100% 84% 88% 1 * * * * 24 92% 71% 81% 89%
Forsyth TCC * * * * * * * * * * * * * * * * * * * *
Gaston College * * * * 31 87% 96% 83% 96% * * * * 1 * * * * * * * *
Guilford TCC 4 * 100% * * 12 100% 86% 92% 100% * * * * * * * * * * * *
Halifax CC * * * * 5 80% 88% 100% * * * * * * * * * * * * *
Haywood CC * * * * 4 * 86% 100% 94% * * * * * * * * * * 100% *
Isothermal CC 1 * * * 100% 2 * 100% 100% 100% * * * * * * * * 8 100% 80% 83% *
James Sprunt CC 1 * * * * 6 67% * 83% * * * * * * * * * 1 * * * *
Johnston CC * * * * 14 93% 100% 95% 94% * * * * * * * * 2 * * 60% 80%
Lenoir CC 4 * 85% 91% 80% 56 66% 79% 68% 70% 6 67% * * 100% 4 * * * * 23 70% 67% 72% 57%
Martin CC * * * * 6 83% 67% * 100% * * * * * * * * * * * *
Mayland CC 1 * * 100% * 4 * 100% 100% 90% * * * * * * * * 1 * * * *
McDowell TCC * * * * 9 89% 90% 100% 88% 6 100% 100% 100% 100% 1 * * * * * * * *
Mitchell CC * * * * 13 77% 100% 92% 92% 5 80% * * * * * * * 10 70% * * *
Montgomery CC * * * * * * * * * * * * * * * * * * * *
Nash CC 2 * * 100% * 5 60% * 60% 82% * * * * 1 * * 80% * 5 100% 100% * *
Pamlico CC * * * * 3 * * * * 1 * * * * * * * * * * * *
Piedmont CC 4 * * * * 2 * 100% * 82% * * * * * * * * * * * *
Pitt CC * * * * * 100% * * * * * * * * * * * * * *
Randolph CC 3 * * 100% * 6 100% 100% 100% 92% * * * * 1 * * * * 4 * * * *
Richmond CC * * * * * * * * * * * * * * * * * * * *
Roanoke-Chowan CC * * * * 6 17% * * * * * * * * * * * * * * *
Robeson CC * * * * 9 100% 89% 83% 92% * * * * * * * * * * * *
Rockingham CC * * * * 6 83% 92% * 91% * * * * * * * * * * * *
Rowan-Cabarrus CC * * 100% 100% 41 90% 86% 94% 95% 21 81% 86% 92% 100% 3 * * * * 10 70% * * 100%
Sampson CC * * * * 1 * 56% 92% 100% * * * * * * * * * * * *
Sandhills CC 13 85% 100% 100% 92% 5 100% 91% 88% 89% * * * * * * * * * * * *
South Piedmont CC * * * * * * * * * * * * * * * * * * * *
Southeastern CC * * * * 8 100% * 100% 100% * * * * * * * * * * * *
Southwestern CC * * * * 28 89% 100% 86% 100% * * * * * * * * * * * *
Stanly CC * * * * 21 62% 91% 93% 86% * * * * 1 * * * * 10 90% * 100% 79%
Surry CC * * * * 23 100% 94% 96% 100% * * * * * * * * * * * *
Tri-County CC * * * * 5 80% 86% 100% 89% 5 80% 80% * * * * * * * * * *
Vance-Granville CC 5 100% 100% 71% 83% 12 83% 100% 81% 80% * * * * 1 * * * * * 100% * *
Wake TCC * * * * 25 92% 94% 96% 96% 19 100% 93% 100% 95% * * * * 30 70% * 80% *
Wayne CC * * * * * * * * * * * * * * * * * * * *
Western Piedmont CC * * * * * * * * * * * * * * * * * * * *
Wilkes CC * * * * * * * * * * * * * * * * * * * *
Wilson CC * * * * * * * * * * * * * * * * * * * *
*Less than 5
COSMETIC ARTS
APPRENTICE COSMETOLOGY ESTHETICIANColor shading is to assist
college efforts to identify
subgroup strengths and
weaknesses
% PASSING% PASSING % PASSING % PASSING
INSTRUCTOR
% PASSING
MANICURIST
34

TABLE 6D. LICENSURE AND CERTIFICATION PASSING RATE, JANUARY 2017 - DECEMBER 2017 - BY EXAM
TEST TEST TEST TEST TEST
'17 '17 '16 '15 '14 '17 '17 '16 '15 '14 '17 '17 '16 '15 '14 '17 '17 '16 '15 '14 '17 '17 '16 '15 '14
System Totals 1,492 81% 80% 82% 82% 745 92% 92% 96% 97% 3,000 72% 77% 76% 78% 211 58% 72% 65% 70% 633 73% 80% 89% 91%
Alamance CC 34 82% 73% 92% 76% 36 81% 81% 96% 93% 59 69% 68% 78% 74% * * * * 8 38% 80% 88% 78%
Asheville-Buncombe TCC46 89% 98% 76% 88% 29 100% 100% 100% 100% 86 74% 86% 80% 78% 29 66% 95% 85% 67% 24 88% 93% 97% 100%
Beaufort County CC 5 80% 67% 81% 83% * * * * 41 80% 79% 50% 79% * * * * 20 60% 60% 83% 100%
Bladen CC 5 80% * 90% 78% * * * * 13 77% 75% 87% 67% * 53% 50% 67% 6 17% 86% 79% 67%
Blue Ridge CC 25 68% 79% 76% 95% * * * * 40 65% 82% 77% 74% 11 45% * * 88% 15 67% 50% 72% 69%
Brunswick CC 28 89% 71% 60% 88% 18 89% * * * 9 67% 72% 61% 65% 8 38% * 45% 55% 1 * * 100% *
Caldwell CC & TI 18 72% 71% 65% 50% 9 89% * * * 75 92% 75% 66% 64% * * * * 11 64% 65% 68% 83%
Cape Fear CC 84 65% 82% 79% 88% 66 95% 95% 100% 96% 108 82% 94% 84% 92% 28 82% 81% 87% 91% 14 36% 100% * 100%
Carteret CC 34 76% 86% 80% 61% 6 100% 80% * * 11 64% 64% 61% 75% * 71% * * 12 67% * 100% 92%
Catawba Valley CC 20 75% 55% 51% 48% 15 93% 100% 100% 100% 49 88% 94% 85% 78% 7 100% * 100% 83% 9 89% 100% 100% 100%
Central Carolina CC 27 93% 95% 96% 96% 11 100% 100% 100% 100% 31 65% 78% 74% 96% * * * * 7 71% 79% * 67%
Central Piedmont CC 43 86% 91% 94% 92% * * * * 170 86% 88% 84% 88% * * * * 23 96% * 100% 100%
Cleveland CC 18 94% 84% 80% 83% 26 96% 88% 95% 100% 55 60% 64% 75% 74% * * * * 26 65% 47% 100% 100%
Coastal Carolina CC 39 92% 93% 98% 69% 22 100% 95% 100% 95% 74 96% 96% 96% 95% * * * 93% 14 100% * 100% 100%
College of The Albemarle35 57% 45% 70% 78% 16 100% 100% 94% 100% 59 64% 92% 79% 91% 5 80% * 71% 60% 10 60% * 80% *
Craven CC 24 83% 87% 92% 70% 17 94% 95% 82% 100% 57 51% 57% 52% 57% 2 * 63% 86% * 3 * 43% * 100%
Davidson County CC 40 60% 56% 79% 96% * * * * 65 69% 85% 84% 75% 6 50% * * 67% 19 63% 100% 93% 81%
Durham TCC 37 95% 95% 90% 88% * * * * 39 95% 100% 90% 94% * * 100% 92% * 100% * 100%
Edgecombe CC 12 75% 75% 82% * 8 88% 50% 90% 92% 14 64% 58% 31% 68% * * 40% * 6 83% 60% 33% 100%
Fayetteville TCC 31 77% 73% 89% 87% 55 98% 100% 98% 100% 138 81% 88% 86% 82% * * * * 54 81% 86% 92% 94%
Forsyth TCC 30 83% 75% 85% 74% * * * * 136 79% 86% 79% 84% * 80% * 100% 5 100% 83% 100% 100%
Gaston College 45 96% 92% 93% 95% 8 100% 75% 100% 100% 56 77% 86% 84% 90% * * * 100% 10 80% 100% 94% 100%
Guilford TCC 28 86% 85% 83% 66% 60 83% 94% 96% 96% 125 74% 83% 88% 86% 10 60% 54% * 86% 16 75% 80% 95% 100%
Halifax CC 18 61% 59% 71% 75% 10 70% 81% 83% 93% 14 71% 55% 75% 60% * * * * * * * *
Haywood CC 26 92% 76% 60% 60% 6 83% * * * 12 75% 100% 76% 73% * 88% 73% 88% * * * *
Isothermal CC 20 50% * 100% 88% 23 91% 92% 90% 96% 42 57% 45% 71% 92% * * * 36% 2 * * * 86%
James Sprunt CC 0 * 57% 67% 76% 9 67% 91% 100% 83% 18 28% 83% 91% 79% * * * * 4 * * 80% *
Johnston CC 26 85% 76% 96% 90% * * * * 67 75% 69% 74% 76% * * 63% 69% 23 87% 84% 91% 90%
Lenoir CC 25 76% 53% 44% 72% * * 73% 100% 308 67% 78% 73% 73% 48 67% 81% 72% 68% 91 77% 82% 94% 93%
Martin CC 16 63% 56% * 29% * * * * 21 48% 33% 59% * 3 * 53% 18% * 1 * * * *
Mayland CC 0 * 86% 100% 67% * * 100% 100% 21 67% 54% 67% 48% * * * * * * * *
McDowell TCC 28 93% 86% 90% 89% * * * * 9 89% 88% 73% 80% 13 69% * * * 8 88% 80% 100% 60%
Mitchell CC 29 100% 94% 100% 74% * * * * 62 69% 72% 75% 77% * 70% * * * * * *
Montgomery CC 7 43% 71% 86% * * * * * * 57% 60% 100% * * * * * * * *
Nash CC 40 95% 83% 79% 80% 18 83% 92% 100% 100% 38 55% 62% 54% 39% 7 14% 86% 67% 42% 18 50% * 75% 80%
Pamlico CC 0 * * * * * * * * 4 * 86% 67% 89% 3 * * * * * * * *
Piedmont CC 0 * * * 41% * * * * 19 63% 36% 38% 90% * * * * * * * *
Pitt CC 36 89% 86% 90% 95% 20 100% 95% 93% 96% 76 53% 58% 58% 61% 8 13% * 62% 44% 11 55% * 94% 100%
Randolph CC 37 84% 92% 87% 80% 18 94% 95% 100% 100% 31 77% 72% 68% 65% 6 50% * 67% * 11 82% * 88% *
Richmond CC 5 60% 60% 50% 58% 17 88% 67% * * 20 70% 70% 53% 46% * * 71% * * * * *
Roanoke-Chowan CC 0 * * * * * * * * 28 89% 55% 56% 80% * * 56% * 1 * 40% * 73%
Robeson CC 28 93% 86% 73% 91% * 100% 100% 100% 77 56% 33% 49% 68% * 44% 29% 17% 12 42% 50% * *
Rockingham CC 25 80% 53% 97% 82% * * * * 47 51% 86% 63% 51% * * * * * 20% 85% *
Rowan-Cabarrus CC 45 80% 75% 81% 84% 37 95% 97% 97% 97% 140 52% 67% 62% 70% * 63% 67% * 27 63% * * 77%
Sampson CC 16 38% 100% 56% 85% * * * * 2 * 40% 63% 71% * * * * * * 93% 89%
Sandhills CC 26 81% 75% 92% 97% 19 84% 79% 90% 97% 58 78% 81% 91% 80% * * * * 15 87% 100% 100% 100%
South Piedmont CC 27 74% 80% 91% 70% * * * * 30 73% 70% 62% 69% * * * * 7 100% 100% 100% 88%
Southeastern CC 15 47% 43% 29% 71% * * * * 19 79% 70% 50% 75% * * 33% * * * 100% *
Southwestern CC 14 100% 100% 100% 80% 23 83% 100% 100% 100% 19 89% 65% 75% 90% * * * 100% 4 * 100% 100% 100%
Stanly CC 56 77% 84% 82% 90% * * * * 7 86% 69% 86% 55% * * * * 2 * 43% 88% 93%
Surry CC 31 100% 100% 97% 92% 8 100% 88% 100% 100% 47 83% 82% 84% 85% * * * * 22 95% 100% 93% 100%
Tri-County CC 9 89% * 63% 38% * 80% 100% * 25 68% 72% 83% 62% 11 9% * 50% 60% 1 * * 75% *
Vance-Granville CC 25 88% 85% 69% 96% 6 100% 71% * 100% 30 80% 83% 76% 64% * * * * 21 67% 57% 83% 73%
Wake TCC 39 95% 95% 90% 91% 65 95% 93% * * 87 92% 80% 89% 87% * * * * 13 92% 100% 95% 100%
Wayne CC 27 93% 93% 95% 92% 18 94% 97% 89% 100% 57 86% 86% 84% 90% * * 22% 63% 4 * * 100% 100%
Western Piedmont CC 34 82% 89% 81% 91% * * * * 23 61% 71% 88% 91% * * * * * * 86% 93%
Wilkes CC 30 67% 56% 81% 81% 28 86% 96% 97% 100% 19 47% 56% 86% 76% 6 50% * * * 22 64% 60% 100% 93%
Wilson CC 24 58% 84% 48% 88% 18 83% * 89% 80% 13 54% 57% 79% 69% * * * * * * 86% *
*Less than 5
** July-June Timeframe for '14, '17
Color shading is to assist
college efforts to identify
subgroup strengths and
weaknesses
% PASSING% PASSING
DETENTION OFFICER EMT-Basic EMT-Intermediate
% PASSING % PASSING
EMT-Paramedic
% PASSING
BLET**
35

TABLE 6E. LICENSURE AND CERTIFICATION PASSING RATE, JANUARY 2017- DECEMBER 2017 - BY EXAM
TEST TEST TEST TEST TEST
'17 '17 '16 '15 '14 '17 '17 '16 '15 '14 '17 '17 '16 '15 '14 '17 '17 '16 '15 '14 '17 '17 '16 '15 '14
System Totals 212 82% 92% 91% 93% 144 92% 91% 93% 88% 673 95% 92% 92% 93% 2025 90% 92% 92% 87% 67 100% 100% 100% 98%
Alamance CC * * * * * * * * * * 94% * 38 79% 88% 86% 81% * * * *
Asheville-Buncombe TCC14 71% 100% 94% 100% * * * * * 80% * 84% 67 96% 93% 96% 80% 17 100% 100% 100% 100%
Beaufort County CC * * * * * * * * 19 95% 80% 90% 89% 44 70% 80% 83% 91% * * * *
Bladen CC * * * * * * * * 23 96% 95% 79% 93% 31 84% 90% 92% 91% * * * *
Blue Ridge CC * * * * * * * * * * * * 31 90% 89% 89% 90% 2 * * * *
Brunswick CC * * * * * * * * 11 100% 100% 100% 100% 19 95% 100% 100% 89% * * * *
Caldwell CC & TI * * * * 16 88% 77% 93% 100% * * * * 37 100% 86% 94% 100% * * * *
Cape Fear CC 8 88% 100% 100% 89% * * * * 21 100% 100% 100% 100% 70 97% 100% 100% 100% * * * *
Carteret CC * * * * * * * * 6 100% 57% 89% 100% 18 94% 92% 90% 100% * * * *
Catawba Valley CC 15 80% 100% 81% 95% * * * * * * * * 33 97% 96% 92% 79% * * * *
Central Carolina CC 16 75% 100% 100% 90% * * * * 39 90% 70% 90% 89% 32 44% 78% 91% 100% 29 100% 100% 100% 100%
Central Piedmont CC 27 93% 96% 92% 96% 24 100% 100% 100% 87% * * * * 48 94% 96% 97% 87% * * * *
Cleveland CC * * * * * * * * 11 100% 100% 93% 100% 15 100% 95% 95% 82% * * * *
Coastal Carolina CC 12 100% 93% 92% 100% * * * * 17 88% 94% 89% 94% 27 96% 89% 90% 91% * * * *
College of The Albemarle * * * * * * * * 16 100% 89% 96% 100% 20 100% 97% 100% 100% * * * *
Craven CC * * * * 17 82% 100% 88% 82% 10 100% 92% 100% 89% 38 92% 93% 94% 82% * * * *
Davidson County CC * * * * * * * * 13 92% 100% 88% 94% 47 98% 96% 89% 85% * * * *
Durham TCC * * * * * * * * 38 97% 100% 100% 94% 68 76% 75% 86% 88% * * * *
Edgecombe CC * * * * * * * * 11 100% 100% 100% 100% 36 78% 83% 83% 96% * * * *
Fayetteville TCC 21 90% 94% 94% 100% 14 93% 88% 81% 92% 39 95% 85% 95% 86% 42 100% 91% 95% 74% * * * *
Forsyth TCC 10 60% 100% 92% 100% * * * * 73 92% 96% 95% 97% 107 95% 95% 96% 94% * * * *
Gaston College * * * * * * * * 52 100% 100% 98% 100% 65 98% 100% 93% 95% 16 100% 100% 100% 94%
Guilford TCC 17 94% 84% 88% 100% 19 95% * 100% 100% 22 86% 100% 82% 76% 88 85% 94% 87% 79% * * * *
Halifax CC 20 65% 81% 77% 83% * * * * 5 80% 71% 60% 92% 7 100% 86% 68% 68% * * * *
Haywood CC * * * * * * * * * * * * 25 92% 85% 82% 48% * * * *
Isothermal CC * * * * * * * * 16 100% 63% 80% 81% 19 95% 100% 80% 89% * * * *
James Sprunt CC * * * * * * * * 8 100% 100% 100% 100% 16 94% 93% 63% 89% * * * *
Johnston CC * * * * * * * * * * * * 41 98% 100% 100% 94% * * * *
Lenoir CC * * * * * * * * 6 100% 100% 100% 100% 22 95% 100% 96% 100% * * * *
Martin CC * * * * 13 85% 70% 90% 75% * * * * * * * * * * * *
Mayland CC * * * * * * * * * * * * 18 94% 82% 93% 85% * * * *
McDowell TCC * * * * * * * * 23 91% 97% 97% 97% 21 81% 100% 88% 83% * * * *
Mitchell CC * * * * * * * * * * * * 32 100% 97% 97% 100% * * * *
Montgomery CC * * * * * * * * 31 97% 83% 80% * * * * * * * * *
Nash CC * * * * 15 93% 100% 95% 100% 11 82% 78% 71% 89% 24 88% 86% 67% 84% * * * *
Pamlico CC * * * * * * * * * * * * * * * * * * * *
Piedmont CC * * * * * * * * * * * * 26 65% 81% 93% 64% 1 * * * *
Pitt CC * * * * * * * * * * * * 91 92% 90% 90% 89% * * * *
Randolph CC * * * * * * * * * * * * 15 93% 79% 92% 97% * * * *
Richmond CC * * * * * * * * 10 100% 100% 90% 69% 28 100% 90% 86% 96% * * * *
Roanoke-Chowan CC * * * * * * * * * * * * 9 78% 64% 92% 57% * * * *
Robeson CC * * * * * * * * 16 100% 100% 100% 88% 21 100% 100% 100% 83% * * * *
Rockingham CC * * * * * * * * 13 92% 100% 88% 88% 16 88% 100% 100% 75% * * * *
Rowan-Cabarrus CC * * * * * * * * 11 100% 100% 100% 100% 48 88% 95% 84% 83% * * * *
Sampson CC * * * * * * * * 15 100% 100% 100% 100% 29 83% 94% 92% 90% * * * *
Sandhills CC * * * * * * * * * * * 100% 61 92% 100% 92% 98% * * * *
South Piedmont CC * * * * * * * * 14 93% 90% 92% 100% 27 89% 96% 95% 83% * * * *
Southeastern CC * * * * * * * * 14 100% 97% 100% 88% 24 83% 75% 100% 73% * * * *
Southwestern CC * * * * 12 100% 100% 100% 100% * * * * 22 82% 96% 88% 75% * * * *
Stanly CC * * * * * * * * * * * * 42 88% 90% 94% 100% * * * *
Surry CC * * * * 14 93% 100% 94% 63% 10 100% 100% * 100% 42 95% 96% 98% 85% * * * *
Tri-County CC * * * * * * * * * * * * 8 63% 80% 71% 85% 2 * * * *
Vance-Granville CC * * * * * * * * 16 88% 91% 70% * 41 88% 90% 85% 88% * * * *
Wake TCC 24 75% 90% 93% 87% * * * * * * * * 112 98% 97% 98% 95% * * * *
Wayne CC 28 82% 88% 89% 79% * * * * 17 100% 100% 93% 100% 27 93% 100% 93% 86% * * * *
Western Piedmont CC * * * * * * * * * * * * 24 100% 93% 96% 76% * * * *
Wilkes CC * * * * * * * * * * * * 27 63% 90% 90% 92% * * * *
Wilson CC * * * * * * * * 16 100% 100% 100% 100% 39 97% 88% 84% 94% * * * *
*Less than 5
** July-June Timeframe for '14,'13,12
Color shading is to assist
college efforts to identify
subgroup strengths and
weaknesses
PHYSICAL THERAPIST ASST.
% PASSING% PASSING
DENTAL HYGIENE** VET. MED. TECH.PRACTICAL NURSING REGISTERED NURSING
% PASSING% PASSING % PASSING
36

THIS PAGE INTENTIONALLY LEFT “BLANK”
37