performance measurement review interim evaluation report
TRANSCRIPT

MPR Reference No.: 8112-104
PERFORMANCE MEASUREMENT REVIEW
INTERIM EVALUATION REPORT
December 5, 1994
Authors:
William S. BordenWalter S. Corson
Submitted to:
Employment SecurityState of New Hampshire32 South Main StreetConcord, NH 03302-4857
Project Officer:William Lenfest
Submitted by:
Mathematica Policy Research, Inc.P.O. Box 2393Princeton, N.J. 08543-2393(609) 799-3535
Project Director:William S. Borden

iii
CONTENTS
Chapter Page
EXECUTIVE SUMMARY . . . . . . . . . . . . . . . . . . . . . . . . . . . . . . . . . . . . . . . . . . . . . . . . . xi
I INTRODUCTION . . . . . . . . . . . . . . . . . . . . . . . . . . . . . . . . . . . . . . . . . . . . . . . . . . . . . . . . 1
A. PMR EVALUATION CRITERIA . . . . . . . . . . . . . . . . . . . . . . . . . . . . . . . . . . . . . . . . 2
B. PERFORMANCE STANDARDS . . . . . . . . . . . . . . . . . . . . . . . . . . . . . . . . . . . . . . . 3
1. State Control over Performance . . . . . . . . . . . . . . . . . . . . . . . . . . . . . . . . . . . . . . 32. Analysis of Long Time Lapse Cases to Detect
Performance Problems . . . . . . . . . . . . . . . . . . . . . . . . . . . . . . . . . . . . . . . . . . . . . . 5
C. NATIONAL IMPLEMENTATION PLANNING ISSUES . . . . . . . . . . . . . . . . . . . . 6
1. Overlap of PMR and Required Reports Data . . . . . . . . . . . . . . . . . . . . . . . . . . . . 72. Implementation Planning and Costs and State Systems
Development Capabilities . . . . . . . . . . . . . . . . . . . . . . . . . . . . . . . . . . . . . . . . . . . 8
II PAYMENTS TIME LAPSE . . . . . . . . . . . . . . . . . . . . . . . . . . . . . . . . . . . . . . . . . . . . . . . . 11
A. TIME LAPSE END DATE . . . . . . . . . . . . . . . . . . . . . . . . . . . . . . . . . . . . . . . . . . . . . 12
B. PAYMENTS TIME LAPSE PERFORMANCEAND PMR DESIGN . . . . . . . . . . . . . . . . . . . . . . . . . . . . . . . . . . . . . . . . . . . . . . . . . . . 13
1. First Payment Time Lapse . . . . . . . . . . . . . . . . . . . . . . . . . . . . . . . . . . . . . . . . . . . 132. Partial First Payment Time Lapse . . . . . . . . . . . . . . . . . . . . . . . . . . . . . . . . . . . . . 213. Transitional First Payment Time Lapse . . . . . . . . . . . . . . . . . . . . . . . . . . . . . . . . 22
C. COSTS AND BENEFITS OF MAINTAININGSUBMEASURE DATA . . . . . . . . . . . . . . . . . . . . . . . . . . . . . . . . . . . . . . . . . . . . . . . . 22
D. SESA CONTROL AND PERFORMANCE ISSUES ASSOCIATEDWITH INTERSTATE, CWC, ANDUCFE FIRST PAYMENTS . . . . . . . . . . . . . . . . . . . . . . . . . . . . . . . . . . . . . . . . . . . . . 23
E. CONTINUED PAYMENTS TIME LAPSE . . . . . . . . . . . . . . . . . . . . . . . . . . . . . . . . 25

CONTENTS (continued)
Chapter Page
iv
III ADJUDICATION TIME LAPSE . . . . . . . . . . . . . . . . . . . . . . . . . . . . . . . . . . . . . . . . . . . . 31
A. COMPOSITION OF THE ADJUDICATION POPULATION . . . . . . . . . . . . . . . . . 36
B. DETERMINING THE FIRST WEEK AFFECTED BY THEADJUDICATION . . . . . . . . . . . . . . . . . . . . . . . . . . . . . . . . . . . . . . . . . . . . . . . . . . . . 39
C. MULTICLAIMANT ADJUDICATIONS . . . . . . . . . . . . . . . . . . . . . . . . . . . . . . . . . . 41
IV REDETERMINATION TIME LAPSE . . . . . . . . . . . . . . . . . . . . . . . . . . . . . . . . . . . . . . . . 43
V APPEALS TIME LAPSE . . . . . . . . . . . . . . . . . . . . . . . . . . . . . . . . . . . . . . . . . . . . . . . . . . 47
VI ADJUDICATION QUALITY . . . . . . . . . . . . . . . . . . . . . . . . . . . . . . . . . . . . . . . . . . . . . . . 57
A. PMR QUARTERLY QUALITY REVIEWS . . . . . . . . . . . . . . . . . . . . . . . . . . . . . . . 57
B. ADJUDICATION QUALITY INSTRUMENT . . . . . . . . . . . . . . . . . . . . . . . . . . . . . 66
VII APPEALS QUALITY . . . . . . . . . . . . . . . . . . . . . . . . . . . . . . . . . . . . . . . . . . . . . . . . . . . . . 71
VIII IMPLEMENTATION MEASURES . . . . . . . . . . . . . . . . . . . . . . . . . . . . . . . . . . . . . . . . . . 79
IX CWC MEASURES . . . . . . . . . . . . . . . . . . . . . . . . . . . . . . . . . . . . . . . . . . . . . . . . . . . . . . . 89
A. WAGE TRANSFER TIME LAPSE AND QUALITY . . . . . . . . . . . . . . . . . . . . . . . . 89
B. BILLING TIME LAPSE AND QUALITY . . . . . . . . . . . . . . . . . . . . . . . . . . . . . . . . 101
C. CWC REIMBURSEMENT TIME LAPSE AND QUALITY . . . . . . . . . . . . . . . . . 102

v
TABLES
Table Page
II.1 FIRST PAYMENTS: MEAN TIME LAPSE . . . . . . . . . . . . . . . . . . . . . . . . . . . . . . . 15
II.2 CONTINUED WEEKS PAYMENTS: MEAN TIME LAPSE . . . . . . . . . . . . . . . . . 27
III.1 ADJUDICATIONS: MEAN TIME LAPSE . . . . . . . . . . . . . . . . . . . . . . . . . . . . . . . . 33
IV.1 ADJUDICATIONS REDETERMINATIONS: MEAN TIME LAPSE . . . . . . . . . . . 45
V.1 APPEALS: MEAN TIME LAPSE . . . . . . . . . . . . . . . . . . . . . . . . . . . . . . . . . . . . . . . 50
VI.1 PERCENT FAILING ADJUDICATION QUALITY QUESTIONS:ALL STATES . . . . . . . . . . . . . . . . . . . . . . . . . . . . . . . . . . . . . . . . . . . . . . . . . . . . . . . . 61
VI.2 PERCENT IN WHICH NATIONAL REVIEW YIELDS A DIFFERENT ANSWERTHAN STATE REVIEW FORADJUDICATION QUALITY QUESTIONS:ALL STATES . . . . . . . . . . . . . . . . . . . . . . . . . . . . . . . . . . . . . . . . . . . . . . . . . . . . . . . . 63
VI.3 PERCENT IN WHICH REGIONAL REVIEW YIELDS A DIFFERENT ANSWERTHAN STATE REVIEW FORADJUDICATION QUALITY QUESTIONS:ALL STATES . . . . . . . . . . . . . . . . . . . . . . . . . . . . . . . . . . . . . . . . . . . . . . . . . . . . . . . . 64
VII.1 LOWER AUTHORITY APPEALS . . . . . . . . . . . . . . . . . . . . . . . . . . . . . . . . . . . . . . . 73
VIII.1 ADJUDICATION IMPLEMENTATION TIME LAPSE (Percent) . . . . . . . . . . . . . . 82
VIII.2 LOWER AUTHORITY APPEALS DECISION IMPLEMENTATIONTIME LAPSE (Percent) . . . . . . . . . . . . . . . . . . . . . . . . . . . . . . . . . . . . . . . . . . . . . . . . 85
IX.1 CWC TIME LAPSE . . . . . . . . . . . . . . . . . . . . . . . . . . . . . . . . . . . . . . . . . . . . . . . . . . . 94
IX.2 CWC QUALITY MEASURES . . . . . . . . . . . . . . . . . . . . . . . . . . . . . . . . . . . . . . . . . . 98

vii
FIGURES
Figure Page
II.1 FIRST PAYMENT TIME LAPSE--INITIAL CLAIMS . . . . . . . . . . . . . . . . . . . . . . . . . . . 14
II.2 TOTAL INTRA-STATE FIRST PAYMENT TIME LAPSEPERCENT PAID WITHIN 14 OR 21 DAYS . . . . . . . . . . . . . . . . . . . . . . . . . . . . . . . . . . . . 17
II.3 TOTAL INTRA-STATE FIRST PAYMENT TIME LAPSEPERCENT PAID WITHIN 35 DAYS . . . . . . . . . . . . . . . . . . . . . . . . . . . . . . . . . . . . . . . . . 18
II.4 TOTAL INTER-STATE FIRST PAYMENT TIME LAPSEPERCENT PAID WITHIN 14 OR 21 DAYS . . . . . . . . . . . . . . . . . . . . . . . . . . . . . . . . . . . . 19
II.5 TOTAL INTER-STATE FIRST PAYMENT TIME LAPSEPERCENT PAID WITHIN 35 DAYS . . . . . . . . . . . . . . . . . . . . . . . . . . . . . . . . . . . . . . . . . 20
II.6 CONTINUED WEEKS PAYMENT TIME LAPSE . . . . . . . . . . . . . . . . . . . . . . . . . . . . . . 26
II.7 TOTAL INTRA-STATE CONTINUED WEEKS PAYMENTSTIME LAPSE -- PERCENT PAID WITHIN 14 DAYS . . . . . . . . . . . . . . . . . . . . . . . . . . . 29
II.8 TOTAL INTER-STATE CONTINUED WEEKS PAYMENTSTIME LAPSE -- PERCENT PAID WITHIN 14 DAYS . . . . . . . . . . . . . . . . . . . . . . . . . . . 30
III.1 ADJUDICATION TIME LAPSE . . . . . . . . . . . . . . . . . . . . . . . . . . . . . . . . . . . . . . . . . . . . . 32
III.2 TOTAL INTRA-STATE ADJUDICATIONS TIME LAPSE:SEPARATION -- PERCENT WITHIN 14 DAYS . . . . . . . . . . . . . . . . . . . . . . . . . . . . . . . . 34
III.3 TOTAL INTRA-STATE ADJUDICATIONS TIME LAPSE:NON-SEPARATION -- PERCENT WITHIN 14 DAYS . . . . . . . . . . . . . . . . . . . . . . . . . . 35
IV.1 ADJUDICATION REDETERMINATION TIME LAPSE . . . . . . . . . . . . . . . . . . . . . . . . . 44
V.1 LOWER AUTHORITY APPEALS TIME LAPSE . . . . . . . . . . . . . . . . . . . . . . . . . . . . . . . 48
V.2 HIGHER AUTHORITY APPEALS TIME LAPSE . . . . . . . . . . . . . . . . . . . . . . . . . . . . . . . 49
V.3 TOTAL INTRA-STATE LOWER AUTHORITY APPEALSTIME LAPSE: SEPARATION AND NON-SEPARATION COMBINEDPERCENT WITHIN 30 DAYS . . . . . . . . . . . . . . . . . . . . . . . . . . . . . . . . . . . . . . . . . . . . . . . 52
V.4 TOTAL INTRA-STATE HIGHER AUTHORITY APPEALSTIME LAPSE: SEPARATION AND NON-SEPARATION COMBINEDPERCENT WITHIN 45 DAYS . . . . . . . . . . . . . . . . . . . . . . . . . . . . . . . . . . . . . . . . . . . . . . . 53
VI.1 ADJUDICATION QUALITY . . . . . . . . . . . . . . . . . . . . . . . . . . . . . . . . . . . . . . . . . . . . . . . . 58
VI.2 ADJUDICATION QUALITY MEASURESEPARATION SAMPLE -- PERCENT PASSING . . . . . . . . . . . . . . . . . . . . . . . . . . . . . . . 59
VI.3 ADJUDICATION QUALITY MEASURENON-SEPARATION SAMPLE -- PERCENT PASSING . . . . . . . . . . . . . . . . . . . . . . . . . . 60
VII.1 LOWER AUTHORITY APPEALS QUALITY . . . . . . . . . . . . . . . . . . . . . . . . . . . . . . . . . . 72
VII.2 LOWER AUTHORITY APPEALS QUALITY MEASURE

FIGURES (continued)
Figure Page
viii
PERCENT PASSING . . . . . . . . . . . . . . . . . . . . . . . . . . . . . . . . . . . . . . . . . . . . . . . . . . . . . . 74
VII.3 LOWER AUTHORITY APPEALS QUALITY MEASURE--MEAN SCORE . . . . . . . . . . . . . . . . . . . . . . . . . . . . . . . . . . . . . . . . . . . . . . . . . . . . . . . . . . . 75
VIII.1 ADJUDICATION IMPLEMENTATION TIME LAPSE . . . . . . . . . . . . . . . . . . . . . . . . . . 80
VIII.2 LOWER AUTHORITY DECISION IMPLEMENTATION TIMELAPSE FOR REVERSALS OR MODIFICATIONS FROM DENYTO ALLOW . . . . . . . . . . . . . . . . . . . . . . . . . . . . . . . . . . . . . . . . . . . . . . . . . . . . . . . . . . . . . . 81
VIII.3 ADJUDICATION IMPLEMENTATION TIME LAPSE:SEPARATION SAMPLE -- PERCENT WITHIN 4 DAYS . . . . . . . . . . . . . . . . . . . . . . . . 83
VIII.4 ADJUDICATION IMPLEMENTATION TIME LAPSE:NON-SEPARATION SAMPLE -- PERCENT WITHIN 4 DAYS . . . . . . . . . . . . . . . . . . . 84
VIII.5 LOWER AUTHORITY APPEALS IMPLEMENTATION TIMELAPSE -- PERCENT WITHIN 4 DAYS . . . . . . . . . . . . . . . . . . . . . . . . . . . . . . . . . . . . . . . 86
IX.1 COMBINED WAGE CLAIMS - WAGE TRANSFER TIME LAPSE . . . . . . . . . . . . . . . . 90
IX.2 COMBINED WAGE CLAIMS - BILLING TIME LAPSE . . . . . . . . . . . . . . . . . . . . . . . . . 91
IX.3 COMBINED WAGE CLAIMS - REIMBURSEMENT TIME LAPSE . . . . . . . . . . . . . . . 92
IX.4 COMBINED WAGE CLAIMSWAGE TRANSFER QUALITYBILLING QUALITYREIMBURSEMENT QUALITY . . . . . . . . . . . . . . . . . . . . . . . . . . . . . . . . . . . . . . . . . 93
IX.5 TOTAL COMBINED WAGE CLAIMS TIME LAPSE:WAGE TRANSFER -- PERCENT WITHIN 6 DAYS . . . . . . . . . . . . . . . . . . . . . . . . . . . . 95

FIGURES (continued)
Figure Page
ix
IX.6 TOTAL COMBINED WAGE CLAIMS TIME LAPSE:BILLINGS -- PERCENT WITHIN 45 DAYS . . . . . . . . . . . . . . . . . . . . . . . . . . . . . . . . . . . 96
IX.7 TOTAL COMBINED WAGE CLAIMS TIME LAPSE:REIMBURSEMENTS -- PERCENT WITHIN 45 DAYS . . . . . . . . . . . . . . . . . . . . . . . . . . 97

1Wisconsin data includes September 1994.
xi
EXECUTIVE SUMMARY
The Performance Measurement Review (PMR) project is a comprehensive performance measurementsystem intended to evaluate State Employment Security Agency (SESA) performance across severaldimensions. In order to determine the feasibility and potential benefits of national implementation of PMR, theUnemployment Insurance Service (UIS) conducted a 15-month field test of the measures in six States(California, Kansas, Missouri, Illinois, New Hampshire, and Wisconsin). Data collection commenced withApril to June 1993 claims activity for quarterly measures and with June 1993 claims activity for monthlymeasures. This report analyzes data through August 1994, the end of the Field Test1. The project is beingevaluated by Mathematica Policy Research, Inc. (MPR). In addition to analyzing PMR data, activity under theproject has included extensive data validation and presentation of the PMR findings to State executive staff fortheir input into the PMR design process.
We have found that the PMR measures are feasible to implement and are a far superior source ofinformation about SESA performance than data provided by the current Quality Appraisal (QA) program orcurrent Unemployment Insurance Required Reports (UIRRs). The degree of improvement over existingmeasures varies greatly. For some measures, such as first payment promptness, there is little difference fromthe existing measure; the PMR measures provide more detail, providing some oversight and management valuewith little effect on implementation cost. For other measures, such as adjudication timeliness, the PMR measureis far superior to the existing measure. The PMR measures successfully fill major gaps in the currentperformance assessment system and give much more timely feedback to SESA management about performanceproblems. This enables managers to correct problems much faster than under the previous system.
Several outstanding definitional and implementation issues must be resolved prior to nationalimplementation. The most important issues concern the adjudication time lapse and quality measures. First,PMR has expanded the definition of adjudications to be analyzed from the traditional "nonmonetary" definitionused in workload. This has caused States to reexamine their determination issue types to decide how to conformto the expanded PMR definition. Second, some States have had problems producing a valid week-ending dateof the first week affected by the adjudication (or redetermination). The CWC measures are being re-evaluated.National implementation would be greatly simplified if States used common terminology and data definitions.Without such uniformity, it will be necessary to provide technical assistance to States in adapting the PMRrequirements to their systems.
Our interim findings and recommendations for each service area are:
` Payments. The measures should be implemented as currently designed, with the possibleexception of the separate report on transitional first payments, which has little management oroversight value from a federal perspective, but may have value for some States. The CWC,UCFE, partial and workshare payments breakouts are especially valuable for detectingperformance problems.
` Adjudications Measures. The adjudication time lapse measure is very valuable. It is importantto include all issues, but this requires an analysis of the consistency of definitions between States.Capture of valid dates for the first affected week also poses some implementation problems. Mostfield test States do not have many redeterminations, but this measure should be retained in its currentform. There are some problems obtaining reasonably consistent results with the adjudicationquality assessment. The adjudication implementation time lapse measure has limited value. ForStates with large workshare populations, separate tracking of workshare adjudications may bevaluable.
` Appeals Measures. The PMR appeals time lapse and quality assessment measures are verysimilar to the existing measures. There are some implementation problems because in some States

xii
the appeals data is not integrated with the benefits files. For this reason, the appealsimplementation time lapse measure is valuable.
` CWC Measures. Evaluation of these measures has raised useful alternative approaches, includingthe development of a single, comprehensive CWC quality assessment and revisions to thetimeliness measures. These alternatives should be pursued and incorporated into the nationalimplementation plan.

1
I. INTRODUCTION
The Performance Measurement Review (PMR) project is a comprehensive performance measurement
system intended to evaluate State Employment Security Agency (SESA) performance across several
dimensions. In order to determine the feasibility and potential benefits of national implementation of PMR, the
Unemployment Insurance Service (UIS) conducted a 15 month field test of the measures in six States
(California, Kansas, Missouri, Illinois, New Hampshire, and Wisconsin). Data collection commenced with
April to June 1993 claims activity for quarterly measures and with June 1993 claims activity for monthly
measures. The field test ran through August 1994.
The project is being evaluated by Mathematica Policy Research, Inc., (MPR). In addition to analysis of
PMR data, activity under the project has included extensive data validation and the presentation of the PMR
findings to state executive staff, who were then asked for their input into the PMR design process. State
executive staff were generally receptive to the PMR measures as currently designed. These measures are
viewed as more reliable than the existing Quality Appraisal (QA) measures and, because most are produced
monthly, they provide much more timely management feedback. The only disagreement with the measures
concerns the issue of SESA control; the view was expressed that establishment of performance standards for
activities outside of SESA control is inappropriate.
The mid-test assessment meeting was held from May 25-27, 1994. The meeting agenda was organized
around a list of issues raised by the States during the first part of the Field Test. The objective was to reach
consensus on the resolution of these issues in preparation for national implementation. Included in this report
are the major issues that were discussed, as well as the points of consensus that were reached at the meeting.
This report discusses the field test findings to date for each group of PMR measures in terms of
implementation feasibility and value in detecting performance problems. A post test assessment meeting will
be held in February 1995, comprising the six Field Test States, the Federal Steering Committee, and the State
Expert Panel. MPR will produce a draft final PMR evaluation report in January and the final evaluation report
in May 1995. In this chapter, we discuss several topics pertaining to the evaluation of PMR, to benchmarking
and data analysis, and to national implementation planning.
A. PMR EVALUATION CRITERIA
The criteria established by the UIS for the PMR measures are:

2
` Criticality. Fulfilling the Secretary of Labor's essential legal oversight responsibilities
` Management-Oriented. Capable of providing timely detection of performance problems that canserve as the basis for management action
` Operationally Feasible. Capable of operating within cost and resource constraints, obtainable asa byproduct of operations in the SESAs
` Customer-Oriented. Defining and measuring quality service to claimants and employers
` Outcome Focused. Ability for poor performance to trigger remedial action
` Quantitatively Based. Objective and free from discretionary judgment as much as possible
` Statistically Valid. Employing sampling methods that provide confidence in the results
The MPR evaluation also subjects the PMR measures to two additional, but related, criteria:
1. Does the measure (or submeasure for program type) show performance variation between States (orbetween programs)? For example, if all States scored about the same or if all programs within ameasure showed the same performance, the measure may have little or no benefits for management oroversight.
2. Does the cost of implementation and maintenance outweigh the management and oversightbenefits?
The PMR measures generally meet all of these criteria and improve UIS capabilities when compared to
QA. Almost all of the measures have oversight value and management value, with the possible exception of
the Combined Wage Claim (CWC) measures, as currently constituted.
B. PERFORMANCE STANDARDS
Two factors are important in discussing performance standards and analysis of performance problems.
First, the process of setting standards must be guided by an understanding of where States can and cannot
directly control their own performance. Second, it may be appropriate to analyze the longest time lapse cases
to detect performance problems.
1. State Control over Performance
PMR is intended both as a management tool for States and an oversight tool for the UIS. Most PMR
measures jointly address the goals of SESA management improvement and the Secretary of Labor's oversight
responsibilities. For some measures (or submeasures), the individual SESA does not have complete
management control over the activities being measured. For some measures (like CWC and interstate

3
payments), the State's performance depends partly on the actions of other States. For other measures, the State's
performance depends on claimant and employer actions.
A basic philosophical question faced by PMR is whether to measure only activities under SESA control
or to measure from the perspective of "payment when due" to claimants. The "payment when due" approach
focuses solely on the service to claimants entitled to benefits and not on administrative, technical, or other
obstacles that may stand in the way of prompt payment. It measures the performance of the entire
Unemployment Insurance (UI) system, consisting of multiple service areas within States (claims taking,
adjudications, appeals) and multiple States for CWC and interstate claims. This approach is the most
appropriate from a federal oversight perspective. The "SESA control" approach is process oriented, focuses
on specific SESA administrative practices, and is of more direct use for State management than the "payment
when due" approach. PMR cannot simultaneously satisfy these two approaches.
"SESA control" advocates would argue that if the ultimate outcome of each measure that detects
unacceptable performance is federally imposed remedial action (for example, a corrective action plan),
measures that include activities outside of SESA control should be eliminated. This approach, however, would
violate the PMR objective of ensuring that the Secretary of Labor's oversight responsibilities are fulfilled. The
appropriate answer to those States is that the PMR system must include areas outside direct SESA control, but
that the design of performance standards and the triggering of remedial management action must be based on
a sound understanding of which measures or submeasures are under SESA (or State legislative) control and
which are not.
SESA control is an issue in several areas within PMR. One affected submeasure is interstate first payments
time lapse. If a paying State does not receive the IB-2 for the claimant within a reasonable period after the
claim is filed, it could be argued that the SESA should not be subjected to sanctions for poor interstate first
payment time lapse. The equivalent QA measure consists of an analysis of delayed first payments in the
following programs: UI intrastate, UI interstate, UCFE, UCX, and intrastate CWCs. For each of the programs,
random samples are selected from the population of delayed payments and the reasons for the delays are
documented and divided into two categories, controllable or uncontrollable. Examples of controllable delays
include keypunch error, backdating due to administrative error, computer payment schedule, and monetary
determination. Uncontrollable delays include appeal reversal, claimant delay, employer reporting error, and
delayed receipt of transferred wages (CWC).

4
The QA approach directly addresses the SESA management control issue. PMR makes no formal
provision for this analysis, but one of the first outcomes of research into the causes of delays may be a State-
drawn sample of delayed cases and an analysis of controllable and uncontrollable cases. Where the State found
that a high percentage were controllable, remedial action would address the deficient area or process.
A second measure affected by this issue is redetermination promptness. If new facts come to light as a
result of a late employer protest or another circumstance, should the SESA be sanctioned because PMR
measures the time lapse from the first week affected to the redetermination notice date?
A third area is CWC reimbursement promptness. In this area States are currently required to come to
agreement on all claimants on a bill prior to taking credit for paying the bill. Finally, Higher Authority Appeals
Boards are appointed by the governor and do not operate under SESA control. A fourth area with
limited SESA control is work-share payments. Under arrangements between the State and the employer, the
employer often has up to 30 days to provide the wage information needed to pay benefits. As long as these
payments are tracked separately, there is no problem with their biasing overall payment promptness.
The UIS will have to determine what action should be taken when States do not meet PMR standards.
MPR's evaluation design emphasized the role of the field test in detecting performance problems and analyzing
the remedial action taken by States. We have found, partly because PMR is not an official program and does
not contain any formal benchmarks or remedial management actions, that not all of the Field Test States have
acted on problems detected by PMR to change their administrative practices or take other remedial actions.
2. Analysis of Long Time Lapse Cases to Detect Performance Problems
The UIS has appropriately set performance standards to focus on the percentage of claimants who are
serviced in a timely manner rather than on those who are not serviced in a timely manner. It is a common-sense
approach to specify that 87 percent of first payments must be made within 14 or 21 days and that 93 percent
must be made within 35 days, because measurements should focus on the majority of customers (93 percent
is a very high percentage of the population). At least a small percentage of cases in every service delivery area
will always be slow for reasons both within and outside SESA control. Thus, although we agree with the
current approach, it is fair to ask if the claimants who are not serviced quickly should be ignored. The bottom
one percent of three percent of cases represent the worst examples of "payment when due" and perhaps warrant
their own separate analysis. If the purpose of PMR is to detect performance problems, this is the most obvious
place to look.

5
One approach to detecting systematic problems would be for States to turn the current measurement
approach around and measure the percentage greater than 500, 400, 300, 200, and 100 days. The most efficient
means of focusing on long time lapse areas would be to look at long-delayed payments. We would presumably
find the worst appeals and adjudications time lapse problems here. If a claimant is denied after a long series
of adjudications and appeals, we can assume that no payment was due. If the decision after a long series of
adjudications and appeals is to allow, then payment was due. By looking at payments, we only get the allowed
portion and avoid the need to look at the denied portion. If a State did have a higher percentage in these very
high time lapse categories, a sample of such cases could be pulled to determine if a systematic problem existed.
MPR will conduct an analysis to determine if States have roughly the same proportion of payments in the last
time lapse cell (greater than 70 days), which would indicate that there may be no systematic problem in
individual States.
This approach is similar to the approach of the Lower Authority Appeals Case Aging project. This project
analyzes cases that have exceeded the time lapse standards, because of the concern that States have no further
incentive to process them in a timely manner because of the current standards.
C. NATIONAL IMPLEMENTATION PLANNING ISSUES
An implication of national PMR implementation is that certain UI Required Reports (UIRRs) will have
to be revised to avoid duplication of effort. A purpose of the field test is to evaluate the process by which States
revise their federal reporting software to develop PMR reports. This evaluation can be used to make PMR
implementation easier for the other 47 SESAs. We discuss both of these topics in the following sections.
1. Overlap of PMR and Required Reports Data
An important issue for the final configuration of the PMR reporting tables concerns the overlap with the
current UIRR series. When PMR is implemented, the UIS would be collecting certain data twice, and in some
cases using two different definitions, if there is no change to UIRRs. This redundancy must be eliminated by
redesigning the complete benefits reporting system. PMR as currently designed cannot replace UIRRs because
numerous nonperformance-related data elements used for economic and statistical purposes (for example, initial
claims, additional claims) appear on UIRRs and not on PMR. Redundant areas include first payments time
lapse from the 5159, Lower Authority Appeals time lapse from the 5130, and numerous elements where there
are simply counts on the UIRRs (continued claims payments, etc.) and time lapse (performance) data on the
PMR reports.

6
The overall system can be streamlined by creating an integrated report design with performance and
nonperformance data commingled and organized by service delivery area (as with the current UIRR series).
This design would yield much expanded 5159, 207, 227, 5130, and 586 reports covering claims and payments,
adjudications, overpayments, appeals, and CWC claims. Adding PMR performance data into the UIRR series
design is the optimal approach because it would reduce the number of administrative steps involved in
processing. It may not be practical, however, to treat the entire body of benefits data as a single report, since
at least some data are not generated at the central mainframe. Five separate reports would also provide some
flexibility. States would not have to retransmit the entire report when changes were needed. The UIS would
incur a cost in rewriting the Unemployment Insurance Data Base (UIDB), but this would mainly involve editing
the required reports record layouts to eliminate performance data and then merging the UIDB and PMR record
structures.
2. Implementation Planning and Costs and State Systems Development Capabilities
A key objective of the PMR field test is to test the feasibility of States developing the software
specifications and software necessary to develop the data required for PMR reports. Because each State
maintains a different database structure, different definitions, and different data names, it is not possible for the
national office to write detailed software specifications for each State. The field test has shown that some
federal technical assistance is required early in the development phase of PMR to help States interpret the
specifications.
MPR has not concluded its detailed cost analysis, but the general areas of cost and implementation risk
are well known through detailed analysis of PMR software development. The biggest implementation costs
are those for software development and quality review labor. Monthly system maintenance by State Automated
Data Processing (ADP) staff is not a significant cost. Quality review costs will be consistent across States
(mean review time and staff costs are similar by State--although some States review more cases). PMR
software development costs and burdens will vary greatly by State, making this the most significant cost to
consider.
Ironically, PMR may have a salutary affect on States without sophisticated or elegant systems. Much of
the existing UIRR software is poorly documented, old, and possibly inaccurate. PMR forces States to
reevaluate their UI reporting system and many have chosen to use PMR development burdens as an opportunity
to rewrite their federal reporting software. California developed the PMR software from scratch, and now has
much better understanding of and confidence in its reporting system. Kansas scrapped older programs and

7
rewrote PMR because it needed to update its approach. Missouri and Wisconsin were able to modify their
current software without great expense or burden. Illinois was able to write new software very quickly, but
needs to develop more systematic internal testing procedures to reduce data validity problems.
Validation of PMR data is another burden on State ADP and program staff. Validation requires States to
not only program mainframe extracts and PMR report generation but also to design extract listings and
frequency distributions for validation. As with development, the burden of validation varies with the
sophistication of the software environment and the availability of programming expertise. Some States have
been slow to develop validation software and California's database is so large that running detailed frequency
distributions was rejected as too expensive.
PMR would benefit from the development of a detailed implementation plan. Hopefully, the ADP systems
and administrative practices of the six field test States represent the situations in the other 47 States, such that
a common set of implementation design approaches can be documented and applied to the other SESAs as
appropriate. Such a well-planned and systematic effort is warranted to avoid some of the problems experienced
during the field test, when problems were dealt with on an individual basis. New Hampshire recently converted
to the GUIDE software to administer their benefit program. MPR will continue to examine the New Hampshire
GUIDE system carefully, to determine how PMR should be adapted to the many other SESAs using the GUIDE
software.

11
II. PAYMENTS TIME LAPSE
PMR expands the amount of data reported on payments time lapse considerably by adding the following
measures to the current Unemployment Insurance Required Reports (UIRRs) payments data and expanding the
time lapse intervals:
` Continued Weeks Payments for all programs
` Time lapse for Combined Wage Claims (CWC) payments of all kinds
` Partial first and continued payments
` First Payments for Transitional Claims
` Work Share First and Continued Weeks Payments
Despite the additional data required, the payments measures have posed few implementation problems.
The most significant implementation issue concerns accurate capture and justification of the programming costs
of CWC payments. States have not had a problem capturing partial payments or work share. Transitional
payments posed a definitional problem in California, which has been resolved, and were not captured by New
Hampshire under its old system. The other program categories, UCX, UCFE, and interstate have been retained
from the current 5159 report. The transitional claims submeasure may have little value. The partial claims table
has some value and the work share report is important for some States.
PMR does not contain a measure to evaluate the quality of payments. During the PMR design phase it was
decided that the Benefits Quality Control (BQC) program adequately addresses the issue of the quality of claims
(and therefore of payments). Limiting PMR to time lapse measures without addressing quality, therefore, is
justified. The BQC data could always be added into an integrated reporting system (assuming that PMR and
UIRRs have already been combined). Examining the quality assessment usefulness of BQC may help to
determine whether it is an optimal complement to the PMR time lapse measures.
This chapter discusses the most significant implementation problem: capturing the "mailed" or "system"
date as the time lapse end date. It then analyzes payments time lapse performance and the current PMR design
for each payment type. Other topics discussed include costs and benefits of maintaining submeasure data, State
Employment Security Agency (SESA) issues, and time lapse of continued payments.
A. TIME LAPSE END DATE

12
A key implementation problem relating to all payments is how to measure when the payment was made.
The two basic choices are: (1) the date the check was printed and (2) the date the check was "mailed."
Feasibility concerns are more important than the substantive merits of authorization versus mailed date. The
approach that is more feasible to implement uniformly across States should be adopted.
The field test results do not indicate that either approach is superior in feasibility. This is because State
systems and practices vary greatly. Missouri and Kansas carry accurate mail dates but no system dates. Other
States carry system dates, (the date the check is printed), but no mail dates. We recommend that the
Unemployment Insurance Service (UIS) pick the substantively superior date (mail date seems to be a superior
method of measuring payments) and that each State develop a customized and valid approach to creating such
a date. The cost of implementation and validation would be roughly the same for each approach. States would
not have to change their data structures, because the PMR report software could make any recalculations
necessary. There is no difference between Illinois creating a formula to adjust its current system date to a
mailed date and Missouri creating a formula to adjust its mailed date to a system date. Illinois would increment
its system date by one day for all cases because Illinois always mails the next day--it generates checks on
Sunday night, not Friday night, and does not generate checks on the eve of postal holidays. Missouri would
subtract one, three, or four days from its mail date to create a system date (depending on whether the mail date
was Tuesday through Saturday, Monday, or the day after a holiday).
State Field Test Method
California Authorization Date
Illinois System Date
Kansas Mailed Date
Missouri Mailed Date
New Hampshire System Date
Wisconsin Mailed Date
It was agreed at the midtest meeting that the mailed date should be used. States must provide
documentation addressing their payment reporting convention, including their best estimation of when the check
is actually mailed. This approach enables States to continue utilizing their current data structures, while
ensuring consistency between States. It was further discussed that the time lapse data would be regularly
validated to ensure that the State was adhering to the parameter for time lapse which they had documented.

1The monthly reports from each State are used as the unit of analysis throughout ourdiscussion of the timeliness measures.
13
B. PAYMENTS TIME LAPSE PERFORMANCE AND PMR DESIGN
1. First Payment Time Lapse
PMR has expanded the First Payment Time Lapse measure to include more categories than the current
measure (Figure II.1). On average, 85 percent of the first payments paid in each month in each State are paid
within 14 days and 97 percent are paid within 35 days (Table II.1).1 Not all types of first payments, however,
are paid in as timely a fashion. As shown in the table, interstate

FIGURE II.1
PERFORMANCE MEASUREMENT REVIEW(First Payment Time Lapse--Initial Claims)
Measure First Payment Time Lapse--Initial Claims
Definition The length of time from the end of the first (earliest) compensable week in thebenefit year to the date the payment is issued
Includes all payments: partial, total, or transitionalExcludes special claims programs such as EB, EUC, DUA, and TRAExcludes work-share claimsExcludes retroactive payment for compensable waiting period
Data Source Universe of first payments
ComputationStart DateEnd Date
End of first compensable weekDate check was issued
Reporting Intervals 7, 14, 21, 28, 35, 42, 49, 56, 63, 70, 70+ days
Reporting CategoriesReport separately for - Intrastate UI, UCFE, UCX, CWC
- Interstate UI, UCFE, UCX, CWC- Partial/Part-total- Transitional
Reporting Frequency Monthly
Note Work Share Time Lapse for First Payments is a separate measure.

TABLE II.1
FIRST PAYMENTS: MEAN TIME LAPSE
Intrastate Interstate
GrandTotal Total UI UCFE UCX CWC Total UI UCFE UCX CWC
First Payments (All Claims)
Percent Within:14 days 84.9 85.9 86.2 73.7 86.3 72.2 63.5 64.2 43.4 62.8 49.2 21 days 92.8 93.4 93.6 87.6 94.0 83.5 80.5 81.1 62.7 81.1 65.9 35 days 96.5 96.7 96.8 94.0 97.4 92.3 91.2 91.5 85.0 90.3 80.2
Average Sample Size 29,483 28,310 27,406 234 280 390 1,173 1,121 28 9 15
First Payments (Partial Claims)
Percent Within:14 days 79.7 80.4 80.9 66.3 79.0 71.9 54.8 54.6 34.6 42.2 56.521 days 90.4 91.0 91.3 85.2 91.1 85.1 72.9 72.8 65.6 77.8 69.135 days 96.5 96.7 96.9 95.4 96.5 93.4 88.8 88.8 79.9 86.7 84.2
Average Sample Size 2,169 2,126 2,077 9 10 30 43 41 1 0 1
First Payments (Transitional Claims)
Percent Within:14 days 92.4 92.9 93.1 84.6 77.6 82.1 73.6 73.5 34.2 33.3 65.621 days 96.8 97.1 97.2 92.7 92.4 91.4 85.4 85.3 46.8 66.7 78.135 days 99.0 99.1 99.2 98.3 96.8 97.1 94.8 94.7 76.9 66.7 93.8
Average Sample Size 3,388 3,325 3,269 28 1 27 63 62 1 0 0

2On average the 1,173 interstate first payments in the PMR States each month account forabout 4 percent of all first payments. Intrastate UCFE and intrastate CWC first payments eachaccount for about one percent of all first payments.
16
payments are considerably slower than intrastate payments--overall 64 percent of interstate payments paid each
month in each State are paid within 14 days, compared to 86 percent of intrastate first payments. Similarly,
while UCX claims are paid as quickly as regular UI claims, other claims of a special nature--UCFE and CWC--
are paid considerably more slowly than regular UI claims. The UCX program has a simplified approach to the
monetary determination (based on the military rank) which does not require a wage request. The UCFE and
CWC programs both include a wage request. Since interstate claims and intrastate claims under special
programs represent only a small fraction of total claims,2 the slowness of payments under these programs does
not affect the measure of overall performance.
This analysis suggests that one strategy for monitoring first payment time lapse would be routinely to
examine overall performance, only investigating performance for special claims when overall performance is
inadequate. However, since some States may have high fractions of special claims (for example, interstate
claims or UCFE claims) relative to the average, it may make sense to monitor time lapse for multiple-claim
types. The current strategy, as embodied in the Secretary's standards for first payments, of examining intrastate
and interstate payments separately is one such option.
Figures II.2 through II.5 use the Secretary's standards for first payments to illustrate this approach for the
PMR States. These standards require that, at a minimum, 87 percent of intrastate first payments be paid within
14 days in waiting-week States and within 21 days in nonwaiting-week States, and that 93 percent of first
payments be paid within 35 days regardless of the waiting-week status of the State. The comparable
requirements for interstate first payments are 70 percent within 14 or 21 days and 78 percent within 35 days.

17
FIGURE II.2
TOTAL INTRA-STATE FIRST PAYMENT TIME LAPSE
PERCENT PAID WITHIN 14 OR 21 DAYS

18
FIGURE II.3
TOTAL INTRA-STATEFIRST PAYMENT TIME LAPSE
PERCENT PAID WITHIN 35 DAYS

19
FIGURE II.4
TOTAL INTER-STATE FIRST PAYMENT TIME LAPSE
PERCENT PAID WITHIN 14 OR 21 DAYS

20
FIGURE II.5
TOTAL INTER-STATE FIRST PAYMENT TIME LAPSE
PERCENT PAID WITHIN 35 DAYS

21
As shown in Figures II.2 and II.3, average intrastate first-payment time lapse varies little among States.
However, most States have some months in which performance does not exceed the 14 or 21 day standard. This
suggests that the current first payment standards for intrastates provide a useful picture of State performance.
There are two current Secretary Standards for interstate first payments. The first Standard is 70 percent,
paid within 14 and 21 days. Three out of the six field test States exceeded this Standard by at least six
percentage points (Figure II.4). The second Standard is 78 percent, paid within 35 days. All six States exceeded
this Standard by at least six percentage points (Figure II.5). The growth of automation presumably has led to
a general increase in performance and thus made practical increases in benchmark standards.
2. Partial First Payment Time Lapse
Data in Table II.1 indicate that partial payments, which are included in the PMR time lapse measure but
not in the first payment time lapse data reported on the 5159, are paid slightly slower than other claims--on
average, 80 percent are paid in each State in each month within 14 days, compared to 85 percent for all first
payments. Because this difference is not large, and because partial payments represent only 7 percent of all first
payments, the overall performance measure is basically unaffected by the inclusion of partial payments.
Because there is a slight difference in partial payments promptness, the UIS may determine that separate capture
of partial payments time lapse is useful.
Because PMR defined this category to include both partial and part-total payments, it has not posed an
implementation problem. PMR uses the simple approach of "reduced by wages," which is the most feasible
to implement. In some States, no data elements distinguish between partial and part-total payments.

22
3. Transitional First Payment Time Lapse
This is a new measure. If the process for making first payments on transitional claims is identical to the
process for making first payments on initial claims, there would be no justification for measuring these
separately. There is not really a new claim. Some large States, however, may find this measure to be a valuable
monitoring tool.
First payments under transitional claims, which are both included in the total first payments table and
broken out separately as well in the PMR system, are, as one might expect, paid more quickly than first
payments in general. As shown in the Table II.1, on average, 92 percent of transitional first payments are made
within 14 days, compared to 85 percent for all first payments. This finding raises the question as to whether
it is necessary to measure time lapse separately for these payments.
C. COSTS AND BENEFITS OF MAINTAINING SUBMEASURE DATA
It would be possible to reduce the number of PMR data elements, without sacrificing vital information.
UCX, for example, could be combined with UI for time lapse reporting (because there is little difference
between them) and only a single cell count of UCX would exist for statistical reporting purposes. The most
obvious areas with small numbers of claimants are interstate CWC, UCFE, and UCX.
Several cost factors should be considered when determining the submeasures to retain in PMR. If States
download the PMR data from mainframe runs to the Sun System, there is no additional maintenance cost to
include cells with marginal performance value. If States data enter the information, the cost of system
maintenance is directly impacted by carrying excessive cells. Because States should be encouraged, if not
mandated (with assistance from national office contract technical staff) to download the data for accuracy, and
because the monthly data entry is in fact a small cost, the cost factor is not significant. Computer storage costs
are not an issue and programming is simplified by using a common format for all reports. Although the benefits
of maintaining submeasure performance data may currently be minimal, future changes in the UI system might
lead to performance problems in areas that are now stable. For example, because of military downsizing, a
change might be made to the processing of UCX claims. If the PMR system were designed with no UCX
performance component, such potential future performance problems would go undetected. As discussed in
Chapter I, consideration must be given to the merging and redesigning of the PMR and UIRR reporting formats.
When determining the costs and benefits of submeasures, small populations also present a problem. For
small States, many of the cells are zero or very small populations. For larger States, however, the submeasure

23
populations are worth measuring. Because two versions of PMR (one for small States and one for all other
States) are impractical, we recommend that the submeasures be included because they provide benefits in larger
States. Performance figures for small States can be suppressed when populations are too small to be significant.
If population size is ignored when reporting performance, small States could achieve 100 percent (or zero)
performance based on tiny populations, which cannot be compared to performance in States where the volume
is significant.
Because PMR includes so much detail on performance, it is important for the analysis reports to be clear
and informative summaries. The summary reports would lead federal oversight staff and State management
staff to problem areas, which could be further investigated by querying the detailed PMR database. Some States
already maintain more detailed reports than PMR, including local office breakouts (or adjudicator or referee
identification number). Pinpointing of performance problems thus may require even more detailed data than
are found in the PMR reports. For general oversight purposes, it is impractical and unnecessary for PMR
reports to carry more detailed data than they currently provide.
D. SESA CONTROL AND PERFORMANCE ISSUES ASSOCIATED WITH INTERSTATE, CWC,AND UCFE FIRST PAYMENTS
Field test data shows that the interstate, CWC, and UCFE payments categories exhibit performance
problems relative to intrastate UI claims and UCX claims. Performance in all three categories lies outside direct
SESA control because extra steps are required to process the claims. For UCFE payments, wage requests must
be generated to and received from federal agencies. For CWC payments, wages must be requested and received
from at least one State other than the agent State. For interstate first payments, interstate claims must first be
processed by the agent State and then forwarded to the liable State before an initial payment can be made.
These situations raise special problems when establishing performance standards and analyzing performance
problems.
It is presumably not feasible to measure the gap from the date the paying State receives the IB-1 to the date
the first payment is made, although it may be a more appropriate measurement of SESA performance. The
Quality Appraisal (QA) program evaluates interstate time lapse in steps, by breaking down the number of days
from the week-ending date to the date the IB-2 was received in the liable State, and the number of days from
the week-ending date to the date the claim was finally paid. This method, which examines the separate parts
of the system, enables the reviewer to identify the point where a problem, or extreme time lapse occurs.

24
The QA program reviews UCFE first payment delays in a similar manner. Three steps are calculated: (1)
the number of days from the date the claim was filed to the date the ES 931 was sent to the federal agency; (2)
the number of days from the date the claim was filed to the date on which the ES 931 is returned from the
federal agency; and (3) the number of days from the date the claim was filed to the date the ES 935 is taken.
The separate tracking of CWC payments has required some programming effort and is not 100 percent
accurate. The CWC status in some States is modified during the month's claims activity. When the data are
captured at the end of the month, all payments for the month are categorized based on the status of the CWC
flag at the end of the month. Payments that were CWC may be reported as non-CWC if the claim no longer
uses combined wages. More often, payments made using only State wages are reported as CWC because the
combined wages were added to the claim during the same month but after some, or all, of the payments had
been made. Some States do not have this problem. Creating a separate reporting category for CWC has been
the most difficult problem for State programmers in the payments area, but it cannot be considered a significant
problem for implementation.
E. CONTINUED PAYMENTS TIME LAPSE
This new measure is described in Figure II.6. The UIS has not monitored performance in this area because
it was assumed that there was not a problem. For most States, and for intrastate claims, this assumption is borne
out by the PMR data. There is some intrastate continued-claims promptness variation, however, and interstate
promptness indicates some delays with the Interstate Benefits (IB) system. Therefore, while not critical, this
measure has some benefits. Because few programming or operational costs are associated with continued-
payments promptness (the extract is done at the same time as first payments and uses almost identical logic),
we recommend that the measure be implemented.
Information on continued-weeks payment time lapse (Table II.2) shows that, on average, 61 percent of
continued weeks claimed in each State in each month are paid within 7 days, 91 percent are paid within 14 days,
and 96 percent are paid within 21 days. As for first payments, interstate continued claims are paid less quickly
than intrastate claims--on average 78 percent are paid within 14 days, compared to 92 percent for intrastate
claims. Similarly, partial payments are paid more slowly than the average week claimed, but the difference is
not as large as for interstate claims. Other special claims--UCFE, UCX, and CWC--are paid in about the same
amount of time as regular UI claims. Once the wages for intrastate UCFE and CWC claims have been obtained,
nothing distinguishes these claims from regular UI intrastate claims.

25
No current performance standard for continued weeks claimed exists, but these data clearly suggest that
a standard set at 14 days is probably appropriate. A standard based on a shorter time period would not account
for the presence of biweekly claims, a standard set at a longer interval may not be sensible, since so many
continued weeks claimed are paid within 14 days. It may be

FIGURE II.6
PERFORMANCE MEASUREMENT REVIEW(Continued Weeks Payment Time Lapse)
Measure Continued Weeks Payment Time Lapse
Definition The length of time from the end of the continued week claimed (whether total orpartial) to the date the check is issued
Applies to weeks paid subsequent to the first week compensated in the benefityear
Includes all payments for continued-weeks, whether total or partialExcludes special claims programs such as EB, EUC, DUA, and TRAExcludes adjusted payments (see Field Test Design, p. 65, g.)Excludes work-share (see System Design, 4.2.1)
Data Source Universe of continued weeks paid
ComputationStart DateEnd Date
End of each week for which claim was filedDate check was issued
Reporting Intervals 7, 14, 21, 28, 35, 42, 49, 56, 63, 70, 70+ days
Reporting CategoriesReport separately for - Intrastate UI, UCFE, UCX, CWC
- Interstate UI, UCFE, UCX, CWC- Partial/Part-total
Reporting Frequency Monthly
Note Work Share Time Lapse for Continued Weeks is a separate measure.

TABLE II.2
CONTINUED WEEKS PAYMENTS: MEAN TIME LAPSE
Intra-State Inter-State
GrandTotal Total UI UCFE UCX CWC Total UI UCFE UCX CWC
Continued Weeks Payments (All Claims)
Percent Within:7 days 61.3 62.5 62.7 60.9 58.0 58.6 44.2 44.6 40.6 34.4 41.914 days 91.2 92.1 92.2 90.3 89.9 88.8 78.4 78.8 73.8 72.8 74.621 days 95.7 96.1 96.1 94.6 95.6 93.9 90.0 90.2 88.6 87.1 86.2
Average Sample Size 467,392
443,946
428,872
4,139 4,573 6,362 23,446 22,051 542 441 412
Continued Weeks Payments (PartialClaims)
Percent Within:7 days 52.7 53.4 53.6 53.1 48.3 51.0 36.3 36.7 32.4 29.5 35.914 days 84.8 85.5 85.6 84.1 80.4 81.9 67.8 68.2 63.3 64.8 64.721 days 92.7 93.1 93.2 92.4 90.6 90.5 82.4 82.6 79.2 79.8 78.5
Average Sample Size 29,630 28,588 27,666 198 305 419 1,042 969 29 25 19

28
unnecessary to establish separate standards for biweekly continued-claims payments. Figures II.7 and II.8 show
time lapse of intrastate and interstate continued-weeks payments by State, using a hypothetical standard that
80 percent of such payments be paid within 14 days. While average timelapse of intrastate continued weeks
paid varies by state from a low in California to a high in Kansas, performance has exceeded a standard of 80
percent in every month so far in the field test. Moreover, the average performance among the PMR States
exceeds 87 percent. Performance for interstate continued weeks paid is worse, with average performance in
three States below a standard of 80 percent.
Interstate continued claims may incur delays when the weekly claim cards must be processed by the agent
State before going to the liable State to release the check. When continued weeks claim cards are mailed
directly to the liable State by the claimant, only the increased postal time would affect the performance (the
increased postal time for mailing the check to the out-of-State claimant would not be included since we measure
from mailed date, not received date). For some States with telephone claims systems (such as North Carolina),
there would be no difference at all between interstate and intrastate continued claims promptness as all weeks
would be claimed by telephone, eliminating the mail delay.

29
FIGURE II.7
TOTAL INTRA-STATE CONTINUED WEEKS PAYMENTS TIME LAPSE
PERCENT PAID WITHIN 14 DAYS

30
FIGURE II.8
TOTAL INTER-STATE CONTINUED WEEKS PAYMENTS TIME LAPSE
PERCENT PAID WITHIN 14 DAYS

31

31
III. ADJUDICATION TIME LAPSE
Adjudication time lapse is one of the most important measures in the Unemployment Insurance (UI)
oversight and management system. This measure is perhaps the most important contribution of PMR versus
the existing Quality Appraisal (QA) measures (see Figure III.1). The PMR measure is superior to the existing
measure because it is conducted monthly and is based on the entire population. In contrast, the QA measure
is conducted yearly and is based on a small sample that may not always be statistically valid. If the results were
valid, it would provide some oversight benefits, but the data would be too old to provide management benefits.
Information on adjudication time lapse (Table III.1) indicates that more than half of adjudications are
determined within 14 days: 58 percent of separation issues and 51 percent of non-separation issues, on average,
per State, per month. Eight-one percent of separation adjudications are determined within 21 days and 89
percent within 28 days. For non-separation adjudications, 69 percent are determined within 21 days and 77
percent within 28 days.
As might be expected, interstate adjudications are determined considerably more slowly than intrastate
adjudications. For example, 60 percent of intrastate separation adjudications are determined within 14 days,
compared to 33 percent of interstate separation adjudications. Similar differences are found for non-separation
adjudications.
Data by State (Figures III.2 and III.3) for intrastate separation and non-separation determinations show that
performance also varies considerably by State, but that, in most cases, it does not vary much within States. For
example, the data on separation adjudications, which are available for five States, show that four States issue
determinations within 14 days more than 60 percent of the time and one State on average issues determinations
within 14 days only 33 percent of the time (Figure III.2).

FIGURE III.1
PERFORMANCE MEASUREMENT REVIEW(Adjudication Time Lapse)
Measure Adjudication Time Lapse
Definition The length of time to adjudicate all issues that have the potential to adverselyaffect claimant benefit rights
Excludes special claims programs such as EB, EUC, DUA, and TRA
Data Source Universe of adjudications
ComputationStart DateEnd Date
Week-ending date of first claimed week of unemployment affected by decisionDate determination decision is issued
Reporting Intervals 7, 14, 21, 28, 35, 42, 49, 56, 63, 70, 70+ days
Reporting CategoriesReport separately for - Intrastate UI, UCFE, UCX, CWC - Separations and Nonseparations
- Interstate UI, UCFE, UCX, CWC - Separations and Nonseparations- Multi-Claimant Labor Dispute- Multi-Claimant "Other"
Reporting Frequency Monthly

TABLE III.1
ADJUDICATIONS: MEAN TIME LAPSE
Intrastate Interstate
GrandTotal Total UI UCFE UCX CWC Total UI UCFE UCX CWC
Adjudications--Separation Issues
Percent Within:14 days 57.5 59.8 60.4 42.7 55.4 51.2 33.1 33.5 18.9 24.2 25.621 days 81.2 82.8 83.2 69.9 77.8 74.5 64.1 64.8 45.0 51.0 50.928 days 89.2 90.1 90.4 81.5 85.7 84.4 78.9 79.5 58.7 68.4 65.4
Average Sample Size 13,142 12,173 11,762 121 41 249 969 923 28 6 12
Adjudications--Non-separation Issues
Percent Within:14 days 51.1 52.6 52.8 47.9 52.6 50.1 33.1 33.3 25.6 33.0 30.521 days 68.7 69.8 69.9 67.1 70.6 67.3 53.8 54.3 44.4 51.5 50.428 days 77.1 77.9 78.0 77.3 79.6 76.4 65.8 66.2 59.0 63.2 61.2
Average Sample Size 14,567 13,738 13,250 122 176 190 829 772 20 21 16

34
FIGURE III.2
TOTAL INTRA-STATE ADJUDICATIONS TIME LAPSE: SEPARATION
PERCENT WITHIN 14 DAYS

35
FIGURE III.3
TOTAL INTRA-STATE ADJUDICATIONS TIME LAPSE: NON-SEPARATION
PERCENT WITHIN 14 DAYS

36
The overall adjudication time lapse under PMR is considerably lower than that previously reported under
the QA measures. After carefully comparing the QA and PMR measures, however, we have determined that
the number of differences makes any comparison of performance outcomes invalid. The differences include:
` In general, the QA measure only examines separation issues arising with the filing of an additionalclaim. The QA first payments promptness measure examines delayed first payments and thuscaptures slow adjudications associated with initial claims.
` For issues arising during the claim series, the QA measure uses the week-ending date of the weekthe issue was detected as the time lapse start date.
` The QA measure is limited to four types of issues; PMR incorporates other issues, including someoverpayment determinations.
` The QA measure uses a very limited sample of claims and does not employ rigorous samplingmethods.
Because of the differences in statistical validity and frequency of capture, the existing QA standards cannot be
applied to PMR. MPR will present several alternative approaches to setting these performance standards, using
various combinations of number of days elapsed and percentages of cases (for example, 80 percent at 21 days
or 60 percent at 14 days). We also need to consider separate standards for interstate and intrastate adjudications.
A. COMPOSITION OF THE ADJUDICATION POPULATION
The definition of an adjudication is a fundamental difference between PMR and the existing UI systems
including QA and Workload (funding). The QA quality measure includes only four issues:
` Voluntary Quit
` Misconduct
` Able and Available
` Refusal of Suitable Work
The QA time lapse measure only includes small samples of issues arising in connection with additional
claims and issues arising during the claims series. The PMR measure has been broadened to include all issues
with potential adverse impact on the claimant. An exception has been made for overpayment adjudications
generated by the Benefits Payments Control (BPC) cross-match process, which matches Social Security
Numbers (SSNs) from wage files with claimant SSNs to detect claimants who were monetarily ineligible due
to earnings. These adjudications have been deleted from the time lapse population because by definition, these
determinations cannot be timely (States normally run cross-match programs many months after the claims

37
activity being monitored). Some UI analysts have argued that, because overpayment collection rates tend to
decline as the delay between payments and cross-match increases, these adjudications should be measured for
time lapse. The ideal compromise would be to track cross-match adjudications separately from others. Separate
tracking of cross-match adjudications would eliminate any bias in the main adjudication time lapse measure
while still tracking cross-match promptness. Reporting time lapse promptness presumably would encourage
States to run cross-match programs more frequently and increase overpayment recovery rates. Some States,
however, will object that this is not a regular UI program and should not be measured at all. Eventually, a
separate set of measures may be implemented to monitor the BPC environment.
The question of whether or not to include overpayments in the adjudications universe was further
addressed at the midtest meeting. It was agreed upon that overpayments based solely on previously adjudicated
issues would be excluded from the universe. This refers to separate overpayment notices which are generated
as a result of a previously adjudicated issue.
Strong support exists at both the federal and State level to include all issues in both time lapse and quality
universes. The PMR concept of not excluding any benefits activities is sound. If States issue determinations
that affect benefits, they should be subjected to promptness and quality evaluation. Two potential problems
with this approach are: (1) implementational feasibility; and (2) a potential perverse impact on State
administrative practice.
PMR has expanded the adjudication universe from the restricted definition of "nonmonetary
determinations." All five States (New Hampshire has yet to implement the adjudication time lapse measure)
were encouraged to reexamine their adjudication populations in light of the expanded PMR definition. After
reexamination, the five States took the following actions:
` California initially decided that its existing definition of a nonmonetary determination should notbe broadened, because it had designed its system based on the nonmonetary definition andbroadening the definition would result in increased burden on adjudicators. California uses theterm "clarification" to describe issues where fact finding is minimal. Some clarifications meet thePMR definition of an adjudication and some do not. California will count all issues (includingmultiple issues based on a single set of facts) when PMR is implemented.
` Illinois, Kansas, and Wisconsin determined that additional issues should be included in PMR.Each State provided a list of these issues to MPR and the national office for validation review.
` Missouri determined, after consultation with national office staff, that one additional category ofadjudications entitled "Weeks Claimed" should be added to the existing "Nonmonetary" category.These were described as mandatory adjudications of all base- period employers conductedprimarily for the purpose of allocating employer charges. Missouri noted that in some cases, these"chargeback" determinations had a potential adverse impact on claimants, and thus met the newly

38
broadened PMR definition. At the midtest meeting, it was determined that chargebacks shouldnot be included.
` New Hampshire did not modify its adjudication population for PMR. New Hampshire doesinclude secondary issues in workload and PMR.
Consensus was reached at the Midtest meeting on the inclusion or exclusion of several specific
adjudication issues from the PMR universe:
` Chargebacks
` Training Benefits, and
` Fraud/False Statements

39
Chargebacks should not be included in the PMR adjudications universe when the determination affects only
employer charges. Since these adjudications have no effect on the claimant's past, present or future benefits,
they do not meet the PMR definition.
The inclusion of training benefits hinges on the question of whether these adjudications require
investigation or are merely claimstaking functions. Some amount of factfinding may be required to determine
whether a particular claimant's training is Title III, "approved." It was agreed that training benefit
determinations where the agency has no discretion will be excluded from the universe. Training benefit issues,
however, will be included when the issue is other than Title III or there are additional issues involved which
require agency discretion.
It was determined that fraud and false statement issues would be included in the adjudications universe
unless they referred to a previously adjudicated issue. In these instances fraud or false statements would not
represent the original issue being addressed, and hence should not be included.
One approach to ensure that no inappropriate adjudications are included in PMR is through the quality
review sample, which requires the reviewer to indicate whether the adjudication was "valid." States have
reported that at least 90 percent of adjudications reviewed have met the PMR criteria. States were asked to
provide information about the sampled adjudications that did not meet the criteria to determine if they are
systematically including invalid issues or if human error is responsible for the misclassification of issues.
B. DETERMINING THE FIRST WEEK AFFECTED BY THE ADJUDICATION
The second most serious implementation issue after the composition of the adjudication population is the
feasibility of accurately capturing the first week affected by the adjudication to calculate time lapse. Missouri
and Illinois had no difficulty producing the week-ending date using data they already maintained. Both Illinois
and Missouri use the "week affected" to directly start or stop payments (depending on the outcome of the
adjudication). MPR compared the week-affected dates recorded as part of the adjudication quality review to
validation listings in both States and found no problems.
At the mid-test assessment meeting, Missouri made a presentation on their automated approach for
deriving this date. For each "notice date" during the subject month they select the most recent of the Benefit
Year Beginning, Separation Date, or Additional Claim Date, as the first week affected. It was determined that
under some infrequent circumstances, the adjudicator could potentially link the adjudication to the wrong date
(based on the presence or absence of an additional claim date on the adjudication record).

40
Some of the other Field Test States have adjudicators enter the week affected rather than deriving it from
data already present in the benefits system. Validation results show that using a manual entry not linked to
claim activity is error prone. Therefore, it was concluded that the Missouri approach, although not 100 percent
accurate, seemed likely to be more accurate than a separate manual entry of the week affected solely for the
purposes of calculating time lapse for PMR.
Kansas had a problem establishing the week-ending date for separation adjudications that was resolved.
New Hampshire did not initially capture the date, because they were in the process of replacing their system,
but is doing so now.
Two States, Wisconsin and California, added a new data element to their determination screens and
databases to meet this PMR requirement. This constituted a major expenditure in California because its
systems are complex and many programs had to be revised to carry the new field. In Wisconsin, room was
available on the record, so programming expenditures were minimized. Both States required modification to
their documentation and some degree of decentralized retraining. This has been by far the most costly PMR
implementation problem and poses a potential obstacle to efficient national implementation.
Agreement was derived at the midtest meeting, regarding the proper ending parameters to be utilized for
calculating adjudication time lapse. In the case of a formal determination, the appropriate date for time lapse
is the date on the determination. For informal determinations, the State should report the date the determination
is posted to the system.
C. MULTICLAIMANT ADJUDICATIONS
States have experienced some problems in accurately capturing this measure. Illinois has not reported
these adjudications because it would require a manual step (it cannot be done directly from the Benefits
Information System). California has experienced some definitional and implementational problems with this
measure.

43
IV. REDETERMINATION TIME LAPSE
The PMR system measures the timeliness of adjudication redeterminations and that of the initial
adjudication (Figure IV.1). Since this timeliness measure reports the time lapse between the end of the week
affected by the redetermination and the date the redetermination is issued, it is the sum of (1) the time it takes
to do the initial adjudication; (2) the time between the initial adjudication and the availability of new
information that requires a redetermination; and (3) the time it takes to do the redetermination. As a result, it
takes longer for a redetermination to be completed than for the initial adjudication. As shown in Table IV.1,
44 percent of separation issue redeterminations and 49 percent of non-separation issue redeterminations are
made within 28 days. After 56 days under 80 percent of redeterminations have been decided. A final point to
note about redeterminations is that, with the exception of Illinois, most of the PMR States have very few
redeterminations. In Illinois, however, there is about one redetermination for every 4 initial separation
adjudications and one redetermination for every 12 initial non-separation adjudications.
This measure is somewhat controversial because the performance results are not completely under SESA
control. Redeterminations are defined somewhat differently by States, making comparisons difficult.
Nonetheless, the current PMR measure from the week-ending date of the first week affected by the
redetermination to the date the redetermination was issued is a necessary and appropriate measure to implement
nationally. Using the week-affected date errs on the side of the "payment when due" approach versus the SESA
control approach to performance evaluation, but the "payment when due" approach is the most practical because
it would be difficult to capture a consistent and valid issue detection date.
At the mid-test assessment meeting, States expressed concern that the date currently being used (the first
week affected by the original adjudication) provides little management value because it fails to consider when
the SESA obtained the information which initiated the redetermination process.

FIGURE IV.1
PERFORMANCE MEASUREMENT REVIEW(Adjudication Redetermination Time Lapse)
Measure Adjudication Redetermination Time Lapse
Definition The length of time to an issue redetermination of the initial adjudication
Data Source Universe of Redeterminations
ComputationStart DateEnd Date
Week-ending date of first week affected by the redeterminationDate redetermination is issued
Reporting Intervals 7, 14, 21, 28, 35, 42, 49, 56, 63, 70, 70+ days
Reporting CategoriesReport Separately For - Intrastate UI, UCFE, UCX, CWC - Separations and Nonseparations
- Interstate UI, UCFE, UCX, CWC - Separations and Nonseparations- Multi-Claimant Labor Dispute- Multi-Claimant "Other"
Reporting Frequency Monthly

TABLE IV.1
ADJUDICATIONS REDETERMINATIONS: MEAN TIME LAPSE
Intrastate Interstate
GrandTotal Total UI UCFE UCX CWC Total UI UCFE UCX CWC
Adjudication Redetermination--Separation Issues
Percent Within:28 days 44.3 45.9 46.2 18.3 39.7 44.0 27.4 27.2 19.3 6.3 17.942 days 67.0 68.0 68.4 45.7 64.5 71.4 55.9 56.0 38.5 37.5 40.556 days 79.1 79.5 79.5 68.0 80.5 84.6 76.4 76.9 58.3 68.8 47.6
Average Sample Size 682 627 605 7 3 13 55 53 1 0 1
Adjudication Redetermination--Non-separation Issues
Percent Within:28 days 48.8 50.4 50.4 53.0 53.0 58.9 32.4 33.0 27.9 34.0 53.842 days 64.6 66.0 65.7 65.2 75.1 78.2 50.6 51.9 65.5 53.5 70.456 days 72.4 73.4 73.1 73.1 85.1 86.2 65.3 66.5 77.5 67.5 84.0
Average Sample Size 848 785 742 9 15 19 63 58 1 1 2

46
Two alternative approaches were offered: the date the SESA received the request for a redetermination or the
issue detection date; and the date of the original notice. There was discussion on the date which would best
represent the request for a redetermination. For redeterminations which are requested by the interested party,
as opposed to the SESA, the date of the request was proposed as an appropriate parameter. However, the
parameter to be used for SESA initiated redeterminations requires further discussion.
States opposed the use of the original adjudication notice date. They said that this date neither addressed
the issue of payment when due to the claimant (as did the ending date of the first week affected) nor did it
address the SESA management issue (as did the "issue detection date").
There was no consensus reached on changing the parameter to the issue detection date because of the data
validity problems inherent in that approach. It was agreed that there would be too much variation in the capture
of the "issue detection date" across States to provide meaningful performance comparisons.
The Missouri redetermination population does not meet the PMR definition. While Missouri reports a
substantial number of redeterminations, it includes notices that merely correct administrative errors made when
the original determination was mailed and that were detected through supervisory review.

47
V. APPEALS TIME LAPSE
Lower and Higher Authority Appeals are currently subject to Secretary's standards for time lapse. Sixty
percent of Lower Authority Appeals are to be decided within 30 days and 80 percent within 45 days. Forty
percent of Higher Authority Appeals are to be decided within 45 days and 80 percent within 75 days.
The PMR system has not changed the definition of an appeal, so it is reasonable to examine appeals
timeliness using the same standards (Figures V.1 and V.2). As shown in Table V.1, average performance in
the PMR States tends to fall short of each of these standards. The only exceptions are that Lower Authority
Appeals timeliness meets the 80-percent/45-day standard for both separation and non-separation issues and
Higher Authority Appeals timeliness meets the 40- percent/45-day standard for non-separation reasons. Data
by State for Lower Authority and Higher Authority Appeals (Figures V.3 and V.4) show, however, that these
averages over all the PMR States mask some variation by State. Two of the States--California and Kansas--
have an average Lower Authority time lapse that exceeds the 60-percent/30-day standard, while the other PMR
States have average time lapse below this standard.
Higher Authority Appeals time lapse shows the greatest variability of any PMR measure. Kansas achieves
on average 82 percent timely decisions, and California and Illinois have almost no timely decisions, using the
45-day criteria. Kansas explained that its Higher Authority Board met twice a month and had no problem
making its decisions. California Appeals staff said that there was little chance of California meeting the
Secretary's standard because all taped Lower Authority Hearings had to be transcribed prior to Higher Authority
review and workload had increased.
Of the other States, Wisconsin and New Hampshire exceed the Higher Authority Appeals standard, while
Missouri does not.

FIGURE V.1
PERFORMANCE MEASUREMENT REVIEW(Lower Authority Appeals Time Lapse)
Measure Lower Authority Appeals Time Lapse
Definition The length of time from the date the request for hearing is filed to the date thedecision is issued
Data Source Universe of Lower Authority Appeals decisions
ComputationStart DateEnd Date
Date the appeal is filedDate notice of final decision is issued
Reporting Intervals 30, 45, 60, 75, 90, 120, 120+ days
Reporting CategoriesReport separately for - Intrastate UI, UCFE, UCX, CWC - Separations and Nonseparations
- Interstate UI, UCFE, UCX, CWC - Separations and Nonseparations- Multi-Claimant Labor Dispute- Multi-Claimant "Other"
Reporting Frequency Monthly
Notes Include remanded and reopened cases.
If a case is remanded from Higher Authority Appeals for a new hearing anddecision by the Lower Authority, the clock starts on the date the case isremanded from the Higher Authority.

FIGURE V.2
PERFORMANCE MEASUREMENT REVIEW(Higher Authority Appeals Time Lapse)
Measure Higher Authority Appeals Time Lapse
Definition The length of time from the date the request for a Higher Authority Appeal isfiled to the date the decision is issued
Data Source Universe of Higher Authority Appeals decisions
ComputationStart DateEnd Date
Date the appeal is filedDate notice of final decision is issued
Reporting Intervals 45, 60, 75, 90, 120, 150, 180, 210, 240, 270, 300, 330, 360, 360+ days
Reporting CategoriesReport separately for - Intrastate UI, UCFE, UCX, CWC - Separations and Nonseparations
- Interstate UI, UCFE, UCX, CWC - Separations and Nonseparations- Multi-Claimant Labor Dispute Separations- Multi-Claimant Nonseparations
Reporting Frequency Monthly
Notes Include remanded and reopened cases.
If a case is remanded from Lower Authority for additional evidence and the caseis returned, the Higher Authority clock keeps running.
If a case is remanded to the Lower Authority for a new hearing and decision, theclock stops.

TABLE V.1
APPEALS: MEAN TIME LAPSE
Intrastate Interstate
GrandTotal Total UI UCFE UCX CWC Total UI UCFE UCX CWC
Lower Authority Appeals--SeparationIssues
Percent Within:30 days 51.8 52.1 52.1 53.4 51.4 54.9 47.5 47.5 40.0 28.4 53.245 days 79.7 79.7 79.8 79.1 80.9 80.3 78.9 78.9 73.6 75.9 80.0
Average Sample Size 2,595 2,430 2,381 15 8 26 165 161 3 0 1
Lower Authority Appeals--Non-separation Issues
Percent Within:30 days 52.6 53.2 53.2 54.2 50.1 56.9 45.7 46.4 28.4 47.5 31.045 days 80.2 80.5 80.5 79.2 76.8 82.4 77.4 77.8 70.2 85.5 71.2
Average Sample Size 1,119 1,065 1,022 21 14 8 54 50 2 1 1
Higher Authority Appeals--SeparationIssues
Percent Within:45 days 33.1 32.8 32.8 27.6 24.8 27.1 38.2 37.8 28.6 28.6 30.875 days 51.6 51.3 51.3 45.1 48.2 39.3 56.6 56.3 53.3 28.6 41.0
Average Sample Size 548 515 503 6 2 4 33 32 1 0 0HigherAuthorit
yAppeals-
-Non-
separation Issues
Percent Within:45 days 45.8 45.7 45.7 33.6 43.3 23.8 46.4 45.3 57.1 100.0 42.975 days 61.5 61.6 61.5 57.7 60.9 37.7 59.4 58.5 71.4 100.0 57.1
Average Sample Size 78 75 72 1 1 1 4 4 0 0 0

51
TABLE V.1 PAGE 2

52
FIGURE V.3
TOTAL INTRA-STATE LOWER AUTHORITY APPEALS TIME LAPSE:
SEPARATION AND NON-SEPARATION COMBINED
PERCENT WITHIN 30 DAYS

53
FIGURE V.4
TOTAL INTRA-STATE HIGHER AUTHORITY APPEALS TIME LAPSE:
SEPARATION AND NON-SEPARATION COMBINED
PERCENT WITHIN 45 DAYS

54
This measure brings up some minor implementation and validation issues. Wisconsin uses the date the
mailed appeal was received, not the postmark date. Wisconsin has noted that the State Employment Security
Agency (SESA) has no control over the time the appeal spends in the mail system (it does use the postmark date
to determine the timeliness of the appeal if it is close to the filing deadline). Illinois continues to have problems
identifying the appropriate appeals population for both Lower and Higher Authority time lapse and for the
Lower Authority Appeals quality sample. It had established a separate system for tracking appeals for the
Unemployment Insurance Required Report 5130, but has attempted to use its mainframe Benefit Information
System to generate the PMR data. Illinois has found that the mainframe database is not updated with the status
of appeals in a timely manner, and it will have to either use the 5130 system for PMR or achieve closer
integration of the appeals function and the mainframe database.
Implementation problems have also occurred in the Higher Authority Appeals measures in California and
New Hampshire, which did not track these by separation and non-separation issues. As noted in the
Introduction, Missouri feels that Higher Authority Appeals are outside SESA control, but this measure is
obviously necessary for federal oversight purposes.
California Appeals staff raised a key problem with the effect of the current performance standards on State
behavior. Because the only emphasis is on the percentage decided prior to the time lapse deadline, States
manipulate the scheduling of hearings to ensure that an adequate percentage are heard within the 30-day limit.
This results in other cases being delayed. The design of the current measure thus has a perverse affect on
claimant rights, because some claimants are victimized by the performance measurement approach. The current
Appeals Aging project seeks to remedy this problem by tracking the age of undecided cases. Another approach
would be to change the measure to capture the average time lapse for all appeals decided in a month. This
would not be difficult to calculate and would ensure that a State would not suffer in measured performance by
using the "first in, first out" approach to scheduling hearings, which is the most equitable approach for
claimants.
At the Midtest Assessment meeting, the Appeals Workgroup discussed whether States should be "held
harmless" for lengthy appeals delays caused by legal issues, and the concept of changing the current time lapse
standards to add a case aging measure or to create an average time lapse measure was discussed. Neither of
these issues were resolved. The Workgroup concurred on the following issues pertaining to appeals time lapse.
` The starting parameter of Appeals time lapse for Appeals which are filed by mail is the postmarkdate and not the date received. This follows the current convention.

55
` Illinois has a different "appeal filed date." They want to use the date the reconsideration is issuedas the appeal date, since they have to conduct two separate processes within the same time lapseperiod that other States only have to process an appeal. One comment was that Illinois' systemdelays due process by making the appeals process into two separate steps. It was noted that ifIllinois used the date of the reconsideration, they could manipulate the intake of appeals cases.It was decided that this was not a PMR implementation issue, but a workload validation issue.

1Since very few adjudications pass the question on appeal information, the passing ratesshown in Figures V.1 and V.2 exclude the appeals question. In addition, the passing rate iscomputed using only PMR valid cases. Ninety-two percent of the cases reviewed were valid.
57
VI. ADJUDICATION QUALITY
Adjudication quality is perhaps the most important PMR measure because it assesses the decision-making
process that affects more claimants than any other (Figure VI.1). PMR has expanded the assessment to include
the quality of the written determination, while retaining the fact-finding and decision process assessment from
the existing Quality Performance Index (QPI) assessment conducted under the Quality Appraisal (QA) program.
PMR has also adopted a pass/fail evaluation approach instead of the scoring approach used in the QPI. Now,
the failure of any element causes the case to fail.
A. PMR QUARTERLY QUALITY REVIEWS
Adjudication quality, as measured in the PMR quarterly quality review samples, appears to be relatively
poor. As shown in Figures VI.2 and VI.3,1 none of the PMR States had a passing rate for separation
adjudications that exceeded 80 percent in any of the quarters. Moreover, for separation issues, the passing rate
was above 60 percent in only one State. Only one State exceeded 80 percent for non-separation adjudications.
Performance was better overall for non-separation adjudications. In one State, however, performance never
exceeded the 50 percent mark. Lower quality outcomes are not unexpected given the tougher pass/fail
evaluation approach.
Table VI.1 presents an analysis of the data underlying this overall passing rate for adjudication quality
cases by reporting a failure rate for each individual question on the adjudication quality review. The first
column shows the percent failed for each question, including the cases where the question was not applicable.
The second column shows the failure rate for each question, excluding

FIGURE VI.1
PERFORMANCE MEASUREMENT REVIEW(Adjudication Quality)
Measure Adjudication Quality
Definition Assessment of the adequacy of adjudications
Data Source Sample from the Adjudication Time Lapse universe
Computation Each element scored as Pass/Fail/Not Applicable. Failure of one element causescase to fail
Reporting CategoriesReport separately for - Intrastate UI, UCFE, UCX, CWC - Separations and Nonseparations
- Interstate UI, UCFE, UCX, CWC - Separations and Nonseparations- Multi-Claimant Labor Dispute- Multi-Claimant "Other"
Reporting Frequency Quarterly

59
FIGURE VI.2
ADJUDICATION QUALITY MEASURE SEPARATION SAMPLE
PERCENT PASSING

60
FIGURE VI.3
ADJUDICATION QUALITY MEASURE NON-SEPARATION SAMPLE
PERCENT PASSING

TABLE VI.1
PERCENT FAILING ADJUDICATION QUALITY QUESTIONS:ALL STATES
Percentof Total
Percent ofPass/Failsa
Q1 Claimant Information 19.8 19.9
Q2 Employer Information 14.1 21.4
Q3 Information from Others 4.2 29.1
Q4 Rebuttal Opportunity 7.9 40.9
Q5 Law and Policy Correctly Applied 22.4 22.4
Q6 Determination Clearly Written 19.5 19.7
Q7 Correct Eligibility Outcome Stated 10.7 10.7
Q8 Material Facts Cited in Determination Are Supported25.6 25.6
Q9 Appeal Information 76.4 91.7
NOTE: Based on samples for quarters ending 6/30/93, 9/30/93, 12/31/93, 3/31/94, and 6/30/94.aExcludes cases where question is not applicable.

62
the cases where the question was not applicable, and is therefore a better measurement of quality. The only
good score is on Question 7--Correct Eligibility Outcome Stated, where only 11 percent of the cases failed. The
worst score is on Question 9--Appeal Information, where 92 percent of the applicable cases fail. As noted in
the footnote, this question is not included in the overall quality measures. For each of the other questions, the
failure rate is between 20 and 41 percent. Thus, with the one exception, adjudication quality seems to be
relatively poor under the current definition of quality.
The final two tables for adjudication quality, Tables VI.2 and VI.3, present a comparison of the State and
national rereviews and State and regional rereviews for cases with rereviews. Table VI.2 shows that 15 to 31
percent of the national reviews reached different conclusions than the State reviews for the questions used to
measure adjudication quality (Questions 1 to 8), nine percent reached a different conclusion regarding whether
appeal information was provided (Question 9), and four percent reached a different conclusion regarding
whether the adjudication was PMR valid (Question 10). Although a smaller percent of the regional reviews
differed from the State reviews, there were still substantial differences (11 to 22 percent on the questions used
to measure adjudication quality) between the two reviews (Table VI.3). The State and national/regional
differences were largest for three questions: (1) Question 4--Rebuttal Opportunity; (2) Question 6--
Determination Clearly Written; and (3) Question 8--Material Facts Cited in Determination are Supported. An
examination of the answers for each of these questions shows no systematic difference between State and
national/regional reviews--State reviewers were generally as likely to pass as to fail cases in which the
national/regional reviewers reached a different conclusion. Further examination of the answers shows that the
differences in the reviews generally affected the quality outcome: one review passed the case or said the
question was not applicable; the other review failed the case. Large differences in passing rates by item have
occurred when States change their reviewers, further questioning the ability to achieve consistency.

TABLE VI.2
PERCENT IN WHICH NATIONAL REVIEW YIELDS A DIFFERENT ANSWER THAN STATE REVIEW FOR
ADJUDICATION QUALITY QUESTIONS:ALL STATES
Percent with DifferentAnswer
Q1 Claimant Information 23.7
Q2 Employer Information 17.6
Q3 Information from Others 17.6
Q4 Rebuttal Opportunity 30.5
Q5 Law and Policy Correctly Applied 16.0
Q6 Determination Clearly Written 28.2
Q7 Correct Eligibility Outcome Stated 14.5
Q8 Material Facts Cited in Determination Are Supported 25.2
Q9 Appeal Information 9.2
Q10 Valid Adjudication 3.8
NOTE: Based on 131 national reviews for quarters ending 6/30/93, 9/30/93, 12/31/93, 3/31/94, and 6/30/94.

TABLE VI.3
PERCENT IN WHICH REGIONAL REVIEW YIELDS A DIFFERENT ANSWER THAN STATE REVIEW FOR
ADJUDICATION QUALITY QUESTIONS:ALL STATES
Percent with DifferentAnswer
Q1 Claimant Information 12.7
Q2 Employer Information 16.7
Q3 Information from Others 12.7
Q4 Rebuttal Opportunity 20.3
Q5 Law and Policy Correctly Applied 17.9
Q6 Determination Clearly Written 21.5
Q7 Correct Eligibility Outcome Stated 10.8
Q8 Material Facts Cited in Determination Are Supported 18.3
Q9 Appeal Information 8.8
Q10 Valid Adjudication 7.6
NOTE: Based on 251 regional reviews for quarters ending 6/30/93, 9/30/93, 12/31/93, 3/31/94, and 6/30/94.

65
The level of differences in reviews seems unacceptable. Further training of staff or clearer definitions may be
needed.
Discussion at the mid-test assessment meeting led to consensus on the merits of including the issue codes
for the adjudications being evaluated. A valid argument presented against this idea, was that the data would
be unreliable (because the sample sizes for a particular issue would be so small) and may lead States to take
unwarranted remedial action. States agreed, however, that the ability to analyze the quality of specific types
of adjudications would constitute a valuable management tool, although they were aware that the results may
not be statistically reliable.
MPR supported the inclusion of the issue code for validation reasons. If there was a clear trend that certain
types of adjudications always failed the validity test, it would be an efficient means of refining the universe to
better meet the PMR definition.
Estimates of quality review failure rates by issue code will be less precise than the overall estimates of
separation and non-separation adjudication failure rates and the level of precision will vary widely depending
on the frequency of each issue. Nevertheless, if there are large differences in failure rates by issue, States will
be able to detect these differences using annual or biannual samples. For separation adjudications, where there
are only two types of issues (voluntary quit and misconduct), States will be able, using an annual sample, to
detect differences in failure rates that exceed 20 to 25 percentage points. For non-separation adjudications,
where there are many more types of issues, differences among issues will be harder to detect. However, States
could obtain a more precise estimate of the failure rate for a particular issue type by reviewing a supplementary
sample of adjudications when the results of the regular quality sample indicate that the issue should be
examined more closely to determine if remedial action is warranted.
A final item reported in the quality reviews is the time spent on the reviews. The mean time by State
ranged from 8 to 29 minutes for the separation reviews and from 6 to 32 minutes for the non-separation reviews.

66
B. ADJUDICATION QUALITY INSTRUMENT
The PMR evaluation approach has been changed to "pass/fail" instead of the scoring approach of QA. The
pass/fail approach has considerable support, especially if the "clearly written" criterion for the determination
is not too strict. The PMR measure's emphasis on the clarity and specificity of the written determination clashes
with the efficiency to be gained by increasing the use of "canned" determinations. Field test monitoring has
shown that even the option of customizing the canned determination, which is the most obvious solution to this
conflict between specificity and efficiency, is problematic. Adjudicators become accustomed to the ease of
using the canned options and are reluctant to be burdened by composing their own language. Presumably, a
large percentage of adjudications can be clear using the canned approach. Through adoption of the PMR quality
criteria of a clearly written determination as a pass/fail item, States will be forced to increase the use of
customized "fill in" paragraphs. If the PMR criterion is maintained and the percentage of cases that require
customized language is very large, the conflict between clarity and efficiency can be resolved only by
eliminating the criterion as an automatic failure or by moving away from canned nonmonetary determinations.
It was proposed at the midtest meeting that redeterminations should also be examined for quality. Many
of the meeting participants supported this proposal, which would broaden the scope and comprehensiveness of
PMR. Redeterminations are low volume in many States, however, and it is unlikely that they would contain
all of the criteria for a substantive quality review. Because there are great differences in the way States define
and process redeterminations, implementation of a separate redetermination quality measure may not be
practical. This issue will be further examined at the national office.
During discussions of the adjudications quality assessment during the monitoring trips, a major issue has
been the interrelationship of the individual quality elements. Two areas in particular are seen to be inseparable
by some analysts. First, it has been argued that the failure to obtain claimant or employer rebuttal should
automatically cause the failure of claimant or employer fact finding. The logic is that since rebuttal (when
necessary) forms an integral part of fact finding, it is impossible to pass fact finding if rebuttal is not offered.
Second, it has been argued that failure to obtain the correct facts must cause the law and policy correctly applied
item to fail. The logic is that it is impossible to correctly apply law and policy if the facts are incorrect. In
substance, both of these arguments have merit. The question arises, however, about the utility of the assessment
for management diagnostic purposes if a single mistake leads to the failure of multiple items. If one purpose
of the assessment is to identify specific aspects of the adjudication process which must be addressed, the

67
"domino effect" of having a failure on one item automatically lead to the failure of other items reduces the
clarity and precision of the findings. For example, if the failure to provide rebuttal opportunity automatically
causes the fact finding item to fail (when the initial fact finding was acceptable), SESA management is mislead
about where the training or documentation improvement should occur. If it is possible to clearly separate fact
finding from rebuttal or fact finding from law and policy, then the failure of one item should not cause the
failure of other items which were done satisfactorily.
At the midtest meeting it was suggested that there are actually three data elements that can be evaluated
independently of one another.
(1) Initial factfinding
(2) Rebuttal opportunity offered?
(3) Is the rebuttal information complete?
Adopting this three-step approach, enables increased specificity in the determination of quality. The
addition of the element regarding the completeness of the rebuttal information reduces the automatic failures
of the entire rebuttal in instances where fact-finding was incomplete.
Illinois suggested that Local office staff are especially concerned with how they are evaluated on making
a "reasonable" effort to obtain rebuttal. This concern may require a uniform definition for "reasonable" efforts.
The national office has no plans to develop a definition of reasonable attempts. A consensus was reached that
States should incorporate a statement of what it considers a reasonable attempt to secure rebuttal information
into its adjudication manual. If disagreement arises when evaluators from Regional or national office encounter
the definition, the issue can be mediated or negotiated, or, if necessary, escalated for resolution. The scoring
will be based on the State's definition. The group also agreed that although a thorough effort to obtain rebuttal
conflicted with State policies on making timely determinations, that time lapse should not be a factor in
determining the reasonableness of an effort to seek rebuttal.
Several other issues were explored at the mid-test assessment meeting, regarding the quality measure for
adjudications. Included in the discussion were, material facts, law and policy correctly applied, determination
clear and understandable.
Consensus was arrived at in regards to material facts. If material facts apply and are cited in the decision
then they must be documented in the record. Any determination based on facts not cited elsewhere will fail.
This represents no change from the original PMR definition.

68
It was agreed upon that Law & Policy would be altered from the current handbook definition. The
handbook will be changed to delete the requirement that the specific law reference must be cited to pass this
element on informal determinations only.
The problem of "canned" determinations was discussed. The view was expressed that an increased focus
on the written determination in PMR might promote the States to provide more technical capabilities which
would create clearer determinations using preprogrammed text. Automated determinations that do not include
material facts and do not provide sufficient information to the claimant will fail.
Finally, a consensus was reached that States will no longer score item 9, "adequate appeals information."
The national office reviewers will continue to score it, and it will remain on the Unemployment Insurance Data
Base.

1While California's average is below the 80-percent standard, it is close enough to pass thestandard when we take sampling variability into account.
71
VII. APPEALS QUALITY
The Lower Authority Appeals Quality measure is described in Figure VII.1. Table VII.1 and Figures VII.2
and VII.3 report data on Lower Authority Appeals Quality obtained from three quality review samples. Mean
scores range from 85 to 94 percent and the percent passing the review ranges from 62 to 85 percent (Figure
VII.2). (A case passes if the due-process elements of the review are passed and if the overall score is 80 or
more.) If we apply a standard that says that 80 percent of appeals should pass the review, four of the States
would pass. The two States with pass rates below 80 percent would fail to meet the standard,1 so there is some
evidence that appeals quality could be improved.
The mean time for appeals reviews shows large differences among States: four States report average times
that vary from 31 to 47 minutes, while two States report average times of more than 75 minutes (Figure VII.2).
Problems with drawing random samples include the need to substitute for cases where there was no tape
(only a transcript) and cases where withdrawals, dismissals, and no-shows cannot be screened from the sample
population before sampling occurs. California selects the next case in these situations. Because these selections
are done in local Appeals Board offices, it is difficult to validate the sample. Illinois draws a larger sample (50
cases) to ensure at least 20 cases with real hearings are selected. Perhaps the best trade-off between validity
and efficiency would be to randomize the population prior to sampling and then draw from the random
population until the desired number of decisions with real hearings was found. This method contrasts with the
systematic sampling method, which selects a random start point, then calculates the amount of time needed from
the start point to select the proper number. Substitution would be much easier to validate when employing

FIGURE VII.1
PERFORMANCE MEASUREMENT REVIEW(Lower Authority Appeals Quality)
Measure Lower Authority Appeals Quality
Definition Assessment of the quality of Lower Authority Appeals hearings. Includes twoscoring systems: the weighted scoring method developed for Quality Appraisal,and a pass/fail score derived from the pass/fail rating of eight due-processelements
Data Source Sample of appeal decisions (single and two party) issued in a quarter Excludeswithdrawals, dismissals, and special claims programs such as EB, EUC, DUA,and TRA
Computation Numeric for all elements and pass/fail on due process
Reporting CategoriesReport separately for - Intrastate UI, UCFE, UCX, CWC - Separations and Nonseparations
- Interstate UI, UCFE, UCX, CWC - Separations and Nonseparations- Multi-Claimant Labor Dispute- Multi-Claimant "Other"

TABLE VII.1
LOWER AUTHORITY APPEALS
State Mean Score Percent PassingaMean Time (Minutes)
California 94.1 79.9 31.2
Illinois 92.6 83.6 40.7
Kansas City 86.1 62.1 75.7
Missouri 85.7 81.8 46.8
New Hampshire 84.9 72.3 34.5
Wisconsin 93.4 85.0 87.3
NOTE: Average of quality review samples for 6/30/93 to 6/30/94.aPercent with score above 80 percent and due process.

74
FIGURE VII.2
LOWER AUTHORITY APPEALS QUALITY MEASURE
PERCENT PASSING

75
FIGURE VII.3
LOWER AUTHORITY APPEALS QUALITY MEASURE--MEAN SCORE

76
the random sample approach, because the validator could obtain the sample frame listing and compare it to the
ID number of cases actually reviewed.
The appeals quality sample size for the pretest is 20 hearings per quarter. This sample is inadequate for
large States and excessive for very small States. MPR will recommend a variable sample size based on the
number of annual appeals in each State. One decision will be how many different sampling strategies to
implement (small, medium, large or up to 5 different sizes).
Some States responded to the Federal Register notice by asking to exclude very brief and very long
hearings. This would not be feasible unless length of hearing was a data element or unless we prescribed the
use of a random sort sample (not a systematic or interval sample) and bypassed hearings that were not of
appropriate length.
At the mid-test assessment meeting, the Lower Appeals Quality Workgroup resolved a number of
significant issues relating to the both the appeals quality instrument. The Workgroup reached the following
points of consensus on the issues discussed:
` The copy of the determination should be supplied with the case materials for the review.
` State law and case law prevails over the PMR evaluation criteria unless it is not in conformitywith FUTA and SSA.
` There should be different sample sizes for small and large States.
` Multiclaimant cases should be excluded from the sample.
` If a sampled case references testimony provided in another hearing (for example, an employerstatement is incorporated by reference), it is appropriate and statistically valid to incorporate theother testimony in the review.
` If a hearing is wholly or partially inaudible, the case should be replaced by a substitute case. Thisrequirement dictates that States draw Appeals quality samples from a pre-randomized file (ratherthan drawing interval samples) to ensure that statistically valid replacement cases are readilyavailable.
` It was determined that appeals quality reviews would be validated annually at the national office.
` Item 21 should be deleted: "attitude" which refers to the atmosphere the Hearing Officer createdto ensure that the parties are placed at ease to the extent possible.

77
` Item 11 from the existing Appeals Quality Review should be added to PMR: Did the hearingofficer interfere with the development of the case by gratuitous comments or observations?
` Item 20 from the existing Appeals Quality Review should be added to PMR: Did the hearingofficer display an attitude that allowed all parties and representatives to speak freely in an orderlymanner as to the issues in the case?
` The Region V version of item 24 should replace the existing version: "Issues clearly stated" refersto the requirement that the Hearing Officer should state the statutory issues clearly early in thewritten decision so that the reader knows what is being decided.
` Item 27 should be deleted: "Official notice/administrative notice" means the Hearing Officer mustclearly indicate when official notice or administrative notice is being taken of a fact so that theparties have the opportunity to object to the fact before the decision becomes final.
` Item 1 should be reviewed only at the national office: "Notice of Hearing" refers to therequirement that all parties have adequate notice of the hearing and the opportunity to prepare forthe hearing.
` Item 33 should be reviewed only at the national office: "Finality Date and Further AppealRights."
` Consideration should be given to establishing a mean quality score, because the current 80 percentscoring 80 percent standard does not always reflect true performance differences between States.

1In a number of cases the implementation date is prior to the decision date.
79
VIII. IMPLEMENTATION MEASURES
PMR establishes two new measures to assess performance in applying adjudication and appeals decisions
to the claim (see Figures VIII.1 and VIII.2). The purpose of these measures is to ensure that the promptness
of performance of the adjudications and appeals service delivery areas is not compromised by the failure of
States to promptly apply the decisions to the claims themselves. These measures only apply to cases that
reverse the status quo (there is otherwise no change to the claim status.) Presumably the more important
reversal situation occurs when the decision is to reverse the claim status from deny to allow, where "payment
when due" considerations are at stake. The opposite occurrence, to stop payments that were formerly allowed,
relates more to efficiency and overpayment recovery effectiveness than payment when due. Data for the
implementation time lapse measures are collected through the quality review process.
The data (Table VIII.1), show that, in all PMR states except New Hampshire, over 80 percent of the
determinations are implemented immediately (zero or fewer days)1. In New Hampshire, 74 percent of the
decisions are implemented within two days and 22 percent more in three to four days. In all States, very few
decisions take five or more days to implement. Thus, as one might expect in a highly automated environment,
adjudications appear to be implemented quickly. For additional Adjudication Implementation data see Figures
VIII.3 and VIII.4.
Data on Lower Authority Appeals Implementation Time Lapse are also available from the quality review
samples (see Table VIII.2 and Figure VIII.5). These data suggest that appeals decisions, unlike adjudication
determinations, are not always implemented quickly. In two States--Kansas and Wisconsin--the majority of
appeals are not implemented until five or more days have elapsed, while in the other States a substantial number
(25 to 50 percent) are not implemented until five or more days have elapsed.

FIGURE VIII.1
PERFORMANCE MEASUREMENT REVIEW(Adjudication Implementation Time Lapse)
Measure Adjudication Implementation Time Lapse
Definition The length of time from the date of determination to the date the outcome isapplied to the claim record
Data Source Adjudication quality sample
ComputationStart dateEnd date
Date determination issuedDate outcome applied to claim record
Reporting Intervals 0, 1, 2, 3, 4, 4+ days
Reporting CategoriesReport separately for - Intrastate UI, UCFE, UCX, CWC - Separations and Nonseparations
- Interstate UI, UCFE, UCX, CWC - Separations and Nonseparations- Multi-Claimant Labor Dispute- Multi-Claimant "Other"
Reporting Frequency Quarterly
Note Provides measurement to assess how promptly SESA acts to update claim recordto either authorize or stop payment when a determination is issued

FIGURE VIII.2
PERFORMANCE MEASUREMENT REVIEW(Lower Authority Decision Implementation Time Lapse
For Reversals or Modifications From Deny to Allow)
Measure Lower Authority Decision Implementation Time Lapse for Reversals orModifications from Deny to Allow
Definition The length of time from the date a decision that reverses or modifies adisqualifying adjudication is issued to the date the payment is released. The timelapse is not complete until all weeks affected by the Lower Authority Appealsdecision are paid. If the Lower Authority Appeals reversal does not result inpayment because another disqualification remains, time lapse will not bemeasured because benefits are not due to the claimant.
Data Source Lower Authority Appeals quality sample
ComputationStart dateEnd date
Date decision is issuedDate payment is issued for all affected weeks
Reporting Intervals 0, 1, 2, 3, 4, 4+ days
Reporting CategoriesReport separately for - Intrastate UI, UCFE, UCX, CWC - Separations and Nonseparations
- Interstate UI, UCFE, UCX, CWC - Separations and Nonseparations- Multi-Claimant Labor Dispute- Multi-Claimant "Other"
Reporting Frequency Quarterly

TABLE VIII.1
ADJUDICATION IMPLEMENTATION TIME LAPSE(Percent)
State @ 0 Days 1-2 Days 3-4 Days 5 or More Days
California 88.5 7.3 1.5 2.7
Illinois 92.9 3.4 0.8 2.9
Kansas 94.0 4.6 0.3 1.0
Missouri 81.5 10.3 3.1 5.1
New Hampshire 1.7 73.9 21.8 2.6
Wisconsin 94.4 2.0 0.8 2.8
NOTE: Distribution is based solely on PMR valid adjudications for five quality review samples (6/30/93-6/30/94). The numbers are the average for the five samples.

83
FIGURE VIII.3
ADJUDICATION IMPLEMENTATION TIME LAPSE: SEPARATION SAMPLE
PERCENT WITHIN 4 DAYS

84
FIGURE VIII.4
ADJUDICATION IMPLEMENTATION TIME LAPSE: NON-SEPARATION SAMPLE
PERCENT WITHIN 4 DAYS

TABLE VIII.2
LOWER AUTHORITY APPEALS DECISION IMPLEMENTATION TIME LAPSE(Percent)
State @ 0 Days 1 to 2 Days 3 to 4 Days 5 or More Days
California 0.0 23.4 26.6 50.0
Illinois 20.0 32.0 12.0 36.0
Kansas 18.5 7.4 7.4 66.7
Missouri 30.8 23.1 18.0 28.2
New Hampshire 50.8 11.9 11.9 25.4
Wisconsin 0.0 5.3 13.2 81.6
NOTE The numbers are the average for five quality review samples (6/30/93 - 6/30/94).

86
FIGURE VIII.5
LOWER AUTHORITY APPEALS IMPLEMENTATION TIME LAPSE
PERCENT WITHIN 4 DAYS

87
In summary, these data suggest that, at least in the PMR states, adjudications are implemented quickly.
As a result, it may not be necessary to monitor their implementation. Appeals decisions, however, are not
always implemented quickly. Continued monitoring of this process seems fruitful.
At the Midtest Assessment meeting, the Appeals Workgroup made the following decisions regarding the
appeals implementation time lapse measures:
` Since the tentative "standard" is four days from decision to implementation, it can be affected byweekends and holidays, which could cause a case to "fail" even if it was implemented in one ortwo business days.
` Because Lower Authority Appeals Implementation Time Lapse data captures such a broad rangeof time lapse, the number of intervals captured should be expanded.
` Reversals on Appeals which both deny and allow should be included in the Implementation TimeLapse universe, but should be tracked separately. Currently only reversals to allow are includedin the implementation time lapse measure. Separate tracking will require the addition of a singledigit indicator in the Appeals quality instrument to identify the type of Appeal decision beingmeasured for implementation. The ending parameters for the measure will be:
- If the reversal is to pay, the time lapse will be measured from the decision date to the datethat all payments affected by the decision are made.
- If the reversal is to deny, the time lapse will be measured from the decision date to the datethat the stop payment is entered into the system.

89
IX. CWC MEASURES
At the mid-test meeting, consensus was reached that the National Office should reexamine the six PMR
combined wage claim (CWC) measures (Figures IX.1 through IX.4) to ensure that they are cost effective and
accurate measures of SESA performance. Work has proceeded on a single comprehensive CWC quality
measure to incorporate transfer, billing and reimbursement accuracy.
The billings and reimbursements measures are not very expensive to develop and implement, but provide
limited oversight and management value. The measures would be more appropriate if the CWC system was
not so highly automated. The CWC time lapse measures show great variation in State performance (See Table
IX.1 and Figures IX.5, IX.6 and IX.7). The CWC quality measures (Table IX.2) show that CWC quality is quite
good. The performance problems that they do detect are rare and unusual cases. In many cases the percent
of sample cases passing the CWC quality questions exceeds 95 percent, and all reported measures of CWC
quality exceed an 80 percent standard, when we take account of sampling variability. The data on mean time
to do these reviews show some variation among States. In California, mean time for each of the three CWC
reviews is 4 to 8 minutes, while in other States the mean times range up to 21 minutes.
The possibility always exists that CWC performance problems are more prevalent in the other 47 SESAs.
These measures should be subjected to a thorough review and possible redesign. This activity should start soon
so that the revised approach is developed in time for national implementation.
A. WAGE TRANSFER TIME LAPSE AND QUALITY
The Combined Wage Program is a complex national system that requires frequent transfer of information
between States. All initial transfer requests and all responses are now transmitted over the Internet system.
Prior to the full automation of the wage transfer function, however, the transfer

FIGURE IX.1
PERFORMANCE MEASUREMENT REVIEW(Combined Wage Claims - Wage Transfer Time Lapse)
Measure Combined Wage Claims - Wage Transfer Time Lapse
Definition The length of time from the date the transfer request is received to the date thedata completing the transfer are sent to the paying State
Data Source Universe of transfers completed during the quarter from the transferring State'sfiles
ComputationStart DateEnd Date
Date the transfer request is receivedDate the data completing the transfer are sent to the paying State
Reporting Intervals 3, 6, 10, 14, 21, 28, 35, 42, 49, 56, 63, 70, 70+ days
Reporting CategoriesReport separately for Not applicable (N/A)
Reporting Frequency Quarterly
Note Only change from existing measure, as reported on ETA 586, is an increase inthe number of intervals.

FIGURE IX.2
PERFORMANCE MEASUREMENT REVIEW(Combined Wage Claims - Billing Time Lapse)
Measure Combined Wage Claims - Billing Time Lapse
Definition The length of time from the end of the calendar quarter to the date thatreimbursement requests (billings) were mailed to the transferring States
Data Source Universe of billings by the paying State for benefits paid during a given quarter
ComputationStart DateEnd Date
End of calendar quarterDate that reimbursement requests were mailed to transferring States
Reporting Intervals 14, 28, 42, 56+ days
Reporting CategoriesReport separately for Not applicable (N/A)
Reporting Frequency Quarterly
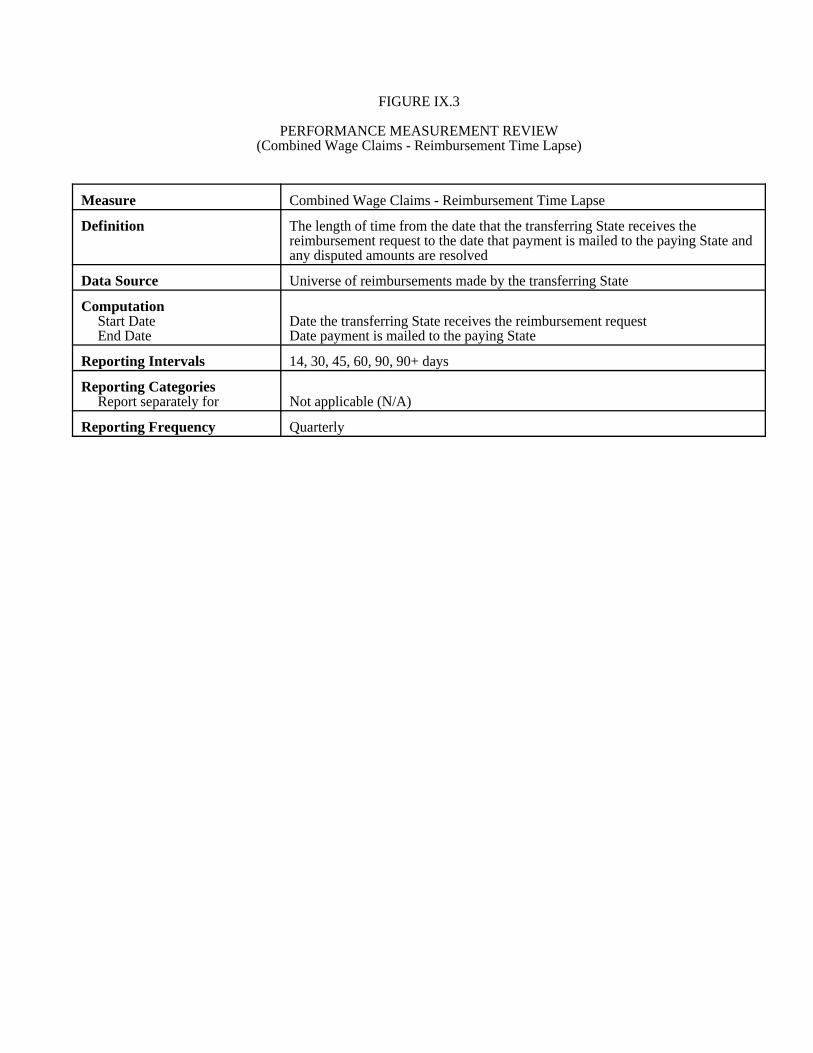
FIGURE IX.3
PERFORMANCE MEASUREMENT REVIEW(Combined Wage Claims - Reimbursement Time Lapse)
Measure Combined Wage Claims - Reimbursement Time Lapse
Definition The length of time from the date that the transferring State receives thereimbursement request to the date that payment is mailed to the paying State andany disputed amounts are resolved
Data Source Universe of reimbursements made by the transferring State
ComputationStart DateEnd Date
Date the transferring State receives the reimbursement requestDate payment is mailed to the paying State
Reporting Intervals 14, 30, 45, 60, 90, 90+ days
Reporting CategoriesReport separately for Not applicable (N/A)
Reporting Frequency Quarterly

FIGURE IX.4
PERFORMANCE MEASUREMENT REVIEW(CWC - Wage Transfer Quality)
Measure CWC - Wage Transfer Quality
Definition Assessment of the correctness of wage transfers
Data Source Sample of wage transfers completed within the review quarter
Computation Percent of transfers completed properly
Reporting Frequency Quarterly
PERFORMANCE MEASUREMENT REVIEW(CWC - Billing Quality)
Measure CWC - Billing Quality
Definition Assessment of the correctness of billing
Data Source Sample of SSNs paid benefits based on CWC within the review quarter
Computation Percent of claims properly billed for
Reporting Frequency Quarterly
PERFORMANCE MEASUREMENT REVIEW(CWC - Reimbursement Quality)
Measure CWC - Reimbursement Quality
Definition Assessment of the correctness of billing
Data Source Sample of SSNs paid benefits based on CWC within the review quarter
Computation Percent of claims properly billed for
Reporting Frequency Quarterly

TABLE IX.1
CWC TIME LAPSE
Wage Transfer Billings Reimbursement
State
Wage Transfer Percentwithin7 Days
Percent within45 Days
Percent within45 Days
California 93.6 60.0 67.6
Illinois Missing 100.0 26.6
Kansas 75.6 0.0 96.6
Missouri 96.2 100.0 89.6
New Hampshire 56.0 33.3 38.6
Wisconsin 88.8 100.0 77.9

95
FIGURE IX.5
TOTAL COMBINED WAGE CLAIMS TIME LAPSE -- WAGE TRANSFER
PERCENT WITHIN 6 DAYS

96
FIGURE IX.6
TOTAL COMBINED WAGE CLAIMS TIME LAPSE -- BILLINGS
PERCENT WITHIN 45 DAYS

97
FIGURE IX.7
TOTAL COMBINED WAGE CLAIMS TIME LAPSE -- REIMBURSEMENTS
PERCENT WITHIN 45 DAYS

TABLE IX.2
CWC QUALITY MEASURES
Percent Passing CWC Quality Questions Mean Time (Minutes)
StateTransferAccuracy
BillingAccuracy
ReimbursementAccuracy Transfers Billings Reimbursements
California 99.0 100.0 86.4 7.7 3.7 6.1
Illinois Missing 94.0 92.5 Missing 11.9 5.3
Kansas 95.0 98.3 100.0 10.3 9.5 10.9
Missouri 99.0 100.0 99.0 14.6 21.3 21.2
New Hampshire 93.3 78.3 78.9 14.8 20.1 13.6
Wisconsin 98.0 96.5 95.0 11.0 15.0 10.2
NOTE: Based on quality review samples for 6/30/93 to 6/30/94. [or one-tailed] test.

99
of wages was a manual process and all wage transfers were subject to delays. The PMR Wage Transfer Time
Lapse and Quality measures are described in Figures IX.1 and IX.4.
Data on the timeliness of CWC transfers are reported in Table IX.1. These data show that four of the five
States meet the current Desired Level of Achievement (DLA), which requires that 75 percent of wage transfers
occur within seven days. The one exception is New Hampshire, which processes requests manually.
The CWC guidelines set a 7-day standard for transfer for wage-reporting States and a 14-day standard for
wage request States or for transfers to States with more current base periods, but the 7-day standard for wage-
reporting States is no longer appropriate because of automation. Wage transfers normally occur within 24 hours
of the request, depending on the time received (requests received on a Friday may not be transferred until
Monday). Wage transfer requests may not normally be subjected to human handling. If there was no human
handling at all, this measure would simply capture weekend and holiday delays and periods of Internet, or
transfer of State hardware or software failure (for example, inaccessibility of the wage file). When the
requesting State has a current base period, however, the transferring State must handle the request manually and
contact employers. Because it is important to claimants for such wage requests to be processed promptly, the
wage transfer measure as currently designed is appropriate for this relatively small subset of the wage transfer
population. In the absence of a thorough quality assessment, however, it is likely that the State that expends
the least effort (by sending one or more "complete" responses that do not satisfy the request and forcing the
claimant to send wage stubs [IB-13] through the mail), will score higher than a State that expends greater effort
to find the correct wages and does not send a "complete" response that is really incomplete.
The PMR Wage Transfer Quality measure would, in theory, fail a case for which a wage transfer marked
"complete" did not reflect the total wages earned by the claimant. States may be judging the accuracy of the
transfer based on wages available to the State at the time the transfer was made (thus ignoring the fact that the
wage request was not thorough). Moreover, the quality sample is currently so small (80 cases per year), that
it might be ineffective in detecting cases of insufficient research. It is also not clear whether States should be
evaluated for their effort to find all appropriate wages, because under certain conditions such effort is inefficient
and should not be encouraged. One solution would be to select a stratified sample of transfer to evaluate for
quality. If one half of the sampled cases had wage transfer timelapse greater than seven days, a more definitive
assessment of quality would be a possibility. Given the limited value of the findings and the cost of creating
quarterly Internet wage transfer archive files and matching responses to requests to calculate time lapse,
increasing the quality sample sizes to improve the quality assessment precision is not warranted.
100
It is possible that some States do not have a thorough process for requesting wages and responding
promptly. The California CWC system requires manual review of all wage transfer requests to ensure that
information provided in the "Comments" section of the IB-4 has been used if appropriate. California
automatically refers wage request cases to a unit that contacts employers by telephone. Other PMR states also
use an "exception processing" approach to responding to requests from States with current base periods and
computer-generate wage request letters to employers. Because the time lapse measure penalizes States that may
be more thorough in wage requests, we recommend that the UIS consider establishing an annual process
evaluation (in conjunction with other "validation" activities) to determine whether States have established
appropriate procedures to meet the needs of CWC claimants.
The wage transfer environment is still evolving toward automation. A new Internet capability (Claimnet)
has been provided to States so other States can directly research wage files. This would eliminate futile wage
requests (no request would be submitted if the requesting State queried the transferring State's file through
Claimnet and found no wages). Because of such automation enhancements and the trend toward fewer wage
request States, there will be increasingly less need for measuring wage transfer promptness and quality.
Wisconsin generated a breakout of its wage transfer performance for the first field test quarter and found that
90 percent of transfers made between 8 and 14 days were to wage request States.
The current time lapse measure requires 53 separate archiving and processing programs to be designed,
written, tested, validated, and run on a quarterly basis. A more efficient and accurate approach may be to have
the Internet System capture the time lapse centrally. The system would still have to create a large centralized
archive of transfer requests and responses and conduct a massive sort of the files each quarter to create matches
and calculate time lapse. This would still be a large job, but would be more efficient than conducting this same
process with 53 separate systems. This option should be explored.
B. BILLING TIME LAPSE AND QUALITY
These PMR measures are described in Figures IX.2 and IX.4. The data on billings timeliness suggests that
States do all their billings at one time. Three States did all their billings within 45 days in all five quarters. One
State did all its billings within 45 days in three of the five quarters, and one State failed to bill within 45 days
in any quarter (Table IX.1).
There is virtually no cost to States for producing the billing time lapse measure. Only one time lapse
calculation is required (days from end of prior quarter to day bills are sent). Unless there is a performance

101
problem worth measuring, however, this measure may not be justified. Kansas has had a severe billing problem
(which PMR may help alleviate by measuring billing time lapse). If other States do not meet the current
standards, this measure should be retained, although it could be modified to sample claimants and not bills (as
is done in the current QA measure.)
The billing quality measure has not proved very useful in detecting performance problems. When bills
were generated manually, this measure may have been more appropriate. Bills are now generated by computer.
If the computers are programmed accurately, the bills should be accurate, although inconsistent data or minor
programming errors could result in a small portion of the bills being erroneous. Table IX.2 shows that
California and Missouri have detected no erroneous billing amounts (California samples 100 claimants).
Illinois, Kansas, and Wisconsin have detected minor billing errors. Only New Hampshire has detected more
than 20 percent billing errors. It is difficult to say whether these isolated errors should result in management
intervention. If not, and if the other 47 States have the same performance, there seems no justification for
retaining this measure. The mean time spent on billing quality varied from 4 minutes per case to 21 minutes
per case. The average was a little under 14 minutes per case. At 80 cases per year, this is less than one full staff
day per year.
An issue exists about the appropriate sample frame for the billing quality assessment. California samples
from the outgoing IB-6. Other States sample from the claims file. In the first approach, amended bills created
by recomputed claims amounts and State shares are added to the sample. The claims file sample has the added
value of catching errors that occur when the charges for a claimant are not billed at all. Checking the quality
of recomputed billing amounts potentially poses a complex quality assessment process. Sampling from the
claims file is more straightforward because the time period being billed for is clear.
C. CWC REIMBURSEMENT TIME LAPSE AND QUALITY
The CWC Reimbursement Time Lapse measure was respecified prior to the pretest period to measure the
gap from the receipt of the bill to the day that the following two conditions were met: 1) the bill was paid in
the full amount owed; and 2) any disputes about the correct amount owed for each claimant on the bill were
resolved (Figure IX.3). The latter stipulation was resisted by some States. They maintained that SESA had no
control over the resolution of disputes with other States and that the States should be given credit for paying
the bill even when disputes existed. All States except Wisconsin have adopted the PMR approach. Concern
about a high percentage of unresolved bills is borne out by the PMR data. In Illinois, California, and New

102
Hampshire, a high percentage (20 percent to 70 percent) of bills are not resolved within 90 days. Kansas has
resolved its bills more quickly, but has few bills with large numbers of claimants. This is not a difficult measure
to implement or maintain monthly, and it does show a problem, so we recommend keeping it. It may be more
thorough to measure time lapse from both the date that complete payment was made and the resolution date.
Reimbursement Quality measure is essentially a proofreading check on other States' billing errors (Figure
IX.4). The IB-6 format includes the amount paid to the claimant and the amount owed by the paying State. The
quality assessment then determines if the billed amount is correct based on the amount paid to the claimant and
the proportion of the claim for which the billed State is liable from the IB-5. Some bills do not contain the
amount paid to the claimant, however, so the only check that can be made is to determine if the State has been
billed more than its share of the maximum benefit amount. For some claimants, no amount is paid because the
bill is amended from a prior period due to a recomputation.