performance measurement at dhl solutions1027664/fulltext01.pdf · master’s thesis 2004:294 civ...
TRANSCRIPT

MASTER’S THESIS2004:294 CIV
TOMAS STEFENSON
Performance Measurementat DHL Solutions
Towards an improved performance measurement systemconsisting of relevant and well-designed measures
MASTER OF SCIENCE PROGRAMME
Department of Business Administration and Social Sciences Division of Industrial Logistics
2004:294 CIV • ISSN: 1402 - 1617 • ISRN: LTU - EX - - 04/294 - - SE

ii
PREFACE
“Most company performance yardsticks [i.e. measures] are too short, too rigid, or used more like a teacher’s ruler – to whack rather than to motivate. The time is long overdue to replace these outdated yardsticks with a more dynamic measurement system that motivates continuous improvement in several dimensions of performance simultaneously.”
(Lynch and Cross, 1995) This paper is the primary result of my Master’s Thesis work carried out at DHL Solutions in Sweden during the summer and fall of 2004. It will also mark the closure of my Master of Science Program in Industrial Management and Engineering, with focus on Industrial Logistics, at Luleå University of Technology. For assistance and support I would like to thank my supervisors at DHL Solutions, Linda Johannesson and Daniel Gartell. They have contributed to the completion of this Master’s Thesis in an excellent manner. Furthermore, I would like to express my gratitude towards the sponsors of the project, Owe Norberg and Kurt Liljergren, who gave me the opportunity to set out on this journey. My gratitude also goes to Kerstin Lindström, who put me in contact with these persons. At DHL Solutions, I would also like to thank all the interview respondents at operating units and headquarters as well as all personnel who have contributed to my work in many different ways. Without you this paper would not have been completed. I would also like to show my gratitude to my supervisor at Luleå University of Technology, Torbjörn Wiberg, who supported me on academic matters when I needed it the most. Finally, my thoughts of gratitude go to my mother for help with proofreading and to the rest of my family as well as my girlfriend for support and assistance on all matters. Luleå University of Technology 2004-12-10 ___________________________________ Tomas Stefenson

iii
ABSTRACT
During the past decades, the competition for many businesses has moved from just being based on price to include such factors as: quality, service innovation and flexibility. Managers keep track of the performance on such factors by means of performance measurement. This process is a way of measuring how well the organization carries its strategies and objectives into effect. Since the environment has changed and strategies have changed with it, many companies need to redesign their existing performance measurement systems with respect to the objectives they follow today. This thesis is carried out at DHL Solutions in Sweden and aims at improving their current view on performance measurement, their performance measurement system and instituted individual measures by conceptualizing the existing theories on the subject and adjusting them to fit the situation in the organization. The most fundamental recommendation on the subject presented in the literature is that performance measures should be directly derived from the current strategies followed. Also, the entity of individual measures should be integrated in a balanced system where managers monitor multiple dimensions of performance simultaneously. These two recommendations are the underlying principles of this thesis. In the Swedish organization of DHL Solutions, there are many weaknesses in the current performance measurement process. Including: weak relationships between measures and overall strategies; ill-defined dimensions of performance (such as productivity and quality); lack of system-view on the issue of performance measurement (i.e. an unbalanced system); and the fact that individual measures are not always well-designed. To overcome these flaws in the present performance measurement process, this thesis puts forward four recommendations for DHL Solutions to follow in order for them to improve this whole process. Recommendations one and two argue that they should integrate a systematic process for strategic management in their organization where strategies and objectives are formulated and translated into operationally relevant actions (including a tailored measurement package for tracking the progress of the selected strategies). The third recommendation states that DHL Solutions in Sweden should use the so called performance pyramid as a framework for the integration of performance measures in a balanced system. Finally, the fourth recommendation states that they should make use of the performance measure record sheet as a means to ensure that all instituted as well as new individual measures are relevant and well-designed.

iv
TABLE OF CONTENTS
PREFACE .............................................................................................................................. II
ABSTRACT ..........................................................................................................................III
TABLE OF CONTENTS.....................................................................................................IV
LIST OF FIGURES .............................................................................................................VI
LIST OF TABLES ...............................................................................................................VI
TERMINOLOGY AND ABBREVIATIONS .................................................................. VII
1. INTRODUCTION.......................................................................................................... 1 1.1 INTRODUCTION............................................................................................................................................... 1 1.2 BACKGROUND ................................................................................................................................................ 1 1.3 PURPOSE ......................................................................................................................................................... 2 1.4 DELIMITATIONS.............................................................................................................................................. 2 1.5 PROBLEM DISCUSSION ................................................................................................................................... 3 1.6 OUTLINE OF THE THESIS................................................................................................................................. 3
2. METHODOLOGY......................................................................................................... 5 2.1 RESEARCH APPROACH.................................................................................................................................... 5 2.2 LITERATURE REVIEW ..................................................................................................................................... 5 2.3 DATA COLLECTION ........................................................................................................................................ 6
2.3.1 Primary Data ......................................................................................................................................... 6 2.3.2 Secondary Data ..................................................................................................................................... 7
2.4 WORKING PROCESS ........................................................................................................................................ 7 2.5 METHODOLOGY DISCUSSION ......................................................................................................................... 8
3. THEORY....................................................................................................................... 10 3.1 EXTERNAL BUSINESS ENVIRONMENT .......................................................................................................... 10 3.2 CORPORATE AND BUSINESS STRATEGY ....................................................................................................... 11 3.3 INTERNAL BUSINESS ENVIRONMENT ........................................................................................................... 13 3.4 PERFORMANCE MEASUREMENT ................................................................................................................... 13
3.4.1 Performance Measures........................................................................................................................ 15 3.4.2 Performance Measurement Systems ................................................................................................... 18 3.4.3 Productivity.......................................................................................................................................... 24
4. THEORETICAL FRAME OF REFERENCE .......................................................... 27 4.1 PERFORMANCE MEASUREMENT AT THE MACRO LEVEL.............................................................................. 27 4.2 PERFORMANCE MEASUREMENT AT THE MICRO LEVEL............................................................................... 28
5. THE ORGANIZATION UNDER INVESTIGATION ............................................. 30 5.1 THE CORPORATION – DHL EXPRESS AND LOGISTICS ................................................................................. 30 5.2 THE BUSINESS AREA – DHL SOLUTIONS..................................................................................................... 30
5.2.1 Operating Unit A ................................................................................................................................. 32 5.2.2 Operating Unit B ................................................................................................................................. 32 5.2.3 Operating Unit C................................................................................................................................. 33 5.2.4 Operating Unit D................................................................................................................................. 34
6. EMPIRICAL FINDINGS ............................................................................................ 35 6.1 DHL SOLUTIONS’ EXTERNAL ENVIRONMENT ............................................................................................. 35 6.2 CORPORATE AND BUSINESS STRATEGY AT DHL SOLUTIONS ..................................................................... 36 6.3 DHL SOLUTIONS’ INTERNAL BUSINESS ENVIRONMENT.............................................................................. 37
6.3.1 The Warehousing Process ................................................................................................................... 38

v
6.4 PERFORMANCE MEASUREMENT AT DHL SOLUTIONS ................................................................................. 40 6.4.1 Performance Measures at DHL Solutions .......................................................................................... 42 6.4.2 The Performance Measurement System at DHL Solutions ................................................................ 44 6.4.3 Productivity Measurement at DHL Solutions ..................................................................................... 45
7. ANALYSIS.................................................................................................................... 48 7.1 ANALYSIS OF THE CURRENT SITUATION...................................................................................................... 48
7.1.1 Strategic Management......................................................................................................................... 49 7.1.2 View on Performance Measurement ................................................................................................... 51 7.1.3 The PM-system .................................................................................................................................... 52 7.1.4 Instituted Individual Measures............................................................................................................ 56
7.2 SUMMARY OF MAIN WEAKNESSES AND FLAWS .......................................................................................... 59 7.3 A NEW PERFORMANCE MEASUREMENT REGIME......................................................................................... 61
7.3.1 Implications for the Organization....................................................................................................... 68 8. CONCLUSIONS........................................................................................................... 69
8.1 GENERAL CONCLUSIONS.............................................................................................................................. 69 8.2 THE PERFORMANCE MEASUREMENT PROCESS ............................................................................................ 69
9. RECOMMENDATIONS ............................................................................................. 71 9.1 FOUR GENERAL RECOMMENDATIONS.......................................................................................................... 71
9.1.1 Implement Strategic Management in DHL ......................................................................................... 71 9.1.2 Develop an Operating Plan for DHL Solutions in Sweden................................................................ 71 9.1.3 A Framework for a PM-system at DHL Solutions in Sweden ............................................................ 72 9.1.4 Establish Guidelines for Individual Measures.................................................................................... 74
10. DISCUSSION ........................................................................................................... 76 10.1 EXTERNAL ENVIRONMENT AND PLANNING HORIZON ............................................................................... 76 10.2 HOW TO USE THE RECOMMENDATIONS? ................................................................................................... 77 10.3 CUSTOMER SATISFACTION – A WIDER PERSPECTIVE................................................................................ 78
LIST OF REFERENCES .................................................................................................... 80
APPENDICES ...................................................................................................................... 84 INTERVIEW GUIDE, HEADS OF DIVISIONS.......................................................................................................... 85 INTERVIEW GUIDE, DIVISION CONTROLLERS .................................................................................................... 88 INTERVIEW GUIDE, HEADS OF OPERATING UNITS............................................................................................. 90 ELEMENTS IN THE PERFORMANCE MEASURE RECORD SHEET........................................................................... 92 THE RECORD SHEET FOR MEASURES USED AT DHL SOLUTIONS ..................................................................... 94 MEASURES MONITORED AT DHL SOLUTIONS IN SWEDEN................................................................................ 98 DEVELOPMENT OF AN OPERATING PLAN ........................................................................................................... 99 GENERIC STRATEGY OPTIONS FOR THE OPERATING PLAN.............................................................................. 106 DEFINITIONS IN THE PERFORMANCE PYRAMID FOR DHL SOLUTIONS ............................................................ 117 CUSTOMER SATISFACTION AT DHL SOLUTIONS ............................................................................................. 122

vi
LIST OF FIGURES
Figure 2.1 Working process............................................................................................... 7 Figure 3.1 Strategic management .................................................................................... 12 Figure 3.2 Strategy-specific performance measures........................................................ 20 Figure 3.3 The performance pyramid .............................................................................. 21 Figure 3.4 Relationships between operating measures and financial results................... 26 Figure 4.1 Theoretical frame of reference for the macro level........................................ 28 Figure 4.2 Theoretical frame of reference for the micro level......................................... 29 Figure 5.1 Organizational structure at DHL and DHL Solutions .................................... 31 Figure 6.1 Simplified flow chart for the warehousing process........................................ 39 Figure 6.2 Four groups of measures at DHL Solutions ................................................... 42 Figure 6.3 Distribution of costs between different resource inputs................................. 47 Figure 7.1 A distorted performance pyramid at DHL Solutions ..................................... 53 Figure 7.2 A new view on objectives setting and measurement feedback ...................... 62 Figure 7.3 DHL Solutions’ vision.................................................................................... 64 Figure 7.4 Generic strategies for the Swedish organization ............................................ 65 Figure 7.5 Feedback through measures to central levels ................................................. 65 Figure 7.6 Strategies and objectives for the core processes at operating units................ 66 Figure 7.7 Feedback through measures on core process performance ............................ 66 Figure 7.8 Generic strategies and objectives for the operational level ............................ 67 Figure 7.9 Feedback through operational measures to operating unit managers............. 67 Figure 9.1 How DHL Solutions should use the performance measure record sheet ....... 75 Figure 10.1 A probability/impact-matrix for the recommendations.................................. 77 LIST OF TABLES
Table 3.1 Recommendations with regard to the design of performance measures ............ 17 Table 3.2 The performance measure record sheet.............................................................. 17 Table 6.1 The reasons why managers at DHL Solutions measure performance................ 42 Table 7.1 SWOT-analysis of the present strategic management process........................... 60 Table 7.2 Main weaknesses and flaws with the present PM-process................................. 61

vii
TERMINOLOGY AND ABBREVIATIONS
Business Strategy Strategies for each strategic business unit derived from the corporate strategy.
Operating Unit For the purpose of this thesis, an operating unit (or simply a unit) is one of the 18 warehouses in Sweden.
Client In this paper, the clients are DHL Solutions’ customers.
Corporate Strategy The overall strategy for the whole corporation (in this case DHL Express and Logistics).
Customer For the purpose of this thesis, a customer is the client’s customer. That is, the receiver of goods.
General Thrusts Any general courses of actions a company takes in order to move towards a new position (irrespective of how these have been formulated or developed).
Headquarters If nothing else is said this denotes the Swedish headquarters in Stockholm.
KPI Key performance indicator Long-Term A time horizon over 3 years. Managers All employees in the Swedish organization with a
functional or organizational responsibility. These are represented at multiple levels in the organization (i.e. managers at headquarters or operating unit managers).
Medium-Term A time horizon between 1 and 3 years. Objectives The mid- to long-term goals the company tries to
achieve (either by use of strategic management, or not).
Operating Plan The translation of the business strategy into a set of activities and objectives.
Order lines The number of order lines in a customer order is equal to the number of article types in that order.
Organizational Levels Individual level = Individual employees in Sweden. Operational level = Where work gets done; processes and departments in Sweden. Operating unit level = Operating units in Sweden. Local level = The whole Swedish organization with all its operating units. Regional level = The whole organization of the Nordic countries and UK. Corporate or top level =

viii
DHL Solutions whole organization (occasionally this denotes the whole organization of DHL Express and Logistics). Central level = Any organizational level above the operating unit level.
Partial Measures Measures on a dimension of performance that do not account for all aspects of the dimension connected to monetary terms.
PM Performance measurement PM-process The performance measurement process – The whole
issue of performance measurement integrating the view on performance measurement, the PM-system and individual measures.
SBU Strategic business unit – a definition in the discipline of strategic management for a part of the company which is not affected by strategies in other parts of the organization.
Short-Term A time horizon shorter than 1 year. Total Measures Measures on a dimension of performance which
reflects the whole dimension and cost decreases or cost increases for that dimension.
VAS Value added service

– INTRODUCTION –
1
1. INTRODUCTION This chapter begins with a short introduction to the problem area and then continuous with a brief description of the case study company, DHL Solutions, and a presentation of their specific problems. Further on, the purpose and delimitations of the thesis is presented and the disposition of the paper is outlined.
1.1 Introduction Tough global competition, product proliferation, shorter product lifecycles as well as advanced product and process technologies have forever changed the formula for success in business.1 During the last two decades service industries have been a sector of importance and growth in the Western economies as they operate in an increasingly competitive environment. Furthermore, the competition has long since changed from simply being based on price to be founded on a range of other complementary factors such as: quality; product and service innovation; and flexibility of response to customer needs. Managers of today have to develop strategies to be able to operate in these dynamic environments.2 The success and continuity of an organization depend on its performance, which may be defined as: The way the organization carries its strategies and objectives into effect. This requires that “all noses are pointing in the same direction”, as every person in the organization contributes to the company objectives via his or her activities. A good manager keeps track of the performance of the system he or she is responsible for by means of performance measurement (PM).3 Bititci et al. (1997) states that:
“The need for an integrated set of performance measures which supports rather than contradicts business objectives is clearly established.”
Since the business environment has changed and strategies have been altered accordingly, companies obviously need to overlook and modify their existing view on performance measurement in order to align it with the thrusts and objectives of the new business era.
1.2 Background DHL Solutions is one of four business areas in the global corporation DHL Express and Logistics. They are primarily focused on third-party logistics 1 Lynch and Cross (1995) 2 Fitzgerald et al. (1996) 3 Flapper et al. (1996)

– INTRODUCTION –
2
(3PL); which means that they offer to manage the whole supply chain after production for their clients. This includes services such as: warehousing, inventory management and transportation management. See chapter 5 for a more detailed presentation of the organization under investigation. DHL Solutions in Sweden has not put enough effort on a comprehensive redesign of their PM-system according to their present reality. Moreover, they have seen many organizational changes during the past decade, including changes of: corporate owners; reporting and information structure; organizational culture; and management at top level. DHL Solutions have also taken over some smaller businesses during these years. These factors, in combination with a complex network of corporate directives as well as local and central initiatives, have resulted in a situation where DHL Solutions in Sweden have an out-of-date PM-system consisting of a hodgepodge of numerous individual measures. Also, questions of what measures to focus on are frequently raised and managers in the organization experience that their present view on the PM-process have some shortcomings. Therefore, managers at DHL Solutions’ headquarters in Sweden have decided that a master’s thesis is to investigate how they can overcome these flaws in their PM-process. This leads to the purpose of this thesis stated below.
1.3 Purpose The purpose of this master’s thesis is to evaluate the view on performance measurement, the present PM-system and instituted individual measures at DHL Solutions in Sweden and then provide a comprehensive solution for how they can improve these elements of their organization.
1.4 Delimitations This thesis is limited to concern the Swedish operations of DHL Solutions only. Furthermore, deeper investigations of operating units (i.e. warehouses) are only carried out at four of the 18 units. In the study of the existing individual measures, the work will concentrate on the measures operating unit managers use for there own operations management and how the data for these measures are generated; but also on how these measures are aggregated into total operating unit measures to be reviewed by headquarters. However, the thesis will not give any recommendations on how the operating units should monitor individual client assignments.

– INTRODUCTION –
3
1.5 Problem Discussion When regarding the present problems in DHL Solutions’ Swedish organization as well as the actual purpose of this thesis a number of particularly interesting problem areas can be defined. To be able to achieve the ultimate purpose and improve DHL Solutions’ PM-process these problem areas, or questions, needs to be answered in this paper. The questions are:
1. What is performance measurement? a. Research and knowledge of individual performance measures. b. How can a set of measures be integrated in a PM-system?
2. How do different characteristics of an organization affect PM? a. External environment. b. Corporate and business strategy. c. Internal environment.
3. What is the present situation at DHL Solutions (Sweden) regarding PM? a. Culture, policies and guidelines. b. What individual performance measures are instituted today and
how are these measures designed and used? c. Are these measures integrated in a PM-system and if so, how is
this system designed? 4. What kind of organization is DHL Solutions (Sweden) with regard to the
characteristics that affect performance measurement (see paragraph 2)? 5. What are the main weaknesses and flaws instituted in the existing PM-
process at DHL Solutions in Sweden? a. View on performance measurement. b. Design and use of individual measures. c. The integration of these measures into a PM-system.
6. How can DHL Solutions in Sweden overcome these flaws in the future?
1.6 Outline of the Thesis This master’s thesis is divided into ten chapters. The contents of the chapters are briefly outlined below. Chapter 1 Provides the background to the problem area, purpose,
delimitations and problem discussion. Chapter 2 Explains the research methodology used and presents a
discussion on methodological problems as well as weaknesses and strengths in the study.
Chapter 3 Forms the theoretical base of research knowledge on which the thesis rests.

– INTRODUCTION –
4
Chapter 4 Presents a frame of reference of the theories most important to this thesis and a discussion on how they are correlated.
Chapter 5 Provides a detailed presentation of the case study company. Chapter 6 Describes the current situation at the case study company and
the empirical findings of the study. Chapter 7 Contains an analysis of the empirical results with regard to the
theoretical frame of reference; including a development of a new performance measurement regime.
Chapter 8 Summarizes the conclusions that can be drawn from the analysis.
Chapter 9 Contains recommendations regarding how the case study company should pursue with further actions.
Chapter 10 Ends the thesis by providing a discussion on the conclusions and recommendations presented.

– METHODOLOGY –
5
2. METHODOLOGY In this section, the methodological approach to the project and the means of data collection are presented. This section also contains a discussion of the strengths and weaknesses of the study.
2.1 Research Approach This thesis may be seen as a combination of a research project and a development project. The former because there were some formalities that had to be followed regarding scientific standards and research methodology brought upon by the university. The latter because the real purpose of the study was to develop the organization under investigation by using existing knowledge, not to find generalized knowledge for the use by whomever.4 Although, this thesis was aimed to evaluate the major weaknesses with the PM-process at DHL Solutions and result in a greater understanding of the subject, its primary purpose was to generate a set of recommendations for the company to follow. Therefore, the level of ambition for the study was normative. That is, it seeks a new norm to follow which hopefully, will lead to a healthier and more successful organization.5 The general research approach for the study was qualitative. A qualitative study is one where the major purpose is to understand the reality in a holistic way, not to prove specific phenomena.4 In a qualitative approach one tries to identify a phenomenon by examining the characteristics of it.5 To reach the purpose of the thesis, a case study methodology was adopted; with parts of DHL Solutions in Sweden as the objects of investigation. A case study is an attempt to take knowledge from a specific, limited part of a problem area and then use this knowledge to explain the whole problem area. In this type of methodology it is imperative to carry out a thorough and objective selection of the parts that are to be investigated. One major danger with the case study approach is that limiting the investigation to only concern a small part of the problem area will result in that the generalized conclusions drawn might not be representative for the whole problem.6
2.2 Literature Review To establish a theoretical base, with which empirical findings could be compared in an analysis, the author of this thesis carried out a comprehensive 4 Homepage – www.infovoice.se/fou/ 5 Wallén (1996) 6 Ejvegård (1996)

– METHODOLOGY –
6
literature review. Several databases were used to find relevant literature (primarily books on the subject and peer-reviewed articles published in academic journals). The most frequently used databases were: Substansen (for books at The University of Stockholm), Libris (for books in most of the libraries in Sweden), Emerald and Business Source Elite – Ebsco (for journal articles). Additionally, literature was found via references in the articles downloaded from these databases and in the possession of the author of this thesis. Examples of keywords used in the search were: Performance Measurement, Productivity and Third-Party Logistics.
2.3 Data Collection The collection of data that was analyzed together with the theories obtained can be divided into two types. Primary data is data that was directly collected by the researcher in order to meet the purpose of the project. Secondary data, on the other hand, is data that had been collected prior to the start of this project for a purpose other than the project at hand.
2.3.1 Primary Data The major source of data, that the analysis of the situation at DHL Solutions was based on, was data obtained through a combination of structured and unstructured interviews. These interviews were made in person with a selected population of respondents in the company under investigation. The structured interviews followed prepared interview guides specific for the respondents’ management position (the guides are presented in appendices 1-3). The unstructured interviews, on the other hand, were more like informal conversations with observations of the processes at hand. The selection of respondents was carefully carried out in close agreement with the supervisors at the company. Deeper investigations with the use of structured as well as unstructured interviews with managers were undertaken at four of the 18 operating units and at the Swedish headquarters. According to the sponsors and supervisors of this project, these four units constitute a good representation of the whole Swedish organization. In the research of performance measurement at the company, different dimensions of performance were equally investigated, with exception of the productivity dimension, which was examined in more detail. This was due to the fact that the project had started out with a focus on productivity. However, in the end the deeper investigation of the productivity dimension was seen as an example study of one of several dimensions of performance. The results from the investigation of the productivity concept was somewhat generalized to concern performance measurement as a whole. Also, for the performance

– METHODOLOGY –
7
dimension of customer satisfaction a brief benchmarking session was carried out. Basically, this was a half-day visit to the consultancy firm CFI Group in Stockholm. CFI Group is primarily focused on the business of consulting organizations on the measurement of customer satisfaction; and based on this they help organizations to formulate strategies to optimize the customer satisfaction dimension and in the long run to enhance profitability.
2.3.2 Secondary Data In addition to the interviews the thesis also considered data collected from DHL Solutions’ business systems and previously documented material. The main source of secondary data was the Excel-files used for data collection and reporting of measures at the operating units.
2.4 Working Process The main activities of the working process used to achieve the purpose of this thesis are presented in Figure 2.1.
Figure 2.1 Working process (Source: Author’s own construct)
Interviews with Heads of
Operating Units
Observations and unstructured
interviews
Literature review
Interviews with Heads of Divisions
Conclusions
Present a set of recommendations, including a framework for performance measurement, for DHL Solutions
Empirical Findings Theories
Analysis
Explore the strengths and weaknesses with the
present performance measurement system
Matching between organizational type (external environment, internal
environment, corporate strategy) and the way of measurement

– METHODOLOGY –
8
The first part of the project time, apart from problem specification, was dedicated to the empirical study and the literature review, which were carried out simultaneously. Subsequently, the results from these activities were cross-analyzed. This enabled an assessment of strengths and weaknesses with the present measurement system as well as a matching between this system and the characteristics of the external environment, corporate and business strategy and the internal environment. The conclusions drawn from this analysis constituted the foundation for the development of a set of recommendations for DHL Solutions to follow in order for them to improve their current performance measurement process. The formulation of the recommendations, including a tailored measurement framework, required a new review of relevant literature before they were presented to the company.
2.5 Methodology Discussion When deciding on what research approach to use in this master’s thesis, the fundamental determinant was whether the purpose should be to develop new individual measures on for example the productivity dimension; or if it should be to enhance organizational learning on the whole concept of performance measurement. The former implies that a quantitative approach should be used with a more mathematical or statistical experiment methodology. The latter, on the other hand, implies that a qualitative approach should be used with a methodology where the problem is attacked on a higher organizational level; where functions and employees interact in a complex and unpredictable way. Since the ultimate purpose of this project was to improve DHL Solutions’ overall PM-process the research approach used was obviously qualitative. At the outset of a project one also needs to reflect on what research methodology to use. In this master’s thesis the primary choice stood between the case study methodology (where one studies a limited part of a problem in order to enhance knowledge on the whole problem area) and the survey methodology (which is based on data collection by using questionnaires on a wide front in order to enable statistical comparisons). However, after some consideration the most obvious research methodology to use for this project was the case study methodology. Surveys are primarily used in the quantitative research area and would be too limited to use for this situation, since the purpose and the objectives of a qualitative study need to be somewhat flexible. That is, to be able to deliver satisfactorily, a set of recommendations to the company under investigation one must be able to slightly change the focus of the data collection during the project. This is also the reason why qualitative researchers seldom formulate clearly defined hypotheses to be tested in the research.

– METHODOLOGY –
9
Irrespective of what methods for data collection that are being used, the information gathered must always be criticized and regarded in a wider perspective. In a research project, this can be accomplished by using the concepts of reliability and validity. Reliability is a measure of the precision of a data collection methodology. It measures to what extent the instrument or procedure would generate the same results if repeated under similar circumstances. Validity, on the other hand, is a measure of the relevance of a data collection methodology. It should answer the question: Are instruments and procedures measuring what they are supposed to measure? 7 In order to improve the probability of reaching high validity in the study, data was collected from multiple sources in the organization. Information was gathered primarily by structured interviews, but also by observations of the processes and from documentations and data files. Also, data collection was carried out at more than one management level of the company, which enhanced the probability of reaching a comprehensive understanding of the present situation by enabling an analysis of the congruency between different data sources. Since there are trade-offs between validity and reliability in the interview situation (i.e. structured interviews enhances the reliability whereas unstructured interviews results in a higher validity), the interview guides needed to be carefully designed. For this project, a mix of open-ended and closed questions was used. Since the interviews were conducted in Swedish there was a risk of translation errors in the results presented. This risk was minimized by letting the respondents read and correct the empirical results before moving on to the analysis of these results. Although, the case study approach could perhaps have been used with more care, the major weakness of this thesis does not lie in the methodology used. Rather, it is the delimitation of the problem area that will primarily have a negative effect on a successful implementation of the recommendations presented in this paper. This is largely due to the characteristic of strategic management and performance measurement as being complex and comprehensive issues. All levels of the organization (also including those not regarded in this project) will affect and be affected by these two issues. Therefore, a successful execution of the recommendations is dependent on how effectively the Swedish organization can demarcate themselves from the rest of the organization. 7 Bell (2000)

– THEORY –
10
3. THEORY This section consists of the wide array of theories obtained from the literature review. The presentation starts with overall theories affecting the subject and ends up with the more specific concept of productivity.
3.1 External Business Environment Since the beginning of the 90’s, it has been more clearly recognized that performance measurement system design depends on three interacting variables. These variables are an organization’s external environment, its chosen corporate and business strategy, and its internal environment.8 This section and sections 3.2 and 3.3 will briefly explain these variables. The external environment of an organization includes variables such as: the state of the macro economy; the degree of government regulation; and the interplay of Porter’s “Five Forces”.8 The first two of these variables can be analyzed in an environmental scanning process on the four elements known as the STEP-elements. These elements are: 9
• Sociocultural environment: Including the demographic structure of markets, as well as attitudes and opinions of customers.
• Technological environment: This element involves the innovation of new technologies affecting products, processes, distribution or administration.
• Economic and competitive environment: Macro- and micro-economic conditions which affect the structure of competition.
• Political and legal environment: This element covers the external forces covered by governments or trade associations.
The Five Forces Model is more oriented to the process of competitor analysis. The model is a useful starting point in this process as it enhances the understanding of the competitive environment at the macro level. The Five Forces to analyze are: 9
• The bargaining power of suppliers • The bargaining power of customers • The threat of new entrants (i.e. new competitors on the market) • The threat of substitute products and services • The rivalry among current competitors
8 Brignall and Ballantine (1996) 9 Brassington and Pettitt (2000)

– THEORY –
11
3.2 Corporate and Business Strategy To achieve the ultimate goal of this master’s thesis, the analysis of the present situation as well as the recommendations themselves must partly be based on the wide concept of strategic management. The discipline of strategic management is an organizational and management process incorporating such elements as individual strategies, strategic thinking, strategic planning and strategy implementation. In strategic management, the aim is to ensure that management continuously set and achieve appropriate strategic objectives. In this context, appropriate means objectives and strategies that reflect the following three realities: 10
• The aspirations and expectations of the leadership • Circumstances and trends in the external environment (e.g. marketplace-,
competition- and STEP-factors), and the organization’s competitive position within that environment
• The organization’s capabilities to successfully carry out the strategies selected
In large enterprises, which are competing in more than one type of business, strategic management operates at two distinct levels. At the highest (corporate) level, strategic management is the process by which the management of a multi-business creates its future through structuring and managing the portfolio of businesses. At the next (individual business) level, strategic management is the process by which management creates the future of the business through setting long-term objectives, formulating a plan to accomplish these, and then achieving the sustained focus required to realize the desired outcomes.10 In summary, there are four principal parts of the strategic management process (see Figure 3.1). First, corporate top management formulates a strategy for the enterprise as a whole stating the general path to follow (i.e. definition of businesses, general strategies and preliminary resource allocations). This is known as the corporate strategy. Second, each business area, or in other ways defined parts of the enterprise (commonly denoted Strategic Business Units, SBUs), formulate their own strategic plan (their business strategy) based upon the knowledge established during the first step. When consensus between these two parts of the process has been attained, each SBU can continue by translating their generic SBU-strategy into an operating plan with clearly defined action steps. This enables the SBU to successfully implement each selected strategy on the operational level. Finally, the implemented strategy needs to be aligned with organizational systems such as budgets and 10 Judson (1996)

– THEORY –
12
information systems. Basically, the effectiveness of the strategic management process depends on how closely management can align and make fit the four parts of the process mentioned above.10
Figure 3.1 Strategic management (Source: Interpretation from Judson, 1996)
The purpose of this thesis implies that the focus on strategic management can be limited to only concern the last two parts of the process – the operating plan and organizational systems (particularly the connection to performance measurement) – when it comes to subsequent investigations on the subject. Where the business strategy is oriented primarily to the firm’s external environment and typically has a long time horizon, the operating plan is more focused on the internal environment and addresses organizational changes required to achieve the strategic business objectives. The operating plan helps management drive strategic implementation by stimulating cross-functional understanding, specifying the resources required, establishing commitment among the employees and lay out the processes for measuring and monitoring progress. See appendix 7 for a comprehensive explanation of how DHL Solutions can formulate an operating plan (including a tailored performance measurement system) based upon their generic business strategy.10
Market Strategy Another interesting aspect of the strategy formulation-process on the macro level is the choice of market strategy. That is, on which markets and how does the company intend to compete? Fundamentally, the objectives of a market strategy are to create superior customer value and to create economic value for
Corporate Strategy
Business Strategy (Each SBU’s strategic plan)
Performance Measurement
Budgets Reward Systems Information Systems and Communication
Operating Plan
Organizational Systems

– THEORY –
13
the owners of the business. Although, the latter can be seen as a result of a strategy that succeeds in the former. Slater et al. (1997) presents four general market strategy types that corporations pursue in order to meet these objectives. In truth, few businesses follow a single strategy type. Most combine elements from two or three types, with one being dominant. The strategy types are:
• Product leaders: Companies with this strategy seek to identify emerging opportunities and continuously strive to develop and deliver new products that exceed existing performance boundaries. This is the strategy of companies such as Intel or Microsoft. The key task for product leaders is to maintain an environment where creativity can flourish.
• Customer intimacy: This is the strategy that is used by, for example, IBM. These kinds of companies concentrate their efforts on building strong relationships with a selected group of customers. The company has a deep understanding of customer needs and the customers, on the other hand, are willing to pay a higher price for the service or special attention they receive. Accompanying this orientation is a focus on the lifetime value of a relationship, not just the profit of an individual transaction.
• Brand champions: The mass market counterparts of customer-intimate businesses. Companies such as Coca-Cola and Procter & Gamble invest heavily in advertising to build up the values of their brands. The foundation skills of brand champions are superior marketing capabilities.
• Operational excellence: The discipline of companies that offer the lowest total cost to their customers. These companies often have a strong commitment to standardization and simplicity, and it is common that they emphasize the use of information technology.
3.3 Internal Business Environment An organization’s internal environment encompasses such factors as the style of corporate/SBU relationship, the formal and informal organizational structure, the organizational culture and history, and the organization’s process type.8
3.4 Performance Measurement In a sense, all organizations measure performance. They may do it systematically and thoroughly, or on an ad hoc-basis and superficially, but they do it. The bottom line is that organizations have to track and monitor events to be able to know what they are doing. Or as Lord Kelvin (1824-1907) once put it:

– THEORY –
14
“When you can measure what you are speaking about, and express it in numbers, you will know something about it.”
Organizations measure performance for many different reasons. Some of the reasons may be to: 11
• Identify success • Identify if they are meeting customer requirements • Help them understand their processes: to confirm what they know or
reveal what they do not know • Identify where problems, bottlenecks or waste exist and where
improvements are necessary • Ensure decisions are based on fact, not on supposition, emotion, faith or
intuition • Show if improvements planned, actually happened
According to Neely et al. (1995) the level of performance a business attains is a function of the efficiency and effectiveness of the actions it undertakes. In this statement, efficiency is a question of doing the things right, whereas effectiveness is a question of doing the right things.12 With this in mind we can make the following definitions: 13
• Performance measurement: The process of quantifying the efficiency and effectiveness of actions.
• A performance measure: A metric used to quantify the efficiency and/or effectiveness of an action.
• A performance measurement system: The set of metrics used to quantify both the efficiency and effectiveness of actions.
One specific type of performance measures is the so called key performance indicator (KPI). A KPI is, as the name reveals, a performance measure that is a “key” to success for the organization. The KPIs are aggregated measures of performance that are important to the core competencies or critical to the competitiveness of an organization. The use of KPIs stems from the concept of critical success factors (CSFs), which were developed in the late 70’s. CSFs can be defined as: Those few critical areas where things must go right for the business to flourish.1 In other words, KPIs are the set of performance measures that a manager need to track to be able to know how the organization under his or her responsibility is functioning. 11 Parker (2000) 12 Vuorinen et al. (1998) 13 Neely et al. (1995)

– THEORY –
15
The academic literature on performance measurement is diverse, and different authors emphasize different perspectives of the topic. Although, one common recommendation among authors is that performance measures and performance measurement systems should be derived from corporate and business strategy. That is, there should be a closed management loop with the deployment of strategic objectives and the feedback through measures.8, 14, 15, 16, 17 and 18 Judson (1996) also promotes this idea by stating that performance measures and reporting systems established to track organizational performance are not strategically neutral. By this he means that every measure of performance, once instituted, focuses the attention of every manager and employee concerned on the issue that is being measured. Hence, what is being measured and tracked is signaled as important; to be given a higher priority than other matters. This is in fact one of the purposes of performance measures. Conflicts arise when there is little relationship between the aspects of organizational performance that are being measured, and the aspects that are critical to the successful execution of the strategy.
3.4.1 Performance Measures The concept of performance measurement has historically been focused on financial measures, such as sales turnover, profit and return on investment. However, traditional financial measures do not match entirely with the competencies and skills companies require to face today’s business environment.19 In fact, there has been a lot of criticism on the role of financial measures during the past two decades. This is primarily due to the fact that they reflect the results of management actions and organizational performance, not the cause of it.8 In other words, financial measures have a backward-looking focus. Furthermore, traditional measures have a tendency to focus on individuals or functions, rather than on the processes that are at the core or the organization as a whole. Additionally, traditional performance measures encourage a short-term vision due to their lack of strategic focus. Another dangerous shortcoming of financial measures is that they have a strong emphasis on control. This makes individuals more concerned with conforming
14 Bititci et al. (1997) 15 Neely et al. (1997) 16 Slater et al. (1997) 17 Sinclair and Zairi (2000) 18 Tangen (2003) 19 Kanji (2002)

– THEORY –
16
to standards than with continuously improving. As a consequence, they encourage local optimization.19 In order to meet this criticism on financial measures, a new way of looking at performance measurement was developed. Important works by R. S. Kaplan, among others, in the late 80’s and the early 90’s seriously changed the knowledge and practice of accounting and performance management.20 The emphasis now is to complement the financial measures with measures built around other perspectives as well. Or as Sinclair and Zairi (2000) puts it:
“Performance should no longer be measured by financial measures alone. A wider, more balanced range of measures is required. […] Measures should be used as a part of the management process to improve performance, rather than standards to be met.”
Managers must also have in mind that developed measures are not “cast in stone” and that areas which need to be measured will change over time, as strategies change. There are a wide range of recommendations on how to develop and use performance measures and KPIs. Neely et al. (1997) presents a summary of these recommendations in their ambitious review of the literature on the subject. Table 3.1 (on the next page) presents the most interesting of these recommendations for the purpose of this thesis. Neely et al. used this knowledge to develop a framework for the design of performance measures. Table 3.2 shows this framework, the performance measure record sheet, which seeks to specify what a “good” performance measure constitutes. The framework ensures that a developed measure follow the recommendations presented above if the measure is clearly specified on each element of the record sheet. An explanation of the ten elements in the record sheet and their relationship to the recommendations summarized in Table 3.1 are presented in appendix 4.
20 Kaplan and Norton (1992)

– THEORY –
17
Table 3.1 Recommendations with regard to the design of performance measures
(Source: Neely et al., 1997)
Table 3.2 The performance measure record sheet
(Source: Neely et al., 1997)
Elements Details
Title
Purpose
Relates to
Target
Formula
Frequency
Who measures?
Source of data
Who acts on the data?
What do they do?
Notes and comments
Recommendations
1. Performance measures should be derived from strategy 2. Performance measures should be simple to understand 3. Performance measures should provide timely and accurate feedback 4. Performance measures should be based on quantities that can be
influenced, or controlled, by the user alone or in cooperation with others 5. Performance measures should relate to specific goals (targets) 6. Performance measures should be relevant 7. Performance measures should be part of a closed management loop 8. Performance measures should be clearly defined 9. Performance measures should focus on improvement 10. Performance measures should have an explicit purpose 11. Performance measures should be based on an explicitly defined formula
and source of data 12. Performance measures should employ ratios rather than absolute numbers 13. Performance measures should use data which are automatically collected
as part of a process whenever possible 14. Performance measures should be based on trends rather than snapshots 15. Performance measures should be precise – be exact about what is being
measured 16. Performance measures should be objective – not based on opinion

– THEORY –
18
3.4.2 Performance Measurement Systems The need to integrate the performance measures obtained in a system is two-fold. First, as Sinclair and Zairi (2000) points out, it is imperative to convey information through as few and as simple a set of measures as possible. These measures must be analyzed as an entity in order to avoid redundancies and to find a balanced set of measures. Second, measures need to be part of a comprehensive system which integrates the goals of everyone in the organization, in a way that enables them to work together for the benefit of the organization as a whole. In response to the dissatisfaction of traditional performance measures, a number of frameworks and models were developed in the early 90’s to support companies in their process of measuring performance. Among the most widely cited are the balanced scorecard and the performance pyramid.8 These performance measurement models are explained briefly below.
The Balanced Scorecard Kaplan and Norton made a significant contribution in overcoming some of the limitations of traditional performance measurement systems by linking them to strategy. They developed a balanced scorecard, which was first presented in 1992. It is a comprehensive performance summary that complements financial measures with operational measures, which are the drivers of future financial performance. The word “balanced” calls attention to the fact that the system must combine financial and non-financial measures.19 The set of measures can be grouped into four main perspectives (i.e. dimensions of performance), which respectively enable managers to answer four important questions about their organization. These are: 15
• How do we look to our shareholders (the financial perspective)? • What must we excel at (the internal business perspective)? • How do our customers see us (the customer perspective)? • How can we continue to improve and create value (the innovation and
learning perspective)? Slater et al. (1997) explains these perspectives further. The financial perspective is concerned with identifying the key financial drivers in creating value for the shareholders. Measures on financial performance are outcomes (i.e. lagging indicators) and hence, they tell us what has happened in the past. The internal perspective is primarily concerned with the efficiency of the entire business system. It will be most useful when it views the firm as a system of business processes, all of which must be coordinated for the purpose of creating

– THEORY –
19
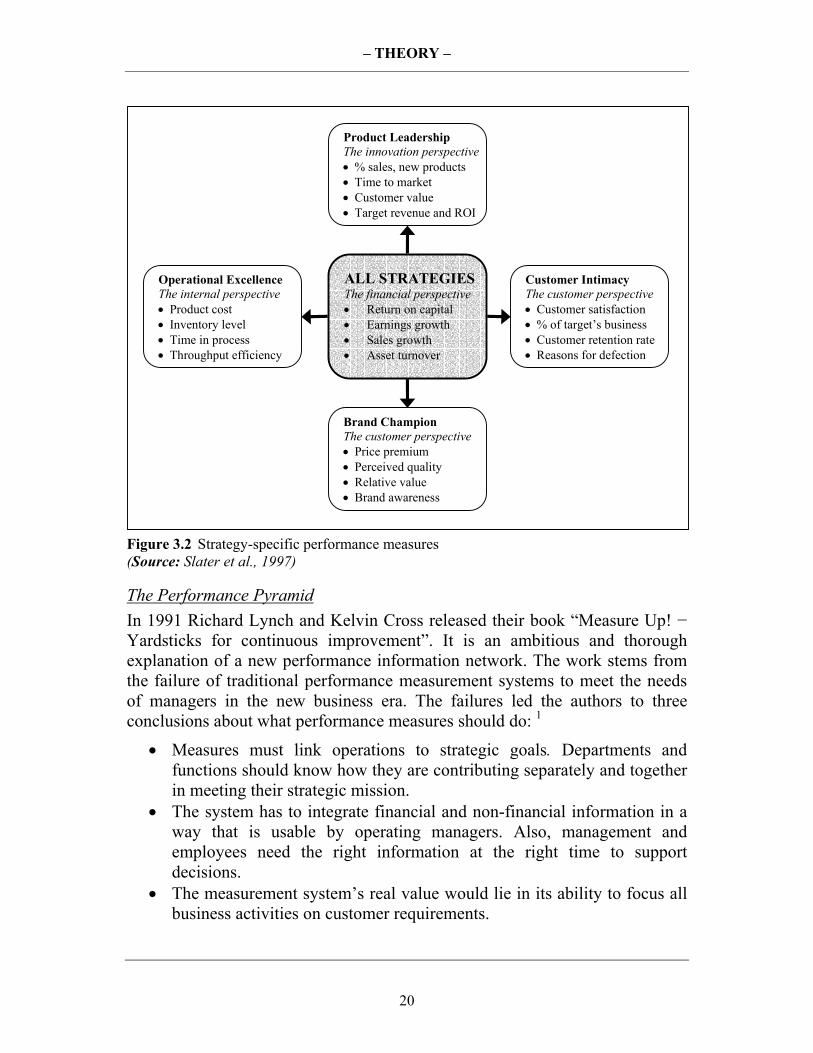
customer value. The customer perspective includes measures of corporate or brand awareness, customer satisfaction, customer retention, and customer profitability. Customer focused measures may be leading indicators (i.e. they predict the future) of what the financial measures will later reveal. The innovation and learning perspective is concerned with how effectively the business can adapt to changing conditions with the development of new products and services or the improvement of internal processes. The balanced scorecard gives a holistic view of the organization by simultaneously looking at the four important perspectives discussed above. It enables companies to track financial results while, at the same time, monitoring progress in building the capabilities and acquiring the assets they need for future growth. One of the reasons the balanced scorecard is such a powerful tool is that it stresses the linkages for achieving outstanding performance in related measures, rather than concentrating on isolated measures. It provides managers with a sense of interdependency among different organizational areas. Moreover, the balanced scorecard avoids information overload by helping organizations concentrate on a limited number of critical measures.19 In spite of the advantages of the balanced scorecard mentioned above some authors actually stresses that the scorecard should not in fact, be balanced. Slater et al. (1997) claims that the performance measurement system must be matched with market strategy (presented in section 3.2). In other words, it should be evident that different market strategies and competitive conditions call for different measurement systems. Although the financial perspective is important regardless of strategy, companies with a certain market strategy type should emphasize one of the other perspectives. Product leaders must concentrate on the innovation and learning perspective when it comes to performance evaluation. Customer-intimate businesses naturally focus on understanding the customer and his perception of the value of the product or service offered (the customer perspective). Brand champions should also emphasize the customer perspective in their performance measurement system. Operationally excellent businesses want to emphasize the internal perspective because of their focus on efficiency. See Figure 3.2 for examples of measures that can be obtained by companies using the different market strategies.
– THEORY –
20
Figure 3.2 Strategy-specific performance measures (Source: Slater et al., 1997)
The Performance Pyramid In 1991 Richard Lynch and Kelvin Cross released their book “Measure Up! − Yardsticks for continuous improvement”. It is an ambitious and thorough explanation of a new performance information network. The work stems from the failure of traditional performance measurement systems to meet the needs of managers in the new business era. The failures led the authors to three conclusions about what performance measures should do: 1
• Measures must link operations to strategic goals. Departments and functions should know how they are contributing separately and together in meeting their strategic mission.
• The system has to integrate financial and non-financial information in a way that is usable by operating managers. Also, management and employees need the right information at the right time to support decisions.
• The measurement system’s real value would lie in its ability to focus all business activities on customer requirements.
ALL STRATEGIESThe financial perspective • Return on capital • Earnings growth • Sales growth • Asset turnover
Operational Excellence The internal perspective • Product cost • Inventory level • Time in process • Throughput efficiency
Customer Intimacy The customer perspective • Customer satisfaction • % of target’s business • Customer retention rate • Reasons for defection
Brand Champion The customer perspective • Price premium • Perceived quality • Relative value • Brand awareness
Product Leadership The innovation perspective • % sales, new products • Time to market • Customer value • Target revenue and ROI

– THEORY –
21
These conclusions led them to the development of the performance pyramid, a tool that supports the design of new performance measurement systems or the reengineering of existing ones. From an external point of view, the customers and the stockholders determine what is important to measure, whereas the competition determines how good the performance in those measures needs to be. Successful manufacturers and service companies have been competing on three fronts: customer satisfaction, flexibility, and productivity. A valuable lesson from the Japanese is the order in which these weapons should be mastered: customer satisfaction first, productivity second, and then finally flexibility.1 The performance pyramid, shown in Figure 3.3, represents linked building blocks in the performance information network. A four-level pyramid of objectives and measures ensures an effective link between strategy and operations by translating strategic objectives from the top down (based on customer priorities) and measures from the bottom up.1
Figure 3.3 The performance pyramid (Source: Lynch and Cross, 1995)
At the top level, a vision for the business is articulated by corporate senior management. Objectives are then defined in market and financial terms for each strategic business unit at the second level and strategies are formulated,
External effectiveness
Internal efficiency
Corporate vision
Customer satisfaction Flexibility Productivity
Market Financial
Delivery Cycle time Quality Waste
Strategic business units
Core business processes
Departments, groups, and work teams
Objectives
Measures

– THEORY –
22
describing how these objectives will be achieved. At the third level, more tangible operating objectives and priorities are defined in terms of customer satisfaction, flexibility, and productivity for each core process supporting the business strategy. At the base of the pyramid, objectives are converted into specific operational criteria (quality, delivery, cycle time, and waste) for each department or component of the business system. These levels of the pyramid are explained in more detail in the following paragraphs.1 The purpose of formulating a vision is to bare the heart and soul of the company as well as setting its strategic course. The vision defines the markets in which and the basis on which the company plans to achieve its goals. Some of the major bases on which companies compete are: price, product innovation, product differentiation, product quality, product availability, quality of sales force, after-sales service, and financial aid to customers.1 Most strategic business units define success in terms of (1) achieving the long-term goals of growth and market position and (2) achieving the short-term goals of specified levels of positive cash flow and profitability. Market measures are external measures, driven by the customer. They can include measures such as: absolute market share, relative market share, share to largest competitor and new product sales. The financial measures, although traditionally emphasized, only represent (at best) half the picture. Still, financial measures are valid top-level measures for the business as a whole and for each of its strategic business units. The need for change is instead the overemphasis of these measures in the short run and how objectives get translated into day-to-day operations.1 Core business processes are the bridge between the top level traditional indicators and the day-to-day operational measures in the performance pyramid. They include all internal functions and processes that are required to follow a particular business strategy. The new product introduction process, the order fulfilment cycle, and customer services are all examples of such core processes. The objectives for these core processes, as well as for top management, are balanced on the three factors of customer satisfaction, flexibility, and productivity. Yet it is not unusual for companies or processes to pay more attention to one of these factors. At the core process level of the pyramid there are actually two kinds of measures. Global measures provide top management with a sense of whether strategic objectives are being achieved. They should be monitored month-to-month or quarter-to-quarter. Specific workflow measures, on the other hand, represent day-to-day measures of operating effectiveness and efficiency. They are calculated by rolling up the

– THEORY –
23
four performance measures (on the quality, delivery, cycle time, and waste criterions) in each department.1 Any effective control system must be based on a tightly defined linkage between measurements at the operational level (the base of the pyramid) and the objectives and priorities of the core process. The elements of this linkage are found in four principal, local operating performance criteria: quality, delivery, cycle time, and waste. The objective of any function or department in the core process is to increase performance in quality and delivery and to decrease cycle time and waste. These four dimensions of performance are briefly explained below.1
Quality Quality means meeting customer expectations 100 percent of the time through the delivery of defect-free products or services. Poor quality is when a client has been delivered a service that does not meet their expectations (e.g. it failed to solve the problem or it was not delivered in a friendly and reliable way). High-quality services or products will ultimately affect the customer satisfaction dimension in a positive way.1
Delivery Delivery involves the quantity of products or services being delivered on time to the customer. Poor delivery performance includes incorrect shipments, shipments to the wrong location, and incomplete as well as late shipments. Regular on-time and correct deliveries will increase customer satisfaction and flexibility.1
Cycle Time Cycle time refers to the total elapsed time from when a unit of work enters a process until it exits the process. As such it is the sum of process time, move time, inspect time, queue time and storage time. Typically, only five percent of the total cycle time is devoted to any hands-on processing activity. Hence, the product or service is waiting to be worked on 95 percent of the time. There are often great opportunities for improvement to be found by focusing on cycle time reduction. Unnecessarily long cycle times contribute directly to poor strategic performance regarding productivity and flexibility.1
Waste Waste is the non-value added activities and resources incurred in meeting the requirements of the customer. Waste includes all the effort and costs associated with failures, appraisals and surpluses. It means that effort expended in

– THEORY –
24
repairing defects or in producing 110 units to get out 100 good ones is not poor quality performance, it is poor cost performance (i.e. waste). At the core process level, the main objective is to improve productivity by reducing overall costs. At the department level, the objective becomes more specific: measure and eliminate waste.1
3.4.3 Productivity One of the most emphasized and examined dimension of performance (apart from strictly financial measures) is that of productivity. This especially holds for the manufacturing industry where an output oriented, cost efficient view was early adopted. Although widely used, the concept and definition of productivity is heavily debated in the academic literature. According to Neely et al. (1995) for instance, productivity is a measure of how well resources are combined and used to accomplish specific, desirable results and is conventionally defined as the ratio of output to input. Although the term productivity is often ill-defined, its measurement is generally that of a prescribed output to the resources consumed (i.e. the inputs). Productivity measures can be divided into three main types:
• Partial measures: A ratio relating output to a single input, such as labour, materials or capital.
• Total factor or value-added productivity: Based on sales less bought-in goods, materials and services.
• Total productivity measures: A ratio of total output to total input. Additionally, total productivity can be expressed as the overall measure of economic effectiveness. This measure should be expressed as the output in relation to all resources utilized, as follows: 21
QECMLOTP
++++=
Where: TP = total productivity O = total output L = labor input M = materials input
C = capital input E = energy input Q = other inputs The equation above implies that higher productivity can be achieved in a number of ways, including: 13
• Increasing the level of output faster than that of the input
21 Stainer (1997)

– THEORY –
25
• Producing more output with the same level of input • Producing more output with a reduced level of input • Maintaining the level of output while reducing the input • Decreasing the level of output, but decreasing the level of input more
Although the measurement of productivity seems to be straight-forward, simple and useful, productivity measures were developed in and for manufacturing companies. Therefore, they are based on quantities of standardized and clearly identified units of measurement. However, the large variance in the content and quality of the input and output of service firms seems to make such measures inappropriate.22 Basically, the problems of instituting productivity measures in a service firm can primarily be explained by some distinct characteristics of services in comparison with manufacturing. These characteristics are the intangibility and heterogeneity of the outputs, the simultaneity of production and consumption and the perishability of services (that is, they cannot be stored).2 Normally, because of these characteristics, only measures of partial productivity can be obtained. These types of measures may be interesting pieces of efficiency information but they give no information about how effectively the service operation as a whole transforms all used input resources into customer value and ultimately into economic results for the service provider. What appears to be improved productivity in terms of better production efficiency may turn out to have a negative effect on perceived service quality, customer value and in the final analysis, on the economic result of the firm.23 Vuorinen et al. (1998), while comparing productivity between services and manufacturing, claims that the special characteristics of services demand a more holistic approach including a customer-orientation to productivity. More specifically, they argue that quality and productivity can not be dealt with separately in the case of services. As a result of this knowledge, they define service productivity as the ability of a service organization to use its inputs for providing services with quality matching the expectations of customers. That is, the quantity and quality dimensions of service offerings cannot be treated in isolation. Due to their interrelationship, it may be impossible to separate the impact of a service process on conventional productivity from its impact on service quality. Hence, both the quantity and quality aspects must be considered together to provide a joint impact on the total productivity of the service firm.
22 Nachum (1999) 23 Grönroos and Ojasalo (2004)

– THEORY –
26
The productivity concept can also be seen in the context of the performance pyramid (presented in section 3.4.2). The new view on productivity measurement this framework entails is formed under a simple assumption: faster cycle times and elimination of waste improve productivity and enable lower prices and increased sales, which in turn improve financial performance. Figure 3.4 shows some of the relationships between the local operating measures and the financial results, with focus on how to increase productivity and at the same time increase the profitability.1
Figure 3.4 Relationships between operating measures and financial results (Source: Lynch and Cross, 1995)
Productivity, according to Lynch and Cross (1995), refers to how effectively resources (including time) are managed to achieve the customer satisfaction and flexibility objectives. Productivity is typically the driving force when firms compete on the basis of price. It is an internally driven force, with much focus on the financial side of the performance pyramid. It is not directly perceived by the customer; however, of the three driving forces (productivity, flexibility and customer satisfaction), it is often productivity that gets most of the attention. Productivity should be viewed in the context of the most cost-effective and timely means of achieving the customer satisfaction and flexibility objectives.
Increased salesMore customers
Faster cycle time
Less waste
Lower General and Administrative expenses Lower operating expenses
Increased profits Increased revenues Improved cash flow Improved return on investment
Reduced price
Improved quality
On-time delivery

– THEORETICAL FRAME OF REFERENCE –
27
4. THEORETICAL FRAME OF REFERENCE This chapter examines the relationships between the different theories presented in the previous chapter. Here, the theoretical base is conceptualized in a frame of reference for the purpose of this thesis.
4.1 Performance Measurement at the Macro Level The discipline of performance measurement can be analyzed at two levels: the macro level, which puts performance measurement in an organizational context; and the micro level, where the details of the performance measurement system and individual measures are examined. In this section, the concept of performance measurement viewed at the macro level will be discussed. The study of performance measurement at the macro level is primarily focused on the characteristics of an organization that will affect the concept and execution of measurement. Such characteristics, or factors, can be grouped under three main areas which respectively answer the following questions: 8
• Why should the company measure its performance? • What dimensions of performance should they focus on? • How should measurement be executed?
The answers to these questions can respectively be found in the external business environment, the chosen corporate and business strategy and the internal business environment. Hence, the theories presented in sections 3.1-3.3 must be regarded in order for an organization to set out on the process of improving their view on performance measurement. In Figure 4.1, the theoretical frame of reference at the macro level is presented. The figure displays the main factors of each area and examples of how these factors may affect performance measurement. The external environment will ultimately affect such elements as the required level of information and the frequency of measure development (i.e. PM planning horizon); whereas the internal environment probably have an effect on the measurement reporting structure and the climate of accountability. The subject of corporate and business strategies, on the other hand, have to be seen from a slightly different angle. Actually, it is both a determinant of which perspectives to focus on in the measurement system, but also, it is a part of the measurement development process as the discipline of strategic management puts the concept of performance measurement in a wider context. In strategic management, the development and implementation of performance measures comes after the process of translating the business strategies into an operating plan.

– THEORETICAL FRAME OF REFERENCE –
28
Figure 4.1 Theoretical frame of reference for the macro level (Source: Author’s own construct)
This thesis is delimited to only concern the Swedish organization of DHL Solutions. Moreover, the scanning of the external environment and the answer to the why of performance measurement is probably a matter for a higher level of the organization. Therefore, the following chapters will primarily be focused on the strategy process (particularly the translation of strategies into operational terms) and the internal environment.
4.2 Performance Measurement at the Micro Level To be able to show a comprehensive picture of the concept of performance measurement and to form a useful set of recommendations for DHL Solutions to follow, the process of performance measurement needs to be investigated on
External Environment
The Why of PM
Corporate and Business Strategy
The What of PM
Internal Environment
The How of PM
Factors such as: • Business climate • Regulations • Competition • Power of clients
Factors such as: • Org. structure • Culture • Process type • Relations
PM Reporting
PM Accountability
Strategic Management
(Putting PM in a wider perspective)
Corporate Strategy
Business Strategy
Operating Plan
PM
Characteristics of an organization affecting performance measurement
PM planning horizon
Need for information
Requirements on PM targets
Market Strategy
What perspectives to focus on in the PM-system and
congruence between these and
the Pyramid

– THEORETICAL FRAME OF REFERENCE –
29
a more detailed micro level (see Figure 4.2). At this level, performance measurement can be seen as a subsequent step in the process of strategic management. Performance measures are basically instituted to monitor the strategy implementation progress. However, even when strategies are well known and measures are derived from these strategies, there are some general recommendations to follow when establishing a performance measurement system with a set of individual measures.
Figure 4.2 Theoretical frame of reference for the micro level (Source: Author’s own construct)
At this level of the analysis one must regard both the system aspect and the individual measure aspect of the subject of performance measurement. Although, they are supported by different kinds of tools and models these two aspects are not separable or sequential; in fact, they are interacting. That is, without individual measures, you will not have a system and without a system, you will not know if the measures instituted are relevant. In this thesis, the system aspect is investigated primarily by using the performance pyramid (see section 3.4.2). However, this model is supported by the model of the balanced scorecard. The aspect of individual metrics is examined principally by using the performance measure record sheet (see section 3.4.1).
The Why of PM
The What of PM
The How of PM
The performance measurement system
The balanced scorecard model
The performance pyramid
Individual performance measures
The performance measure record
sheet
STRATEGIC MANAGEMENT

– THE ORGANIZATION UNDER INVESTIGATION –
30
5. THE ORGANIZATION UNDER INVESTIGATION This section consists of a more detailed presentation of the company under investigation, where the organization of the whole corporation and the parts examined are outlined. The whole chapter is based on information from DHL – homepage, brochures and interviews.
5.1 The Corporation – DHL Express and Logistics In 2003 the three express and logistics companies DHL Worldwide Express, Danzas and Deutsche Post Euro Express merged into one large corporation under the name DHL Express and Logistics (or simply denoted DHL). This merge was initialized by the mutual owner Deutsche Post World Net. DHL have a wide array of services and offers a one-stop-shopping opportunity for customers in more than 220 countries. With annual revenues of nearly 22 billion Euros in 2003 and more than 160.000 employees in approximately 5.000 offices, DHL is the global market leader of the international express and logistics industry. To cover all their customers’ service needs, DHL is divided into four specialized businesses (see Figure 5.1). These are:
• DHL Express: Offers parcel transportation services. • DHL Freight: Offers road or rail freight of part or full loads. • DHL Danzas Air & Ocean: Offers worldwide logistics solutions for air
and sea freight. • DHL Solutions: Provides tailor-made contract and industry-specific
logistics solutions. From consulting to supply chain design, from storage and sales logistics to production and order management.
5.2 The Business Area – DHL Solutions DHL Solutions is primarily focused on delivering 3PL-services to manufacturing companies. In order to provide as experienced and skilled employees as possible in their services, DHL Solutions is divided into industry-specific sectors. Examples of such sectors are Fast Moving Consumer Goods, Automotive, Pharma/Healthcare, Electronics/Telecom and Fashion. In all of these sectors, DHL Solutions produce their services in multi-user (more than one client in the same facility) as well as one-user warehouses. This enables manufacturing companies to hold inventory at a local level, while holding down their expenses. The headquarters of DHL Solutions for the Nordic countries and the UK are located in Stockholm. The managers at this regional level have a strategic and

– THE ORGANIZATION UNDER INVESTIGATION –
31
selling responsibility. Below the regional level, management is divided between the different countries. At those local levels managers have an operational responsibility (i.e. the delivery of services). DHL Solutions in Sweden has 18 warehouses (referred to as operating units) located between Malmö in the south and Stockholm in the north. These operating units are organizationally separated into two divisions, Division Consumer and Division Industrial, based on the types of clients they handle (clients with consumer products or clients with industrial products). Division Consumer consists of 11 operating units with about 40 warehousing clients all together. Division Industrial, on the other hand, consists of seven operating units with a total client base of approximately 20 clients. See Figure 5.1 for a presentation of the organization.
Figure 5.1 Organizational structure at DHL and DHL Solutions (Source: DHL – Homepage and personal interviews)
DHL Freight DHL Danzas Air & Ocean
DHL Solutions
DHL Express and Logistics
DHL Solutions Europe North/UK
Denmark Sweden Norway Finland UK/Ireland
Division Consumer
Division Industrial
Other Operating Units Other Operating Units
Operating unit A
Operating unit B
Operating unit C
Operating unit D
DHL Express

– THE ORGANIZATION UNDER INVESTIGATION –
32
5.2.1 Operating Unit A The 14 500 square meter warehouse referred to as operating unit A organized under Division Consumer and managed as a unit in the Pharma/Healthcare sector. Approximately 90 percent of the turnover at the unit comes from handling of pharmaceuticals. These products are stored at the warehouse and then, on order, distributed (the distribution process is not owned by the unit) to the clients’ customers in the Nordic countries. The largest client (about 80 percent of the turnover) is the pharmaceutics corporation “client x”. Operating unit A has a workforce of between 22 and 26 employees.24
Distinctive Features The handling of pharmaceuticals demands several specific processes. One such process is the quality control, which is initiated by the clients but also regulated by the pharmaceutical state departments of the Nordic countries and the European Union. Many activities in the warehouse are affected by these regulations, which are stated in a diverse set of documents and contracts. Activities such as special moves to and from designated areas (i.e. pharmaceuticals waiting to be discarded, in quarantine, under investigation or so) are activities brought upon by such regulations. Another deviation from the normal processes is that some products demand special treatments regarding temperature. Operating unit A has two large refrigerator rooms and one freezer room. Temperatures in these rooms must be monitored and special procedures must be undertaken when packing products of this type.24 Concerning the products received in operating unit A, most of them are packed in standardized boxes of medium size loaded on EUR-pallets. However, some products are included in so called value added services (VASs). Characteristic for VASs are that they include non-standard, customized processes. That is, these products do not follow the standard flow of work.24
5.2.2 Operating Unit B In the beginning of January 2002, DHL Solutions (at that time Danzas Solutions) bought the 3PL-company Scandinavian Garment Services (SGS), which provided logistic services in the fashion sector. Although the branch manager for the fashion sector is responsible for a number of terminals and warehouses, the main warehouse/terminal is unit B. This facility consists of 12 000 square meters, divided between the terminal function (40 percent) and the warehouse function (60 percent). In the unit, there are 50 employees and
24 Interview – Head of Unit A

– THE ORGANIZATION UNDER INVESTIGATION –
33
100 percent of the turnover comes from the handling of clothing and related products and the unit is organized under Division Consumer.25
Distinctive Features Because of the relatively recent incorporation of SGS into the organization, DHL Solutions’ fashion sector in the Nordic countries (synonymous with the previous organization of SGS) is still influenced by the old company culture. The most distinctive difference of this business in comparison to the rest of DHL Solutions is that it, apart from warehousing, also handles transportations of clients’ goods. That is, DHL Solutions at unit B have haulage contractors connected to the supply chain and manage these contracts by themselves. Consequently, the facility is both a warehouse (where goods are stored, picked and packed for the client) and a terminal (a cross-dock where goods are only sorted and reloaded on distribution trucks). Almost 60 percent of the turnover comes from the terminal and transportation activities. So, the actual core business of DHL Solutions is only a part (40 percent) of the activities carried out at operating unit B. Unit B also has to face the problems of seasonal variations in volumes handled. Seasonal highs are during weeks 2-15 for the spring and summer collections and during weeks 30-40 for the fall and winter collections. 25
5.2.3 Operating Unit C Operating unit C is a warehouse consisting of 33 560 square meters of space and it is mainly in the business of alcoholic beverages (approximately 90 percent of the turnover). Therefore, it is managed as an operating unit in the fast moving consumer goods-sector. Although, which can seem to be contradictive, it is organized under Division Industrial. The largest client is a vine and spirits importer (55 percent of the turnover) and the unit has a flexible (approximately 50 percent temporaries) workforce of between 130 and 180 employees.26
Distinctive Features A distinctive feature of this business is that it handles fragile products such as glass bottles, cans and bag-in-box wines. The risk of scrap in the handling process is much larger than in operating units which handle other products. Approximately 70 percent of the products that are received in unit C are packed in boxes on EUR-pallets. The rest (30 percent) are palletized directly after receipt (palletizing is a VAS-activity). However, the warehousing process also includes piece by piece handling of individual bottles and cans. Another 25 Interview – Head of Unit B 26 Interview – Head of Unit C

– THE ORGANIZATION UNDER INVESTIGATION –
34
distinctive feature that unit C has to manage is the large seasonal variations in volumes. The volumes handled at seasonal highs are nearly twice as large as those handled at seasonal lows. This is also the reason to why they have such a large proportion of temporaries in the workforce. The most important VAS-process at unit C is that of reloading and sorting products on specially designed pallets for one of their clients. In total, the value added services account for approximately 20 percent of the turnover.26
5.2.4 Operating Unit D Operating unit D is a spare parts distribution centre (i.e. a warehouse) with 19600 square meters of space, which was founded in 1992. The only client ever since has been a large car manufacturer and 100 percent of the turnover comes from the handling of their spare parts bound for approximately 250 retailers in Sweden, Norway and Finland. Today the warehouse employ 53 persons and the operating unit is organized under Division Industrial and managed as a unit in the Automotive-sector.27 and 28
Distinctive Features The operations at unit D have a number of special features. First, they handle an immense number of different articles compared to other operating units. Also, the articles show a wide range of characteristics with respect to size, weight, appearance and further on. Therefore, the handling of these products requires some distinctive capabilities, such as a specialized workforce. An advantage with the handling, however, is the ordering routine that includes both rush orders (delivery times of 24 or 48 hours) and stock orders (delivery times of up to one week). Approximately 52 percent of the shipped order lines are rush orders and 48 percent are stock orders. These ordering routines imply a simplified planning of the workforce because there is, inherent in the process, a flexibility of activities. That is, employees can wait with stock orders if resources are required for rush orders. Another unique feature of the operating unit is that they also handle parts of the customer service for their client. This is stated in the contract and primarily leads to a need for more administrative employees, but also, it results in a closer relationship between the operating unit and the client.27 and 28
27 Interview – Head of Unit D 28 Interview – Production Support Manager, Unit D

– EMPIRICAL FINDINGS –
35
6. EMPIRICAL FINDINGS The following paragraphs explain the present situation at the company, as it was perceived by the author of this thesis during interviews and observations. The chapter follows the same disposition as chapter 3.
6.1 DHL Solutions’ External Environment The general business climate for companies in 3PL-warehousing is currently very good. The annual growth potential for the business is up to 20 percent, but the actual annual growth at DHL Solutions is between 10 and 12 percent.29 Generally speaking, the business of 3PL is quite independent of the overall business climate. This is due to the fact that 3PL-companies can benefit both from ups and downs in the economic cycle. During times of economic depression, many organizations turn to 3PL-companies in order to become more cost efficient and to be able to focus on their core competencies. In times of prosperity, on the other hand, manufacturing companies produce more and want to distribute these large volumes to the markets by means of 3PL-partners.30 Main regulations that affect DHL Solutions are policies from the European Union and the Swedish governments regarding food and pharmaceuticals. These regulations stipulate a high degree of traceability for such products, which in turn lead to a demand for more and more sophisticated warehouse management systems.29 Other regulations that affect the organization are general laws and policies on e.g. handling of dangerous goods, working environment and security. However, the application and control of such regulations can differ between local authorities.30 Apart from companies who run their own warehouses, the largest competitors on the Swedish market are Schenker, Green Cargo and DFDS. However, DHL Solutions have a top five market position in Sweden for all their industry specific sectors except Telecom and overall they are positioned as number one. The primary competitive priorities (i.e. what the competition is based on) are quality, know-how and reliability. Cost is also an important priority, but it is related to the perceived value of the service.30 According to the head of division consumer, on the other hand, the competition is primarily based on cost and time (delivery and response time). Other important capabilities are IT-support (to be able to meet the requirements of large clients) and flexibility (to be able to fulfill assignments that include seasonal variations in demand). 29 Interview – Head of Division Consumer 30 Interview – Head of Division Industrial

– EMPIRICAL FINDINGS –
36
The threats from entries of new companies in the market are relatively low. Primary entry barriers are high investment costs (IT-systems and fork lifts) and difficulties with building a client base.29 However, only five to ten percent of all the warehousing activities in Sweden are outsourced to 3PL-companies, so there is room for establishments of new companies. The problem for many new organizations is that large clients to a greater extent seek global solutions from their logistic partners.30
6.2 Corporate and Business Strategy at DHL Solutions At DHL Solutions as a whole there are no distinctive procedures for strategy formulation. Although visions and corporate strategies may have been formulated at higher levels of the company, they have not been deployed down to local levels. Hence, the organization lacks a unified view on strategy development and objectives setting.29 However, the head of division industrial explains that one of the overall objectives is that DHL Solutions should be perceived as the leading supplier of 3PL-services for clients in the industry-specific sectors they operate. In these markets the idea is to compete more on competence and capacity than on price. Although, the strategies have not been clearly defined, the heads of the divisions state that they follow some briefly outlined strategies and aim for a number of general objectives. These are:
• Volume growth, for at least five more years 29 • Overall financial goal to maintain or increase profitability 29 • New sales should be directed to large, global corporations 30 • They should not handle clients with low-value goods 30 • Consolidation of operating units into fewer, larger multi-units with the
advantages that they can: level out large variations in volumes handled; allocate more know-how to the units; and make it easier to plan transportations 29 and 30
Even though they do not have any formulated business strategy, managers at DHL Solutions in Sweden have developed a “market plan” (last updated in January 2004 by managers at headquarters). This market plan is based on an assessment of the current position in the internal and external environment and a SWOT-analysis (strengths, weaknesses, opportunities and threats) of this position. The plan then deals with priorities, goals and recommendations for future work.31 However, all heads of operating units interviewed, describe a 31 Internal document – Market Plan (2004)

– EMPIRICAL FINDINGS –
37
lack of communication from higher levels of the organization when it comes to strategies and strategic objectives. That is, managers at operating units experience that headquarters do not sufficiently deploy distinctive strategies down through the organization. Most objectives are inherent in budgets and are largely based on financial performance.
Market Strategy DHL Solutions do not have any clearly defined market strategy, such as the four strategies presented in section 3.2. However, when asked to identify the strategies that best fit the present situation in the company, both heads of divisions stated that what they actually aim for is to be operational excellent and to reach a high degree of customer intimacy. DHL Solutions wants to be operational excellent because of the low profit margins in the business and because they want to be able to compete with low costs. They emphasize the strategy of customer intimacy due to the fact that they actually operate few clients and want to build long and healthy relationships with them (in order to increase customer retention and also, to keep the assignments profitable).
6.3 DHL Solutions’ Internal Business Environment The organization of DHL Solutions, although consisting of multiple management levels (i.e. operating unit managers, local managers, regional management and top management), can be characterized as being rather decentralized.25 At least, the general idea is that managers at the Swedish headquarters should concern themselves with strategic and tactical management while managers at operating units should be responsible for operational execution (i.e. the delivery of services). That is, the operating units are supposed to achieve the objectives set in the budgets formulated by headquarters, but decisions on how to reach these goals are left to the operating unit managers.26 However, this idea is not always followed by managers at the Swedish headquarters in their day-to-day management. Today, managers at this level often determine the work needed to be done, how it should be done and by whom on an ad hoc-basis. That is, each time a problem arise a specific decision is needed from managers to be able to allocate the required resources needed to correct the problem. Frequently, managers at headquarters send out resources to the operating units to set up a number of corrective actions for the units to follow, often in order for them to become more cost-efficient. Hence, work procedures are not proactive in the organization.32 and 33 Or as one of the 32 Interview – Controller, Division Industrial 33 Interview – Controller, Division Consumer

– EMPIRICAL FINDINGS –
38
respondents put it: “Where the biggest fires are, that’s where we put most effort on extinguishing.” Another important element of the internal environment is the way communications are managed in the organization. In particular, how do managers at headquarters and operating units communicate with each other and what types of information systems are instituted. Generally, there are four types of information flows between units and headquarters in the organization. These are: 32 and 33
• The major business system SAP for economic reports and accounting • Static reports – Written, formalized and continuous reports on some pre-
defined issues • Ad hoc-reports – Reports which have no clear purpose (they often
originate from some specific requirements of the global headquarters in Basel)
• “Nice to know”-information – Updates through mail and informal contacts via telephone or meetings
6.3.1 The Warehousing Process The general warehousing process is quite similar between the four operating units examined, despite the fact that each unit has some distinctive operational characteristics. Therefore, a simplified process description will be presented here, to which deviations in the units’ processes can be compared. Broadly outlined, the warehousing process can be described as in Figure 6.1 (excluding VASs, which can be incorporated almost anywhere in the process). The main activities in the warehousing process are: 34
1. The client sends a vehicle and receipt advice via EDI (Electronic Data Interchange) stating when, what and quantity of goods to be shipped to the unit.
2. The goods are received at the warehouse and the personnel control quantity and quality.
3. The pallets or parts are then moved to the buffers in the warehouse and the quantities and locations are reported into the warehouse management system, ProLogs. Goods in buffers are located in areas that are harder to reach and often require a high picking fork lift.
4. After some storage time, when a demand is reported at a pick location, goods are moved to this location from the buffer (the move is reported into the system).
34 Internal document – Logistical Process Flow (2004)

– EMPIRICAL FINDINGS –
39
5. When the unit has received a bunch of customer orders via EDI, these orders are printed and the picking process is planned to require as little time as possible (i.e. pick route planning).
6. Warehouse personnel pick and pack ordered goods according to standard procedures and prepare it for shipping (the pick and pack are reported into ProLogs).
7. The transportation of the order is planned and the order information is sent to the transporter. When the truck driver arrives at the warehouse he loads the truck and ships the order to the customer.
Figure 6.1 Simplified flow chart for the warehousing process (Source: Author’s own construct based on “Logistical Process Flow”, 2004)
Deviations from the Process At operating unit A, the inbound and outbound activities are quite unique (activities number two and seven). For example, they need to have a designated area for the unloading and loading of trucks, from which the goods are not released until they have gone through a number of pre-defined procedures (i.e. inbound, storage and outbound areas are clearly separated). Regarding activities three and four, at unit A they do not separate buffers from pick locations. They pick goods directly from all storage positions. Also, when activity number six is completed, they check all order lines on quantity and quality to ensure that customers will receive complete orders.24 The process at operating unit B includes a number of deviations from the general warehousing process described above. First, activity number two is
Customer
Client
DHL Solutions
Vehicle and receipt advice
Unload truck and control
qty. and qual.
Put away in buffers
Move to pick location
Order information
Pick order
Store
EDI
Warehouse Management System
Order
Sort, pack and load
EDI
Send order Receive goods

– EMPIRICAL FINDINGS –
40
carried out in a slightly different way since they are handling clothes. Most of the goods comes on clothes hangers and are unloaded via telescopic extenders straight onto an overhead conveyor system. This system is manually operated, but with it, the employees can reach all the storage positions in the warehouse. Regarding activity number three, an important deviation is that they have not implemented ProLogs at unit B yet. Also, they do not separate pick locations from buffers and there is no pick route planning for customer orders (activity number six) at the unit.25 The warehousing process in operating unit C is quite similar to the general process presented in Figure 6.1. However, one activity that is highly emphasized at the unit is the control of picked goods (faults are reviewed both on individuals and as a total). Today, their goal is to check quantity and quality of at least 10 percent of all outbound orders. On the individual level they also classify picking personnel in categories A, B and C with respect to their conformance to quality objectives and based on this they can focus their control activities on low performance employees.26 The process at operating unit D is much like the general warehousing process described in Figure 6.1. One difference, however, is that they sort their inbound goods in large (37 percent of received order lines) and small parts (63 percent of received order lines), in order to simplify the storage of the articles. Consequently, they have divided their warehouse into two main areas (one for large and one for small parts) and many customer orders require two picking routes, one for each area.27 and 28
6.4 Performance Measurement at DHL Solutions Traditionally, the culture of performance tracking at DHL Solutions has primarily been governed by control of the financial dimension. This dimension has a rather long history in the organization’s accounting culture. Still, headquarters follow-up their operating units on financial performance tightly and they monitor the units’ overall conformance to budgets on a monthly basis.24 and 25 DHL Solutions in Sweden has not formulated and distributed any support tools or guidelines for how and when performance measures are to be developed.24 Consequently, measures are established on an ad hoc-basis and no manager in the organization have full insight into the entity of measures used at a particular time. The only overall policies for measurement are those indirectly formulated as a result of corporate projects, such as the MORE-project (an international project that addresses multiple improvement initiatives).26 Although, such
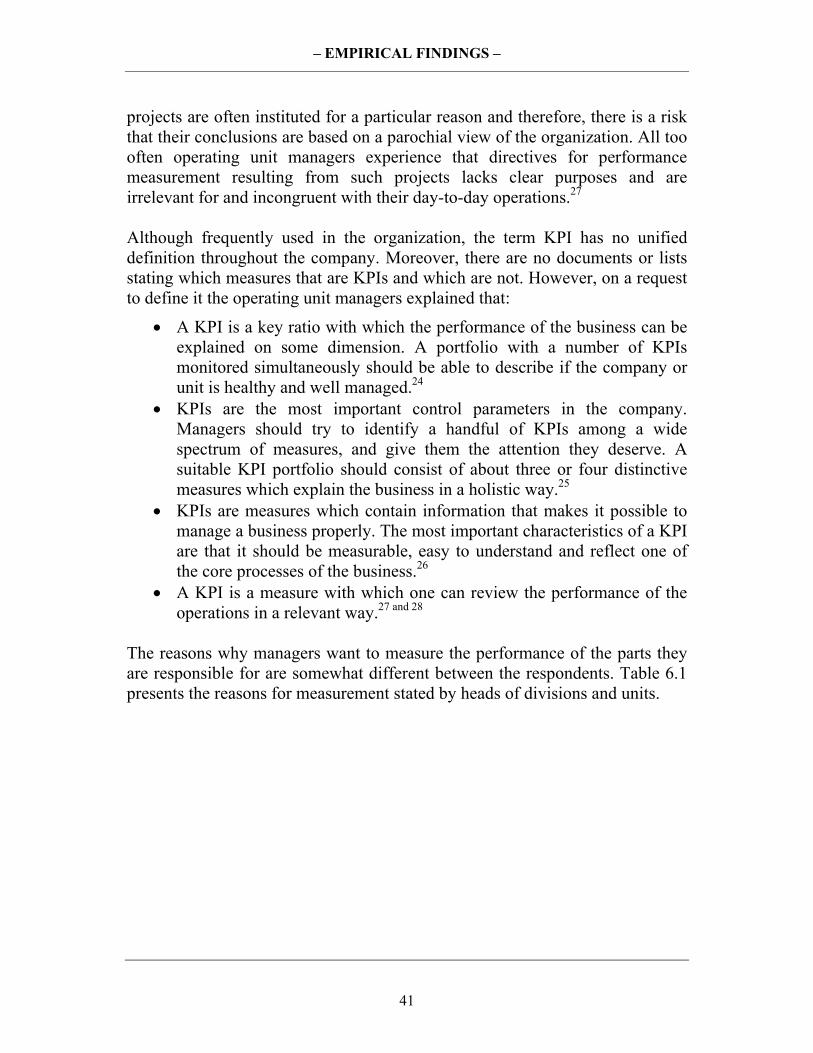
– EMPIRICAL FINDINGS –
41
projects are often instituted for a particular reason and therefore, there is a risk that their conclusions are based on a parochial view of the organization. All too often operating unit managers experience that directives for performance measurement resulting from such projects lacks clear purposes and are irrelevant for and incongruent with their day-to-day operations.27 Although frequently used in the organization, the term KPI has no unified definition throughout the company. Moreover, there are no documents or lists stating which measures that are KPIs and which are not. However, on a request to define it the operating unit managers explained that:
• A KPI is a key ratio with which the performance of the business can be explained on some dimension. A portfolio with a number of KPIs monitored simultaneously should be able to describe if the company or unit is healthy and well managed.24
• KPIs are the most important control parameters in the company. Managers should try to identify a handful of KPIs among a wide spectrum of measures, and give them the attention they deserve. A suitable KPI portfolio should consist of about three or four distinctive measures which explain the business in a holistic way.25
• KPIs are measures which contain information that makes it possible to manage a business properly. The most important characteristics of a KPI are that it should be measurable, easy to understand and reflect one of the core processes of the business.26
• A KPI is a measure with which one can review the performance of the operations in a relevant way.27 and 28
The reasons why managers want to measure the performance of the parts they are responsible for are somewhat different between the respondents. Table 6.1 presents the reasons for measurement stated by heads of divisions and units.
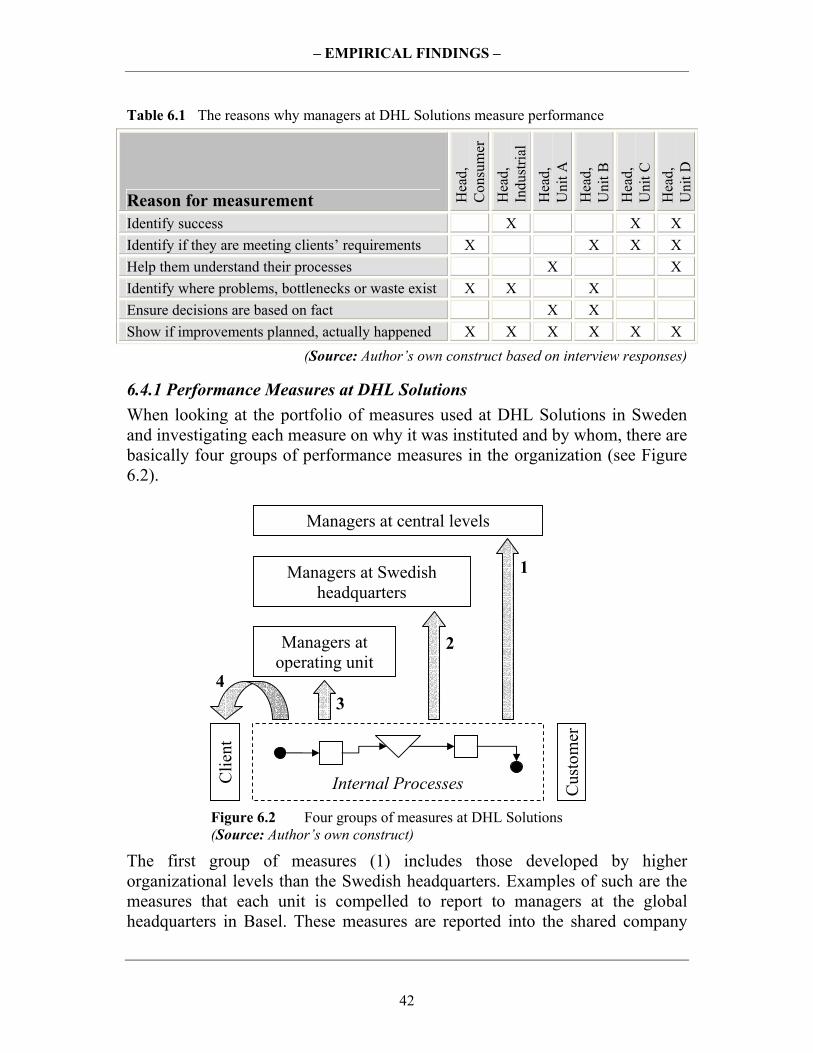
– EMPIRICAL FINDINGS –
42
Table 6.1 The reasons why managers at DHL Solutions measure performance
Reason for measurement Hea
d,
Con
sum
er
Hea
d,
Indu
stria
l H
ead,
U
nit A
H
ead,
U
nit B
H
ead,
U
nit C
H
ead,
U
nit D
Identify success X X X Identify if they are meeting clients’ requirements X X X X Help them understand their processes X X Identify where problems, bottlenecks or waste exist X X X Ensure decisions are based on fact X X Show if improvements planned, actually happened X X X X X X
(Source: Author’s own construct based on interview responses)
6.4.1 Performance Measures at DHL Solutions When looking at the portfolio of measures used at DHL Solutions in Sweden and investigating each measure on why it was instituted and by whom, there are basically four groups of performance measures in the organization (see Figure 6.2).
Figure 6.2 Four groups of measures at DHL Solutions (Source: Author’s own construct)
The first group of measures (1) includes those developed by higher organizational levels than the Swedish headquarters. Examples of such are the measures that each unit is compelled to report to managers at the global headquarters in Basel. These measures are reported into the shared company
Clie
nt
Internal Processes
Managers at operating unit
Managers at Swedish headquarters
Managers at central levels
3
2
1C
usto
mer
4

– EMPIRICAL FINDINGS –
43
server on a monthly basis and the methods of measurement are clearly defined. However, managers in Sweden lack purposes for the measures and they are rarely forced to explain poor performance on them. The measures reported into the server and reviewed in Basel are: 32 and 33
• Manageable employee turnover (that is, total leaving staff less non manageable leaving staff such as retirements)
• Absenteeism (sickness hours in percentage of total hours) • Rent per square meter • Sellable capacity (that is, total space in the warehouse) • Complaints (claims per outgoing order) • On time deliveries (measured on orders) • Inventory accuracy (damaged, stolen or incorrectly picked items in
percentage of the total number of handled items) • Customer net change (gained or lost clients) • Idle capacity (percent of non-used space)
The second group of measures (2) contains those demanded by managers at headquarters in Sweden. These are primarily total operating unit measures on financial performance incorporated in the accounting system. Primary measures monitored are: 29 and 30
• Profit • Return on sales at operating result 1 (ROS at OR1, where OR1 is the
point in the statement of income up to which the head of the operating unit is responsible)
• ROS at OR2 (where over head costs for the Swedish headquarters are included)
• SWOT/Net Sales (where S=salaries, white collars; W=wages, blue collars; O=other personal expenses; T=cost of temporaries; and Net Sales=incomes from handling and value added services)
• Occasional reviews on Claims per order line (number of claims – wrong quantity, wrong article or damaged goods – divided by total shipped order lines)
The third group (3) consists of the measures developed at the units to support the management of their own operations. Heads of units develop templates for measurement on their own and they are responsible for the relevance of each measure developed. Examples of measures monitored at the four operating units examined in this project are: 24, 25, 26 and 27
• Profit

– EMPIRICAL FINDINGS –
44
• ROS at OR1 • SWOT/Net Sales (HA & VAS) • On time delivery (percent of total orders that was delivered before due
date) • Claims per order line • Failures found in control per order line • Order lines without failure in picking (percent of complete and correct
order lines in outbound control) • Scrap articles in percentage of total handled articles (smashed bottles at
the unit C) • Pallets without faults (inbound and outbound) • Occasional labor flexibility analyses based on the business system (SAP) • Absenteeism (total sickness hours in percentage of total paid hours) • Number of accidents in work • Differences in the inventory control (net/gross) • “Productivity” (explained in more detail below)
The fourth group of measures (4) includes those instituted at operating units to meet their clients’ requirements on operational information. Examples of such measures are some of the measures calculated at unit D and reported to their client. For example: 27
• Inbound pipe (the number of order lines that were not stored in the warehouse on time)
• Outbound pipe (the number of order lines that were created as pick orders in ProLogs, but were not picked on time)
• Warehouse denials (the number of times that the system have said that there should be articles at a storage position, but there were not)
• Customer fill (number of delivered order lines in percentage of total ordered order lines)
6.4.2 The Performance Measurement System at DHL Solutions The entity of measures used in the Swedish organization has never been analyzed as a system. Consequently, some dimensions of performance are emphasized more than others. During the interviews in this project, much criticism on the present measurement system was put forward by managers in the organization. Including:
• At headquarters managers lacks the possibility to compare operating units on operational productivity. Therefore, they ask for a standardized, aggregated productivity measure.29

– EMPIRICAL FINDINGS –
45
• The portfolio of measures lacks measures that reflect long-term objectives.29
• The view on performance measurement is not uniform among managers regarding why, what and how they should measure.30
• To be able to use the information from some of the measures in a relevant way, managers who are monitoring them need to have a large amount of pre-understanding of the measures.30
• The quality of some of the measures obtained is quite low because their calculation and data collection often includes manual procedures.32 and 33
• Measures on client and competitor aspects are somewhat under-represented in the present measurement portfolio.29
• There is a need for more detailed information on some of the measures, for example by moving from a monthly review to a daily review.26
6.4.3 Productivity Measurement at DHL Solutions Although highly emphasized in the organization the productivity concept has no uniform definition throughout the organization. The heads of the four operating units examined presents the following definitions for productivity:
• Production of services or products per unit of time (where time is man-hours; that is, labor resources used for the production).24
• The efficiency of processes. It is a mix of the search for a proper capacity level (i.e. resources used in the processes) and inherent in that capacity, a large amount of flexibility.25
• A practical definition is that productivity is the amount of a product or service that you can produce in one unit of time (i.e. man-hour).26
• A definition of labor productivity might be the amount of work done per invested man-hour. However, the whole productivity concept is somewhat wider.27 and 28
Today, managers at the operating units use several measures of productivity: on individual client assignments, specific processes or for the unit as a whole. Although all productivity measures are on the form order lines per man-hour, they differ from each other in the definition of both the numerator and the denominator. In essence, these variables define what process or client that is measured, but also there is some debate on exactly what man-hours that should be accounted for in the formula. The question is which labor resources that are truly the cost drivers for a particular process.24, 25, 26 and 27 Additionally, operating units A and B have other definitions for the numerator. On their largest client, managers at unit A measure so called storage position lines, instead of order lines. The reason for this is that the picking of one order line sometimes

– EMPIRICAL FINDINGS –
46
requires more than one route to the storage position. This measure is also the most important cost driver in the contract with “client x”.24 At unit B, the only productivity measure used is Cost per “unit” for terminal and transportation activities. Basically, this measure is the inverse of the type of labor productivity measures used at the other operating units. However, here they use “units” instead of order lines and cost instead of man-hours. A “unit” is a volume variable developed by SGS and it is supposed to address the problem that garments are not equally in size. For example, a thick winter coat represents eight “units” but a thin shirt only represents two “units”.25 In order to investigate some of the present productivity measures for weaknesses and strengths, and also to test the framework for further use, the performance measure record sheet was used for one measure at each unit. In the record sheet, the respondents at the units were forced to explain, in detail, the different elements of a measure (the elements in the record sheet are presented in appendix 4). Hence, for the first time since the measures were developed, managers had to be explicit about what the measures really are. Appendix 5 presents four performance measure record sheets, one for each unit, for some of the productivity measures used in the organization. When considering productivity as an output to input-concept, the question is how these parameters can be defined at operating unit level. Most heads of operating units agree that the total output of the process is difficult to define and quantify. The units produce services for their clients and the delivery of these services generates financial earnings in proportion to how valuable the services are to the clients. Hence, everything included in the service (tangibles as well as intangibles) is output from the operating units. Although, this might be the overall definition of the output, the actual, physical output of the warehousing process is the amount of orders that are handled and how these orders are handled. If the definition of the output is quite hard to comprehend, the inputs to the production of this output is somewhat easier to define. Generally, it includes all resources consumed during the production of services and can be interpreted as the money spent (i.e. the costs) for this production. See Figure 6.3 for the distribution of costs between different resource inputs at the four operating units.

– EMPIRICAL FINDINGS –
47
0
10
20
30
40
50
60
70
80
90
100Pe
rcen
tage
of t
otal
cos
ts
Labor Rent Wrappings andother materials
Utilities andenergy
Depreciations Other inputs
Unit A Unit B Unit C Unit D
Figure 6.3 Distribution of costs between different resource inputs (Source: Author’s own construct based on interview responses)

– ANALYSIS –
48
7. ANALYSIS In this chapter the current situation (the empirical findings in chapter 6) are analyzed with regard to the theories presented in chapter 3. Also, the main weaknesses in DHL Solutions today are summarized regarding strategic management and performance measurement and a new measurement regime for the Swedish organization is developed.
7.1 Analysis of the Current Situation Although they operate in the same type of businesses (primarily 3PL-warehousing), there are some basic differences between the operating units regarding such factors as culture, processes and types of clients. One obvious fact that will affect the operating units are that DHL Solutions have to face the problems of geographical dispersion; including differences in local regulations, rental prices, wage levels, the supply of skilled workforce, etc. Moreover, the units are different with respect to size (from 12000 square meters to 33 560 square meters for the units examined), number of clients (from one to tens of clients) and number of employees (from 22 to 180). There are also some differences between the units regarding activities in the process and demand for quality control, as well as types and quantities of articles handled (see sections 5.2.1-5.2.4 and 6.3.1). As discussed above, there are clearly a number of distinctive differences between the four operating units examined. However, the question is if these diversities are at a level where they will affect the overall management of the operating units. Because essentially, all units are doing the same thing: providing a warehousing/transportation service to members of supply chains. Consequently, although managers at operating units tend to emphasize the distinctive characteristics of their unit and find obstacles to why comparisons with other units would be impossible, the author of this paper comes to the conclusion that the presented deviations from the general operations are irrelevant when it comes to strategic management from headquarters and overall measurement of operating unit performance. That is, since the units are operating in the same business and in the same country they should strategically be managed as an entity. Because of this, the following analysis of the current situation will be presented as if the operating units can be regarded as equals with regard to strategic management and overall performance measurement. Paragraphs 7.1.1 through 7.1.4 analyze the present situation with regard to strategy formulation, the view on performance measurement, the present PM-system and instituted individual measures.

– ANALYSIS –
49
7.1.1 Strategic Management When investigating the issue of corporate and business strategies in the Swedish organization of DHL Solutions (section 6.2) it becomes apparent that the company does not follow such a distinctive process as the discipline of strategic management (presented in chapter 3.2). That is, there are no obvious connections between the different management levels (i.e. global, regional and local headquarters) with defined processes for strategy formulation, where a corporate strategy is developed at the outset and then translated into business strategies and finally operating plans. Rather, in DHL Solutions there is a functional distinction between the different organizational levels, and at each level, managers are left to handle their operations largely by themselves. Directives and reports are sent back and forth between these different levels without a clear picture of the business as a whole. Although there is a missing link between corporate management and local management, Swedish headquarters try to run their operations strategically and tactically as best as they can. For example, managers at the headquarters in Stockholm have developed a “market plan” (see section 6.2), which states the general course to follow for the coming years. Hence, the weaknesses in the strategic management process do not lie in an inability of managers to think strategically, but rather in the lack of strategic deployment from top level down to the operational level and an insufficient translation of general thrusts into operationally relevant activities. Communication between different levels of the organization as well as between different functions needs to be more ambitious in order for a strategy to be successfully implemented. The same problems with the deployment of strategies can also be found at the operating units. As explained in section 6.2 the heads of the units lack a communication of plans and strategies down to their level. They do, however, have some directives and guidelines to follow, initiated by any higher level of the organization. Although they frequently get such directives, the fundamental problem is said to be a lack of purposes on these directives and a lack of understanding of their operations from higher levels. Primarily this can be explained by the fact that heads of operating units are seldom invited to take part in the formulation of strategies and objectives. In summary, one can conclude that the most critical weakness of the strategy formulation process in the Swedish organization is the absence of a translation of strategies formulated at headquarters into operating plans (with specified actions) to be followed at operating units. Today this is basically done by allocating resources to a number of projects with no clear connection to each

– ANALYSIS –
50
other (often, such project are also initialized to correct problems rather than to implement strategies). As a result of this, management as of today have to face such problems as: simultaneous management of a wide range of separate projects; alienation of the operating units from the overall course of the company; misunderstandings between different levels of the organization; poor commitment to general thrusts; and ultimately, the development of an unbalanced, and far from holistic, performance measurement system.
Market Strategy Another important part of the strategy process, which will also have an impact on performance measurement, is the issue of what market strategy one should follow (see section 3.2). Both heads of divisions in DHL Solutions stated that the market strategies that best fit their present situation in the company are customer intimacy and operational excellence (section 6.2). As explained in chapter 3.4.2 the market strategies followed also enables an organization to focus its measurement system on a limited set of the perspectives in the balanced scorecard. Even though it should not be overemphasized, the financial perspective plays an important role in all measurement systems as a means of tracking the ultimate results of strategic execution. However, the other three perspectives (innovation, customer and internal) can be emphasized in line with the market strategies followed. Due to their focus on being customer intimate and operational excellent, DHL Solutions in Sweden should, apart from the financial perspective, integrate the customer perspective and the internal perspective in their measurement system; while the innovation perspective can be disregarded in the Swedish organization (see section 3.4.2). Apart from just providing some simplification of the situation, this conclusion also involves another important suggestion. In fact, it implies that there is a congruency between the general thrusts in the organization and the performance pyramid. That is, the perspectives to focus on (as described in the balanced scorecard model) match with the dimensions of performance introduced in the pyramid. First, the financial perspective corresponds to the market and financial dimensions in the pyramid. Moreover, the customer perspective is equal to the left part of the pyramid (external effectiveness) in general and the dimension of customer satisfaction in particular. Finally, the internal perspective corresponds to right part of the pyramid (internal efficiency). Hence, the analysis of DHL Solutions’ market strategy provides a validation of the performance pyramid model for further use in the organization.

– ANALYSIS –
51
7.1.2 View on Performance Measurement All operating units as well as higher levels of the organization measure performance in some way. However, the methods of measurement and reporting as well as the individual measures obtained are quite different between these parts of the organization. Primarily this can be explained by the lack of corporate policies on performance measurement which has led to a culture where measures are developed on an ad hoc-basis by managers in the organization. Moreover, measures are not analyzed and critiqued on a continual basis and old measures are seldom dropped. Thus, at any point of time, operating units typically have more measures instituted than they actually monitor and act upon, and probably some of the measures used are dysfunctional or even irrelevant at that time. As shown in Table 6.1 there are some clear discrepancies between what reasons for measurement managers claim to have. Although this is not a dangerous fact, managers obviously use performance measurement for different reasons. This might be explained by the operational differences among the units and the special characteristics of the assignments managed at these units. Or, more likely, it might stem from the fact that managers in the organization have not come to a consensus on the process of performance measurement. Heads of operating units are responsible for their own measures and they can establish measures whenever they feel a need for a specific set of information. Basically, they are left unguided on the overall process of performance measurement. The term Key Performance Indicator (section 3.4), although often used by managers in DHL Solutions, do not have any standardized definition throughout the organization. There are no requirements on what a KPI should constitute and the term is sometimes used for ordinary workflow measures. However, when trying to define it with their own words (section 6.4) the heads of operating units comes pretty close to the definition mentioned in the academic literature. In summary, one can say that the KPI-concept is rather well perceived in the organization but the term is not used accordingly. However, this thesis argues that all measures instituted (irrespective of aggregation level) should be relevant to the present strategies pursued. Hence, all performance measures monitored should in fact be KPIs (except perhaps some metrics used in accounting or as parameters in contracts or planning tools). Therefore, the question of whether a measure should be a KPI or not is temporarily dropped and attention is instead focused on the fact that all performance measures should be keys to success.

– ANALYSIS –
52
7.1.3 The PM-system As explained above, there are no clearly defined policies or guidelines for performance measurement at DHL Solutions in Sweden. Moreover, as is apparent from the empirical findings, the measurement of performance is not incorporated in a system. That is, the company lacks a system-view when it comes to simultaneously tracking individual measures and understanding the trade-offs and relationships between them. When trying to analyze the instituted measures as a system there is also another difficulty. The problem is that in the organization there are no clear definitions of the dimensions measured. When talking about dimensions such as quality, productivity, flexibility, etc. managers talk about different things. Therefore, this system-analysis is primarily based on what types (i.e. dimensions) of measures the instituted measures actually can be interpreted as rather than what dimensions managers claim to monitor. The measures monitored at each management level (presented in chapter 6.4.1) are summarized in appendix 6, with a categorization of the measures according to the dimensions in the performance pyramid (see section 3.4.2). One can easily see that some dimensions of performance are emphasized more than others and that there is no standardized measurement portfolio for the operating units. Consequently, the entity of measures represents a system that is somewhat unbalanced. With this and the analysis of DHL Solutions’ strategic management process (section 7.1.1) in mind, the organization can be viewed in the context of the performance pyramid. It then becomes clear that the pyramid for DHL Solutions is somewhat distorted (i.e. some elements in the pyramid get much more attention than others). Graphically, but not in scale, the present situation at DHL Solutions regarding the performance pyramid can be presented as in Figure 7.1.

– ANALYSIS –
53
Figure 7.1 A distorted performance pyramid at DHL Solutions (Source: Author’s own construct based on Lynch and Cross, 1995)
The figure above should be seen as an attempt to attack the problems with performance measurement at the company and not as a detailed explanation of the present situation. However, the figure addresses the overall problems and makes further explanations easier. The reason why the pyramid is askew is that the elements in the four levels are not equally emphasized. Moreover, the connections between the levels are weak and the deployment of strategies and objectives down through the organization is more or less non-existent. These problems will be further presented below. At the highest level of the pyramid, DHL Solutions have not sufficiently defined their visions and corporate objectives. The few objectives that actually are defined by managers at central levels and communicated down to the Swedish headquarters are primarily based on economical growth whereas client-focused goals are totally absent. Moreover, the company lacks a vision where they define the marketplace in which and the capabilities with which they are to compete. Consequently, because the visions and corporate strategies are not clearly defined the business strategies are insufficiently deployed.
Objectives
Measures
External effectiveness
DeliveryCycle time
Waste Quality
Productivity Flexi-bility CS
Financial
Market
Internal efficiency
Vision

– ANALYSIS –
54
At the second level, in the pyramid denoted the strategic business unit level (in this case equal to the Swedish organization), the emphasis in the company is on financial measures and objectives. This dimension has a long tradition in the company and is largely based on the accounting culture which has evolved through the years. The financial dimension and the measures of e.g. profitability and return on sales are equally emphasized by all management levels of the company. The market dimension, on the other hand, is not monitored at all by managers at operating units or headquarters. Knowledge on this dimension is based on supposition and is probably biased by the present wants and needs of managers. Hence, on this level of the pyramid, managers in the organization focus on strictly internal measures of performance while they totally disregard the external perspective. An unbalanced focus on this level of the pyramid could affect all subsequent levels in an undesirable way. As a consequence of this, the whole organization may be infected by an inward-looking and short-termistic business view. At the third level, where the measures and objectives for the core business processes can be found, the pyramid is even more distorted. To begin with, the core processes are not identified in a plain fashion. The company has not assigned any of their activities the status of being imperative to their business in a standardized way. Consequently, there are differences between the units when it comes to which processes they give most attention, because they have distinguished these processes based on tradition, belief or client’s requirements. Furthermore, the core process level is distorted because the organization weighs the importance of productivity much more than the importance of customer satisfaction and flexibility; at least when it comes to measures and objectives. Some operating units actually work with the flexibility dimension, either as a parameter in the planning process or as an analysis based on information from the business system. Moreover, customer satisfaction is only measured once a year in a survey carried out by a specialized consulting company. However, neither of these two dimensions gets any special attention and the company does not have any defined strategies for them. At the lowest operational level, the operating units primarily measure what in the pyramid is denoted the dimension of delivery. In the pyramid, delivery is one of two building blocks for good performance on customer satisfaction (the other is quality). This dimension includes the delivery of the right products on time and in full. Hence, two of the three reasons for claims fall under the measurement of delivery. The third reason for claims (damaged goods) falls under the measurement of quality, where the goal is to meet customer expectations 100 percent of the time through the delivery of defect free

– ANALYSIS –
55
products. The two building blocks for productivity are the minimizing of cycle times and waste. Although, the measurement and shortening of cycle times is non-existent at the company today, some units have measures for the waste dimension (such as “Failures found in control/order line” measured at unit A). In the organization these measures are defined as measures for internal quality and they primarily focus on the elimination of damaged goods through the warehousing process and the minimizing of failures in the picking process.
Productivity Measurement at DHL Solutions The first, and most obvious, flaw with the productivity dimension that becomes clear when studying the company is that they have not distinctively defined what it is. When asked to define it, the respondents find this difficult and the final answers are different among the managers (for example, one manager state that it is the efficiency of processes, while another argues that it is the amount of a service you can produce per invested man-hour). This is also the case for the general purpose of productivity measurement, which is not uniformly interpreted (the stated purposes range from “enable planning of labor allocations with real figures” to “increase profit margins and clarify if they are on the right track”). Although this may seem as a small problem, it could result in a too narrow definition of the concept. At DHL Solutions, managers put most attention on labor productivity and in the company such measures are actually synonymous with productivity. Hence, what in fact is only a partial measure is treated as a total productivity measure. Accordingly, a measure that at most can explain one part of a dimension of performance at process or department level is actually used as a means of explaining overall cost increases for whole operating units. Although the productivity concept at DHL Solutions is narrowed to only include labor productivity, the overall view on productivity is output/input-oriented. When it comes to inputs the operating units typically use resources such as labor, capital, energy, materials, rent and security; where the only input considered important in the productivity concept is labor hours. However, this view is not as narrow as it may seem, because labor costs represent between 50 and 65 percent of the total resource (i.e. input) costs. From Figure 6.3 it should be clear that the input variables at DHL Solutions can be identified and hopefully also quantified in a meaningful way. However, this is not the case for the output parameter. The output of the service production process is much more difficult to both identify and quantify. Today, DHL Solutions primarily use outbound order lines as a substitute for the total output of the warehousing process. In reality, the output is composed of a wider array

– ANALYSIS –
56
of elements than just order lines and is in the end all things that are of value to the client. The measure of productivity used at DHL Solutions is, as mentioned before, a type of labor productivity measure (the output parameter, however, is only partial). The formula for this measure, with varying definitions of man-hours is:
hours-Manlinesorder OutboundSolutions DHLat ty Productivi =
Based on the general formula for total productivity (total output/total inputs) this can be interpreted as:
costs)" total theof % 50tely (approximainput One"output" total theofPart "ty"ProductiviLabor " =
Another problem with the measurement of productivity at DHL Solutions is that it requires that the quality of the service produced is not affected by productivity changes. That is, even if employees work faster or more efficient, the quality remains constant. However, which is probably evident, this is not the case for the production of services such as 3PL-warehousing. Evidently, the trade-offs between the productivity measure and other dimensions of performance are not fully understood or at least not addressed in a consistent manner in the organization. The worst case scenario by ignoring to monitor performance on multiple dimensions simultaneously and to lack understanding of the trade-offs between these measures is that measures established are in fact counterproductive and that individual processes or functions are sub-optimized.
7.1.4 Instituted Individual Measures The lack of organization-wide guiding principles for performance measurement has resulted in a situation where there are, in the organization as a whole, a multitude of individual measures. However, there are generally four groups of performance measures with respect to why the measures were developed and by whom (see section 6.4.1). The next few paragraphs contain an analysis on these individual measures (see appendix 6) with respect to the recommendations presented in Table 3.1 and the performance measure record sheet (see Table 3.2 as well as appendix 4 and 5).
Title The first important implication from the performance measure record sheet is that measures should have clearly defined titles, used by all concerned throughout the organization. A distinct and unique title for each measure will simplify understanding and prevent mix-ups with other measures. In DHL

– ANALYSIS –
57
Solutions this element of the measure development process is not given any certain attention. Often, formulas (for example, “order lines per man-hours”) or general descriptions (i.e. “Productivity”) act as substitutes for distinctive titles. These problems are especially intrinsic in the measurement of labor productivity, where a wide range of different measures with rather similar definitions are obtained. However, some of the other dimensions include measures with more appropriate titles. Examples of such are: “Manageable employee turnover” reported into the shared company server (without being to specific, the title says something about what is being measured and maybe also why); “Return on sales at operating result 1 or 2” measured at multiple levels (without being the actual formula, the title reveals how to measure it by clarifying what result level to use); and “Warehouse denials” measured at unit D (short and clear – once explained, then easily understood).
Purpose It is probably obvious that an established performance measure should be relevant to the business operations managed. But maybe it is not equally obvious that to be relevant a performance measure needs to have an explicit purpose. The purpose of a measure is the actual reason to why it exists. However, at DHL Solutions, measures are developed without a proper formulation of purposes. As mentioned, it is sufficient for managers to “feel” a need for a measure in order for them to institute it and hence, purposes of measures are indistinct and subject to change. Consequently, the purpose of a typical measure is not consistently interpreted throughout the organization.
Relates to As explained in section 3.4, most academics agree that performance measures should be derived from strategy. In particular, each measure must relate to one or more of the business objectives defined for the chosen strategy. If not, one can question if the measure is relevant and if it should be monitored at all. Consequently, it is important to identify the objectives to which the measure is related. In DHL Solutions the problems on this element of the measure development process runs much deeper than just ignorance of the connections between measures and business objectives. The true source to these problems is the lack of a comprehensive strategic management process in the organization (see section 7.1.1). At DHL Solutions in Sweden, managers do not translate business strategies into operating plans and hence, they do not define any strategic objectives. Therefore, when trying to relate for example the labor productivity measures to business objectives or strategies in the record sheet, heads of operating units find this task difficult. Often, they are only able to

– ANALYSIS –
58
identify a connection to some overall requirements on their operations, such as the need to continuously improve productivity and enhance profitability.
Target One of the most basic recommendations on performance measurement is that it should focus on improvement. That is, each measure should have a specific goal, a targeted level of performance to be achieved in a pre-defined period of time. These targets for individual measures should be a function of the capabilities of competitors, the requirements of clients and the capabilities of the internal operating system on the dimensions measured. Most measures used in DHL Solutions do have specific targets connected to them. However, these targets are more based on budgets, fixed improvement goals or client’s demands than on the organization’s competition. Hence, it is difficult for managers to comprehensively assess whether they are improving performance fast enough.
Formula, Frequency, Who measures? and Source of data Furthermore, performance measures should provide accurate feedback on processes in a simple and understandable way and, which is even more important, measures should be based on variables that can be influenced by the employees actually measured. These recommendations lead to demands on: the formula; the source of data; frequency of review; and employees responsible for measurement. Managers at operating units and at headquarters have a sufficient knowledge of the formulas that their measures are based on. However, the formulas are not necessarily the same throughout the organization. Differences in operating unit characteristics, history of measurement and culture of accountability have led to a situation where formulas for measures on some dimensions are not uniform in the organization. An example of this is the debate on what man-hours to account for in the labor productivity formula. Some managers state that the measure is only relevant if all labor hours are included, while others are content by defining man-hours as only blue collars in the specific processes measured. When it comes to defining the source of data for the measures used, there are no apparent shortcomings in the organization other than the fact that all operating units have not been provided with the same support tools for data collection. Some units have implemented sophisticated time registration systems and analysis tools for data processing while others have to rely on manual collection of data (for instance, counting printed claims by hand).

– ANALYSIS –
59
The frequency of measurement and review is typically monthly in the company. Although this is probably adequate for most measures, managers at some operating units express a need for information with a shorter frequency. There are measures that would be interesting to monitor on a daily basis as the monthly reports are long since irrelevant and corrective actions come too late. Finally, managers in DHL Solutions should identify more clearly the persons responsible for collecting and reporting data on measures as well as the employees affected by these measures.
Who acts on the data? and What do they do? The last part of this analysis of individual measures is concerned with how well managers in the organization actually close the management loops that the establishment of measures is initiating. That is, if a measure turns out to be changing in a positive or negative way, who is supposed to act on that information and what is that person supposed to do? Basically, one needs to identify the person (typically a manager) responsible for performance improvements on the dimensions measured (this person is often referred to as the “owner”) and the general management processes to follow when performance is either acceptable or unacceptable. In DHL Solutions the identification of owners is achieved in a satisfactory way by typically appointing the highest responsibility to the head of the unit or the warehouse manager. The identification of management processes, on the other hand, is generally overseen as managers are too unspecific about what they do when performance is changing. Most of the respondents, while filling in the performance measure record sheet, could only specify a procedure of meetings or discussion and obviously lacked knowledge on management actions and accountabilities. Consequently, there is an apparent risk that the management loop for some of the measures is not closed. As a summary one can say that some instituted measures are merely tracked whereas performance on them is not managed.
7.2 Summary of Main Weaknesses and Flaws The above analysis is now summarized on the main weaknesses and flaws instituted in DHL Solutions’ strategic management process and their PM-process. In this thesis, the term PM-process is used as an overall denotation of the whole issue of performance measurement, integrating the elements of: the view on performance measurement, the PM-system and instituted individual measures.

– ANALYSIS –
60
Strategic Management By just concluding that the whole process of strategic management at DHL Solutions is seriously flawed, would be to simplify the situation too much. Although they have many problems in this area, there are also great possibilities to improve. In Table 7.1 below, the present situation in the organization on the issue of strategic management is presented with regard to strengths, weaknesses, opportunities and threats (a SWOT-analysis). Table 7.1 SWOT-analysis of the present strategic management process
(Source: Author’s own construct)
The PM-process The main weaknesses and flaws instituted in the present PM-process at DHL Solutions are summarized in Table 7.2 below. This table examines the current process of performance measurement in general and the set of individual performance measures and the performance measurement system in particular.
Strengths • Skilled managers • Experience on the development of
plans based on internal and external conditions (i.e. the “market plan”)
• An external environment which is quite stable
Weaknesses • Poor communication of strategic issues • Weak connections between different
management levels • Weak relationships between activities
and measures on the operational level and overall strategies and objectives
Opportunities • The possibility to provide the
information that will engender understanding
• Boost commitment to strategic implementation
• More adequate resource allocations • The opportunity to develop a relevant
and balanced PM-system
Threats • Alienation of operating units from the
overall objectives • Misunderstandings between managers • Poor commitment to general thrusts • The use of a PM-system which is
unbalanced and not connected to strategies

– ANALYSIS –
61
Table 7.2 Main weaknesses and flaws with the present PM-process
(Source: Author’s own construct)
7.3 A New Performance Measurement Regime With the analysis of the current situation as a background one may now conceptualize the ideas presented in chapter 3 in a new measurement regime for DHL Solutions in Sweden. However, at this point one must stress that the following analysis is only based on a limited set of information from the organization as a whole and should primarily be seen as a support for how to develop such a measurement regime in the company. First, prior to the development of a new measurement regime, DHL Solutions should overlook their whole strategic management process. However, since this is a rather complex process where one must include all management levels and businesses in the company this falls outside of the delimitations of this thesis. Second, DHL Solutions in Sweden should try to translate their strategies and objectives (often on the form of interpreted directives from higher levels of the organization) into defined action steps for the operational level in a more systematic way. That is, they should develop an operating plan for the Swedish organization. However, since this is a quite comprehensive process (see appendices 7 and 8 for a presentation of how to develop an operating plan) the following analysis will be more of a translation of the general thrusts and objectives identified at the Swedish headquarters into generic objectives for the different management levels in the organization.
• Lack of consensus on the overall subject of performance measurement • Instituted measures are not derived from strategic objectives • Lack of standardized guidelines and policies on the subject • Ambiguous directives from different levels of the organization • Poor definitions of different dimensions of performance • Lack of unified focus on what measures to track (wide range of measures used) • Lack of system-view on the subject of performance measurement:
o Unbalanced emphasis on the different performance dimensions o Insufficient knowledge of the trade-offs between measures o Lack of simultaneous measurement of multiple dimensions
• Individual measures are not continually criticized and they are seldom dropped • Certain elements of the performance measure record sheet are not sufficiently
defined for some measures. Including: o Titles o Purposes of measures o Relations to strategic objectives o What do they do? (i.e. definitions of management actions)

– ANALYSIS –
62
A new measurement regime for DHL Solutions in Sweden would first include a reconsideration of Figure 6.2 and an adjustment of the present view on objectives setting and measurement feedback. Figure 7.2 displays a new view on how the accountability of objectives and measures should be managed in the Swedish organization. The client-specific measures (group 4 in Figure 6.2) are disregarded in this model due to the delimitations of this thesis but basically, managers should try to incorporate such measures into the internal measurement system by redesigning them or substituting them with measures instituted in the internal system.
Figure 7.2 A new view on objectives setting and measurement feedback
(Source: Author’s own construct)
This new view entails several differences compared to the present view and will probably (if implemented) simplify the processes of information handling and performance measurement. The first obvious implication is that all measures calculated at the operational level are actually reviewed by managers at the operating units and then a selected set of those measures are aggregated and reported up to the Swedish headquarters. Hence, there is no possibility for information to take the VIP-lane directly from the lowest level to the highest
Internal Processes
Objectives for core processes and
processes
Managers at Swedish headquarters
Managers at central levels
Managers at operating units
Objectives and strategies for the
Swedish organization
Overall unit measures and core process measures
Total performance measures
Objectives foroperating units
Clie
nt
Cus
tom
er
Overall unit measures, core process measures and process measures

– ANALYSIS –
63
level in the organization, surpassing all intermediate management levels (as is now the case in Figure 6.2). Furthermore, there are three management loops embedded in the model; one for each adjacent pair of management levels. These loops are explained in more detail below. When setting objectives and strategies for the Swedish organization, the regional headquarters (or corporate headquarters) should do this in cooperation with representatives from the Swedish headquarters. These overall objectives are then translated by managers at the Swedish headquarters together with operating unit managers into objectives for the operating units. The operating unit managers (maybe with support from resources from the headquarters) then start to detail these unit objectives into specific objectives or actions for their core processes and individual processes. After all objectives have been deployed down through the organization, identifying the work that needs to be done at each level, managers need to decide on what measures that should act as feedback on these objectives from the bottom up. First, operating unit managers (with support from headquarters) identify the measures they need as feedback on how well they are meeting objectives on their core processes and processes. Then operating unit managers together with managers at the Swedish headquarters can aggregate some of these measures into overall operating unit measures and finally, Swedish headquarters can report their total performance to central levels. The above procedure will ensure that each management loop is closed and that managers from all levels of the organization take part in this process, enabling managers to see the overall course of the company. Also, the process entails a more distinctive culture of accountability for objectives and measures compared to the current situation. The new model presented in Figure 7.2 also shows a striking resemblance to the model of the performance pyramid (presented in section 3.4.2). Therefore, the rest of this analysis will be based on the dynamics and dimensions of the performance pyramid.
A New PM-system The below presentation of a new measurement system rests upon three critical assumptions. First, the following performance measurement system presumes that a corporate strategy and a business strategy have already been formulated in the organization in some fashion. Here, these overall strategies will only be identified and interpreted. Second, the system also presume that the Swedish

– ANALYSIS –
64
organization is more or less a strategic business unit (SBU), whose strategic execution will not affect (or be affected by) other parts of the company to a great extent. In reality, a more sufficient definition of the SBU would probably be the regional organization (i.e. Nordic/UK) or DHL Solutions as a whole. Third, the model is somewhat based on the assumption that the production of the services DHL Solutions provide are simple enough to enable a delimitation of the model to not include a set of different core processes (in which case one would have to develop more than one bottom half of the pyramid). In order to be able to use the performance pyramid successfully, managers in the organization first need to reach a unified understanding of its dimensions and components. Since this has not been done at DHL Solutions in Sweden, proposed definitions of the different parts of the pyramid are presented in appendix 9, along with summaries on the present situation of each dimension. The new performance measurement system developed in this analysis will now be presented from the top down in the pyramid. The first step in developing this PM-system is to formulate a vision for DHL Solutions as a whole. The vision as it was interpreted by the author of this thesis is presented in Figure 7.3.
Figure 7.3 DHL Solutions’ vision (Source: Author’s own construct based on a statement by the head of division industrial)
Once the vision is recognized and established, managers in the Swedish headquarters can identify the objectives and strategies set by central levels in the organization. Figure 7.4 presents some generic strategies that DHL
“To provide superior 3PL-solutions for warehousing and
related services that enhance our clients’ business capabilities, in a way that we are perceived as the leading supplier of such services
by companies in the industry-specific sectors we operate.”
Vision

– ANALYSIS –
65
Solutions in Sweden follow today. The feedback through measures on the execution of these strategies is presented in Figure 7.5.
Figure 7.4 Generic strategies for the Swedish organization (Source: Author’s own construct)
Figure 7.5 Feedback through measures to central levels (Source: Author’s own construct)
Strategies for the core processes at the operating units are presented in Figure 7.6 and the corresponding feedback is displayed in Figure 7.7.
Market Financial
VisionVision and Business Strategy Corporate level and Nordic/UK
The Swedish organization
Core processes
Individual Processes
• DHL Solutions in Sweden should contribute to DHL’s overall image in a positive way! • DHL Sols (SE) should deliver a x % profit by every month-end! • DHL Sols (SE) should provide state-of-the-art services to their clients in a way that strong relationships develop! • DHL Sols (SE) should focus on cost-efficiency! • DHL Sols (SE) should consolidate their operating units into fewer, larger multi-user units!
Market Financial
VisionVision and Business Strategy Corporate level and Nordic/UK
The Swedish organization
Core processes
Market Share (%) Market position No. of new sales
Overall client retention
Market Measures
Financial Measures
Individual Processes Profit
Return on Sales Return on Assets

– ANALYSIS –
66
Figure 7.6 Strategies and objectives for the core processes at operating units (Source: Author’s own construct)
Figure 7.7 Feedback through measures on core process performance (Source: Author’s own construct)
The final management loop in this PM-system is closed by setting process objectives (see Figure 7.8) and deciding on what measures that should act as feedback on those objectives (see Figure 7.9).
CS Flex. Prod.
Market
Vision and Business Strategy Corporate level and Nordic/UK
The Swedish organization
Core processes
Individual Processes
Financial
General Thrusts • Reduce costs • Improve quality of services • Increase flexibility for large
volume variations Specific Strategies • Improve work methods and
procedures • Increase standardization in
operations • Develop a workforce with
multiple flexible skills • Improve communications
CS Flex. Prod.
Market
Vision and Business Strategy Corporate level and Nordic/UK
The Swedish organization
Core processes
Individual processes
Financial
Surveys (index) Client retention (%)
Contract time (mean) No. of complaints
On-time delivery for rush orders (%)
On-time delivery for large-volume orders
Time to implement new assignments or VASs
Revenues/Costs (SWOT/Net Sales)
Customer Satisfaction
Productivity
Flexibility

– ANALYSIS –
67
Figure 7.8 Generic strategies and objectives for the operational level (Source: Author’s own construct)
Figure 7.9 Feedback through operational measures to operating unit managers (Source: Author’s own construct)
CT WasteDeliveryQuality CS Flex.
Vision and Business Strategy Corporate level and Nordic/UK
The Swedish organization
Core processes
Individual Processes
Prod.
• Increase ability to meet or exceed clients’ expectations in each process
• Enhance all processes capabilities to work together in a way that correct orders are delivered on-time
• Focus attention on all processes’ cycle times and increase the proportion of hands-on time in each process
• Concentrate on reducing wasteful activities in all processes
CT WasteDeliveryQuality CS Flex.
Vision and Business Strategy Corporate level and Nordic/UK
The Swedish organization
Core processes
Individual Processes
% problem-free deliveries Ability to meet clients’ expectations (index)
% of services meeting specification
% on-time deliveries (to customers in-full and
correct orders) % of orders completed on-time for shipment
Delivery
Quality
In-process scrap (cost) Cost of inspection and control
Cost of rework (due to claims etc.)
Cycle Time
Time to complete each process
“Hands-on time Tot. cycle time
Waste
Prod.

– ANALYSIS –
68
7.3.1 Implications for the Organization Although, the above performance measurement system should only be seen as an example of how the measure development process could turn out, the new performance measurement regime presented in this analysis would probably involve a number of interesting implications for the organization with regard to the weaknesses of the current situation. Including:
• Stronger connections between management levels (see Figure 7.2) • More distinctive communication of objectives • Consensus on the issue of objectives setting as managers at multiple
levels take part in this process • A clearly defined culture of accountability • Enhanced overall understanding of the performance measurement
process • Provided definitions of different dimensions • A more holistic and balanced system-view • A portfolio of measures established as an entity (including the possibility
to critique old measures in a more comprehensive context) However, questions can still be raised whether or not:
• Measures in the system are truly derived from strategies? • Individual measures are well-designed?
The first question touches upon the issue of strategic management and the lack of such a systematic approach in the above analysis. The objectives and measures established in the new measurement system are based upon a limited set of information and can not be seen as being derived from strategy. However, the result would probably be better if the same process would be followed by managers inside the organization. The second question, regards the fact that the individual measures presented in the system have not been validated though the use of for example the performance measure record sheet. Hence, at this point one can not tell whether the measures are well-designed or not.

– CONCLUSIONS –
69
8. CONCLUSIONS This chapter repeats and summarizes the general conclusions drawn from the analysis with respect to the purpose of this thesis.
8.1 General Conclusions This thesis argues that the issue of performance measurement is and must be closely related to the concept of strategic management. That is, the development and establishment of performance measures should be an integrated step in a much more comprehensive process where managers formulates the strategies and objectives for their future business. Measures should act as feedback on those objectives and enable managers to monitor how successfully they are executing their selected strategies. Today, DHL Solutions do not follow such a systematic process as the strategic management process and they separate the issues of strategy formulation and performance measurement. Consequently, it is impossible to say if the instituted measures are truly derived from strategic objectives or if the measures used are irrelevant for the current thrusts of the organization.
8.2 The Performance Measurement Process The most important conclusion regarding the overall process of performance measurement is that managers in the Swedish organization of DHL Solutions have not reached a consensus on the issue. Reasons for measurement are different among the managers and heads of operating units lack standardized procedures for the establishment of measures. Also, the organization would benefit from instituting clear accountabilities and reporting structures for performance measures. When viewing the set of measures used in the organization as a system, the situation gets quite problematic. Definitions of the different dimensions of performance are missing and the measures used add up to a seriously distorted and unbalanced measurement system when viewed as an entity (see DHL Solutions’ pyramid in Figure 7.1). The internal efficiency-perspective in general (the right side of the pyramid) and the financial and productivity dimensions in particular are heavily overemphasized; whereas the dimensions of cycle time, quality (as defined in the pyramid), customer satisfaction and market are almost entirely overseen. Moreover, trade-offs between the dimensions measured are not fully understood. Hence, the conclusion is that DHL Solutions should examine what dimensions of performance they want to

– CONCLUSIONS –
70
measure, clearly define these dimensions and integrate them in a system (such as the performance pyramid), before they develop any new individual measure. From the investigation of individual measures by using the performance measure record sheet one can draw some general conclusions. First, it should be clear that a future use of this tool for the establishment of measures in the company can enhance the probability that developed and instituted measures are relevant and well designed. Secondly, for the measures used today, there are a couple of distinctive weaknesses on some of the elements in the record sheet. The major gaps are:
• Titles of measures are insufficiently defined • Purposes of some measures are not sufficiently formulated • Measures are not explicitly related to strategic objectives • Management actions (when changes in measures occur) are not defined

– RECOMMENDATIONS –
71
9. RECOMMENDATIONS This chapter contains a set of recommendations for DHL Solutions to follow in order to improve their process of performance measurement.
9.1 Four General Recommendations The results from this thesis add up to four general recommendations for the company under investigation. These four recommendations are (with decreasing complexity):
1. DHL Express and Logistics should incorporate a comprehensive strategic management process in their whole corporation.
2. DHL Solutions in Sweden (or Nordic/UK) should translate their “Business Strategy” into an operating plan (including a tailored measurement package) in order to implement the selected strategies and align measures to strategies.
3. DHL Solutions in Sweden should make use of the performance pyramid as a framework for PM in order to simplify the process of developing a PM-system.
4. DHL Solutions in Sweden should make use of the performance measure record sheet for all their instituted measures as well as every time they develop a new measure in order to keep track of the entity of measures and insure that each measure is well-designed.
These four recommendations are briefly repeated and described below in sections 9.1.1 through 9.1.4.
9.1.1 Implement Strategic Management in DHL Since the process of strategic management, as being a very powerful steering and control mechanism for managing an enterprise with multiple businesses, has not been implemented in the corporation, the most obvious recommendation for DHL on the basis of this thesis would be to present an action-plan for doing this. See figure 3.1 for a repetition of the strategic management process. However, the delimitation of the project to only concern the Swedish operations of DHL Solutions contradicts such a recommendation because it would primarily be directed towards corporate top management. Therefore, it will not be further elaborated here.
9.1.2 Develop an Operating Plan for DHL Solutions in Sweden DHL Solutions in Sweden should translate their business strategy into operationally relevant actions in an operating plan; including the issues of how and why they should measure performance. See appendices 7 and 8 for a comprehensive presentation of how this can be done at DHL Solutions. A

– RECOMMENDATIONS –
72
major danger by implementing this recommendation separately from the first recommendation, is that the use of the operating plan will most likely be superimposed on top of existing management processes and systems rather than being an integrated step in the strategic management process. However, the author of this thesis is of the opinion that the positive effects (e.g. organizational learning and the possibility to relate performance measures to strategies) of using this process overweighs the risks of having a too narrow demarcation on the scope of the process.
9.1.3 A Framework for a PM-system at DHL Solutions in Sweden Generally in business research, the issue of performance measurement is quite underdeveloped and it still includes a number of serious flaws and dangers. However, the best way to evade these dangers inherited in the monitoring of individual measures is to follow two basic recommendations. The first recommendation is to focus on measuring improvement in system performance rather than absolute levels of performance. The second recommendation is to measure multiple dimensions and levels of performance in a system instead of attempting to focus on a single measure or even a group of the same kind of measures. Thus, one needs a framework for a performance measurement system to use in order to assure that a holistic view on the operations is established every time a new measurement package is developed. An advantage with such a framework is that the framework itself can be standardized, even though individual measures in it as well as focus and emphasis on dimensions may change over time. In this thesis, the framework used for system development is the performance pyramid (presented in section 3.4.2). The following paragraphs present important issues and examples of how DHL Solutions can use the performance pyramid to develop a performance measurement system which is aligned with the strategies selected in the operating plan (if one is used). See also section 7.3 for the author’s view on how a tailored measurement system for DHL Solutions in Sweden might turn out when analyzing the current situation. When managers in DHL Solutions have decided upon what strategies they are to pursue in the future, and developed an action-plan for each strategy, they can determine what measures that should be included in the measurement package for tracking the progress of the strategies. The framework for performance measurement discussed above (the performance pyramid) acts as a supporting tool in this process. Managers want to find a holistic and multi-dimensional measurement system, aligned with the strategies executed in the operating system. Measures on the second level of the pyramid (the market and the financial dimensions) are reviewed at the top of the Swedish organization (and

– RECOMMENDATIONS –
73
probably by higher levels of the organization) as a means of tracking the ultimate success of all strategy implementations in combination. Measures on the lower two levels are tailored for each operating strategy that is to be implemented and therefore, managers need to establish as many sets of measures on these levels as there are strategies. Each specific set of measures are reviewed by those affected by the strategy implementation for which progress that set is instituted to track. However, top managers in the Swedish organization should apart from the measures on the second level probably only track the core process measures (customer satisfaction, flexibility and productivity) and not the process or department measures for each strategy. An important point is that although the final measurement package needs to be holistic, all dimensions do not have to be exactly equally emphasized. Depending on the strategies selected some dimensions will be more focused than others. Appendix 9 presents proposed definitions for the dimensions in the performance pyramid, along with summaries on the present situation of each dimension. The general recommendations on how DHL Solutions can improve their system-view on the overall issue of performance measurement based upon this summary are presented below.
• DHL Solutions needs to integrate a continual measurement on the dimensions of market, customer satisfaction, flexibility, quality and cycle time into their PM-system and gain experience of measuring these dimensions.
• For the financial dimension, they need to distinguish more clearly the actual tracking of financial performance from financial metrics in accounting and budgets.
• DHL Solutions should tune down their high emphasis on the productivity dimension (unless it is clearly related to a selected strategy) and distinguish between tracking the overall core process performance on this dimension and the productivity metrics used as parameters in contracts and planning tools.
• DHL Solutions must overlook their definition of the quality dimension and avoid mix-ups between the externally oriented quality concept and the internally focused waste concept.
• Regarding the waste dimension, DHL Solutions must start to analyze the cause-and-effect relations in their operations in order to learn which activities that are actually non-value-added (i.e. waste) and what activities that are the causes for them.

– RECOMMENDATIONS –
74
When consensus have been reached on the definitions in the performance pyramid DHL Solutions must assess their history and culture of performance measurement system-thinking. That is, they must attain a uniform understanding of their present and previous focus on instituted measures. As this thesis concludes, their view on performance measurement is quite distorted. Consequently, this view should be balanced before any new measures are established. They must learn the benefits of measuring multiple dimensions on multiple levels of the organization simultaneously, but at the same time take advantage of their experiences of measurement on some of the dimensions (e.g. financial, productivity and delivery measurement). One important issue for DHL Solutions (briefly outlined in section 7.1.2 when discussing the KPI-concept) is that they must separate strategically derived measures from other types of metrics. The former are those incorporated in the tailored measurement package and are: the information base for decision making; the means of focusing efforts; continually monitored; the way of tracking strategy implementation; reviewed and discussed at meetings; and displayed on notice boards, in newsletters, etc. for all employees concerned. Such measures should be highly focused and be of concern to the operating system as a whole. The latter, on the other hand, may be those metrics operating units are required to calculate because they are: variables in support tools or management systems; parameters or standards to be met in assignments; cost-drivers in contracts; measures on specific deviating activities for some operating units. Such metrics should fall under the responsibility of the operating unit managers and should not be integrated in a performance measurement system or regarded by other members of the operating system.
9.1.4 Establish Guidelines for Individual Measures Even after reviewing the recommendations for and the analysis of the PM-system, there are still some general recommendations to put forward on the issue of individual performance measures. As stated in the conclusions, DHL Solutions would probably benefit from an implementation of the performance measure record sheet for the design of new performance measures. That is, every time managers are to institute a new measure (either as a step in the operating plan formulation process or as they are using the PM-concept today) they should be able to precisely define all elements of the record sheet for that measure. If they do not succeed in this, the specific measure must be redesigned before evaluated again. DHL Solutions could also use the performance measure record sheet on all their established measures in order to review them on actual relevance for the present operations. Managers at the Swedish headquarters should push the heads of the operating units to deliver

– RECOMMENDATIONS –
75
record sheets for all the measures they use today, irrespective of how successful they are in completing the record sheets. The best result with this process will probably be achieved if a skilled and analytic facilitator (for example from the headquarters) helps operating unit managers to complete the record sheets before sending them to headquarters. Then managers at headquarters can use this information to analyze their wide spectrum of measures as an entity in order to be able to: drop irrelevant measures; improve dysfunctional measures; learn from the use of well-designed measures; and standardize similar measures. The process for how DHL Solutions can use the record sheet for their management of measures is presented in Figure 9.1.
Figure 9.1 How DHL Solutions should use the performance measure record sheet (Source: Author’s own construct)
Gksjskjhssjksk
Hgkjhskjslsksssk
skjhsjhjhjhsjhsjsj
ksjksjslkjskjksjk
slkslsklklklksksl
Gksjskjhssjksk
Hgkjhskjslsksssk
skjhsjhjhjhsjhsjsj
ksjksjslkjskjksjk
slkslsklklklksksl
Gksjskjhssjksk
Hgkjhskjslsksssk
skjhsjhjhjhsjhsjsj
ksjksjslkjskjksjk
slkslsklklklksksl
Order lines/man-hour
Claims per order line
Failures in picking
ROS
In-process scrap Warehouse denial
Customer fill
Idle capacity
Accidents in work
…
…
…
…
Measures monitored at operating units
1. Develop a record sheet for each measure
2. Gather all record sheets in a document
?
Establishment of new measures
Gksjskjhssjksk
Hgkjhskjslsksssk
skjhsjhjhjhsjhsjsj
ksjksjslkjskjksjk
slkslsklklklksksl
Dispose of irrelevant measures
3. Analyze the entity of measures
Gksjskjhssjksk
Hgkjhskjslsksssk
skjhsjhjhjhsjhsjsj
ksjksjslkjskjksjk
slkslsklklklksksl
Redesign dysfunctional
measures
Document

– DISCUSSION –
76
10. DISCUSSION This chapter ends the thesis by providing a discussion on how DHL Solutions could use the recommendations presented and how these recommendations, if implemented, would affect the organization. Furthermore, the chapter contains a presentation of the results from the benchmarking session at CFI Group.
10.1 External Environment and Planning Horizon During the past decade, the business of logistics has faced lots of changes in the external environment. First, globalization and the merge of companies into large corporations have affected logistics services in that they have to cover more widespread geographical areas with their distribution networks. Second, new companies have entered the market, which have led to prize pressures and tougher competition between the different actors. Moreover, during the 90’s, the advances on information technology had great impacts on logistics companies. Nowadays, to be able to stay competitive, they are often required to have sophisticated warehouse management systems, track and trace-applications and EDI-interfaces towards the clients. Although, all these changes may imply that a company such as DHL Solutions is in a volatile market, the empirical study of this thesis points in the other direction (see primarily section 6.1). Innovation is no longer focused to the same extent and the process of merging and takeover has slowed down. Also, the entry barriers on the global market are quite high, but the potential market has not reached its saturation point. New assignments can be found; primarily from companies who manage their own warehouses today. Also, government regulations are not that tough on the business of 3PL-warehousing (DHL Solutions core business) and the general business climate is promising. Hence, all these factors point to the conclusion that DHL Solutions (at least in Sweden) is operating in a rather stable external environment. DHL Solutions’ external environment will probably have an impact on the issue of strategic management and, ultimately, also on performance measurement. Primarily, the external environment affects such variables as length of planning horizon and requirements on performance (i.e. targets). For DHL Solutions, as being in a rather stable environment, the planning horizon could be quite long, presumably up to 3 years.10 That is, every third year, the company needs to reinvestigate their strategies and, hence, also redesign their performance measurement system in order to keep up with changing environments and new competitive conditions. Furthermore, targets on individual performance measures should be set with regard to the present skills of competitors on the dimensions measured. This, however, is a later step in the

– DISCUSSION –
77
process of establishing strategically driven performance measures and falls outside the scope of this study.
10.2 How to Use the Recommendations? This thesis presents four general recommendations for how DHL Solutions can overcome their weaknesses in the present performance measurement process and develop a new holistic and balanced performance measurement system consisting of relevant and well-designed measures. The four recommendations are quite different from each other regarding their complexity and how complicated they would be to implement. Figure 10.1 presents a matrix where the four recommendations’ expected impact on the overall success of the organization is plotted against the probability to successfully implement a particular recommendation.
Figure 10.1 A probability/impact-matrix for the recommendations (Source: Author’s own construct)
The four recommendations can be used separately or as a group depending on what available resources there are in DHL Solutions and what level of ambition they have for the performance measurement issue. If the recommendations are used separately, DHL Solutions would probably benefit from starting out with recommendation number four and then work their way up towards recommendation number one. If implemented in the organization and used according to Figure 9.1, the performance measure record sheet (recommen-dation number 4) will presumably enhance the understanding of what measures
Rec. no. 2
Rec. no. 3
Rec. no. 4
Recommendation no. 1
Impact on overall success of organization
Less
More
Probability of implementation success High Low

– DISCUSSION –
78
they should use in the future and a limitation and standardization of the existing set of measures, making the situation more comprehensible. However, the record sheet as it is presented in section 3.4.1 probably needs to be slightly altered to really fit the situation at DHL Solutions. Managers in the organization ask for some other elements that should be integrated in the record sheet. Such elements are: “reporting structure” (once instituted, to whom should the measure be reported); “implementation” (if establishing an entirely new measure, what are the costs and efforts required when implementing it); and “human behavioral aspects” (a discussion of how the measure will affect the behavior of the people concerned). Recommendation number three involves both the integration of the established measures in a system (the performance pyramid) and a reconsideration of the new performance measurement regime (presented in section 7.3). Even though DHL Solutions choose not to follow recommendations number one and two in order to implement a new way to manage strategies and objectives they should try to formulate objectives (even though they do it on an ad hoc-basis) for the different organizational levels and identify the individual measures that corresponds to these objectives. Furthermore, these identified measures should be integrated in a system (such as the performance pyramid) in order for managers to be able to analyze the entity of measures and find missing links between organizational levels or dimensions.
10.3 Customer Satisfaction – A Wider Perspective This thesis also takes into account the results from a brief benchmarking session carried out at a consultancy firm (CFI Group) in the business of customer satisfaction management. Here the results from this benchmark is presented and basically, they can be seen as an additional research into the customer satisfaction dimension but also, due to the methodology used by the consultancy firm, it can be viewed as an alternative way to handle strategy formulation and objectives setting (a view that is somewhat simpler than the systematic and internal approach presented in appendices 7 and 8). CFI Group is a consultancy firm based in Ann Arbor (Michigan) with 14 offices throughout the world, including one in Stockholm. Their services have faced growing demands ever since they were founded in 1988 due to many organizations’ increased focus on non-financial measures. CFI Group’s methodology is based on the principle that satisfied customers are economic assets that yield future cash flows. Below follows a presentation of the

– DISCUSSION –
79
methodology used by CFI Group to measure and manage the customer satisfaction dimension.35 The methodology used by CFI Group aims at optimizing the customer satisfaction dimension for their clients and answers the following questions: 36
• What factors of our organizations should we focus on in order to increase customer satisfaction?
• What are the costs for the improvements required? • Will the benefits exceed the costs?
At the outset of the process CFI Group determines what driving forces for customer behaviour that will ultimately affect customer satisfaction. Such driving forces might be product quality, service, customer support or price. Then they investigate the correlation between these driving forces and customer behaviour due to changes in customer satisfaction, and ultimately to financial performance such as profitability. After these connections have been identified, CFI Group continues by executing comprehensive surveys on the current customer satisfaction. This is both done for satisfaction on the different driving forces and as the total satisfaction of the company. However, CFI Group argues that only customer satisfaction rankings for the driving forces or for the whole company are insufficient pieces of information and might enhance the risk to make faulty management choices (for example, the price factor tend to be bottom ranked irrespective of how satisfied customers really are). Therefore, CFI Group uses a patented methodology for analyzing the results from the surveys in order to investigate each driving force on its effect on overall customer satisfaction.36 CFI Group’s methodology to use cause-and-effect analysis on the customer satisfaction dimension will generate interesting results for the company. First, they will provide information on what driving forces (or organizational factors) that should be focused and improved in order to enhance customer satisfaction. Also, they will identify the relations between customer satisfaction and desired behaviour from the customers and profitability of the organization.36 Appendix 10 presents a sketched relationship-figure for the driving forces that could be at place for DHL Solutions in Sweden and the customer behaviour these driving forces could engender. However, obviously the figure does not present any rankings or effect parameters for these elements.
35 Homepage – www.cfigroup.se 36 Interview – Magnus Creutz, CFI Group

80
LIST OF REFERENCES
Books: 7 Bell, J. (2000). Introduktion till forskningsmetodik. 3 ed. Studentlitteratur.
Lund. ISBN: 91-44-01395-7 9 Brassington, F. and Pettitt, S. (2000). Principles of Marketing. 2 ed. Pearson
Education Limited. Harlow, England. ISBN: 0-273-64444-0 6 Ejvegård, R. (1996). Vetenskaplig metod. 2 ed. Studentlitteratur. Lund.
ISBN: 91-44-36612-4 2 Fitzgerald, L., Johnston, R., Brignall, T. J., Silvestro, R. and Voss, C.
(1991). Performance Measurement in Service Businesses. CIMA. London. ISBN: 0-948036-78-8
10 Judson, A. S. (1996). Making Strategy Happen: Transforming Plans into
Reality. 2 ed. Blackwell Publishers Inc. Malden, Massachusetts. ISBN: 1-55786-721-6
1 Lynch, R. L. and Cross, K. F. (1995). Measure Up! – Yardsticks for
Continuous Improvement. 2 ed. Blackwell Business. Cambridge, Massachusetts. ISBN: 1-55786-718-6
5 Wallén. G. (1996). Vetenskapsteori och forskningsmetodik. 2 ed.
Studentlitteratur. Lund. ISBN: 91-44-36652-3
Articles: 14 Bititci, U., Carrie, A. and McDevitt, L. (1997). Integrated performance
measurement systems: a development guide. International Journal of Operations & Production Management, Vol. 17, Issue 5/6, p522.
8 Brignall, S. and Ballantine, J. (1996). Performance measurement in service
businesses revisited. International Journal of Service Industry Management, Vol. 7, No. 1, pp. 6-31.
3 Flapper, S., Fortuin, L. and Stoop, P. (1996). Towards consistent
performance management systems. International Journal of Operations & Production Management, Vol. 16, No. 7, pp. 27-37.

81
23 Grönroos, C. and Ojasalo, K. (2004). Service productivity: towards a conceptualization of the transformation of inputs into economic results in services. Journal of Business Research, Vol. 57, Issue 4, p414.
19 Kanji, G. (2002). Performance measurement system. Total Quality
Management, Vol. 13, Issue 5, p715. 20 Kaplan, R.S. and Norton, D.P. (1992). The balanced scorecard: measures
that drive performance. Harvard Business Review, January-February, pp. 71-9.
22 Nachum, L. (1999). Measurement of productivity of professional services.
International Journal of Operations & Production Management, Vol. 19, No. 9, pp. 922-950.
13 Neely, A., Gregory, M. and Platts, K. (1995). Performance measurement
system design: a literature review and research agenda. International Journal of Operations and Production Management, Vol. 15, No. 4, pp. 80-116.
15 Neely, A., Richards, H., Mills, J., Platts, K. and Bourne, M. (1997).
Designing performance measures: a structured approach. International Journal of Operations & Production Management, Vol. 17, No. 11, pp. 1131-1152.
11 Parker, C. (2000). Performance measurement. Work Study, Vol. 49, No. 2,
pp. 63-66. 17 Sinclair, D. and Zairi, M. (2000). Performance measurement: a critical
analysis of the literature with respect to total quality management. International Journal of Management Reviews, Vol. 2, Issue 2, p145.
16 Slater, S., Olson, E. and Reddy, V. (1997). Strategy-based performance
measurement. Business Horizons, Vol. 40, Issue 4, p37. 21 Stainer, A. (1997). Logistics: a productivity and performance perspective.
Supply Chain Management: An International Journal, Vol. 2, No. 2, pp. 53-62.
18 Tangen, S. (2003). An overview of frequently used performance measures.
Work Study, Vol. 52, No. 7, pp. 347-354.
82
12 Vuorinen, I., Järvinen, R. and Lehtinen, U. (1998). Content and
measurement of productivity in the service sector: a conceptual analysis with an illustrative case from the insurance business. International Journal of Service Industry Management, Vol. 9, No. 4, pp. 377-396.
Homepages: 35 CFI Group, http://www.cfigroup.se – 2004-11-29 DHL, http://www.dhl.se – 2004-07-19 4 Forskningsmetodik, Avdelningen för allmänmedicin vid Göteborgs
Universitet, http://www.infovoice.se/fou/ – 2004-08-18
Internal Documents and Brochures: “Facts & Figures 2003” – DHL Solutions (Brochure) 34 Logistical Process Flow for DHL Solutions in Sweden (Power Point), April
2004. 31 Market Plan for DHL Solutions in Sweden (Power Point), January 2004. “We move the world” – DHL (Brochure)
Personal Interviews: 24 Head of Operating Unit A. DHL Solution. 2004-07-21 36 Creutz, Magnus – Team Leader. CFI Group, Stockholm. 2004-10-07 26 Head of Operating Unit C (and Nordic coordinator of the MORE-project
initiative on Warehouse Productivity). DHL Solutions. 2004-07-27 30 Head of Division Industrial. DHL Solutions, Swedish Headquarters,
Stockholm. 2004-09-10 32 Controller, Division Industrial. DHL Solutions, Swedish Headquarters,
Stockholm. 2004-10-11 29 Head of Division Consumer. DHL Solutions, Swedish Headquarters,
Stockholm. 2004-07-08

83
25 Head of Operating Unit B. DHL Solutions. 2004-09-13 28 Production Support Manager (at Unit D). DHL Solutions. 2004-08-20 27 Head of Operating Unit D. DHL Solutions. 2004-08-20 33 Controller, Division Consumer. DHL Solutions, Swedish Headquarters,
Stockholm. 2004-10-11

84
APPENDICES Appendix 1 – Interview Guide, Heads of Divisions
Appendix 2 – Interview Guide, Division Controllers
Appendix 3 – Interview Guide, Heads of Operating Units
Appendix 4 – Elements in the Performance Measure Record Sheet
Appendix 5 – The Record Sheet for Measures Used at DHL Solutions
Appendix 6 – Measures Monitored at DHL Solutions in Sweden
Appendix 7 – Development of an Operating Plan
Appendix 8 – Generic Strategy Options for the Operating Plan
Appendix 9 – Definitions in the Performance Pyramid for DHL Solutions
Appendix 10 – Customer Satisfaction at DHL Solutions

1 (3) Appendix 1
85
Interview Guide, Heads of Divisions 1. Date: 2. Respondents name and title: 3. Operating units under the respondents responsibility: 4. Number and type of clients to these operating units: 5. Short description of DHL Solutions (e.g. type of company, organization and
operations):
Present situation – External environment 6. From the perspective of DHL Solutions, what is the general situation
regarding the overall business climate? 7. Which government regulations particularly affect the business at DHL
Solutions? 8. Who are your main competitors and on what are the competition based (e.g.
cost, quality, time or flexibility)? 9. Are the threats from entries of new companies large in the market (what are
the entry barriers)?
Present situation – Corporate and business strategy 10. Shortly describe the visions, goals and strategies of the organization? 11. These four market strategies are described in the theory, which (one or
more) fits the present situation at DHL Solutions best? 16 � Product leaders seek to identify emerging opportunities and
continuously strive to develop and deliver new products that exceed existing performance boundaries. The key task for product leaders is to maintain an environment in which focused creativity can flourish. A typical product leader is Intel.
� Customer intimacy is the strategy of companies such as IBM. They focus their efforts on building strong relationships with a select group of customers whose needs they understand deeply and who are willing to pay a premium for the service or special attention they receive. Accompanying this orientation is a focus on the lifetime value of a relationship, not just the profit from an individual transaction.
� Brand champions are the mass market counterparts of customer-intimate businesses. Companies such as Coca-Cola and Procter & Gamble invest heavily in advertising to build up the value of their

2 (3) Appendix 1
86
brands. Superior marketing capabilities are the foundation skills of the brand champion.
� Operational excellence is the discipline of business that offer the lowest total cost to their customers. In many cases, such as with Wal-Mart and Southwest Airlines, this may mean the lowest price. In other cases, though, it means identifying other critical costs to customers, reducing them, and avoiding price competition. Two operating characteristics are common to most of these businesses. The first is a commitment to standardization and simplicity. The second characteristic, and one that is invisible to most customers, is the use of information technology.
Present situation – Internal environment
12. What type of company is DHL Solutions with respect to the style of
headquarters/operating unit relationship? 8 � Centralized (that is, one-business companies which determine
operating unit strategy at the centre and apply tight operational controls)
� Strategic planning (companies whose centers have a high degree of influence over operating unit planning, but use flexible controls)
� Strategic control (companies which have low influence over operating unit planning but tightly control the implementation of the operating units chosen strategy)
� Financial control (companies which use tight financial controls over operating units but take little interest in their strategic planning)
Present situation – Performance measurement
13. What measures of performance (KPIs) do you use today to monitor the
operating units? 14. What are these measures used for? That is, why do you, as head of a
division, want to monitor these measures? 11 � To be able to identify success � To be able to identify if you are meeting clients’ requirements � To help understand your processes � To identify where problems, bottlenecks or waste exist � To ensure decisions are based on fact � To show if improvements planned, actually happened � Other reasons:
15. According to you, what dimensions of performance do you monitor today?

3 (3) Appendix 1
87
16. Do you think that all important dimensions of performance are covered with the measures you use today for your division (if not: which are missing)?
17. Does the existing measurement portfolio include measures which relate to both long- and short-term objectives of the business?
18. Do you use any measures that focus on customer satisfaction? 19. Do you use any measures that focus on what the competitors are doing? 20. Name one measure frequently used at your operating unit (afterwards, let
the measure go through the performance measure record sheet below)? 21. Answer the following questions about the stated measure in the performance
measure record sheet: 15 • Title: • Purpose: • Relates to: • Target: • Formula: • Frequency of measurement: • Frequency of review: • Who measures? • Source of data: • Who acts on the data? • What do they do? • Notes and comments:
Present situation – Productivity measurement
22. According to you, what is the definition of productivity?

1 (2) Appendix 2
88
Interview Guide, Division Controllers 1. Date: 2. Respondents name and title: 3. Short description of the controller’s assignments:
Present situation – Internal environment 4. Describe the information systems used in the organization and how
communications between units and headquarters are managed: 5. Explain how, why and when budgets are set: 6. Are there any reward or punishment systems in place for managers at units
or headquarters? 7. What type of company is DHL Solutions with respect to the style of
headquarters/operating unit relationship? 8 � Centralized (that is, one-business companies which determine
operating unit strategy at the centre and apply tight operational controls)
� Strategic planning (companies whose centers have a high degree of influence over operating unit planning, but use flexible controls)
� Strategic control (companies which have low influence over operating unit planning but tightly control the implementation of the operating units chosen strategy)
� Financial control (companies which use tight financial controls over operating units but take little interest in their strategic planning)
Present situation – Performance measurement
8. Briefly describe the culture and strategies concerning performance
measurement at DHL Solutions: 9. What measures of performance are you responsible for as controller? 10. According to you, what dimensions of performance do these measures
cover? 11. Do you think that all important dimensions of performance are covered with
the measures you monitor today (if not: which are missing) and what are the weaknesses with the existing measurement system?
12. According to you, do the heads of units have an appropriate level of understanding on measurement issues in general and the established measures in particular?

2 (2) Appendix 2
89
13. What would you say: are heads of units resistant or adaptable to change on measurement related issues?
14. Do managers in the organization critique and analyze existing measures continually (are irrelevant measures dropped)?
15. Briefly explain the culture of accountability regarding measures in the organizations (e.g. sponsors, owners, responsibilities):

1 (2) Appendix 3
90
Interview Guide, Heads of Operating Units 1. Date: 2. Respondents name and title: 3. Name and division of operating unit: 4. Clients to the operating unit: 5. Short description of the operating units business:
Present situation – Internal environment 6. What type of company is DHL Solutions with respect to the style of
headquarters/operating unit relationship? 8 � Centralized (that is, one-business companies which determine
operating unit strategy at the centre and apply tight operational controls)
� Strategic planning (companies whose centers have a high degree of influence over operating unit planning, but use flexible controls)
� Strategic control (companies which have low influence over operating unit planning but tightly control the implementation of the operating units chosen strategy)
� Financial control (companies which use tight financial controls over operating units but take little interest in their strategic planning)
Present situation – Performance measurement
7. Briefly describe the culture and strategies concerning performance
measurement at DHL Solutions: 8. Define what a key performance indicator (KPI) is or should be: 9. What measures of performance are used at your operating unit today (for
internal use and for reporting to headquarters)? 10. What are these measures used for? That is, why do you, as head of a unit,
want to measure performance at your unit? 11 � To be able to identify success � To be able to identify if you are meeting clients’ requirements � To help understand your processes � To identify where problems, bottlenecks or waste exist � To ensure decisions are based on fact � To show if improvements planned, actually happened � Other reasons:

2 (2) Appendix 3
91
11. According to you, what dimensions of performance do you measure at your operating unit today?
12. Do you think that all important dimensions of performance are covered with the measures you use today at your operating unit (if not: which are missing)?
Present situation – Productivity measurement
13. According to you, what is the definition of productivity? 14. What measures of productivity do you use today at your operating unit? 15. Do these measures cover all interesting aspects of the productivity concept? 16. What is the primary purpose with productivity measurement, according to
you (e.g. increase the profit margin or reduce the price)? 17. Are there, stated in the organization, any management strategies concerning
the work with productivity and productivity measurement? 18. What are the outputs of your unit (that is, what is produced or generated)? 19. What are the inputs to the production of these outputs (that is, resources
consumed in order to produce the outputs)? 20. Historically, how are costs distributed between these inputs? 21. How is it intended that you should increase your productivity (e.g. increase
the output or decrease inputs)? 22. Name one measure of productivity frequently used at your operating unit
(afterwards, let the measure go through the record sheet below)? 23. Answer the following questions about the stated productivity measure in the
performance measure record sheet: 15 • Title: • Purpose: • Relates to: • Target: • Formula: • Frequency of measurement: • Frequency of review: • Who measures? • Source of data: • Who acts on the data? • What do they do? • Notes and comments:
24. Describe the dynamics behind this measure as well as the factors that influence the outcome of the measure:

1 (2) Appendix 4
92
Elements in the Performance Measure Record Sheet This appendix contains an explanation of the elements in the performance measure record sheet as provided by Neely et al. (1997).
Element 1 – Title (Recommendations 2, 8 and 15) The title of the measure should be clear. A good title is one that, in a simple way, explains what the measure is and why it is important.
Element 2 – Purpose (Recommendations 6 and 10) If a measure has no purpose then one can question whether it should be introduced. Hence, the underlying principle of the measure has to be specified. Typical purposes include to:
• Enable us to monitor the rate of improvement, thereby driving down the total costs
• Ensure that all delayed orders are eliminated • Ensure that the new product introduction lead time is continually reduced
Element 3 – Relates to (Recommendations 1, 5, 6 and 9) As with purpose, if the measure being considered does not relate to any of the business objectives then one can question whether the measure should be introduced. Hence, the business objectives to which the measure relates should be identified.
Element 4 – Target (Recommendations 4, 5, 6, 7, 9 and 10) The objectives of any business are a function of the requirements of its owners and customers. The levels of performance (i.e. the target) the business needs to achieve to satisfy these objectives are dependent on how good its competitors are. Without a clear target, which specifies the level of performance to be achieved and a time scale for achieving it, it is impossible to assess whether performance is improving rapidly enough and whether the business is likely to be able to compete in the medium to long term. An appropriate target for each measure should therefore be defined. Typical targets include:
• 20 percent improvement year on year • Achieve 98 percent delivery performance (on time, in full) by the end of
next year
Element 5 – Formula (Recommendations 2, 4, 8, 11, 12, 14, 15 and 16) This is one of the most challenging elements to specify because the formula – the way performance is measured – affects how people behave. The goal is to define the formula in such a way that it encourages actions which are good for

2 (2) Appendix 4
93
the business. One of the golden rules of performance measurement is that there is no point in measuring someone on something over which they have no control.
Element 6 – Frequency (Recommendation 3) The frequency with which performance should be recorded and reported is a function of the importance of the measure and the volume of data available. Some organizations may have to split this element in two parts: frequency of measurement and frequency of review.
Element 7 – Who measures? (Recommendations 4 and 13) The person who is to collect and report the data should be identified.
Element 8 – Source of data (Recommendations 11, 12, 13, 14 and 15) The source of the raw data should be specified. The importance of this question lies in the fact that a consistent source of data is vital if performance is to be compared over time.
Element 9 – Who acts on the data? (Recommendations 4 and 5) The person who is to act on the data should be identified. There are companies who make a difference between someone who acts on the data and someone who owns the measure.
Element 10 – What do they do? (Recommendations 4 and 5) This is probably the most important element in the performance measure record sheet, not because it contains the most important information, but because it makes explicit the fact that unless the management loop is closed, there is no point in having the measure. It is not always possible to detail the action that will be taken if performance proves to be either acceptable or unacceptable, as this is often context specific. It is, however, always possible to define in general the management process that will be followed should performance appear to be either acceptable or unacceptable. Typical entries for this box include:
• Set up a continuous improvement group to identify reasons for poor performance and to make recommendations as to how performance can be improved
• Publish all performance data and an executive summary on the shop floor as a means of demonstrating commitment to empowerment.

1 (4) Appendix 5
94
The Record Sheet for Measures Used at DHL Solutions This appendix contains a performance measure record sheet for one productivity measure at each operating unit.
Operating Unit A At operating unit A, the author of this paper agreed with the head of the unit to carry out a deeper investigation of the productivity measure used for “client x”. The performance measure record sheet for this measure, storage position lines per man-hour, is presented below.
Elements Details
Title Storage position lines (“moves”) per man-hour.
Purpose To control the efficiency of the internal processes for “client x” and to continuously improve them.
Relates to No clearly defined strategies other than the demand for continuous improvement of productivity and its relation to the financial objectives in the company.
Target Fixed improvement target (in percent) related to goals in the budget.
Formula Storage position lines (“moves”)/man-hour (blue collar man-hours for the specific process).
Frequency The frequency of measurement and review is monthly.
Who measures? The head of the unit
Source of data Storage position lines from production statistics (in ProLogs) and man-hours from time registration system (“CASA”) in combination with manual time allocations.
Who acts on the data? Production supervisor and head of operating unit
What does he do? Hard to define - he has not acted in a structured way before.
Notes and comments: According to the head of the unit, the operations at the unit are stable and well-known, which results in a situation where he seldom is surprised when reviewing measures. The measures are more of verifications to him.

2 (4) Appendix 5
95
Operating Unit B For further investigation, the head of the unit was asked to define the productivity measure used at the operating unit in more detail. The performance measure record sheet for this measure, Cost per “unit”, is presented below.
Elements Details
Title Distribution and terminal expenses (cost per “unit”).
Purpose Not exclusively defined. In essence, it is supposed to act as an incentive for improved behaviour and to control costs.
Relates to Since it is a measure related to transportation activities there is no connection to an overall strategy in DHL Solutions.
Target Not defined.
Formula All costs connected to the distribution and terminal activities divided by total handled units.
Frequency The frequency of measurement and review is monthly.
Who measures? The financial manager at the unit.
Source of data Costs in the financial system (they have not been integrated in DHL Solutions’ business system yet) and “units” in the transportation system.
Who acts on the data? The head of the unit and the warehouse manager.
What do they do? First they double check the data. Then they control if there has been any changes on the wages or volumes. The explanation for poor performance can be that labor is not sufficiently planned or that the situation is different from what they thought regarding volumes and order structures.
Notes and comments Performance on this measure is primarily supposed to be improved by lowering the costs (by price negotiations with haulage contractors or by employee management) or by increasing the number of handled “units” (by new sales etc.).

3 (4) Appendix 5
96
Operating Unit C To reach a closer understanding of the measures actually used at unit C, the head of the unit was asked to explain in detail the elements of one of his productivity measures, outbound boxes per man-hour. This measure is presented below, on the form of the performance measure record sheet.
Elements Details
Title Boxes per man-hour
Purpose To support planning and to represent a feedback to the employees (rewards etc.).
Relates to No overall strategies are defined but the measure is related to the demand for cost-efficient internal processes.
Target The target is 90 boxes per man-hour (both on individuals and as a total). The standard objective is to raise the target by one box per year by developing more efficient processes.
Formula The number of picked boxes (outbound) divided by the number of hours consumed (blue collars only).
Frequency The frequency of measurement is daily and the frequency of review is weekly and monthly.
Who measures? Production supervisors.
Source of data Manual counting of boxes in the order papers and hours from manual time reports.
Who acts on the data? The warehouse manager.
What does he do? Discuss performance on operating meetings and on occasion develop action-plans.

4 (4) Appendix 5
97
Operating Unit D At operating unit D, further investigation was carried out for the measure “outbound order lines per man-hour” (blue collars). The production support manager tried to define this measure on the elements in the performance measure record presented below.
Elements Details
Title “Productivity” or order lines per man-hour
Purpose Through feedback, motivate the employees to improve. Also, it is a way for managers to see what conditions they give their employees and to find structural changes in the assignment.
Relates to Not defined.
Target 37 order lines per man-hour. New targets are set each year based on last year’s performance. The client wants to see an improvement year-on-year.
Formula Number of outbound order lines divided by total consumed labor hours for picking and loading.
Frequency The frequency of measurement is weekly and the frequency of review is monthly.
Who measures? A combination of persons.
Source of data ProLogs for the order lines and CASA for the hours.
Who acts on the data? Primarily the warehouse manager, but the head of the unit is in the end responsible for the outcome.
What do they do? Discussions among the managers and initiate improvement plans.

1 (1) Appendix 6
98
Measures Monitored at DHL Solutions in Sweden HK – Managers at headquarters C – Operating unit C A – Operating unit A D – Operating unit D B – Operating unit B
D X X X
X
X X X
X
X
X
X
X
C X X
X
X X X
X
X
X X
B X
X X X
A X X
X
X X
X X
HK
X
X
X
X
(X)
Serv
er
X
X
X
X
X
X
X
X
X
Typ
e of
mea
sure
Prod
uctiv
ity?
Was
te?
(Des
crip
tion)
(D
escr
iptio
n)
Qua
lity
and
Del
iver
y D
eliv
ery
Was
te
Mar
ket
Prod
uctiv
ity (r
esou
rce
utili
zatio
n)
Prod
uctiv
ity (c
ost e
ffic
ienc
y)
Fina
ncia
l Fi
nanc
ial
Fina
ncia
l Q
ualit
y an
d D
eliv
ery
Was
te
Was
te
Was
te
Was
te
Prod
. (la
bor p
lann
ing
eff.)
or f
lexi
bilit
y W
aste
W
aste
W
aste
W
aste
? D
eliv
ery
Pr
oduc
tivity
(“Pa
rtial
”)
Mea
sure
Man
agea
ble
empl
oyee
turn
over
A
bsen
teei
sm
Ren
t/squ
are
met
er
Sella
ble
capa
city
C
ompl
aint
s (cl
aim
s/or
der)
O
n tim
e de
liver
ies (
orde
rs)
Inve
ntor
y ac
cura
cy
Clie
nt n
et c
hang
e Id
le c
apac
ity
SWO
T/N
et S
ales
(HA
& V
AS)
Pr
ofit
Ret
urn
on sa
les (
RO
S) a
t OR
1 R
OS
at O
R2
Cla
ims p
er o
rder
line
Fa
ilure
s fou
nd in
con
trol/o
rder
line
O
rder
line
s with
out f
ailu
re in
pic
king
Sc
rap
bottl
es in
% o
f tot
al b
ottle
s Pa
llets
with
out f
aults
La
bor f
lexi
bilit
y an
alys
is
In- &
out
boun
d pi
pe
War
ehou
se d
enia
ls
Diff
. in
inve
ntor
y co
ntro
l A
ccid
ents
in w
ork
Cus
tom
er fi
ll “L
abor
pro
duct
ivity
” (m
any
form
s)

1 (7) Appendix 7
99
Development of an Operating Plan This appendix presents a systematic approach for the development of an operating plan for the operating system (for example the Swedish organization of DHL Solutions). First, a model for the development is presented and then each step in the model is detailed in a formulation process. This appendix is primarily based on Judson (1996). The figure below displays a model for the formulation of an operating plan.
The operating plan’s primary purpose is to translate the generic outside-in view of the business strategy (i.e. it is oriented primarily to the firm’s external
Business strategy
Define and describe operating system
Analyze system
Target high-leverage opportunities for
change/improvements
Review/select generic operating strategies
Formulate tailored operating strategies
Develop actions for operating plan
Determine expected gains, metrics and
monitoring
Revise plan according to monitoring
experience
Set internal goals and priorities to
implement business strategy
Critique recent plan implementation and improvement efforts
Inventory strengths and weaknesses
Assess management
and organization
2
3
4
5
6
7
89
10
11
12
1
13

2 (7) Appendix 7
100
environment), into detailed action steps, based on the firm’s internal environment. This will enable a successful execution of the strategies selected for the strategic business unit, as a carefully formulated and systematically implemented operating plan will enhance the probability of a successful change in the operating system and the behavior of the people in it in a desired direction. The model above presumes that a preliminary strategic business plan has already been formulated for the strategic business unit (step 1). At least, managers who are to develop the operating plan need to know: the requirements of corporate management; the overall strategic objectives of the business; and the resources they can make use of to achieve these objectives. The model presented in the figure above will now be elaborated as well as adjusted to DHL Solutions on the form of a structured process for managers to follow in order to formulate and implement an operating plan. To set the stage for the formulation of an operating plan, decisions must first be made about its scope, planning group and Sponsor. Then, a number of work sessions follow in which the planning group addresses several issues of interest (including performance measurement). The entire process is sketched in the figure on the next page and further explanations for the activities are presented below. The first activity, prior to the actual start of the formulation process, is to determine the scope of the operating plan. That is, one should define the operating system to be addressed by the plan (this corresponds to the first half of step 2 in the figure on the previous page). Determining the scope is a matter of first setting the boundaries of the system and then establishing what must be addressed within these boundaries. In the case for DHL Solutions, the operating system regarded in this project is simply the entire Swedish organization with all its functions, business processes and supporting systems. However, further research into the connections between this system and other parts of the organization (especially the support functions at regional headquarters) is probably required to fully understand the scope of the operating system. Once the scope of the operating plan has been defined, a planning group which will be responsible for formulating the operating plan should be assembled (the second activity prior to the start of the formulation process). This group should contain the collective knowledge and understanding of all significant components of the operating system. For DHL Solutions in Sweden such a group could be composed of between 15 and 25 managers and supervisors, representing all levels and functions of the organization.

3 (7) Appendix 7
101
The third activity, prior to the work done by the planning group, is the designation of a Sponsor for the operating plan and the definition of the Sponsor’s role in formulating and implementing the plan. In this case, such a person would typically be someone positioned at the top of the Swedish organization with power to launch the planning process and with management qualities to establish the climate of accountability required for the plan to be successfully implemented. Furthermore, a planning group leader, or organizer, should be appointed.
Before the planning group meet for their first session, two critical inputs are prepared in order to engender group consensus and uniform understanding of the operating system and the current reality at the outset of the process. One of these inputs is a preliminary situation characterization (corresponding to the
Situation characterization
Business strategy imperatives
Work session I
Task groups • Proposed issues and actions
Work session II
• Draft summary and plan • Loose ends
- Gains - Timing
- Responsibilities- Resources
Review session
Proposed summary and plan
Sponsor review and approval
• High-leverage targets of opportunity
• Priorities/objectives • Strengths and
weaknesses • Options/strategies • Barriers/obstacles • Issues
• Actions • Responsibilities • Timing • Resources • Gains • Measures • Monitoring plan • Assumptions • Issues • Risks
Implement! • Tasks • Formal reviews • Revise/update strategy,
actions and measures • Integrate with reward
systems • Integrate with budgets
1. Define the scope of the operating plan
3. Designate a Sponsor for the operating plan2. Form a planning group

4 (7) Appendix 7
102
second half of step 2 in the first figure). This is a proposed description of the operating system that lays out in detail:
• The context in which the system operates • Its components and elements • How the system works as an entity
This proposed situation characterization should be developed from research based on interviews with representatives of the organization. The questions this situation characterization should be able to answer, some of which this paper answers briefly, is presented in the table below (with questions touched upon in this report marked with an asterisk).
Questions for a Situation Characterization
• What is the scope of the SBU’s business and operating system?
• What is the business context for the SBU? *
• What is the role or mission of the operating system? *
• What organization structure is in place? *
• What management characteristics predominate? *
• What cross-functional collaboration exists?
• What are the characteristics of first-line supervision?
• What are the characteristics of the workforce?
• What is the nature of training and development?
• What are the characteristics of the work climate?
• What is the nature of planning/scheduling?
• What are the characteristics of management information within the operating system and between it and other corporate departments? *
• What performance measures are in use? *
• What is the nature of communications within the operating system and between it and other corporate departments? *
• What rewards and compensation are used? *
• What is the operating system’s relationship with other corporate departments? *
• How would one characterize the performance of the operating system?
• What are the characteristics of the operating system’s culture? *

5 (7) Appendix 7
103
The other input to the first working session is an analysis of the demands made on the operating system by the business strategy and how these demands are being perceived by operating system managers. When the business strategy is well understood by the planning group, they set out on the process that will result in the choice of operating strategies (not more than six) and the formulation of action programs to support these strategies. The choice of these operating strategies (steps 9 and 10 in the first figure) should be based on the three analyses (steps 4, 5 and 8) presented below. In the initial working session, the planning group devotes the first part of the time to review, modify and validate the situation characterization. As they do this they also generate a list of potential high-leverage targets of opportunity. This is the first of the three analyses and corresponds to step 4 in the first figure. The term “high-leverage” refers to those elements of the operating system where the application of resources will generate an exceptionally powerful impact in changing the entire system in the desired direction. This analysis is done by first defining and describing the internal operating system and then comprehensively analyzing this system (steps 2 and 3). See the table on the next page for an example list of high-leverage targets as it might turn out for DHL Solutions.

6 (7) Appendix 7
104
After the planning group has completed this list they try to develop consensus on what priorities that should be driving the operating system in its support of the business strategy. This is the second of the three analyses and corresponds to step 5 in the first figure. The input on business strategy imperatives prepared prior to the working session is used to stimulate this discussion. Once the planning group has determined the priorities for the operating system, these are applied to prioritize the list of high-leverage targets of opportunity generated earlier in the session. The highest priority targets are later on translated into objectives for the operating plan. The third analysis contains of an assessment of the operating system’s capability to deliver what is required to implement the business strategy. This step consists of a systematic assessment of the strategically relevant strengths and weaknesses in the operating system (step 8 based upon steps 6 and 7).
High-Leverage Targets of Opportunity
• How can we compare the operating units with each other and learn from best practice?
• What can we do in order to be able to continue to charge higher prices than some of our competitors?
• How can we strengthen our brand on the Swedish market and erase the governmental label?
• How do we resolve differences between client’s desires and operational capabilities?
• In what way can we use performance measurement in order to deal effectively with poor performance and encourage superior performance?
• How can we provide a service that is flexible to large volume variations but at the same time holding down our costs?
• How can we increase our clients’ willingness to extend their contracts by focusing on customer satisfaction?
• What can we do when it comes to support tools and information systems in order to assist all operating units with superior, as well as equal, operating conditions?
• How can we motivate managers and employees to work in a proactive way with focus on improvements?
• Do we need to focus more on training and education for our employees? If so, in what areas?
• What can we do in order to shorten the time it takes to implement a new client assignment?
• How can we continue to cut our costs?

7 (7) Appendix 7
105
Once the planning group has completed the three analyses outlined above (corresponding to steps 4, 5 and 8 in the first figure in this appendix), they devote the remaining time of the initial working session to select the strategy options on which to base their operating plan (appendix 8 presents a quite comprehensive list of 33 generic strategy options companies typically choose between at this level of the organization). By limiting their choice to fewer than six options, they ensure that the operating plan will be sharply focused. The strategies selected should describe the general routes by which management intend to achieve the strategic objectives of the operating plan. The planning group should then form one task group for each selected strategy, whose tasks before the next session will be to develop plans of proposed action steps specifying the work required to implement them. The second working session is primarily devoted to formulating detailed action programs. Using the task groups’ proposals as a point of departure, the planning group agrees on specifications of the tasks, deliverables and possible management assignments for the work required to implement each strategy. Then the planning group develops a tailored measurement package and a plan for monitoring so that implementation progress can be tracked for the operating plan as a whole and for each of its strategies (see section 7.3 for further discussions on the issue of performance measurement). Prior to the final working session, small groups formed from the planning group should complete three tasks. First, they should prepare a draft Proposed Operating Plan Summary document containing the elements of the plan already agreed upon by the planning group. Second, they estimate the expected quantifiable gains that will be achieved if the action programs are completed successfully. Third, they complete the action programs and integrate them in a master action program that specifies: any relationships between the tasks; the time spans for each action step; and managerial accountability for each task. Then, in their final working session, the planning group review and complete the draft Proposed Operating Plan Summary document before a final plan document is submitted to the Sponsor for review and validation or modification (if the Sponsor has not participated in the planning group). Then the plan is distributed to managers and supervisors in the operating system and implementation can begin.

1 (11) Appendix 8
106
Generic Strategy Options for the Operating Plan This appendix contains three lists that support the selection of operating strategies. The identification of one general emphasis option in the first list and a focus on two or three of the thrust options in the second list, makes the decision of which (a maximum of six) operating strategies to follow much easier (the third list). The 33 generic strategy options are presented in the order of their relative demand on the operating system (from low to high); where strategies 1 through 9 are quite traditional in nature, whereas strategies 26 through 33 make special and stringent demands on any operating system. The lists are adopted from Judson (1996). Emphasis Options
1 External emphasis The business we are in is at the stage where the most important things are happening outside the company, in the marketplace where our customer and competitors are. If we are to maintain or increase our share of the market, we have to be successful in playing a fast-moving highly competitive game in which we can take full advantage of quick turns and opportunities at the right moment. For example, our products and services have to be either in tune with what customers want, or available when wanted, or noticeably better than the competitor’s, or all of these – even if it increases the challenges internally.
2 Internal emphasis The business we are in has settled down to the point where either our position in the market is acceptable and reasonably secure and stable, or where there is little opportunity to improve our position. We need to put more emphasis on how well we function internally, improving our controls, costs and margins, as well as the consistency and smoothness of our operations. This kind of productivity improvement is now the main part of our business plan.
3 Mixed external and internal emphasis The business we are in is at the stage where we have to pay close attention to both external and internal affairs. Our internal operating effectiveness is the key to keeping our margins up, but that alone is not enough to ensure success. We also have to be alert and responsive to changes in the marketplace if we are to remain competitive. This situation requires continual trade-offs between internal and external considerations.

2 (11) Appendix 8
107
Thrust or Theme Options
1 Improve quality of products/services The main thrust should be to improve the conformance to customer requirements of our product/service quality. If our customers can see and value our superior quality, we can improve our competitive position in the marketplace by bettering the level and/or uniformity and/or reliability of our quality.
2 Improve fixed-asset utilization The main thrust should be to improve utilization of our facilities and equipment by:
• Improving the layout of our facilities • Improving planning and scheduling • Making use of idle capacity/wasted space • Reducing downtime caused by breakdowns, setups, changeovers, etc. • Increasing throughputs • Redesigning equipment
3 Increase flexibility for changes in products and services The main thrust should be to improve the organization’s ability to respond quickly and flexibly to market requirements for product/service innovations; introducing market-oriented improvements and features that meet the requirements of time, cost and specification.
4 Reduce costs The main thrust should be to cut all our costs to the lowest practical level. This will either improve profit margins, or allow us to adopt new pricing strategies aimed at improving our market share.
5 Increase flexibility for changes in volume (capacity) The main thrust should be to improve the organization’s ability to respond flexibly to market requirements for substantial changes in volume for products and/or services. This includes managing our capacity in relation both to growth demands and to seasonal and cyclical changes.
6 Improve ability to meet scheduled commitments The main thrust should be to improve the organization’s ability to deliver existing products/services with reliable predictability – on time, in accordance with promises to customers and planned schedules.

3 (11) Appendix 8
108
7 Increase capacity for short-cycle delivery The main thrust should be to improve the organization’s ability to respond very quickly and flexibly to customers’ requirements for product/service delivery cycles shorter than the “normal” cycle for manufacturing or service response to customers’ orders. This includes both increases and decreases in volume and unexpected demands for “specials”.
8 Improve materials utilization The main thrust should be to improve the utilization of materials by:
• Reducing scrap, waste and obsolescence • Improving process yields • Recycling • Redesigning products, services and packaging
9 Improve people utilization The main thrust should be to improve the utilization of employees’ capabilities, with particular emphasis on:
• Management style • How decisions are made • Communications • Ways of resolving conflicts • Training and development • Rewards • Motivation • Selection and placement • Clarifying and simplifying roles, accountabilities and interrelationships
Strategy Options
1 Simplify the product line and/or range of services Invest in narrowing the product line/range of services and/or in standardizing products/services and components. Prune out products and services; reduce the number and diversity of market offerings so that efficiencies can be realized in:
• Marketing • Inventories • Selling • Distribution
• Processing • Servicing • Operations • Accounting
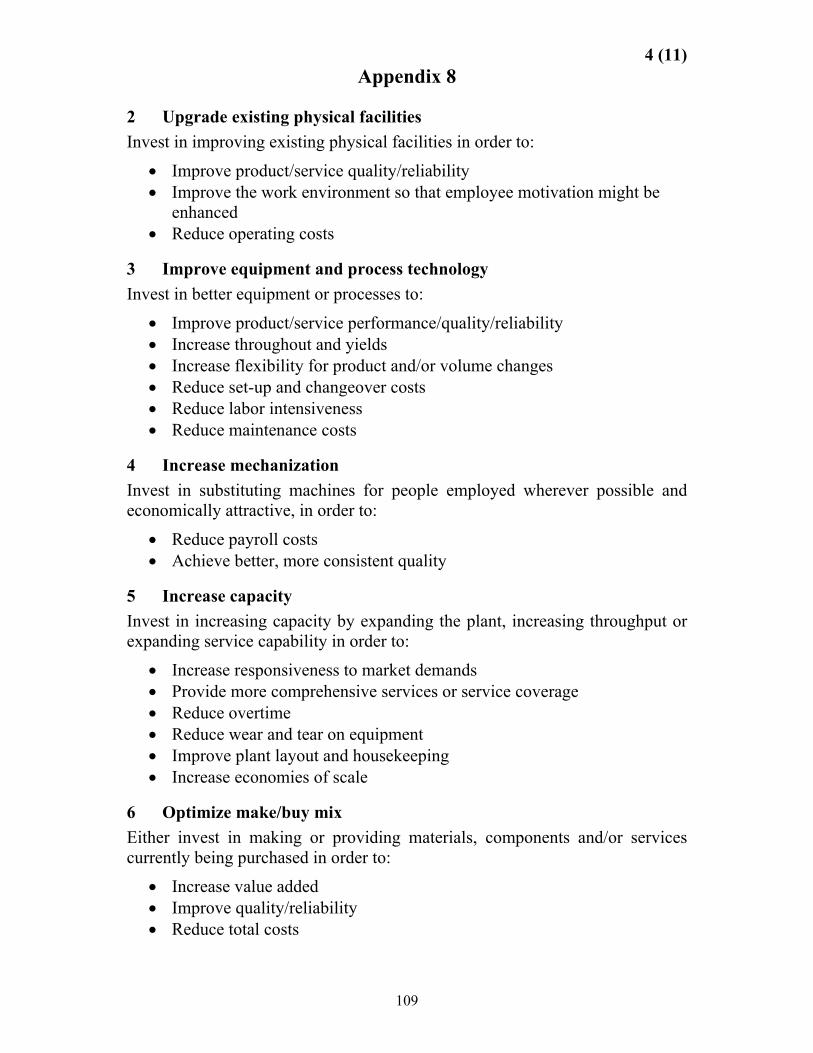
4 (11) Appendix 8
109
2 Upgrade existing physical facilities Invest in improving existing physical facilities in order to:
• Improve product/service quality/reliability • Improve the work environment so that employee motivation might be
enhanced • Reduce operating costs
3 Improve equipment and process technology Invest in better equipment or processes to:
• Improve product/service performance/quality/reliability • Increase throughout and yields • Increase flexibility for product and/or volume changes • Reduce set-up and changeover costs • Reduce labor intensiveness • Reduce maintenance costs
4 Increase mechanization Invest in substituting machines for people employed wherever possible and economically attractive, in order to:
• Reduce payroll costs • Achieve better, more consistent quality
5 Increase capacity Invest in increasing capacity by expanding the plant, increasing throughput or expanding service capability in order to:
• Increase responsiveness to market demands • Provide more comprehensive services or service coverage • Reduce overtime • Reduce wear and tear on equipment • Improve plant layout and housekeeping • Increase economies of scale
6 Optimize make/buy mix Either invest in making or providing materials, components and/or services currently being purchased in order to:
• Increase value added • Improve quality/reliability • Reduce total costs

5 (11) Appendix 8
110
• Use available capacity • Improve material/component/service availability for planning and
scheduling Or increase amount of work/materials/services purchased from vendors in order to:
• Decrease value added • Improve quality/reliability • Reduce total costs • Free up capacity
• Reduce overtime • Improve material/comp./
service availability
7 Improve vendors’ quality Invest in working with vendors of materials, components and services to improve the quality of purchased goods and services in order to:
• Improve the quality of market offerings • Improve reliability/predictability of purchased goods and services • Reduce total costs • Improve delivery reliability
8 Improve distribution Invest in reshaping product/service distribution network policies and practices to:
• Increase responsiveness to market and/or coverage • Focus on highest profit outlets • Reduce inventory, transportation and warehousing costs • Improve productivity of the distribution system
9 Improve energy/utilities efficiency Invest in improving energy/utilities efficiency by:
• Replacing existing facilities and equipment with more energy/utilities efficient facilities and equipment
• Reducing energy/utilities losses by insulation, recycling, etc. • Instituting/refining control systems • Converting to lower-cost energy sources
10 Reduce material losses Invest in systems, procedures and methods to:
• Reduce scrap and waste • Reduce material obsolescence

6 (11) Appendix 8
111
• Lower purchased material costs
11 Improve work methods and procedures Invest in improving work methods and procedures to streamline and increase the efficiency of how work gets done by applying:
• Industrial engineering concepts and techniques • Manufacturing engineering concepts and techniques • Operations-research concepts and techniques • Group technology
12 Improve equipment utilization Invest in improving the utilization of existing equipment to increase throughput and return on investment by:
• Improving planning and scheduling to achieve longer runs and fewer changeovers
• Coordinating with marketing/sales to improve use of any excess capacity • Ensuring conformance to operating standards • Arranging for share use • Introducing or upgrading preventive maintenance
13 Increase standardization in operations Invest in standardizing operations to:
• Simplify operating processes, procedures and practices • Reduce inventories • Improve quality and reliability • Improve responsiveness to customers • Reduce maintenance costs • Increase flexibility in moving products among manufacturing facilities
14 Improve information handling Invest in improving efficiency of information handling and data processing by streamlining methods and procedures in order to:
• Reduce clerical costs and errors • Improve response time between data inputs and outputs
15 Improve design of product/service Invest in developing new or modified designs for products/services that will:
• Improve responsiveness and conformance to customer requirements

7 (11) Appendix 8
112
• Improve quality and reliability • Lower total costs (design, manufacturing, marketing, delivery,
packaging, distribution, warranty, repair) • Increase market acceptance
16 Improve management information, financial and operating systems, controls and reports
Invest in system design and information technology to improve relevance, comprehensiveness, accuracy and timeliness of management decision support information including:
• Business models • Budgeting, planning and control • Market research/industry and competitive analysis • Forecasting • Purchasing/procurement • Inventory control • Operations planning and control • Quality control/assurance
17 Apply rewards and penalties Invest in improving employee motivation by systematically and consistently:
• Encouraging desirable activities by incentives and rewards (cash, prizes, citations)
• Discouraging undesirable activities by penalties (discipline, layoffs, shutdown)
18 Improve communications Invest in improving employees’ understanding of what they are doing and how this fits the company’s goals and needs by:
• Making goals, priorities, decisions and instructions more clear and specific
• Opening up new vertical and lateral channels • Listening more attentively
The investment may be to improve:
• Media (newsletters, audio-visual presentations, etc.) • Development of content • Meetings

8 (11) Appendix 8
113
19 Develop a workforce with multiple, flexible skills Invest in sharpening employee selection procedures and methods and in enhancing and upgrading employees’ skills and understanding in order to:
• Decrease employee specialization and optimize the ability to use employees flexibly
• Develop multiple skills • Increase knowledge of technology, products, operating methods and
processes • Increase potential for higher, knowledge-based pay
20 Improve selection, training and development of managers, supervisors and employees
Invest in improving selection procedures and methods, and training and development activities, for management and supervisory personnel in order to:
• Upgrade overall quality and competence of people • Increase particular skills and skill levels • Develop new skills • Increase knowledge of technology, products, operating methods and
processes, and of other organizational functions • Increase potential for advancement
21 Reduce lost work time Invest in development and improvement of policies, systems, procedures and the manner in which these are implemented to minimize the time employees spend away from their jobs for such reasons as:
• Illness (personal and family) • Accidents • Personal reasons
• Grievance and complaints • Union business
22 Re-engineer business processes and redesign jobs Invest in re-engineering business processes and the redesign of jobs to make them more challenging and satisfying by either or both:
• Enlarging the number/range of tasks and responsibilities • Incorporating functions being handled by other groups
In order to:
• Reduce total costs • Improve quality • Enhance employee motivation

9 (11) Appendix 8
114
• Increase organizational responsiveness and flexibility
23 Improve performance of individual departments Invest in improving the quality of personnel, organization and/or operating methods and procedures and measures in each department (or in selected departments) in order to:
• Upgrade the effectiveness of the organization as a whole • Strengthen a particular function in the organization
24 Change organization structure design/focus Invest in restructuring the formal organization by:
• Changing the relative status of functions • Regrouping functional responsibilities • Eliminating organizational levels • Clarifying chains-of-command • Reducing spans of control
In order to:
• Enhance market responsiveness • Improve organizational effectiveness • Reduce total costs • Provide more business focus
25 Improve integration among departments/functions Invest in breaking down walls between departments/functions in order to:
• Improve coordination and cooperation among departments • Provide ways for functions to reconcile conflicting interests, goals and
criteria • Establish common goals and language • Improve how interdepartmental processes function (e.g. new product
introductions, new business proposals and program project management) • Upgrade the effectiveness of the organization as a whole
26 Improve union – management relations and chip away at workforce-related productivity problems
Invest planning time and managerial and supervisory effort to improve union-management relations, chipping away at workforce-related productivity problems little by little by:

10 (11) Appendix 8
115
• Placing on the contract bargaining agenda items that can improve productivity, achieving gains through normal bargaining
• Attempting by direct management action to eliminate or modify restrictive practices that have developed over time
27 Shorten time-to-market for new products/services Invest in designing processes, systems and procedures (re-engineering) to shorten the time required from the initial concept of a new product/service to its delivery to the first customer, so as to improve responsiveness to market needs and opportunities. This may involve:
• Improvements in crystallizing product/service specifications • Better design methods and tools • Closer collaboration among marketing, technical groups and operations • Simplifying and making more efficient the sequence of steps required • Using autonomous task teams
28 Shorten order-to-delivery time for existing products/services Invest in designing processes, systems and procedures (re-engineering) to shorten the time required from the placement of an order by a customer to the delivery to that customer of the product or service, so as to improve responsiveness to customers and reduce inventory costs. This may involve:
• Redesigning work units and workflows • Simplifying and making more efficient the sequence of steps required • Closer collaboration among relevant functions • Improvements in equipment and processes • More standardization • More flexibility in the workforce • Instituting just-in-time operations processes
29 Shorten provisioning time Invest in redesigning internal processes (re-engineering) and in working with a reduced number of suppliers of materials, components and services to minimize the time between provisioning and actual need, so as to minimize inventories and throughput time. Institute just-in-time purchasing and delivery of materials and components.
30 Engage in productivity bargaining Invest in preparing a comprehensive, one-shot “this-for-that” bargaining package to eliminate/modify either (or both) formal contractual provisions or informal “custom and practice” understandings to open up new opportunities

11 (11) Appendix 8
116
for productivity improvement based on specific activity changes by the workforce:
• Price potential gains: offer to pay out some when achieved in order to induce the union and employees to agree to desired changes
• Invest in developing management’s capability (including supervisors) to capitalize on the opportunities created by the changes achieved
31 Establish a program for total quality management/improvement Invest in developing, training for, and applying systems, procedures and methods aimed at:
• Establishing that everyone is responsible for quality (not only quality control/inspection)
• Achieving maximum employee involvement in pursuing “perfection” with regard to quality
• Applying such techniques as statistical process control
32 Encourage employee involvement Invest in setting up and training joint voluntary employee/management councils (or “quality circles) to identify and recommend changes both in the way work is done and in the work environment so as to:
• Improve the “quality” of the time spent working • Improve the quality of the product or service • Improve productivity • Increase employee satisfaction
33 Institute employee involvement with productivity gains-sharing Invest in establishing an on-going formal program to generate labor cost (and related) savings through voluntary participative problem-solving groups involving both employees and management. Share frequently the cash benefits, if any, with everyone in the entire unit (including support functions) on the basis of a formula agreed upon with the unions and/or employees involved.

1 (5) Appendix 9
117
Definitions in the Performance Pyramid for DHL Solutions This appendix contains a discussion on the different levels and dimensions in the performance pyramid in the context of DHL Solutions’ Swedish organization. Also, it presents proposed definitions for the nine dimensions of performance to be used by DHL Solutions in the future.
The Strategic Business Unit Level This level of the pyramid, in the context of DHL Solutions, is equal to the whole operating system in the Swedish organization. The head of DHL Solutions in Sweden and the heads of divisions manage this operating system from the headquarters in Stockholm. It includes 18 operating units and also support functions such as Key Account Managers (KAMs), Human Relations, IT-support, Operations Support Engineers and Controllers.
The Core Business Process Level For DHL Solutions this level of the organization can be translated into those parts of the operating system that is connected to the strategies of the operating plan. One core business process includes all functions, people, procedures, etc. required to execute a single strategy. Hence, if DHL Solution is implementing a strategy to shorten the time between a new clients’ approval of doing business until the assignment is up-and-running, this level of the pyramid for that strategy would include all parts of the organization needed to understand the needs of the client and then to fully execute that need in the operations.
The Departmental Level For DHL Solutions in Sweden, as being an organization with quite few departments, this level can primarily be interpreted as the processes being executed at the operating units. The performance of such processes as: picking, administration, customer services, unloading and value added services needs to be monitored in order to ensure that all functions are moving in the same direction.
Corporate Vision This part of the pyramid, in the context of the Swedish organization as being a SBU, represents all levels of the organization higher than the head of DHL Solutions in Sweden. Hence, the connection between this level and lower levels includes the visions, corporate strategies and policies channeled down from Global as well as Nordic headquarters and measures reported up. Today this connection is somewhat flawed; because, some measures are reported upwards

2 (5) Appendix 9
118
(i.e. the measures reported into the shared company server) but there is a lack of deployment of strategies to which these measures can be aligned.
Market This dimension of performance should be measured for the operating system (i.e. the Swedish organization) as a whole in order to track overall progress on implementation of the operating plan’s strategies and performance on general thrusts. It is an externally focused dimension of performance which should be tracked hand-in-hand with the internally focused financial dimension. The market dimension should monitor DHL Solutions’ position on the marketplace and the rate of growth as well as changes of the client base. Measures on this dimension are mostly aggregated to the highest level of the operating system. Today, DHL Solutions in Sweden only analyze this dimension occasionally when laying out new courses to follow. Hence, it is not followed continuously in order to track implementation success of new actions. Proposed definition: The client-driven market dimension gives us the results
of how our previous decisions and actions have affected our competitiveness on the marketplace.
Financial The financial dimension of performance should provide half the information needed on the operating system as a whole in order to track the strategic success of the business. Financial measures are exclusively based on economic performance and they are important for tracking the overall results of decisions and actions. However, they only reflect a short-term view and must, therefore, be regarded with some care. Sometimes, negative financial performance must be accepted today in order to secure positive performance tomorrow. Although this is an important dimension of performance, managers in DHL Solutions must not overemphasize it. Today, much focus is put on the financial performance of the units. This emphasis must be balanced by equally tracking the market dimension as well as the core process dimensions. Proposed definition: The internally driven financial dimension gives us the
results of how our previous decisions and actions have affected our economical success.
Customer Satisfaction This dimension is one of three instruments for tracking the overall implementation progress of individual operating strategies. Customer satisfaction can be measured both directly by surveys and customer satisfaction indexes, and indirectly by e.g. aggregated number of complaints, client retention or repeat sales. See also the presentation of CFI Group’s customer

3 (5) Appendix 9
119
satisfaction concept (section 10.3). The customer satisfaction dimension is more or less overseen at DHL Solutions as of today. A routine annual survey based on absolute rankings and one or two measures reported (but not reviewed) into the shared company server (for example customer net change), are the only efforts made on the dimension. Hence, there have been no attempts to use this dimension to continually track the external effect of strategy implementation. Proposed definition: The customer satisfaction dimension tells us how well
customer expectations, primarily regarding quality and delivery, are managed in the core process.
Flexibility Regarding this dimension, the most important aspects of it for DHL Solutions is probably volume flexibility (the ability to respond quickly to large variations in demand). This implies that they must either focus on having a flexible workforce whose activities are meticulously planned or that they try to level out the variations by incorporating several clients with different demand cycles in the same warehouse. Either way, they must track the effects of an implemented strategy on this dimension. Today, DHL Solutions in Sweden do not monitor flexibility to any greater extent. Only through occasional analysis carried out at some units (congruence between workforce size and actual volumes handled) do they come anywhere near to a measurement of this dimension. Proposed definition: The flexibility dimension addresses the responsiveness
of the core process in general and the capabilities to handle volume changes in particular.
Productivity As explained in this paper (see section 3.4.3), the productivity concept is quite difficult to handle and it is often overemphasized. In DHL Solutions, the productivity dimension has historically been heavily focused and productivity measures have served as the primary means of explaining financial results on the operational level. This thesis argues that DHL Solutions should re-evaluate this somewhat flawed view on the productivity dimension. First, they should rethink their use of the labor productivity metric used today (i.e. order lines/man-hour) and not attempt to aggregate it above the operational level. Although, DHL Solutions is a labor intensive organization and the fact that the labor productivity metric is an important parameter in most contracts and labor planning tools, the metric should not be as emphasized as it is if not being part of a measurement package for tracking implementation of a certain strategy. Also, this metric must be used with more care, due to its complex dynamics.

4 (5) Appendix 9
120
For example, negative changes in the measure are often explained (or excused!?!) by factors that lie outside of the operating unit’s power (for example, changes in the assignment). Moreover, the employees whose productivity that is actually being measured (i.e. the blue collars), can not affect the ultimate outcome of the measure in a comprehensible way. So the question is: Why are they measured on it? Hence, as insinuated by academics and as concluded in this thesis, measurement on the productivity of a core process should be measured on a more aggregated level in accordance with the strategy executed for that core process. Proposed definition: The productivity dimension gives us overall information
on how efficiently we are managing our resources and activities. That is: “Are we doing the right things well?”
Quality The concept of quality at an operational level is one building block for customer satisfaction. As being a customer oriented (i.e. external) dimension, quality should be concerned with the delivery of defect-free services to clients in order to meet their expectations 100 percent of the time. For DHL Solutions it is imperative to distinguish external quality (as it is perceived by clients) from what they call “internal quality” (the measurement of e.g. faults in picking or in-process scrap). Measures sorted under “internal quality” should actually be seen as waste measures. They must also separate the three reasons for claims used today, where damaged products fall under the quality dimension whereas the other two fall under the delivery dimension (see section 6.4.1). Proposed definition: The quality dimension tells us how well our services
meet our clients’ expectations.
Delivery Delivery is the second building block of customer satisfaction. For DHL Solutions, this dimension should include the delivery of ordered products: to the correct address; on-time (not late or early); in-full (correct quantities of articles); and with the correct types of articles. Today, operating units measure the last two in their claims per order line-measure and the first is reported in the shared company server. Hence, they have a sound basis to build upon when they are to measure performance on this dimension in the future. Proposed definition: The delivery dimension tells us if we are delivering
correct and complete orders, on-time to our client’s customers; and if we are delivering the correct service, on-time to our clients.

5 (5) Appendix 9
121
Cycle Time The measurement of the cycle time dimension (along with the measurement of waste) is a good way to circumvent the problems inherited in the complex dynamics of productivity measures on the operational level. Cycle time can basically be interpreted as the time it takes to perform a certain action or process. For example, if DHL Solutions is pursuing the strategy to shorten the time it takes to implement new client assignments (mentioned above under core process level), they must obviously track the cycle times for every such implementation process. To shorten this time they must focus their attention on: changing the management of actions; increasing the proportion of “hands-on” time; rearranging activities; and improving inter-functional collaboration. However, DHL Solutions do not have any measures on this dimension today. Proposed definition: The cycle time dimension provides information on how
we manage the important resource of time and focuses our attention on increasing the proportion of value-added time.
Waste Waste is the dimension that account for all unproductive activities that add no value to the current business. For DHL Solutions it includes all costs associated with failures, appraisals and surpluses. Hence, it consists of: scrap (in-process damage of articles); administration of claims; excess personnel in workforce; quality control (if there were no failures this would not be necessary); inbound inspection; and badly planned picking routes. Some operating units focus much attention on measuring failures in the picking process by controlling picked orders before shipment. However, one important conclusion here is that what they actually achieve is an increase of in-process waste by allocating resources to a non-value-added activity (control). Although, they probably hope to minimize their use of this activity in the long run, what they actually do is to substantiate a control environment rather than putting attention on managerial actions and changes of the operating conditions in order to eliminate the actual waste. Proposed definition: The waste dimension gives us important information on
how much money we spend on non-value-added activities and resources.

1 (1) Appendix 10
122
Customer Satisfaction at DHL Solutions This appendix presents an example of how the relations between driving forces, customer satisfaction, client behavior and profitability could turn out for DHL Solutions in Sweden when using CFI Group’s methodology. The below figure is developed by the author in cooperation with Magnus Creutz at CFI Group.
Dri
ving
forc
es
Inte
rfac
e w
ith
oper
atin
g un
its
KA
M’s
beh
avio
r
EDI a
nd in
form
atio
n ha
ndlin
g
Imag
e/br
and
Val
ue fo
r pai
d pr
ice
Trac
k an
d tra
ce
poss
ibili
ties
Cap
acity
and
fle
xibi
lity
Prod
uct v
arie
ty
Clie
nt
satis
fact
ion
inde
x
Clie
nt sa
tisfa
ctio
n C
lient
beh
avio
r
Loya
lty -
clie
nts k
eep
DH
L So
lutio
ns a
s sup
plie
r and
th
ey te
nd to
con
tract
for
long
er p
erio
ds
Clo
ser r
elat
ions
hip
and
less
pr
ice
sens
itive
New
sale
s (fo
r exa
mpl
e of
va
lue
adde
d se
rvic
es)
A te
nden
cy to
reco
mm
end
DH
L So
lutio
ns to
pot
entia
l cl
ient
s
Mor
e ke
en to
list
en to
re
com
men
datio
ns a
nd
chan
ge re
quire
men
ts o
n th
eir p
art o
f the
ass
ignm
ent
Prof
itabi
lity