performance investigation of evacuated tube collector
TRANSCRIPT
International Journal of
Advances in Scientific Research and Engineering (ijasre)
E-ISSN : 2454-8006
DOI: 10.31695/IJASRE.2020.33698
Volume 6, Issue 1
January - 2020
www.ijasre.net Page 156
Licensed Under Creative Commons Attribution CC BY-NC
Performance Investigation of Evacuated Tube Collector using
Different Nano fluids Applied to Winter Climatic Conditions in Egypt
AbdallaGomaa, Fifi N. M. Elwekeel , Mahmoud Abdelmagied & Momen I. Radwan
Department of Refrigeration and Air-Conditioning Technology
Faculty of Industrial Education
Helwan University, 11282 Cairo, Egypt
_______________________________________________________________________________________
ABSTRACT
In this paper, the performance of the evacuated tube solar collector is investigated theoretically by the TRNSYS program. The
simulation is conducted during the winter of 14th February-2019 in Cairo – Egypt. In this simulation, water and Nanofluids are
working fluids. The types of Nanofluids are CeO2/water, WO3/water and AL2O3/water. The simulation is conducted at0.015%,
0.025%, 0.035% and 0.045% (volume concentrations).The mass flux rate and tilt angle are 0.017 kg/s.m2and 45o; respectively.
The results show that the collector has the highest performance using nanofluids at studied concentrations. At 12:00 PM, the
highest useful energy gain can be obtained from CeO2/water Nanofluid at 0.045% concentration, while thermal efficiency is
higher by 34.2% than water. The nanofluidWO3/water presents low performance than that of CeO2/water and AL2O3/water. The
thermal efficiencies ofAL2O3/ water and WO3/ water Nanofluids are higher than water by 28.4% and 12.5%; respectively, at
concentration of 0.045% and 12:00PM.
Key words: Evacuated Tube Collector, TRNSYS, Nano fluid.
________________________________________________________________________________________________________
NOMENCLATURE
A Collector aperture area [m2] Subscripts
Cp Specific heat capacity [J/kg/k] a absorbed
FR Heat removal factor [-] amb ambient
I Solar radiation intensity [W/m2] bf Base fluid
k Thermal conductivity [W/m.K] c Collector
Q Heat energy [kg/s] f Fluid
T Temperature [W] i Inlet
U Overall heat losses coefficient [W] o Outlet
[W] L Losses
Greek Letters [oC] hl Heat losses
Transmittance [-]
nf Nanofluid
Absorptance [-]
np Nano-particles
Efficiency of collector [%]
rad Radiation
Density [kg/m
3]
u useful
International Journal of Advances in Scientific Research and Engineering (ijasre), Vol 6 (1), January-2020
www.ijasre.net Page 157
DOI: 10.31695/IJASRE.2020.33698
concentration of nano-particles [-]
Abbreviations
ETC Evacuated Tube Collector TRNSYS Transient Systems Simulation
CeO3 Cerium Oxide Nano-particles WO3 Tungsten trioxide Nano-particles
AL2O3 Aluminum Oxide Nano-particles
1. INTRODUCTION
There are many studies available in literature for solar heating and cooling system simulation by means of transient system
simulation software (TRNSYS). In this section, the survey focused on the researches related to TRNSYS simulation of solar
heating and cooling systems starting with Buonomo et al. [1] presented TRNSYS simulation study for solar cooling system for
peak energy consuming according to Italy conditions. The solar cooling system analyzed using base water and AL2O3 water
nanofluid. Fathima et al. [2] conducted study for the performance analysis of evacuated tube solar collector using TRNSYS
modeling with different nanofluidssuch as AL2O3, Silica, copper, carbon nanotube and aluminum. Solar cooling system with
absorption chiller simulated by Asim et al. [3] using TRNSYS. Absorption chiller was powered by hot water from evacuated tube
collector during system simulation. Ayompe et al. [4] performed a comparison between flat plate collector and evacuated tube
collector by means of TRNSYS, type 73 used to model flat plate collector and type 538 for evacuated tube collector. The results
showed that the useful energy delivered by evacuated tube collector was higher than that of flat plate collector. Yang et al. [5]
established paper for thermal performance of solar heating system using TRNSYS simulation. Analysis included inlet and outlet
temperatures of the collector, temperature distribution through storage tank and collector efficiency. Fan et al. [6] developed
different TRNSYS models for evacuated tube heat pipe solar collector. First model was with flat fins and the other was with
curved fins. Abdunnabi and Loveday [7] performed TRNSYS optimization analysis for two new models of thermosyphon solar
collector compared with standard model. They concluded that the modified models gave a good agreement with the standard one
and can be used to simulate the thermosyphon systems. Mohammed et al. [8] reported TRNSYS simulation for solar water heating
system works with 10 m2 flat plate collector to provide a hot water for 25 persons. The system was provided with auxiliary heater
and the solar fraction of the system obtained by 69%. The maximum auxiliary energy needed for the system was during December
month according to Baghdad, Iraq conditions. Different concentration levels for evacuated tube solar collector are simulated using
TRNSYS modeling by Ali et al. [9]. The research determined that higher performance can be obtained at higher concentration
levels. Mohasseb and Kasaeian[10] presented a comparison study between evacuated tube and flat plate solar collectors. The
comparison simulated by means of TRNSYS program using Type 1b for flat plate and Type 71 for evacuated tube collector. The
research concluded that the evacuated tube collector is better than the flat plate collector for both hot and cold climate conditions.
Utham et al. [11] simulated the performance a solar cooling system according to India climate conditions. TRNSYS simulation
included the optimization of storage tank volume, collector tilt angle and solar collector area. Assilzadeh et al. [12] developed a
TRNSYS model for solar driven LiBr – H2O absorption chiller in Malaysia, the results reported that the optimum solar collector
area, storage tank volume and collector slope are 35m2, 0.8m
3 and 22
o; respectively for 3.5 kW of chiller capacity. Gill and Fung
[13] presented a study for solar heating system simulation for green house in Toronto, Canada. The results concluded that the solar
heating system with gray water heat recovery system saves up to 80% of energy consuming. A new TRNSYS model for
thermosyphon flat plat collector was developed by Kalogirou et al. [14]. Type 99 as new model was used instead of standard
TRNSYS model of Type 45a, the results showed a good agreement between the data collected by Type 99 and the experimental
work. Abdunnabi et al. [15] analyzed solar water heating system using TRNSYS program and validation of the system
experimentally to measure the effectiveness of software. Different configuration of forced circulation of solar collector was
investigated. The results reported that there was discrepancy between the experimental and the simulation due to the position of
controlling sensor of circulating pump. Cao et al [16] performed TRNSYS simulation for solar water heating system according to
real conditions. Various measured parameters were investigated by simulation such collector outlet water temperature, storage
tank temperature and auxiliary heating.
Much researchers developed TRNSYS simulation for solar heating and cooling systems but the numerical studies of performance
of solar collector using nanofluids are few. Also, the study of the performance of the evacuated solar collector(ETC) in the winter
of Cairo - Egypt is not studied.So, in this work will be investigated the behavior of solar heating systemat winter climatic
conditions of Cairo -Egypt. This study is conducted for different types of nanofluids and various concentrations.

International Journal of Advances in Scientific Research and Engineering (ijasre), Vol 6 (1), January-2020
www.ijasre.net Page 158
DOI: 10.31695/IJASRE.2020.33698
2. METHODOLOGY
2.1 System modeling
The performance of evacuated solar collector is investigated by TRNSYS 17 [17], the system components are selected from the
program library. The mathematical model for each component is formulated by FORTRAN code. In the present work Fig. 1
presents the TRNSYS model of solar heating system, according to this figure the model consists of standard evacuated tube
collector TYPE 71, storage tank TYPE 60c, dual pipe fan coils TYPE 600, differential temperature controller TYPE 2b, weather
data processor TYPE 15-6 TM2 according to weather conditions in Cairo – Egypt, TYPE 114 single speed pump for circulation of
the working fluid, TYPE 14h used to adjust the pump operation schedule, the operation time is adjusted from 8:00 AM to 5:00 PM
and the resulting data file is plotted by TYPE 65.
The evacuated solar collector ETCis the main component of the solar system, which has different parameters.
Table [1]TRNSYS input parameters for evacuated tube collector
Parameter Value Units
Number of collector in series 1 --
Collector aperture area (Ac) 1.59 m2
Fluid specific heat 4.18 kJ/kg.K
Flow rate at test condition 0.017 Kg/s.m2
Intercept efficiency 0.55 --
Negative 1st order efficiency coefficient 12 kJ/hr.m2.K
Negative 2nd order efficiency coefficient 0.036 kJ/hr.m2.K
Collector slope 45 Degrees
Fig. 1 TRNSYS model block diagram for solar heating system

International Journal of Advances in Scientific Research and Engineering (ijasre), Vol 6 (1), January-2020
www.ijasre.net Page 159
DOI: 10.31695/IJASRE.2020.33698
2.2 Governing Equations
TRNSYS mathematical model and governing equations are as the following:
-u a hlQ Q Q
(1)
. . .hl Rad L Conv L Cond LQ Q Q Q
(2)
-, ,
Q m Cp T Tu f f f o f i (3)
The collector efficiency can be calculated by;
.
.
-, ,
.c
rad coll
m Cp T Tf f f o f i
I A
(4)
2
- - . .R R L R L
rad rad
T TF F U F U
I I
(5)
,
0 1 --
f i amb
c
rad
T Ta a
I
(6)
Where a0 and a1 are constants of collector efficiency. These constants are changed according to the operating conditions. These
parameters are specified in Table [1].
The physical properties of nanofluid which are density (ρ), specific heat capacity (Cp) and thermal conductivity (k) are calculated
as the following equations:
= + 1nf np bf
(7)
( ) + ( ) 1=
( ) + 1
np bf
nf
np bf
Cp CpCp
(8)
= k (1 8.733 )nf bfk
(9)
3. RESULTS AND DISCUSSIONS
The simulation is performed with different nanofluids. The nanofluids are CeO2, WO3 and AL2O3. CeO2 and WO3nanofluids are
simulated according to Sharafeldin and GyulaGrof [18-19] while AL2O3 nanofluid is simulated according to Javad and Sidik
[20]. From these studies, the efficiency constantsare shown in Table [2] at mass flux rate 0.017 kg/m2 s.
Table [2] Efficiency constants for CeO2, WO3 and AL2O3nanofluids, [18-20]
Nanofluid type Volume concentration Efficiency Parameters
a0 a1
CeO2nanofluid
0.015% 0.660 16.227
0.025% 0.712 17.785
0.035% 0.743 20.855
0.045% 0.752 25.432
WO3nanofluid
0.015% 0.664 26.751
0.025% 0.685 32.073
0.035% 0.709
33.952
0.045% 0.736 32.387
AL2O3nanofluid
0.015% 0.386 1.567
0.025% 0.427 1.668
0.035% 0.467 1.768
0.045% 0.508 1.868

International Journal of Advances in Scientific Research and Engineering (ijasre), Vol 6 (1), January-2020
www.ijasre.net Page 160
DOI: 10.31695/IJASRE.2020.33698
3.1. Work Validation
Figures 2 and 3 show a comparison between prediction and experimental results. The validation uses CeO2/water and WO3/water
as working fluids[18-19]. The comparison applied at mass flux rate of 0.017 kg/s.m2, collector area of 1.59m
2. The concentrations
of CeO2/water and WO3/water are 0.035% and 0.042%; respectively. Fig. 1 shows the thermal optical efficiency FR(τα) of ETC
using CeO2/water nanofluid, the predicted thermal optical efficiency is recorded 0.752 while the experimentally value is 0.743.
The predicted energy losses coefficient (-FR.UL) increases by about 5.8% than that of experimental.
Fig. 2 shows the thermal optical efficiency FR(τα) and energy losses coefficient of ETC with WO3/water. The prediction result of
thermal optical efficiency and energy losses coefficient are decreases by 3.9% and 12.7%; respectively, than experimental results.
So, can be seen that a good agreement between the TRNSYS results and the experimental results.
Fig. 1 Comparison between simulation results and experimental
work for CeO2 water nanofluid
Fig. 2 Comparison between simulation results and
experimental work for WO3 water nanofluid
3.1 Performance of ETC using CeO2/water
The results will be presented the performance of solar heating systemon14th
February, 2019. This day is selected for this
investigation because it is considered mid-winter season and a clear sky day.
The intensity of solar radiation in Cairo- Egypt on 14th
February is shown in Fig.3. From this figure it can be seen that the
intensity ofthe solar radiation increaseswith increasing daylight time. The solar radiation records the maximum value at 12:00 PM
(985 W/m2) and drops to low values for the rest of the day.
The difference of working fluid temperature through ETC is important parameter to give a clear picture of performance of solar
heating system.Fig. 4 illustrates the variation of the temperature difference across the collector using CeO2/waterat different
concentrations.The temperature difference has the same trend of solar radiation intensity. Also, it can be seen that the water has
the lowest temperature difference while the nanofluid has high values at 12:00 PM. The temperature difference is directly
proportional to the increase in the concentration of nanofluids. For nanofluids concentration of 0.015%, 0.025%, 0.035% and
0.045%, the temperature differences are higher than water by 27.8%, 31.6, 33.7% and 35.6%; respectively. That is because the
nano-particles increase the thermal conductivity.Fig. 5 shows the useful heat gain of ETC using CeO2/water nanofluid and water
during daylight time. For all nanofluid concentrations, the useful heat gain increases to the maximum value at 12:00PM.
0.20
0.30
0.40
0.50
0.60
0.70
0.80
0.000 0.005 0.010 0.015 0.020
ηc
(Tfi-Tamb)/ Irad [oC.m2/W]
CeO2 Simulation
CeO2 Experimental
CeO2 Simu. (η=-22.06(Ti-Ta)/ I)+0.752)
CeO2 Exp. (η=-20.85(Ti-Ta)/ I)+0.743)
CeO2 Nanofluid
Mass flux rate = 0.017 kg/s.m2
φ = 0.035% by volume
0.20
0.30
0.40
0.50
0.60
0.70
0.80
0.000 0.005 0.010 0.015 0.020
ηc
(Tfi-Tamb)/ Irad [oC.m2/W]
WO3 Simulation
WO3 Experimental
WO3 Simu. (η=-28.98(Ti-Ta)/ I)+0.699)
WO3 Exp. (η=-33.22(Ti-Ta)/ I)+0.728)
WO3 Nanofluid
Mass flux rate = 0.017 kg/s.m2
φ = 0.042% by volume

International Journal of Advances in Scientific Research and Engineering (ijasre), Vol 6 (1), January-2020
www.ijasre.net Page 161
DOI: 10.31695/IJASRE.2020.33698
Fig.3 Solar radiation intensity through ETC with daylight
time on 14th
of February
Fig.4 ETC temperature difference with CeO2nanofluid at
different concentrations versus water
Fig. 5 shows the useful heat gain of ETC using CeO2/water nanofluid and water during daylight time. For all nanofluid
concentrations, the useful heat gain increases to the maximum value at 12:00PM.The useful heat gains are707 W, 744 W, 767 W,
790 W and 526 W for concentrations of 0.015%, 0.025%, 0.035%, 0.045% and water; respectivelyat 12:00PM. That is result to
the high temperature difference.
Fig.6 indicates the thermal efficiency of ETC using CeO2nanofluid with different concentrations and water as working fluids. The
thermal efficiency is high due to higher concentration of nanofluid compared to water. At 12:00 PM, the thermal efficiencyfor
concentrations of 0.015%, 0.025%, 0.035% and 0.045% are increased by 25.7%, 29.3%, 31.5% and 34.2%; respectively,
compared with the thermal efficiency of water.
200
300
400
500
600
700
800
900
1000
1100
7 8 9 10 11 12 13 14 15 16 17
I ra
d[W
/m2]
Time [h]
14th Febrauary
0
1
2
3
4
5
6
7
8
7 8 9 10 11 12 13 14 15 16 17∆
Tw
[oC
]Time [h]
φ=0% φ=0.015%
φ=0.025% φ=0.035%
φ=0.045%
CeO2 Water nanofluid

International Journal of Advances in Scientific Research and Engineering (ijasre), Vol 6 (1), January-2020
www.ijasre.net Page 162
DOI: 10.31695/IJASRE.2020.33698
The optical efficiency FR(τα) and energy losses coefficient (-FR.UL) of ETC can be calculated from Eq.(10) [21]:
, -
- .
f i amb
c R R L
rad
T TF F U
I
(10)
Table [3] illustrates the optical efficiency of ETC FR(τα) and energy losses coefficient (-FR.UL) for CeO2nanofluid. At [(Ti-Ta)/I]
is equal to zero the thermal efficiency of the ETC gives a higher value. The thermal optical efficiency of CeO2nanofluidincreases
with increasing nanofluid concentration. The energy loss coefficients decrease when concentration is low.
Table [3]ETC optical efficiency and energy loss coefficients for CeO2 with different concentrations
Working fluid Optical efficiency
FR(τα)
Energy losses coefficient
(-FR.UL)[W/m2.K]
Base water 0.471 15.08
0.015% 0.632 16.25
0.025% 0.682 17.87
0.035% 0.752 22.06
0.045% 0.813 24.83
3.2 Performance of ETC using WO3/ water
This section discusses the performance of ETC usingwater and WO3Nano fluidas working fluid. The nanofluid has volumetric
concentrations of 0.015%, 0.025%, 0.035%, and 0.045%. The relation between the temperaturesdifferenceswith daylight time are
illustrated in Fig. 7.As seen from this figure, the temperature differences of WO3/water are high than that of base water. At 12:00
PM, the temperature difference are increased than that water by about 8.5%, 9.4%, 13.2% and 15.3%, at volumetric concentrations
of 0.015%, 0.025%, 0.035% and0.045%;respectively.
Fig. 8 indicates the useful heat gain from ETC using water and WO3/water during daylight time. For all concentrations of
nanofluid WO3/water, the useful heat gain reaches maximum value at 12:00PM. The useful heat gains increase with increasing
Fig.5 Useful heat gain by ETC with CeO2nanofluid at
different concentrations versus water
Fig. 6 ETC efficiency versus time for CeO2nanofluid at
different concentrations versus water
0
100
200
300
400
500
600
700
800
900
7 8 9 10 11 12 13 14 15 16 17
Qu
[W]
Time [h]
φ=0% φ=0.015%
φ=0.025% φ=0.035%
φ=0.045%
CeO2 Water nanofluid
0.0
0.1
0.2
0.3
0.4
0.5
0.6
7 8 9 10 11 12 13 14 15 16 17η
cTime [h]
φ=0% φ=0.015%
φ=0.025% φ=0.035%
φ=0.045%
CeO2 Water nanofluid

International Journal of Advances in Scientific Research and Engineering (ijasre), Vol 6 (1), January-2020
www.ijasre.net Page 163
DOI: 10.31695/IJASRE.2020.33698
volumetric concentration. At volumetric concentration of 0.045% , the useful heat gains is higher than that of water by 1.14 times
at 12:00PM. This also can be attributed to the high temperature difference.
Fig.7 ETC temperature difference with WO3nanofluid at
different concentrations versus water Fig.8 Useful heat gain by ETC with WO3nanofluid at
different concentrations versus water
Fig. 9 ETC efficiency versus time for WO3 nanofluid at different concentrations versus water
Fig. 9 demonstrates the thermal efficiency of ETC at different concentrations of WO3/water nanofluid. At certain time of 12:00
PM, the thermal efficiency of WO3/water is higher than the thermal efficiency of water by 5.7%, 6.5%, 10.5 and 12.6%, at
concentrations of 0.015%, 0.025%, 0.035%, and 0.045%; respectively.
The optical efficiency of ETC FR(τα) and energy losses coefficient (-FR.UL) for WO3/water are illustrated in Table [4]. The highest
thermal optical efficiency and highest energy loss coefficient of ETC using WO3/water occur at 0.025% concentration.
0
1
2
3
4
5
6
7 8 9 10 11 12 13 14 15 16 17
∆T
w[o
C]
Time [h]
φ=0% φ=0.015%
φ=0.025% φ=0.035%
φ=0.045%
WO3 Water nanofluid
0
100
200
300
400
500
600
700
7 8 9 10 11 12 13 14 15 16 17
Qu
[W]
Time [h]
φ=0% φ=0.015%
φ=0.025% φ=0.035%
φ=0.045%
WO3 Water nanofluid
0.0
0.1
0.2
0.3
0.4
7 8 9 10 11 12 13 14 15 16 17
ηc
Time [h]
φ=0% φ=0.015%
φ=0.025% φ=0.035%
φ=0.045%
WO3 Water nanofluid

International Journal of Advances in Scientific Research and Engineering (ijasre), Vol 6 (1), January-2020
www.ijasre.net Page 164
DOI: 10.31695/IJASRE.2020.33698
Table [4]ETC optical efficiency and energy loss coefficients for WO3 with different concentrations
Working fluid Optical efficiency
FR(τα)
Energy losses coefficient
(-FR.UL)[W/m2.K]
Base water 0.471 15.08
0.015% 0.595 26.45
0.025% 0.679 33.93
0.035% 0.636 26.74
0.045% 0.705 32.36
3.3 Performance of ETC using AL2O3/water
Fig. 10indicates the temperature difference through the collector using water and AL2O3/water nanofluid.The water has lowest
temperature difference while the highest value can be achieved byAL2O3/water nanofluids. At 12:00 PM, the temperature
differences of AL2O3/water arehigher than water by about 8%, 16.7%, 23.7% and 29.8% for a concentration of 0.015%, 0.025%,
0.035% and 0.045%; respectively.
The variation of useful heat gain from ETC using water and AL2O3/water nanofluid are shown in Fig. 11.With AL2O3 /water
nanofluid, the useful heat gains have higher values than water. At 12:00PM, the useful heat gains are555 W, 613 W, 669 W and
727 W for concentrations of 0.015%, 0.025%, 0.035% and 0.045%; respectively while the useful heat gains of water is 526 W.
Fig.10 ETC temperature difference with AL2O3nanofluid
at different concentrations versus water
Fig.11Useful heat gain by ETC with AL2O3nanofluid at
different concentrations versus water
0
1
2
3
4
5
6
7
7 8 9 10 11 12 13 14 15 16 17
∆T
w[o
C]
Time [h]
φ=0% φ=0.015%
φ=0.025% φ=0.035%
φ=0.045%
AL2O3 Water
nanofluid
0
100
200
300
400
500
600
700
800
7 8 9 10 11 12 13 14 15 16 17
Qu
[W]
Time [h]
φ=0% φ=0.015%
φ=0.025% φ=0.035%
φ=0.045%
AL2O3 Water nanofluid
International Journal of Advances in Scientific Research and Engineering (ijasre), Vol 6 (1), January-2020
www.ijasre.net Page 165
DOI: 10.31695/IJASRE.2020.33698
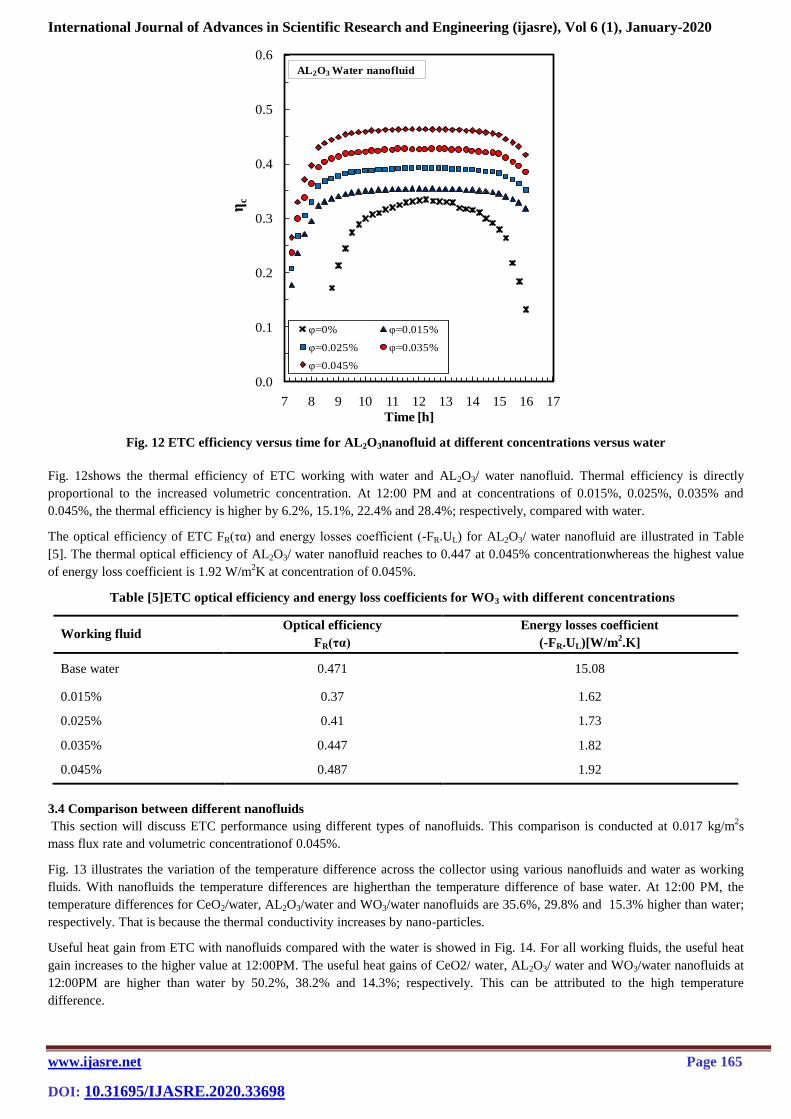
Fig. 12 ETC efficiency versus time for AL2O3nanofluid at different concentrations versus water
Fig. 12shows the thermal efficiency of ETC working with water and AL2O3/ water nanofluid. Thermal efficiency is directly
proportional to the increased volumetric concentration. At 12:00 PM and at concentrations of 0.015%, 0.025%, 0.035% and
0.045%, the thermal efficiency is higher by 6.2%, 15.1%, 22.4% and 28.4%; respectively, compared with water.
The optical efficiency of ETC FR(τα) and energy losses coefficient (-FR.UL) for AL2O3/ water nanofluid are illustrated in Table
[5]. The thermal optical efficiency of AL2O3/ water nanofluid reaches to 0.447 at 0.045% concentrationwhereas the highest value
of energy loss coefficient is 1.92 W/m2K at concentration of 0.045%.
Table [5]ETC optical efficiency and energy loss coefficients for WO3 with different concentrations
Working fluid Optical efficiency
FR(τα)
Energy losses coefficient
(-FR.UL)[W/m2.K]
Base water 0.471 15.08
0.015% 0.37 1.62
0.025% 0.41 1.73
0.035% 0.447 1.82
0.045% 0.487 1.92
3.4 Comparison between different nanofluids
This section will discuss ETC performance using different types of nanofluids. This comparison is conducted at 0.017 kg/m2s
mass flux rate and volumetric concentrationof 0.045%.
Fig. 13 illustrates the variation of the temperature difference across the collector using various nanofluids and water as working
fluids. With nanofluids the temperature differences are higherthan the temperature difference of base water. At 12:00 PM, the
temperature differences for CeO2/water, AL2O3/water and WO3/water nanofluids are 35.6%, 29.8% and 15.3% higher than water;
respectively. That is because the thermal conductivity increases by nano-particles.
Useful heat gain from ETC with nanofluids compared with the water is showed in Fig. 14. For all working fluids, the useful heat
gain increases to the higher value at 12:00PM. The useful heat gains of CeO2/ water, AL2O3/ water and WO3/water nanofluids at
12:00PM are higher than water by 50.2%, 38.2% and 14.3%; respectively. This can be attributed to the high temperature
difference.
0.0
0.1
0.2
0.3
0.4
0.5
0.6
7 8 9 10 11 12 13 14 15 16 17
ηc
Time [h]
φ=0% φ=0.015%
φ=0.025% φ=0.035%
φ=0.045%
AL2O3 Water nanofluid

International Journal of Advances in Scientific Research and Engineering (ijasre), Vol 6 (1), January-2020
www.ijasre.net Page 166
DOI: 10.31695/IJASRE.2020.33698
Fig 15 shows the thermal efficiency of ETC using nanofluids and water as working fluids. The thermal efficienciesof CeO2/ water,
WO3/ water and AL2O3/ water nanofluids are higher compared with the water at the same concentration. At 12:00 PM, the thermal
efficiencies ofCeO2/ water, AL2O3/ water and WO3/ water nanofluids increase by 34.2%, 28.4% and 12.5%;respectively,
compared with the thermal efficiency of water.
Fig.13 Temperature difference through ETC with different
nanofluids and water
Fig.14 Useful heat gain by ETC with different nanofluids and
water
Fig. 15 ETC efficiency versus time for different nanofluids and water
0
1
2
3
4
5
6
7
8
7 8 9 10 11 12 13 14 15 16 17
∆T
w[o
C]
Time [h]
Base water
CeO2 nanofluid
WO3 nanofluid
AL2O3 nanofluid
φ=0.045%
0
100
200
300
400
500
600
700
800
900
7 8 9 10 11 12 13 14 15 16 17
Qu
[W]
Time [h]
Base water
CeO2 nanofluid
WO3 nanofluid
AL2O3 nanofluid
φ=0.045%
0.0
0.1
0.2
0.3
0.4
0.5
0.6
0.7
7 8 9 10 11 12 13 14 15 16 17
ηc
Time [h]
Base water
CeO2 nanofluid
WO3 nanofluid
AL2O3 nanofluid
φ=0.045%

International Journal of Advances in Scientific Research and Engineering (ijasre), Vol 6 (1), January-2020
www.ijasre.net Page 167
DOI: 10.31695/IJASRE.2020.33698
5. CONCLUSION
This paper presents theoretical study to investigate the performance characteristics of ETC using varied nanofluid types and
different concentrations in weather data of Cairo – Egypton 14th
February. The simulation is performed using water, CeO2/ water,
WO3/ water and AL2O3/ water nanofluids as working fluids. From this simulation it can be concluded that:
1. Using water nanofluids, the performance of ETC is much higher compared with the water at study concentrations.
2. At concentration of 0.045%, the performance of ETC using CeO2/ water nanofluid gives higher temperature difference
and higher thermal efficiency by 35.6 % and 34.2%; respectively compared with the water.
3. At 12:00 PM and 0.045% nanofluid concentration, the temperature difference, useful heat gain and thermal efficiency of
WO3/water are increased by 15.3%, 14.3% and 12.6%; respectively, compared with water.
4. The temperature difference, useful heat gain and thermal efficiency ofAL2O3/water are higher than that waterby 29.8%,
38.2% and 28.4%; respectively,at 0.045% concentration.
5. For CeO2 /water, the useful heat gain changes from 707W to 790 W when the concentration is varied from 0.015% to
0.045% at midday.
6. At 12:00 PM, the thermal efficiency of ETC using AL2O3/ water are increased than that of water by 6.2% and 28.4%
when the concentrations are 0.015 and 0.045%; respectively.
7. The thermal optical efficiency of CeO2 nanofluid increases from 0.632 to 0.813 when nanofluid concentrations are 0.015
and 0.045%; respectively.
REFERENCES
[1] B. Buonomo, F. Cascetta, L. Cirillo, S. Nardini, ‘Application of nanofluid in solar cooling system: Dynamic simulation
by means of TRNSYS software’, Modeling measurement and control B, vol. 87, pp. 143–150, 2018.
[2] A Fathima, P. Sreekala, B. K. Mathew, ‘Performance analysis of solar thermal evacuated tube collector using different
nanofluids’, International journal of engineering science and research technology , vol. 5, pp. 367–373, 2016.
[3] M. Asim, J. Dewsbury, S. Kanan, ‘TRNSYS simulation of solar cooling system for the hot climate of Pakistan’, Energy
procedia, vol. 91, pp. 702–706, 2016.
[4] L. Ayompe, A. Duffy, S. McCormak, M. Conlon., ‘Validated TRNSYS Model for Forced Circulation Solar Water Heating
Systems with Flat Plate and Heat Pipe Evacuated Tube Collectors’, Smart Grid and Renewable Energy vol. 31, pp. 1536–1542,
2011.
[5] B. Yang, J. Liu, M. Hao, L. Gao, ‘Study on performance of solar water heating system using TRNSYS software’
Chemical engineering transactions, vol. 70, pp. 2071–2076, 2018.
[6] J. Fan, J. Dragsted, S. Furbo, ‘Validation of simulation models for differently design heat pipe evacuated tubular
collector’ Proceedings of ISES Solar world congress, pp. 663-668, 2007.
[7] M. J. R. Abdunnabi, D. L. Loveday, ‘Optimization of thermosyphon solar water heaters using TRNSYS, Part1: Improved
model development and validation’ International conference on future environment and energy IPCBEE , vol. 22, pp. 145-153,
2012.
[8] M. N. Mohammed, M. A. Alghoul, Kh. Abulqasem, A. Mustafa, Kh. Glaisa, P. Ooshaksaraei, M. Yahya, A. Zaharim, K.
Sopain, ‘TRNSYS simulation of solar water heating system in Iraq’, the 4th WSEAS international conference on Energy and
development, environment, biomedicine, pp 153-156, dio:10.13140/2.1.1979.8724, 2011.
[9] B. H. Ali, S. I. Gilani, H.H. Al-kayiem, ‘Investigation of evacuated tube collector performance at high temperature mode
using TRNSYS simulation model’, Applied mechanics and materials, vol. 465-466, pp. 155–160, 2014.
[10] S. Mohasseb, A. Kasaeian, ‘Comparing the Performance of Flat Plate Collector and Evacuated Tube Collector for
Building and Industrial Usage in Hot and Cold Climate in Iran with TRNSYS Software’, Ninth International Conference on
Engineering Computational Technology, Napoli, Italy, pp. 1-13, 2014.
[11] G. Utham, S. M. Agravat, B. Jani, J. Bhutka, ‘Modelling, transient simulation and economic analysis of solar thermal
based air conditioning system in Gujarat’, Smart grid and renewable energy, vol. 7, pp. 233-246, 2016.
[12] F. Assilzadeh, S.A. Kalogirou, Y. Ali, K. Sopain, ‘Simulation and optimization of a LiBr solar absorption cooling system
with evacuated tube collector’, Renewable energy, vol. 30, pp. 1143-1159, 2005.
[13] G.S. Gill, A.S. Fung ‘Solar domestic hot water system analysis using TRNSYS’, Fredricton, New Brunswick
[14] S. A. Kalogirou, R. Agathokleous, G. Brone, A. Buonomano, C. Forzano, A. Palombo, ‘Development and validation of a
new TRNSYS type for thermosyphon flat plate solat thermal collectors: energy and economic optimization for hot water
production in different climates’, Renewable energy, vol. 136, pp. 632–644, 2019.
[15] M.J.R. Abdunnabi, k.M.A. Alakder, N.A. Alkishrwi, S.M. Abughres, ‘Experimental validation of forced circulation of
solar water heating system in TRNSYS’, Energy procedia, vol. 57, pp. 2477-2486, 2014.
[16] F. Cao, L. Zhao, F. Zhang, L. Guo, ‘Redesign of water heating syatem using evacuated tube solar collectors: TRNSYS
simulation and techno-economic evaluation’, Heat transfer engineering, vol. 35(6-8), pp. 556–566, 2014.

International Journal of Advances in Scientific Research and Engineering (ijasre), Vol 6 (1), January-2020
www.ijasre.net Page 168
DOI: 10.31695/IJASRE.2020.33698
[17] TRNSYS (2017) A Transient System Simulation Program, Version 17. University of Wisconsin- Madison-2017,
http://sel.me.wisc.edu/trnsys/
[18] Sharafeldin M. A., Gyula Grof ‘Evacuated tube solar collector performance using CeO2 / water nano fluid’, Journal of
Cleaner Production, vol. 185, pp. 2–11, 2018.
[19] Sharafeldin M. A., Gyula Grof ‘Efficency of evacuated tube solar collector using WO3/ water nanofluid’, Renewable
energy, vol. 134, pp. 453–460, 2019.
[20] Javad G., Sidik N. A. C. ‘An experimental investigation on the effect of Al2O3/distilled water nanofluid on the energy
efficiency of evacuated tube solar collector’ International Journal of Heat and Mass Transfer, vol. 108, pp. 972-987, 2015.
[21] ASHRAE Standard 93 ‘Method of testing to determine the thermal of solar collector’, Atlanta, GA, USA. 2003.