performance information handbook - national treasury information... · internal controls processes...
TRANSCRIPT

National TreasuryDepartment:
REPUBLIC OF SOUTH AFRICA
national treasury
Performance Information HandbookApril 2011

i
Table of contents
1 CHAPTER 1 INTRODUCTION 1
1.1 Introduction 2
1.2 Legal and policy framework 3
1.3 Handbook content and approach 5 1.3.1 Content 5
1.3.2 Approach 6
1.4 Key definitions and distinctions 6
2 CHAPTER 2 DEVELOPING A PI FRAMEWORK 8
2.1 Introduction 8
2.2 Techniques/tools to systemise the PI Framework 9
2.3 Step 1: Indicator gathering 10 2.3.1 PI sources 10
2.4 Step 2: Prepare Performance Dimension (PD) template 10 Strategy Maps: clarifying inputs, outputs, outcomes for PI selection 10
2.4.1 Strategy Mapping 11
2.4.2 The Public Entity decision 12
2.4.3 Developing a Performance Dimension (PD) template 12
2.5 Step 3: Indicator filtering and selection 14 2.5.1 Classify indicators using the Performance Dimensions 14
2.5.2 Filtering and rating indicators 16
2.5.3 Reviewing and selecting indicators 20
2.6 Step 4: Additional decisions 21 2.6.1 Sustainability PI 21
2.6.2 Weighted PI index 21
2.7 Step 5: Validation and dissemination of PI Framework 22
2.8 Regulatory and administrative function challenges 22
3 CHAPTER 3 ENSURING QUALITY PI DATA 26
3.1 Introduction 26
3.2 Meeting minimum PI data standards 27
3.3 PI data assessment and improvement tool 27 3.3.1 Step 1: Identify and classify PI source datasets; undertake PI source data audit 29
3.3.2 Step 2: Ensure quality data from external agencies 30
3.3.3 Step 3: Assess the accuracy of internally collected data 30

ii
3.3.4 Step 4: Assessing survey and administrative data for the timeliness, interoperability and accessibility, and coherence and intergrity 33
3.3.5 Step 5: Design and undertake data verification process 34
3.4 Verifying PI source data and the role of internal audit 34 3.4.1 Verifying PI Data 35
3.4.2 Step 6: Develop remedial strategies to address data quality risks and include in
PI plan 36
3.5 Developing strategies to store PI 36
3.6 The development of electronic record and PI systems 37
4 CHAPTER 4 ANALYSIS AND REPORTING OF PI DATA 39
4.1 Introduction 39
4.2 Analysis tools/techniques 39 4.2.1 Basic comparative analysis 39
4.2.2 Benchmarking 40
4.2.3 Scoring & rating 40
4.2.4 PI integration 42
4.3 Using PI in the annual budget cycle 42 4.3.1 Setting targets 43
4.3.2 Using PI in budget preparation 44
4.3.3 Budget Implementation and PI Reporting 46
5 CHAPTER 5 ASSESSING AND BUILDING PI CAPACITY 48
5.1 Introduction 48
5.2 Capacity requirement checklist 48
5.3 Guidance on priority capacity building activities 49
6 CHAPTER 6 DOCUMENTING PI SYSTEMS 50
6.1 Introduction 50 6.1.1 Performance Information Plans 50
6.1.2 The organisational PI Manual 51
6.2 Developing a PI Plan 51 6.2.1 Step 1: Develop a PI Improvement Sequencing Strategy 52
6.2.2 Step 2: Who is responsible for PI Organisational Arrangements? 53
6.2.3 Step 3: Develop PI Framework 54
6.2.4 Step 4: Describing and targeting improvements to data quality 55
6.2.5 Step 5: Setting up systems to analyse, report and use PI 56
6.2.6 Step 6: Capacity building and training 56
6.2.7 Step 7: Compile the annexures 56

iii
6.3 Organisational PI Manuals 57
7 CHAPTER 7 PREPARING FOR PI AUDITS 59
7.1 Introduction 59
7.2 Justifying the selection of indicators 59
7.3 Ensuring the availability of supporting evidence 59
7.4 Documenting and pacing the development of systems 60
7.5 Preparing for audits 60
Bibliography 61
Appendix A: The PI System at a Glance i
Appendix B: PI Framework Decision making Flowchart ii
Decision flowchart steps iii
Appendix C: Approaches to measuring environmental sustainability iv Global Reporting Initiative (GRI) iv
Accounting for Sustainability Initiative iv
Appendix D: Reporting example vi
Appendix E: SASQAF data standards vii NARSSA Standards vii
Appendix F: Correctional Services Centre Level Monitoring Tool ix

iv
Acronyms & glossary
Accounting Officer The administrative head of a government department, constitutional institutions or entity
Administrative polices
Policies aligned to management; e.g. supply chain management
Allocative efficiency
The efficient allocation of public expenditure in accordance with government priorities (OECD, 2007, p65)
APP Annual Performance Plan
BAS National Government Basic Accounting System
Benchmarking Comparison of performance and processes to improve practice and performance
BSC Balanced Scorecard
COGTA Department of Cooperative Governance and Traditional Affairs
CPI Consumer Price Index
DEA Data envelope analysis
DLGTA Department of Local Government and Traditional Affairs
DPSA Department of Public Service and Administration
FMPPI Framework for Managing Programme Performance Information
Formula (direct) performance budgeting
Directly & explicitly links performance results to funding… requires clear and explicit output indicators and information on unit costs (OECD, 2007, p46)
GRAP Generally Recognised Accounting Practice
GRI Global Reporting Initiative
GWM&E Government Wide Monitoring and Evaluation
IGPOA Improving Government Performance: Our Approach Guideline, issued by the Department of Performance Monitoring and Evaluation
Internal Controls Processes within an organisation designed to provide reasonable assurance regarding the reliability and integrity of information and compliance with policies, plans, procedures, laws and regulations.
KRA Key result area
‘LIKERT’ scale A type of composite measure using 5 standardised response categories in survey questionnaires
M&E Monitoring and Evaluation
Metadata “Data about the data”, or data attributes that facilitate the understanding of the data.
MTEF Medium Term Expenditure Framework (3 year budget framework)

v
MTSF Medium Term Strategic Framework (5 year planning framework`)
NARSSA National Archives and Records Service of South Africa
National Planning Green paper
National Strategic Planning Green Paper, September 2009
NT National Treasury
OECD Organisation for Economic Co-operation and Development
Operational Efficiency
The provision of public goods and services at least cost for a certain service level and standard
PD Performance Dimension
PE Public entities
Performance-based budgeting
Performance indicator
Links “the funding of public sector organisations to the results they deliver, making systematic use of performance information” (Robinson & Last, 2009, p2) The specific representation of a capacity, process, output or outcome deemed relevant to the assessment of performance
Performance-informed budgeting
“There is no direct or mechanical link between performance (planned or actual) and funding. The connection is at best indirect, or there is a loose link between resources and performance information” (OECD, 2007, p42)
PERSAL Personnel and Salary Information in the National Government PFMA Public Finance Management Act
PI Performance Information
PI Framework Performance Information Framework
PI System Performance Information System
PI Plan Plan period
Performance Information Plan The five financial years to which the development of the performance plan relates
Presentational performance budgeting
Programme Performance Information
PI is presented in budget documents but there is no link, or expectation of, between these PI and allocations Quality and credible information in respect of programmes, enabling organisations to manage the achievement of strategies
Proxy PI
Records
Performance cannot be measured directly so an ‘indirect’ proxy measure is used The output of the business and administrative processes of a governmental body. Records are the final proof that a business or administrative process was completed
RBM Results Based Management

vi
RIA Regulatory Impact Analysis - “Systematic process of identification and quantification of important benefits and costs likely to flow from adoption of a proposed regulation or a non-regulatory policy option under consideration. May be based on benefit/cost analysis, cost effectiveness analysis, business impact analysis etc” (OECD, 2007b, p101)
SASQAF The South African Statistics Quality Assessment Framework
SEDS Social, Economic and Demographic Statistics
SMART
Performance targets are to be specific, measurable, achievable, relevant and time-bound.
TBL
Triple Bottom Line PI classification scheme (Social, Environmental and Economic PI classification)
PME Performance Monitoring and Evaluation Ministry

PERFORMANCE INFORMATION HANDBOOK CHAPTER 1
1
1 CHAPTER 1 INTRODUCTION
This Handbook provides descriptions of approaches and tools that national and provincial departments, public entities and constitutional institutions can use to implement the Programme Performance Information developed by the National Treasury and as outlined in chapter 5 of the Treasury Regulations.
The objective of the Handbook is to provide guidance to improve the appropriateness, availability and quality of programme performance information (PI). Departments and agencies may therefore choose to use different approaches and tools to the ones proposed in this Handbook, provided that they result in appropriate, quality and timely programme PI.
In terms of the new regulations, national and provincial departments, constitutional institutions and public entities have to develop PI Plans describing and detailing strategies to improve their programme PI Systems.
An organisational PI System comprises a PI Framework as well as structures, processes and rules to: collect, verify, store and use data to produce the required PI, target, calculate, interpret, analyse and use the PI in departmental decision making, report on the PI, review the PI Framework. A PI Framework is a structured methodology for: the selection, description and management of quality and credible performance
indicators for managing the organisation’s business strategy, linked to government-wide strategies, and
devolving PI management to the appropriate structures in the department or entity. A PI Plan comprises a description of an organisation’s current PI System and sets out its medium term strategy to improve: the indicators used to measure programme performance, the source data used to construct the indicators, the storage and accessibility of PI data, the use of PI in organisational decision making.
The PI Plan ensures the development of quality PI Systems over time. Organisations are required by the Regulations on Programme Performance Information to submit PI Plans to Parliament or the provincial legislatures and to report on their implementation.
A PI Manual is an internal guide within a department or entity to organisational PI practice. It sets out the organisational PI Framework and clarifies roles and responsibilities for the management and use of PI. A PI Manual is not required by the new Regulations, but this Handbook advises organisations to compile one in order to support the quality and effective use of PI.

PERFORMANCE INFORMATION HANDBOOK CHAPTER 1
2
1.1 Introduction Different departments, institutions and entities are at varying stages with regards to developing effective PI Systems. Some organisations have been developing their PI Systems for decades. These organisations often use sophisticated electronic systems to extract information from their electronic records (administrative, financial, human resource and other) to PI datasets and then calculate indicator values. They apply various target setting, rating and scoring techniques to interpret and analyse performance data and have effective institutional systems to use the information in organisational decision-making.
Other organisations at national and provincial level have PI Frameworks and Systems that are still rudimentary. Their only explicit programme performance indicators are selected to comply with the Public Finance Management Act requirement to submit measurable objectives with budgets, in other words, for use in the Estimates of National Expenditure (ENE), or to comply with the National Treasury Regulations on Strategic Plans as well as complying with the requirements of the Department of Performance Monitoring and Evaluation, Department of Public Service and Administration (DPSA) and Statistics South Africa (StatsSA). The quality of these indicators is sometimes poor and it is often because they were selected without a proper organisational process and the data used to calculate them for baseline and reporting purposes, is not available or is unreliable. These organisations have weak systems to collect and store performance data and PI receives little attention in organisational decision-making processes.
Organisations that have progressed in their development of PI Systems will confirm that the development of a robust management system is an iterative process of trial and error, even when a lot of effort is put in initially to design a good PI Framework. They will also confirm that after more than a decade, the iterations, trial and error and improvements still continue.
This chapter shares the lessons learned from the experiences of some South African departments and entities in developing their PI Systems and provides guidance on how best to sequence the process from the position of weak PI.
A core system design step is to decide for each indicator how the indicator will be used in organisational planning, budgeting, execution and reporting processes. Key questions are: Who is responsible for managing the indicator and related target? For the collection of data from source data systems? For calculating the indicator? For interpreting the results (chapter 4)? How will targets for the indicator be identified and validated with affected parties? When in organisational decision-making and review cycles will the indicator be
used? How will the indicator be reported on, how frequently, by whom and to whom? Will performance against the indicator be benchmarked against any target, against
previous performance or against performance of other units undertaking the same work?
When will the indicator be reviewed to confirm its continued usefulness?

PERFORMANCE INFORMATION HANDBOOK CHAPTER 1
3
The requirement is that at a minimum, organisations should comply with National Treasury Regulations requirements of a quarterly report on programme performance to the executive authority. They should also establish a process to discuss the report and identify corrective action should quarterly targets not be attained.
This Handbook assists departments (national and provincial), public entities and constitutional institutions to achieve the government’s aspirations to manage performance through the development of robust Performance Information (PI) Frameworks and Systems.
The intended users of the Handbook are the organisational units and individuals designated as responsible for the determination of a PI Framework and the development and management of the resulting PI System. The Handbook will also be useful for programme and unit managers who are providing input into the organisational PI Framework and System, or who want to develop more comprehensive sub-frameworks for their specific programmes, sub-programmes, units or projects.
The National Treasury provides an internet-based PI resource for organisations (see www.treasury.gov.za/publications/other). The site includes electronic copies of this Handbook, spreadsheet tools and additional local and international readings. Over time it will also include examples of PI Plans, PI Manuals and PI reporting formats from various organisations.
This Chapter outlines the legal requirements in respect of the Handbook contents and the recommended approach and key definitions.
1.2 Legal and policy framework The intention to manage government performance, not only through the management of budgets and ensuring effective administrative practices, but also by making the results of programmes transparent, is signalled in the Constitution. Institutions have a responsibility to publish administrative and performance information to account to Parliament and provincial legislatures in accordance with Sections 92 and 114 of the Constitution and to be transparent and accountable to the public in accordance with section 195 of the Constitution.
Accounting officers are responsible for targeting performance and managing PI. In terms of the PFMA Section 27(4), national departments’ accounting officers must submit measurable objectives with their draft budgets to Parliament and provincial accounting officers submit to provincial legislatures. In terms of Section 40(1) and (3) accounting officers must provide information on departments’ achievements against their predetermined objectives in the Annual Report; and in terms of Section 55(1) and (3) accounting authorities of public entities should do the same. Furthermore, in Section 38(1)(b) accounting officers of departments and constitutional institutions are responsible for the transparent, effective, efficient, and economical use of resources of the department or constitutional institution.
In terms of the Public Service Act (1994) Section 7A(4)(c) executive authorities determine the reporting requirements of the heads of government components, including public entities, to the head of the principal department to enable oversight of the component in respect of policy implementation, performance, integrated planning, budgeting and service delivery.

PERFORMANCE INFORMATION HANDBOOK CHAPTER 1
4
The Policy Framework for the Government Wide Monitoring and Evaluation (GWM&E) System, published in 2007 by the Presidency, emphasised the importance of monitoring and evaluation in realising a more effective government. It identified three data terrains that together comprise the sources of information on government performance: (i) evaluations, (ii) programme PI and (iii) social, economic and demographic statistics (SEDS). It assigned to accounting officers the accountability for the frequency and quality of monitoring and evaluation information; the integrity of the systems responsible for the production and utilisation of the information; and it requires prompt managerial action in relation to M&E findings.
The GWM&E identifies the National Treasury as the lead institution responsible for programme PI. This is in line with its Constitutional authority for performance information and responsibility for prescribing measures to ensure transparency and expenditure control in each sphere of government as outlined in sections 215 and 216.
In 2007 the National Treasury issued the Framework for Managing Programme Performance Information (FMPPI). The aims of the FMPPI are to: define roles and responsibilities for PI, promote accountability to Parliament, provincial legislatures and municipal councils
and the public through timely, accessible and accurate publication of performance information,
clarify standards for PI, supporting regular audits of non-financial information where appropriate,
improve the structures, systems and processes required to manage PI. The document outlines key concepts in the design and implementation of management systems to define, collect, report and utilise PI in the public sector.
The National Treasury in accordance with the PFMA must promote and enforce transparency and effective management in respect of revenue, expenditure, assets and liabilities of departments, entities and constitutional institutions.
The Regulations on Programme Performance Information as part of chapter 5 of the Treasury Regulations are issued to ensure that financial and non-financial performance information underpins planning, budgeting, implementation management and accountability reporting to promote transparency and expenditure control towards economy, efficiency, effectiveness and equity in the use of public resources.
The Department of Performance, Monitoring and Evaluation will collaborate with the National Treasury in supporting the departments to develop Performance Information Plans and Performance Information Systems. The department is currently in a process of developing a monitoring and evaluation information technology system that would support the development of monitoring and evaluation systems by various departments.
In 2009 government re-affirmed its intention to shift its high-level management focus from inputs (budgets, personnel and equipment) and outputs to managing for outcomes. The Department of Performance Monitoring and Evaluation (PME) has recently announced the adoption of 12 measurable outcomes that will become the focus of government policy and implementation. Specific departmental performance targets will

PERFORMANCE INFORMATION HANDBOOK CHAPTER 1
5
be finalised once service delivery agreements are concluded in support of the identified outcomes.
With the renewed outcome focus, accountability will also shift from just being about compliance with regulation, to include accountability for service delivery outputs and outcomes. This accountability will be at the political level, through mechanisms developed by PME1, and at a managerial level between Ministers and accounting officers. The Minister in the Presidency: National Planning emphasised that the central planning instruments such as the Medium Term Strategic Framework and the National Plan of Action will focus much more on measurable objectives and timelines.
Underpinning this approach to managing government is the strengthening of the planning systems and the GWM&E system. PME, Improving Government Performance: Our Approach 2009, p14):
“the proposed performance management system can only function if there is credible, validated, timely information on outcomes and the other elements of the results chain: inputs, budgets, activities, service delivery outputs. It is critical to improve government’s data architecture to support performance management.”
and
“It is important that the data…used in the Performance Monitoring and Evaluation system is accurate and trustworthy.” PME, 2009, p14)
1.3 Handbook content and approach The Handbook is built on the premise that PI Systems are developed around comprehensive, integrated and consistently comparable PI Frameworks. Appendix A provides a diagram which illustrates the sequencing of indicator selection (PI Framework development), data collection and use of PI in a PI System.
1.3.1 Content Most organisations already have some form of PI in place, namely the indicators identified in their Strategic Plans and reported on in their Annual Reports, and a system to manage them. The structure of the Handbook is built around a series of tools that enable PI managers in national and provincial departments, public entities and constitutional institutions to assess and improve their PI Systems; from the choice of indicators to assessing and improving the human resource and system capacity to manage PI.
Performance indicators in different departments and entities are often associated with a whole different set of approaches and tools, for example logical frameworks, results-based management (RBM) techniques, and the balanced scorecard (BSC) approach. The Handbook therefore takes a broad approach that accommodates the different methodologies adopted and provides tools to: Map out organisations’ existing policies, strategies and plans,
1 At the time of compiling this Handbook the proposal was that Ministers and MECs would have performance agreements with the President followed by six-monthly reporting on progress, while sector institutions would commit to achieving performance, measured by selected performance indicators through sector forums and sector delivery agreements.

PERFORMANCE INFORMATION HANDBOOK CHAPTER 1
6
Test whether the performance indicators proposed in them are adequate against key FMPPI criteria,
Encourage the addition or improvement of indicators.
The key proposed tools are: A tool to describe, rate and select performance indicators, and to develop a
comprehensive, systematic, integrated, compact and consistently comparable PI Framework against an organisation’s strategic objectives, structure and values (Chapter 2)
A tool to assess and improve the quality of PI source data, and the systems that collect and store PI data (Chapter 3)
Approaches to using PI optimally in organisational and budget management (Chapter 4)
A tool to assess PI human resource and system capacity (Chapter 5) A tool for organisations with nascent PI and PI capacity that allows them to build the
most important, core systems first (Chapter 6) A tool to build a PI Plan to document organisational strategies to improve PI and its
use (Chapter 7).
1.3.2 Approach This Handbook introduces useful approaches and tools; explains key concepts; pools information regarding various regulations, policies and guidelines in the South African public sector relevant to the management of programme PI; and provides examples of the application of key concepts, approaches and tools.
The tools provided in this Handbook can be used by all organisations. The appropriate application of the tools however requires organisations to understand their functions and structures. This might mean adjusting some tools to fit the organisation’s requirements, or leaving out some steps of the tools, which are not applicable to its’ specific environment.
A Microsoft Excel Workbook is provided with this Handbook (see www.treasury.gov.za/publications/other). The Workbook includes the PI Framework and data assessment databases, various worksheets and a help function, all of which can be accessed from a central worksheet. It is expected that organisations may adjust and apply the tools in an organisation-relevant way. The text therefore frequently refers to the possibility of adjusting the content of the tools to sector or organisation-specific imperatives, values and structures.
1.4 Key definitions and distinctions Distinguishing between PI and Monitoring and Evaluation (M&E): The Policy Framework for GWM&E identifies programme PI as a data sub-set in the M&E framework. The focus of this Handbook is only on programme PI, and its management and use. Programme PI itself draws on primary datasets, such as administrative and financial records, social, demographic and economic statistics and additional data collected by departments, for example through surveys. In principle the PI Framework developed by an organisation determines what is considered programme PI for the organisation. It is thus important for organisations to initially develop frameworks with a few indicators, but ensure that accurate, valid and complete data is collected and indicators are used effectively in decision-making and monitoring.

PERFORMANCE INFORMATION HANDBOOK CHAPTER 1
7
Administrative data, management information and programme PI: Administrative records (records of programme implementation for example clinic records, school attendance records) and management information (information on the operation of the organisation for example financial and human resource records) can comprise the source data required for the indicators selected to make up the programme PI.
The Performance Information Plan, the Strategic Plan and the Annual Performance Plan: The Strategic Plan and the Annual Performance Plan (APP) are required in terms of the Treasury Regulations. These plans set out the organisation’s goals and objectives, the strategies to achieve these objectives and the annual performance targeted by programmes to achieve the identified goals. These plans would set the targets attached to the indicators selected to measure organisational performance. The PI Plan will set out the organisation’s strategy to manage performance information that is required to construct the indicators and report against the targets set in the Strategic Plan and the APP, amongst others.
PERFORMANCE INFORMATION HANDBOOK CHAPTER 2
8
2 CHAPTER 2 DEVELOPING A PI FRAMEWORK
2.1 Introduction The ‘Improving Government Performance: Our Approach’ (PME) proposal of 2009 demands that:
“…we need to focus more on outcomes as we use our time, money and management… This requires a shift of focus from inputs - budgets, personnel and equipment - to managing for outcomes”. (PME, 2009, p3)
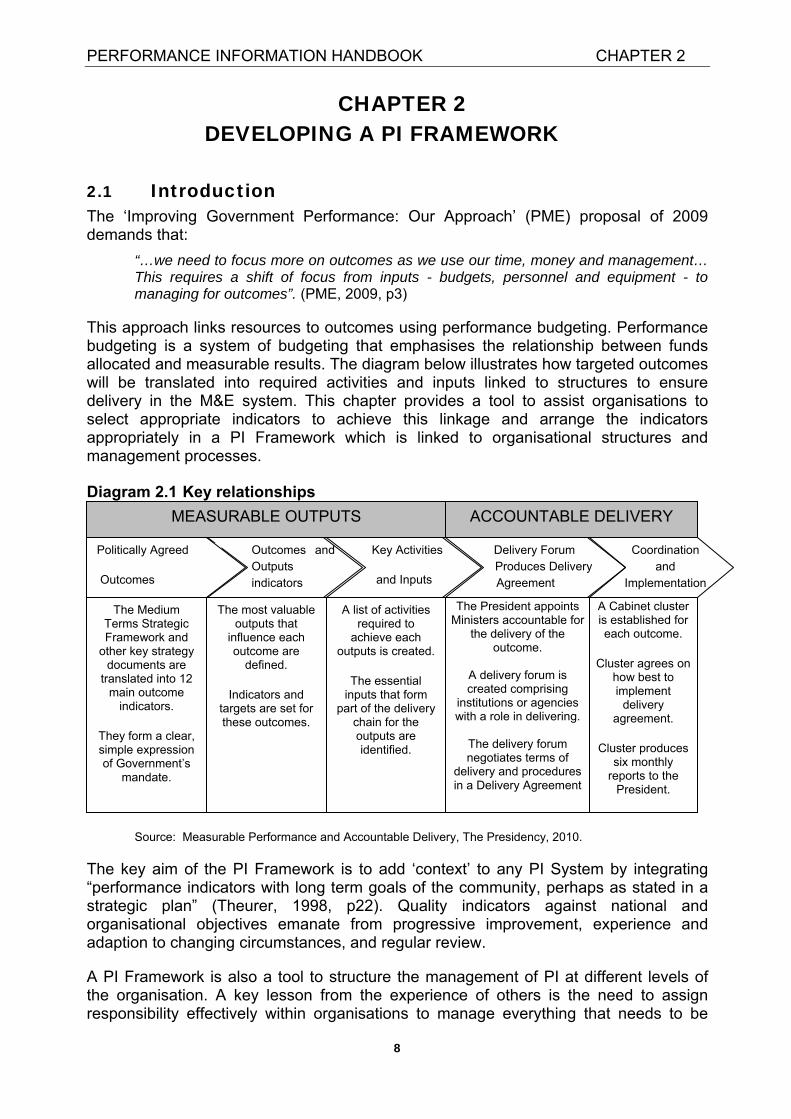
This approach links resources to outcomes using performance budgeting. Performance budgeting is a system of budgeting that emphasises the relationship between funds allocated and measurable results. The diagram below illustrates how targeted outcomes will be translated into required activities and inputs linked to structures to ensure delivery in the M&E system. This chapter provides a tool to assist organisations to select appropriate indicators to achieve this linkage and arrange the indicators appropriately in a PI Framework which is linked to organisational structures and management processes. Diagram 2.1 Key relationships
Source: Measurable Performance and Accountable Delivery, The Presidency, 2010.
The key aim of the PI Framework is to add ‘context’ to any PI System by integrating “performance indicators with long term goals of the community, perhaps as stated in a strategic plan” (Theurer, 1998, p22). Quality indicators against national and organisational objectives emanate from progressive improvement, experience and adaption to changing circumstances, and regular review.
A PI Framework is also a tool to structure the management of PI at different levels of the organisation. A key lesson from the experience of others is the need to assign responsibility effectively within organisations to manage everything that needs to be
Politically Agreed
Outcomes
Outcomes and Outputs indicators
Key Activities
and Inputs
Delivery Forum Produces Delivery
Agreement
Coordination and
Implementation
The Medium Terms Strategic Framework and
other key strategy documents are
translated into 12 main outcome
indicators.
They form a clear, simple expression of Government’s
mandate.
The most valuable outputs that
influence each outcome are
defined.
Indicators and targets are set for these outcomes.
A list of activities required to
achieve each outputs is created.
The essential inputs that form
part of the delivery chain for the outputs are identified.
The President appoints Ministers accountable for
the delivery of the outcome.
A delivery forum is created comprising
institutions or agencies with a role in delivering.
The delivery forum negotiates terms of
delivery and procedures in a Delivery Agreement
A Cabinet cluster is established for each outcome.
Cluster agrees on how best to implement
delivery agreement.
Cluster produces six monthly
reports to the President.
MEASURABLE OUTPUTS ACCOUNTABLE DELIVERY

PERFORMANCE INFORMATION HANDBOOK CHAPTER 2
9
measured. The selection of a few critical indicators, which will measure service delivery on the key mandate of the organisation for strategic and high level operational management purposes, will ensure that executive management is not overwhelmed with too many indicators (while providing appropriate and strategic coverage of the major service delivery demands). Organisations should apply the Pareto principle, that 20 per cent of the indicators will satisfy 80 per cent of the PI demands. This does not obviate the need to measure and monitor a vast array of other additional information operationally, for which responsibility is assigned at various lower levels through a PI Framework.
Finally, a well-developed PI Framework also ensures that performance is measured broadly against different types of performance criteria and their associated indicator types. The FMPPI (page 8 and 9) refers to different indicator criteria. The methodology recommended here for organisations with weak PI Systems is to adopt a minimalist approach; for example the 'classification matrix' requests users to classify indicators in terms of 'effectiveness’ or ‘efficiency', to check if proposed indicators are not overly concentrated against either criterion. Whilst this is the minimum requirement recommended it is feasible that advanced organisations may choose to undertake a more extensive classification incorporating all FMPPI indicator types.
2.2 Techniques/tools to systemise the PI Framework2 The recommended systematic approach is supported by a number of conceptual and practical techniques/tools. The tools allow organisations to realise the benefits of keeping the number of indicators managed by any one particular individual to a minimum, while meeting broader performance budgeting requirements.
The diagram below sets out in broad terms the methodology proposed here.
Diagram 2.2 Process to systemise the PI Framework
Step 1: Indicator Gathering
Strategic Plan
Operational and other plans
Best practice other orgs
Indicator gathering
Step 2: Prepare Performance Dimension Template
Set out Organisational structure, objectives/strategies and
value
Public entity decision
Use of Strategy Maps
Step 3: PIF Indicator Filtering and Selection
Sort indicators by
Performance Dimensions
Filter indicators by completing the selection matrix for all indicators
Sort indicators by Performance Dimension
Review Performance Dimension classification
Determine rating scores for each indicator
Finalise Performance Dimension allocation
Step 4: Additional decisions
Weighted index?
Sustainability PI
Step 5: Validation and Dissemination
Strategic Plan
Service delivery and budget implementation plans
Best practice other organisations
MTSF
Other high level plans and policy documents
MTEF/Budget measurable objectives
Gather indicators Design template to determine PI Hierarchy: •Objectives/strategies•Organisational structure•Values
Use of Strategy Maps to map out input, output, outcome links between indicators
Determine links with related Public Entities and other institutions
Classify indicators by Performance Dimensions
2 This handbook is not a comprehensive manual for all tools and techniques referred to, sometimes only providing a reference to further information that can be accessed. This is deliberate to limit the size of this guide and refrain from unnecessary detail especially where organisations have already built topic capacity.

PERFORMANCE INFORMATION HANDBOOK CHAPTER 2
10
While this diagram describes a linear process, the indicator selection process is not linear and will invariably require a return to earlier steps, on account of gaps identified, weak data, problems in setting targets or as a result of benchmarking. Appendix B provides a more detailed decision flowchart of the steps and illustrates the necessity of returning to earlier steps to strengthen the resulting PI Framework.
2.3 Step 1: Indicator gathering
2.3.1 PI sources Prior to final selection, all existing and potential indicators should be assembled for entry into the Performance Dimension Template. The main sources of existing indicators are: Medium Term Strategic Framework (MTSF) and other central frameworks - the
measurable objectives and their associated indicators and targets that the department must achieve or track as required by other departments, particularly the Presidency, National Treasury, DPSA and COGTA.
Strategic Plans - most recently approved plan that includes a set of indicators for each key result area (KRA)/objective and programme.
Other high level policy documents and strategies - policy documents and strategies that are currently valid in relation to the department’s programmes and sub-programmes
Medium Term Expenditure Framework (MTEF)/Budget – the measurable objectives that accounting officers must ensure accompany their budgets, normally a sub-set of the strategic plan indicators, but consistency should be confirmed and any unique ‘budget’ indicators should be included in the total collection.
Service Delivery or Budget Implementation Plans – any form of operational plan that explains ‘how’ the budget will be implemented will likely contain operational indicators, but in some instances operational indicators need to be elevated to a higher ‘proxy’ status due to objectives under measurement at a higher level (refer to Performance Dimension)
Comparable Solutions - consideration, with the necessary caution, should be given to reviewing the PI solutions of other comparable organisations, nationally and internationally, for ideas on indicators that may not have been considered previously and might add value to the indicator selection.
2.4 Step 2: Prepare Performance Dimension (PD) template
Strategy Maps: clarifying inputs, outputs, outcomes for PI selection It is important to consider the relationship and distinction between outputs and outcomes in a practical sense for an organisation. Outputs: are the final products, or goods and services produced for delivery through organisational processes. Outputs may be defined as "what we produce or deliver". Outcomes: are the medium-term results for specific beneficiaries that are the consequence of achieving specific outputs. Outcomes should relate clearly to an institution's strategic goals and objectives set out in its plans. Outcomes are "what we wish to achieve".

PERFORMANCE INFORMATION HANDBOOK CHAPTER 2
11
The PI Framework should include indicators that are within the control of the organisation and those that are important to track from a policy management perspective. There needs to be a balance between organisation specific operational indicators and policy-oriented indicators.
Thus the sorting of indicators into Performance Dimensions will require the organisation to be clear about the relationship between inputs, outputs and outcomes against organisational objectives, even if many outputs from different organisations contribute to the achievement of an outcome (see Box 2.1 below for a proposal to manage these outcomes across the public sector).
Box 2.1 Managing multi-output outcomes
Although not a precise science, it is recommended that the principles of this chapter be applied to multi-output outcomes by:
Classifying multi-output outcomes and recognising them for their uncontrollable characteristics
Complete the procedures in this chapter, and then review all of the indicators for potential government priority importance
Decide whether the outcome relates to the outputs of more than one organisation or sector
Initiate a dialogue between affected organisations or within the organisation to thoroughly discuss the proposed outcome/s measured and obtain a consensus on acceptable targeted improvements. PME has initiated such dialogues in relation to its 12 outcomes in order to conclude sector delivery agreements. The proposal here is for similar processes within organisations or between organisations for outcomes that are not covered by these delivery agreements.
Agree on the combination of outputs and resource levels which the organisation/s believe will collectively achieve the desired improvement
Strategic and budget plans should be written in such a way that the organisations will be held accountable for the outputs, with clear reference to the connection to the targeted outcome
Agree that the lead organisation would be responsible for the outcome data collection if more than one organisation contributed to the outcome, but each should report on the achievement of their specific output/s and its relationship to the outcome.
Agree on the lead organisation that would be responsible for bringing together all outputs and preparing a holistic report on the outcome (refer chapter 4 for a discussion on reporting and integrating PI)
This proposal is represented diagrammatically in an example within the excel PI tool.
2.4.1 Strategy Mapping The strategy map analyses an organisation’s strategy from 4 linked perspectives: financial, customer, internal and learning and growth. It identifies processes, linking them to outputs and outcomes, thus assisting with indicator selection. It will assist organisations to identify at which level of the PI hierarchy an indicator should be managed and will assist in identifying additional or alternative indicators for the gaps revealed by PI sorting, filtering and scoring.
Although there is recognition that the PI demands of public sector departments and entities can be quite different and sometimes more complex when compared to the private sector for which the Balanced Scorecard (BSC) originally evolved, it is suggested here that `strategy mapping can be applied independently to assist indicator identification.

PERFORMANCE INFORMATION HANDBOOK CHAPTER 2
12
The compilation of ‘strategy maps’, which makes these relationships clear, is useful in the development of a PI Framework. It identifies what ‘needs’ to be measured and enables the organisation to compare the results with existing PI. However, consideration might also be given to using the ‘Logical Model’ or Results-Based Management (RBM) based techniques to organise indicators from the above sources into a hierarchy of inputs, outputs and outcome levels. A ‘step-by-step’ guide to compile strategy maps is not provided, although additional readings are available. We recommend using the PD tool.
2.4.2 The Public Entity decision Public entities should develop their own PI Frameworks. However, in order to determine the high level PI that can be used for oversight over the public entity and which may form part of the oversight of department’s own PI Framework, entities and departments should work together applying the techniques provided here.
2.4.3 Developing a Performance Dimension (PD) template The Performance Dimension Template is a conceptual framework to assist in graphically representing the results of a filtering and selection process as a PI Hierarchy.
What is a PI Hierarchy? Classifying indicators into a ‘hierarchy’ mainly enables PI management to be arranged and responsibility assigned to the appropriate level within the organisation, so that any one level is not overwhelmed by the magnitude of the PI being managed by it.
Programme managers will be confronted with the necessity of filtering strategic information for Parliament, Cabinet and the public to a minimum level to achieve strategic planning, performance budgeting and monitoring requirements, while also ensuring good operational management information for the institution. To illustrate, PME obtained agreement on 12 outcomes, focussing on seven priority areas across government. It is an on-going challenge to design a PI Framework that can concisely achieve management and monitoring of a confined set of outcomes when clearly government has a much broader array of activities.
It is suggested that any layer of the management hierarchy could only reasonably manage approximately 20 indicators on a regular basis. When the number of indicators exceeds this amount then it is time to consider whether it is possible to assign responsibility of the excess to another level within the organisational structure.
The Performance Dimension template Refer to the graph below. It applies the philosophy of 3 key dimensions to performance measurement: strategy (represented by KRAs/Objectives), organisational structure (represented by sector, department, programmes and sub-programmes), and values or the characteristics of the indicators being considered for selection3. The key aims are: That everything which needs to be measured is measured There is not over-measurement of certain programmes and sub-programmes
3 The ‘strategy’ level is illustrated by KRAs from the Department of Agriculture’s Strategic Plan, 2009.

PERFOR
The indic
Therindic
Each
Diagram
In descrattribute The
‘cube A ve
referdime
A sin
It is alsoobjectivepreferreconvent
Recall tstrategiemeasure
DesigniIn desigorganisais madeorganisa The
orga
RMANCE
appropriatcators re is potecators h level of m
m 2.3 Perfo
ribing the e naming cooverall 3 de’. ertical or hrred to asensions as ngle square
o especiallyes and vad to one tion of assi
hat ‘what es or all ement will
ing an orggning an ational doce at the staational hier
‘front’ dimnisation sh
INFORMA
te level of
ntial for ‘
manageme
ormance D
PD and aonvention
dimensiona
orizontal ss a ‘slice’.well as the
e within an
y importanalues, andthat meetsgning all c
gets measof the inlikely be u
ganisationorganisat
cumentatioart to desigrarchies anmension ohould choo
ATION HAN
managem
drill-down’
nt is not ov
Dimension
applying tis applied:
al PD in the
section; e.g. To be me KRAs rel
ny slice is a
nt to note td that an s limited oriteria that
sured getsdicators anachievab
nal PD temtional PD
on such as gn a tempnd values, of the PDose a limite
NDBOOK
13
ment is ass
lower lev
verwhelme
ns and the
the concep: e above di
g. departmmore speclated to it aa ‘block’.
that any onindicator
or few critet apply to th
s done’. Soare of a ble.
mplate template
the strateplate that p
but which D represeed number
signed ove
vel indica
ed by too m
e Perform
pt in the s
agram is a
ment structcific one sare known
ne specificthat meeteria. Wherhat indicato
o if there similar ty
e, organisagic plan. It
provides cois also stra
ents the or of objecti
ersight of t
tors to ex
many indica
ance Cub
sections b
alternativel
ture and vstructure, as a slice.
c indicator ts multiplere this is tor.
are no indpe, then
ations shot is importaoverage ofategic. organisatioive statem
CHAPT
he particu
xplain hig
ators.
be
below the
ly referred
value dimeand all t
.
can satisfye criteria wthe case a
dicators focomprehe
ould referant that sof its key ob
on’s stratements that r
TER 2
lar set of
her level
following
to as the
nsions is he value
y multiple would be apply the
r the key ensive PI
r to key ome effort bjectives,
egy. The represent

PERFORMANCE INFORMATION HANDBOOK CHAPTER 2
14
what it wants to achieve. These objective statements would normally be found in the strategic plan.
The ‘side’ dimension is the organisation’s structure. The top dimension is the indicator values or characteristics selected by the
organisation to classify the ‘type’ of indicator used. The ‘standard’ PI values/characteristics recommended are: Technology – does the indicator measure technological aspirations? Innovation – does the indicator measure an innovative or unique practice? Risk – indicators that measure key aspects of legal and financial risks or health and
safety targets Quality – indicators that measure quality of outcomes, usually against
predetermined standards Productivity (Success) – quantitative indicator Financial – measure of achievement of an outcome; e.g. reduced unit cost(.)
The PD concept enables each indicator to be categorised in an individual ‘block’ or ‘blocks’ within the dimension ‘slice’. This can be done for all slices in each of the three dimensions.
The PD can be adapted to suit the circumstances of the organisational structure and values being considered. For example, ‘Sectors’ are included in the PD diagram (see Diagram 2.4 below) to recognise that some indicators may be classified as they relate to an overall sector with multi-department involvement, most likely crucial to national priorities. But another structure such as a small public entity may not have a need for this level and would also replace the ‘Department’ level with the label ‘Public Entity’. Similarly, organisations can either use the suggested set of values or include other values described in their strategic plan. There may be suggested values, e.g. ‘technology’ and ‘innovation’ that may not be applicable to all organisations.
The concepts here are presented in a graphic format, considered the best way to understand the requirements. However, in practice and especially when dealing with a large number of indicator proposals, the techniques described in this chapter (as well as techniques described in chapter 4) are best implemented in a simple database format. NT has developed Excel spreadsheet tools to assist (www.treasury.gov.za/publications/other).
2.5 Step 3: Indicator filtering and selection
2.5.1 Classify indicators using the Performance Dimensions Once an organisational PD Template is ready, the next task is to classify all the indicators which are gathered from the various sources and listed as potential indicators by the three dimensions. In the diagram below, the results of such a process of indicator ‘mapping’ is displayed. The illustration depicts that for each ‘programme’ in respect of the indicators, a circle is drawn in the relevant ‘block’ that most closely corresponds with the classification of that indicator in the PD classification matrix. In selection of the correct block, consider the appropriate KRA/objective and appropriate value. Once all proposed indicators are drawn into the programme PD it is highly probable that there

PERFOR
will be blocks) inappropa ‘block’‘block’. Cone ‘●’,
Diagram
Followinare a nu
O In
P P
in
A classifbe measdecided relevantannual s
4 A PI class
RMANCE
‘blank’ bloshould bepriate to m’ needs anCompletion‘X’ or ‘D’.
m 2.4 Perfo
ng this, theumber of co
Over-measndicators m
PD structurPotential tondicators, s
fication gasured direthat a sur
t such an survey the
sifier and/or e
INFORMA
ocks, highl closely ex
measure a pn indicator,n of the PD
ormance D
e examineonsideratio
urement ofmay be core o select thsubject to f
ap may simctly or the
rvey is neeindicator n
ere will obv
examiner shou
ATION HAN
ighting a xamined. particular ‘bbut it mus
D classifica
Dimension
r should inons:
f that PD fansidered f
he best infurther ass
mply exist b data is no
eded to devneeds to bviously be
ld have a goo
NDBOOK
15
potential mIf the examblock’ thenst be deveation requ
n ‘slices’
nspect the
actor, dispfor higher o
ndicator fosessment t
because thot immediavelop a mebe at least
a 2 year d
od knowledge
measuremminer4 is cn an ‘X’ sholoped thenires that e
e ‘blocks’ t
played by mor lower le
or that PDto be discu
he desired ately availaeasuremen
measureddelay befo
of the strategi
ent gap. Tconvinced ould be dran a ‘D’ shouvery block
hat have m
multiple indevel use in
D factor assed below
governmeable. For ent index. Bud twice andre the indi
ic plan
CHAPT
These gapthat it is g
awn in the uld be dra
k has eithe
multiple ‘●
dicators n the organ
and drop tw.
ent outcomexample, iut before bd if this isicator can
TER 2
ps (blank genuinely ‘block’. If wn in the
er at least
’s. There
nisational
the other
me cannot t may be
becoming done by be used.

PERFORMANCE INFORMATION HANDBOOK CHAPTER 2
16
Until then, consideration would need to be given to elevating a lower level operational indicator to achieve ‘proxy’ KRA coverage.
The other advantage of the PD classification criteria is that it provides a simple thought provoker to identify an aspect of government activity that may not have been measured previously but should be. For example, ‘innovative’ practices may not have featured in a previous PI Framework but when the gap is highlighted it is realised that there is an excellent innovative practice occurring that is not being measured.
The natural outcome for ‘first round’ classification, due to the nature of public sector organisations, is often that there is usually a heavy concentration in terms of quantitative ‘productivity’ type indicators that suggests some KRAs are inadequately managed, or too many indicators are selected for political structures or executive management to manage and not assigned operationally within the organisation.
2.5.2 Filtering and rating indicators This section deals with the procedure for entering the information of all proposed indicators into the indicator selection ‘matrix’, to have the necessary comparable information available to select from and rate the proposed indicators. It simultaneously deals with the selection of the best indicators as well as indicators capable of having SMART performance targets.
The 2007 FMPPI explained the concept of SMART: the acronym for performance targets being specific, measurable, achievable, relevant and time-bound. The rating system in the PI Framework tool extends the classification criteria to include other FMPPI indicator criteria considerations. The tool also provides a rating and scoring method to help decide whether a specific indicator should be used or developed.
PI filtering and selection criteria Some important advice before entering into the indicator selection phase:
Focus on the factors that are crucial to success and measure "what is important, not make important what you can measure” (Evans and Richardson, 2009, p16)
The following illustration shows the header labels copied from the selection criteria ‘matrix’, a simple Excel spreadsheet template. This includes the PD classification and some of the classification factors, to become the basis of rating and indicator selection.

PERFOR
Diagram
It is recoand seleinformatThe keyindicatorhigh quainitially f
Deteindic
Indicmeasas ‘cbroadobjec
Indicinterpattenfavouecongene
Perforeprecommpropobelon
RMANCE
m 2.5 PI Se
ommendedect indicatotion is entey purpose rs to a maality indicatfar more in
ermine thecator and is
cator objesurement o
capacity bud, in orderctive.
cator intepreted for ndance raturable out
nomic and eral level of
ormance esentation monly theosal of thengs), and V
INFORMA
election m
[Exa
d that a ‘sors. The mered, the nof this wilnageable tors. The pdicators w
e name ofs kept as s
ective: Deof the num
uilding’. Der to avoid a
rpretationa positive
te at a capcome comfinancial if interest r
Dimensioof the te
abbreviate organisatValue/Cha
ATION HAN
matrix
ample extrac
staged’ andmeaning ofnext requirell be to senumber alprocess ou
will be ident
f the indichort as po
scription omber of stafepartmentsa situation
n: Descript or ‘good’ pacity build
mpared to indicators ates is view
on classifichnique. Tted KRA tion level waracteristic
NDBOOK
17
ct from indica
d ‘iterativef these criement is t
elect the migned to th
utlined is futified than
cator: Ensssible with
of what theff attending
s must enswhere ver
tion of howoutcome.
ding trainilow level it is not awed favou
ication: TThere are from the
where the ic.
ator selection
e’ process teria is deo determin
most approhe organisundamentacan be rea
sure that thout corrup
e indicatorg a trainingure that in
ry many ind
w the resuOften this
ng programof attendalways obvrably by in
This criterio3 aspects
strategic ndicator pr
n tool]
be used toetailed belone a ratingopriate indation’s stru
ally based oalistically a
the name pting the m
r is intendeg session wdicator objdicators ar
ult of the is can be omme woulance. But, vious, e.g. vestors, bu
on matches. Strategplan), Struroposer be
CHAPT
o identify, ow. Once g for each icators anucture, andon the prepplied and
truly descmeaning.
ed to achiwould be d
bjectives arre linked to
ndicator sobvious, e.ld be consfor some an increaut not borr
es to the gy/Objectivucture (fi
elieves the
TER 2
evaluate all of the indicator. d reduce d to have mise that
d used.
cribes the
ieve, e.g. described re not too o any one
should be g. a high sidered a complex
se in the rowers.
graphical ve (most rst ‘slice’ indicator

PERFORMANCE INFORMATION HANDBOOK CHAPTER 2
18
Data availability: Is the data necessary for calculating the indicator currently available from an existing system, or is data collection design required? The preference for ease of indicator implementation would be using existing data. The regularity of data updating as well as the reliability and credibility of the data should also be taken into consideration.
Leading/Lagging classification: A leading indicator provides evidence of a future outcome in advance of its occurrence, while a lagging indicator explains past outcomes. Stock market returns are a leading indicator for economic performance: the stock market usually begins to decline before the economy as a whole declines and usually begins to improve before the general economy begins to recover from a downturn. The unemployment rate is a lagging indicator of general economic performance: employment tends to increase two or three quarters after an upturn in the general economy. Frequently the focus is on lagging indicators as these are the easiest to compute, but lagging indicators by themselves promote a philosophy of identifying and correcting past divergence from plans rather than avoiding future problems. A balance between leading and lagging indicator types is preferred to alert managers to areas where corrective action is required and allow corrective action to avoid problems before they arise.
Economy/Effectiveness/Efficiency classification: FMPPI defines economy as exploring “whether specific inputs are acquired at the lowest cost and at the right time; and whether the method of producing the requisite outputs is economical”; efficiency as “how productively inputs are translated into outputs” indicating a desire for the maximum outputs for a given level of inputs or minimum inputs for a given level of outputs; and effectiveness is defined as “the extent to which the outputs achieve desired outcomes”. None of these indicator types is necessarily ‘better’ than the other, but the purpose of this classification is to encourage that a mix used5.
Triple Bottom Line classification: This was introduced as part of the ‘Balanced Scorecard’ approach to ensure that there was a balance in the PI being applied, that social, environmental and economic factors should be considered concurrently.
Community/Customer/Client Satisfaction Influence classification: FMPPI requires ‘who benefits’ as an indicator selection criterion. A key consideration is whether an improvement in the indicator outcome or achievement of the outcome will have a ‘direct’ genuine impact on the organisation’s community/customer/client satisfaction. A preference for indicator selection is for indicators that have a positive or high influence on satisfaction.
Departmental 'influence' on indicator outcome: A direct relationship exists between FMPPI ‘accountability’ requirements and an understanding of the degree to which an organisation can influence the outcome. Without influence it is not feasible to be held fully accountable. There will be indicators (generally outcome indicators) that are extremely useful, but preference would be given to those over which an organisation can exert influence and change the outcomes. Similar to customer satisfaction this criterion will also be somewhat subjective. Achievement of the target of each proposed indicator should be categorised as likely reflecting high, medium or low organisational influence.
5 In practical terms it is commonly the case that the same indicator could be used as a measure of economy or efficiency, and it may be difficult to discern. Do not be concerned with this issue; select the most likely for sorting and ranking purposes being aware that the distinction should not be used to eliminate an indicator from consideration.

PERFOR
CostcollemeasIndichigh acceto ha
DetermiThe nexassistedcombineincludinginfluencefollowingillustrateYES (Y)criteria wcost or b
Diagram
What dproposeeach inunavailainitially s
6 Users of
RMANCE
t benefit ction be suring the
cators that assessme
essible or aave a high,
ine rating xt step willd by sugges the ‘SMg whethered by theg examplee applicatio) or NO (Nwith a (Ý) benefit.
m 2.6 Indic
etermines ed is a sysdicator to
able” to repselected as
the suggested
INFORMA
analysisconsideredratio of thhave very
ent compaalready ava medium o
scores fo be to det
gested scMART’ criter the PI
e organisates using thon of the iN) is requiras well as
cator ratin
whether stematic c
be automport on thes performa
d ‘tool’’ can sim
ATION HAN
: FMPPI d. This ce benefits y high dataared to bailable. Theor low ‘net’
or each indtermine a oring formeria with oachieves tion and w
he 2009 nandicator rared, e.g. ths customer
ng illustrat
an indicaconsideratimatically rae selected ance canno
mply adapt the
NDBOOK
19
criteria (ccriterion us
of the inda collectio
beneficial te cost/ben benefit.
dicator rating sco
mula6 in tother critercommunitwhether cational Deating procehe first liner satisfacti
tion
ator is gooon of seleated. Wheindicator,
ot be meas
e suggested s
cost-effectses the ‘nicators relan costs wotargets baefit of the
re for eacthe templaria to evaly/client/cuost/benefitpartment oedure. Note is an indon, depart
od, averagected key en a perfothis calls i
sured wher
scoring to suit
ive) proponet’ benefative to theould be unased on dindicator s
h of the pate. The uate the pstomer sat has beeof Agricultue that a si
dicator thattmental inf
ge or pooFMPPI cr
ormance rinto questire the data
their needs
CHAPT
oses that fit of the e cost of cnlikely to adata that should be e
roposed inrating me
proposed atisfaction,n consideure’s strateimple judgt meets alfluence an
or? The triteria thatreport station how th
a is unavail
TER 2
cost of indicator
collection. achieve a is easily
estimated
ndicators, echanism indicator, can be
ered. The egic plan
gement of l SMART d a good
echnique t enables tes “data
he PI was lable.

PERFORMANCE INFORMATION HANDBOOK CHAPTER 2
20
2.5.3 Reviewing and selecting indicators At this point all of the proposed indicators collected would have been classified and scored in the PD matrix. The question is how the information will be used as an input into the decision to approve indicators for use in a planning and M&E?
Agree on manageable number of indicators After scoring indicators on the PD matrix, make a preliminary decision on the maximum number of indicators that can be reasonably managed at each level. For example, a department might decide to manage a maximum of approximately 20 executive indicators; some departments/sectors might have fewer. The final selection does not have to comply exactly with the choice of manageability number. A final set of 21 or 22 executive indicators might still be manageable, but there needs to be recognition that in general the greater the number of indicators used the less time is available for monitoring of each, the greater cost of collection and reporting, and the weaker the indicator system. Preference is given to this factor ‘before’ finalising the indicator list so that a decision on number limits is not ‘made to fit’ retrospectively.
Then undertake the following analysis:
Performance dimension sort Sort the data entered into the matrix template by strategy, structure and value ‘slices’ to ascertain the number of indicators in each sub-classification as represented by a PD ‘block’. The number of indicators in each ‘block’ allows for under- or over-measurement to be assessed (refer to section 2.5.1).
Review the Performance dimension classification This can be done numerically or graphically depending on preference. Graphically requires drawing out each structural ‘slice’ of the PD (template is provided as part of the tool) which includes a circle for each type of indicator in the respective ’block’ comprising the ‘slice’. For example, if there are 3 departmental level financial indicators value for the ‘Growth/Employment’ strategy (objective) then that ‘block’ would have 3 circles. Alternatively the number of indicators could be recorded in the template table. This procedure was discussed in section 2.5.1.
The next step would be to review the ‘‘blocks” that do not have an indicator. The question has to be asked whether non-measurement, especially at the organisational level, has major implications. One alternative might be to temporarily elevate a lower level indicator to the strategic level, even though it does not meet the importance criteria. More directly a new indicator may need to be developed, which will take some time.
Next consider whether some aspects of the dimension are being over measured, by having more than one indicator for the same ‘block’. If this is the case consider eliminating or assigning responsibility for the additional indicators with the lowest scores. Maintain a record of indicators eliminated, and decide whether the data is to be collected so that reporting can be continued on an adhoc basis even though not part of the Strategic Plan or MTEF. If this is the case those documents should record the data being collected for this purpose so that users are aware of availability.
Consider the baseline budget indicators proposed by the National Treasury and any MTEF Guidelines issued. It is also important to consider indicators required or

PERFORMANCE INFORMATION HANDBOOK CHAPTER 2
21
prescribed by other stakeholders, e.g. The Presidency, StatsSA or DPSA, although appropriate responsibility level assignment rules would also apply.
Finalise the Performance dimension allocation At this point there would be a reasonably good understanding of the higher quality potential indicators. But this is an iterative process. Before selection can be finalised the reliability and credibility of the datasets, from where the indicators are constructed, should be analysed and evaluated. Chapter 3 deals with these requirements. PI managers may decide, after a detailed analysis of the data, that the ranking of an indicator should be altered; it could either be removed from the final recommendation or replaced temporarily subject to its inclusion in a PI Plan for PI improvement. After this process, it is then appropriate to agree on the final indicators and incorporate these into the strategic plan and budget documents.
Now revisit the output/outcome consideration discussed in box 2.1. Where an outcome indicator is retained even though it may not score well in terms of the indicator rating criteria, it should be highlighted and included within the organisation’s reportable indicators. Due to their nature, such indicators would ordinarily have high prominence.
Especially note that it is not the intention to discard over-measurement indicators (where there are multiple indicators for the same objective and value), within a structure ‘slice’ the first consideration is whether lesser quality indicators should be relegated to a different structure; e.g. managed by a sub-programme manager.
2.6 Step 4: Additional decisions
2.6.1 Sustainability PI Financial, economic and environmental sustainability are common concepts of concern to national, provincial and local governments. The inclusion of sustainability PI concepts in PI Frameworks is therefore encouraged. Financial and economic sustainability is commonly defined in terms of progression toward service delivery goals without the need for large and disruptive changes in revenue policy or risk of economic shocks.
2.6.2 Weighted PI index PI can be a combination of individual indicators combined and presented in various formats, e.g. combining a numerator value such as budget with a non-financial output measure to establish a unit cost. It is important to consider these when the aim is to obtain an overall assessment of departmental or public entity performance. A common occurrence is that within a collection of indicators there are some targets against which performance has been good, some average and some poor. So in that situation, is it possible to make an overall assessment? A PI index weighted according to the relative importance of an individual indicator can be useful for making an overall assessment.
Weighted PI (WPI) involves designing a scoring mechanism where each performance indicator is assigned a weight, and a total weighted score is then calculated. Consistent use of the same individual indicators and weights enables the total score to be compared over time, and even total weighted score targets can be set based on the targets of each performance indicator. It is strongly recommended that any organisation advocating the use of WPI make use of statistical expertise.
PERFORMANCE INFORMATION HANDBOOK CHAPTER 2
22
A simple WPI example appears in section 2.8.
2.7 Step 5: Validation and dissemination of PI Framework The proposed draft PI Framework, including selected indicators and targets, should be discussed with stakeholders in the organisation, as a check on the validity of the decisions taken. Key questions to direct stakeholders would include: Does the PD represent the organisation effectively? Can meaningful targets be set for the indicators? Can quality data be collected cost effectively? Can evidence be kept cost-effectively? Are selected indicators the best possible indicators against objectives, values or
management levels?
Once this internal process is completed, the proposed PI Framework should be incorporated into a draft PI Plan. The draft PI Plan must be subjected to appropriate consultation processes in accordance with the new regulations, including prior approval by the relevant Minister, copies of the proposed PI Plan to the National Treasury and a public consultation period and process. The consultation process is finalised with the publication and dissemination of the approved PI Plan.
2.8 Regulatory and administrative function challenges Indicator development and selection is more difficult where the departmental function is of a policy, strategy, regulatory or administrative nature (and coordination/oversight function).
A simple and often inadequate solution has been to focus on the time element. If a strategy document needed to be developed or a policy written, regardless of the intended real outcome of the strategy or policy, the performance measurement often focussed on ‘was it done by the due date’, often with little consideration as to how the due date relates to the quality of life improvement of South African citizens or even the quality of the document. Schacter (2006) has proposed additional objective criteria to attempt, to produce a measure of performance linked to outcomes, including assessments of: Adequate consultation undertaken Purpose articulation Logic of the advice or report Accuracy and completeness of the underlying evidence Balanced viewpoint presented Range of viable options presented Presentation quality Pragmatic advice
An example assessment, assuming a target set on the basis of a weighted total score is shown below:

PERFORMANCE INFORMATION HANDBOOK CHAPTER 2
23
Table 2.1 Policy/Strategy index example
Deciding on the individual indicators that will be included and their respective weights is not an easy task, most likely needs a Minister or other senior government official who has oversight for the function, or a group of senior officials to undertake such an assessment. A simple weighted and scored questionnaire with a target score would be a substantial improvement on a report of completion due date.
In a number of cases the service delivery function may be performed by another sphere of government which may even be on an agency basis. This challenge has been met elsewhere in the world. Table 2.2 indicates some OECD suggestions for consideration in respect of the ‘regulatory’ function and table 2.3 provides some advice in respect of the administrative function.
Table 2.2 Regulatory performance information
Measuring regulatory activity
“Regulatory activity can be measured by examining the processes for generating new regulations and for managing the stock of existing regulations, as well as by the outcome of these regulations, in terms of their effect on key economic and social sectors” (OECD, 2007b, p7)
Types of regulatory PI
Measuring progress in developing regulatory policies measuring progress in implementing regulatory policies highlighting priority areas for further action demonstrating consistency between regulatory policy actions and
regulatory quality outcomes enhancing the legitimacy and accountability of the regulatory policy by
demonstrating progress raising awareness of regulatory policy issues among regulators (OECD,
2007b, p7) Examples of regulatory PI
Number of individuals trained Public consultation - views expressed, website access Regulatory Impact Analysis (RIA) Number of business licences & permits issued Regulatory policy satisfaction survey Number of new subordinate legislation Coordination across spheres of government (OECD, 2007b – various
pages) Regulatory Impact Analysis (RIA)
“Systematic process of identification and quantification of important benefits and costs likely to flow from adoption of a proposed regulation or a non-regulatory policy option under consideration. May be based on benefit/cost analysis, cost effectiveness analysis, business impact analysis etc” (OECD, 2007b, p101) [Refer Readings Pack].
Policy/strategy rating example Rating 0-10
Weight Total score
Adequate consultation undertaken 8 15% 1.2Purpose articulation 5 10% 0.5Logic of the advice or report 6 15% 0.9Accuracy/completeness - underlying evidence 4 20% 0.8Balanced viewpoint presented 2 10% 0.2Range of viable options presented 7 15% 1.1Presentation quality 10 5% 0.5Pragmatic advice 2 10% 0.2
(Scale: 10 = excellent, 0 = poor) 100% 5.4

PERFORMANCE INFORMATION HANDBOOK CHAPTER 2
24
Table 2.3 Administrative performance information
Measure ‘cost’ Cost per output/unit rate e.g. standard report production Rates of office equipment utilisation Administrative activity (cost per item such as invoice) (Evans and Richardson, 2009)
Measure ‘quality’ Number of administrative errors Number of customer complaints (Evans and Richardson, 2009)
Measure administrative ‘flexibility’
Staff availability (Evans and Richardson, 2009)
Measure ‘speed’ Document turnaround time Transaction processing time (Evans and Richardson, 2009)
Measure ‘reliability’ Reports issued on time (Evans and Richardson, 2009)
Table 2.3 highlights that generally the best available measure of performance for administrative functions is ‘process’ (output) orientated rather than performance outcomes.
Also refer to section 4.2 which includes a discussion on Data Envelope Analysis.

PERFORMANCE INFORMATION HANDBOOK CHAPTER 2
25
Diagram 2.7: Summary of Process
Step 4: Investigate all indicators in PD
Step 1: Gather key indicators usedUndertake indicator scan and list:•Indicators used in Strategic Plan and Annual Report•Indicators used in ENE•Other key indicators used internally•All indicators required by external role players
Step 2: Classify in Performance Dimensions (PDs) See Chapter 2 for guidance on designing a PD Template)
Step 3: For each indicator check whether it is required by external role players
Include identified indicators in draft PI Framework for review during data testing
Include identified indicators in draft PI Framework for review during data testing
Sub-step 4.2: Develop productivity value indicators for the objectives that are not covered
Sub-step 4.1: Is there at least one productivity (success) indicator that measures achievement in each listed organisational objective in the PD cube.
yes
yes
Step 5: Compile draft PI Framework
This draft PI includes all indicators selected in Steps 3, 4.1, 4.2, 4.3 and 4.4
Sub-step 4.4: Develop productivity and efficiency indicators for the programmes that are not covered
Sub-step 4.3: Is there at least one productivity (success) and one efficiency indicator per budget programme.
Include identified indicators in draft PI Framework for review during data testing
yes
Step 6: Undertake data availability test on each indicator
Sub-step 6.1: Determine what financial and non-financial data is required to construct the indicator, in which format and how frequently.
Sub-step 6.2: Is the data available? Include indicator in 2nd draft PI Framework
Determine proxy indicator
Inform external role player of use of proxy indicator.
Substep 6.4: Is there a proxy indicator for which data is available that can be used? Include indicator
in 2nd draft PI Framework
Sub-step 6.3: Is the indicator required by an external role-player?
Include proxy indicator in 2nd
draft Core PI Framework
Step 7: Compile 2nd Draft PI Framework
For each indicator in the Framework complete PI Rating and Scoring as set out in Chapter 2. Does the indicator score well on the SMART test?
Develop strategy to collect data for original indicator. Is the strategy feasible and cost-effective?
Develop strategy to collect data original indicator. Is strategy feasible and cost effective?
Step 9: Complete PI Framework
Best possible coverage of PI requirements
Data for all indicators are available
Indicators pass SMART test
Select new indicator and restart at step 6. If no indicator can be found, include data collection for best SMART score indicator in Step 8
yes
yes
no
Step 8: Include implementation of strategy as urgent in PI Plan
If data collection strategies include surveys or indiciesensure that statistical expertise is used in design
yes
Negotiate new indicator for which data is available with external role player and include in Core PI Framework
no
no
yesno
no
no
no
yes
no
yes
After following the proposed process, organisations will have: A set of core indicators (a core PI Framework) in which each indicator is classified
against the objective, organisational structure and value performance dimensions; is described fully in terms of data collection responsibility and with a clear description on how the indicator will be calculated.
A set of priority actions for the immediate further development of its PI System, for inclusion in its PI Plan.
PERFORMANCE INFORMATION HANDBOOK CHAPTER 3
26
3 CHAPTER 3 ENSURING QUALITY PI DATA
3.1 Introduction The quality of performance information is a function of the quality and appropriateness of the indicator selected and the quality of the data used to calculate the indicator.
Levels of PI data: The chapter acknowledges that generally PI data comprises at least two layers of records, which exist at different levels for the purposes of PI management. At the first level are all the PI source records and datasets. This refers to the records
that are generated in the implementation of an organisation’s programmes: patient records, case files, logs of water quality tests, delivery receipts of school meals delivered, the application file of an ID book applicant. These are the original records which often comprise the evidence for verifying PI source data. These underlying records are counted, either manually or electronically, to form source datasets (e.g. number of malaria cases reported, number of water quality tests, number of primary school children provided with a meal at school daily, average number of days taken to issue an ID book).
The values in these source datasets in respect of selected indicators are recorded at predetermined moments in time e.g. at the end of each month, to form a PI record. PI records form the second level of PI data.
Information at both levels needs to be collected in line with data quality standards and maintained to ensure authenticity, reliability, integrity and usefulness.
This chapter provides tools to assess the quality of systems that generate, collect and maintain records at both levels, thereby to assess the quality of the datasets themselves.
PI datasets: A dataset is compiled from a series of records bundled together in terms of specific classification criteria (e.g. number of ID books issued within a predetermined number of days). A record in turn can be defined as the proof that a business or administrative process was transacted. A PI source dataset refers to the series of administrative records, survey records or
demographic, economic and social statistics used in order to calculate and arrive at the values in the PI dataset.
A PI dataset refers to a PI record series that results from calculating the same indicator for more than one time period.
Types of PI source data: Indicators are informed by different types of data, as illustrated in table 3.1. Approaches to achieve acceptable data standards differ between data types. Commonly three types of data sources are used in programme performance indicators: administrative records, surveys undertaken by public sector organisations and national social, economic and demographic statistics.
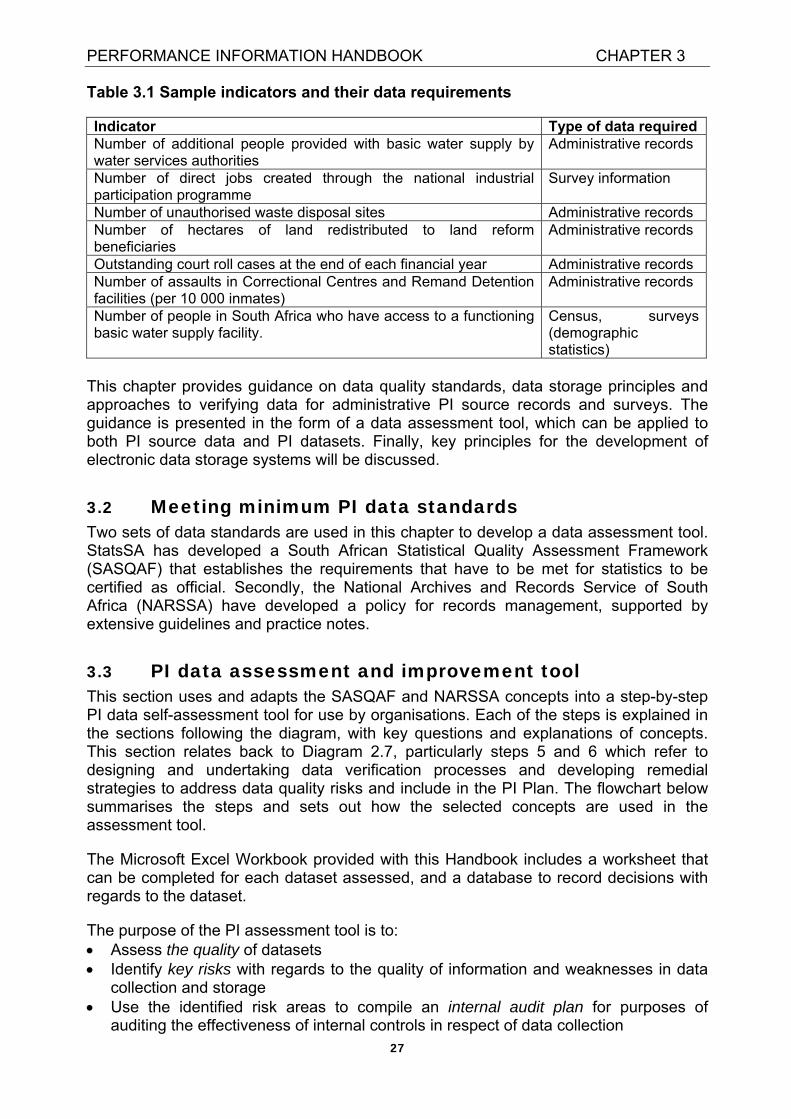
PERFORMANCE INFORMATION HANDBOOK CHAPTER 3
27
Table 3.1 Sample indicators and their data requirements
Indicator Type of data required Number of additional people provided with basic water supply by water services authorities
Administrative records
Number of direct jobs created through the national industrial participation programme
Survey information
Number of unauthorised waste disposal sites Administrative records Number of hectares of land redistributed to land reform beneficiaries
Administrative records
Outstanding court roll cases at the end of each financial year Administrative records Number of assaults in Correctional Centres and Remand Detention facilities (per 10 000 inmates)
Administrative records
Number of people in South Africa who have access to a functioning basic water supply facility.
Census, surveys (demographic statistics)
This chapter provides guidance on data quality standards, data storage principles and approaches to verifying data for administrative PI source records and surveys. The guidance is presented in the form of a data assessment tool, which can be applied to both PI source data and PI datasets. Finally, key principles for the development of electronic data storage systems will be discussed.
3.2 Meeting minimum PI data standards Two sets of data standards are used in this chapter to develop a data assessment tool. StatsSA has developed a South African Statistical Quality Assessment Framework (SASQAF) that establishes the requirements that have to be met for statistics to be certified as official. Secondly, the National Archives and Records Service of South Africa (NARSSA) have developed a policy for records management, supported by extensive guidelines and practice notes.
3.3 PI data assessment and improvement tool This section uses and adapts the SASQAF and NARSSA concepts into a step-by-step PI data self-assessment tool for use by organisations. Each of the steps is explained in the sections following the diagram, with key questions and explanations of concepts. This section relates back to Diagram 2.7, particularly steps 5 and 6 which refer to designing and undertaking data verification processes and developing remedial strategies to address data quality risks and include in the PI Plan. The flowchart below summarises the steps and sets out how the selected concepts are used in the assessment tool.
The Microsoft Excel Workbook provided with this Handbook includes a worksheet that can be completed for each dataset assessed, and a database to record decisions with regards to the dataset.
The purpose of the PI assessment tool is to: Assess the quality of datasets Identify key risks with regards to the quality of information and weaknesses in data
collection and storage Use the identified risk areas to compile an internal audit plan for purposes of
auditing the effectiveness of internal controls in respect of data collection

PERFORMANCE INFORMATION HANDBOOK CHAPTER 3
28
Use the identified weaknesses in data collection and storage systems to develop corrective action and contribute to the PI Plan.
Diagram 3.1: Data quality assessment and improvement tool flowchart
Step 1: Identify and classify PI source datasets; undertake PI source data audit
Step 2: Ensure quality data from external agencies•Are they certified/appropriately qualified?•Is metadata included?•When data series from an external data source are used, are they checked for consistency with organisational datasets?
Step 3: Assess accuracy of internally collected data
Identify risks
SurveysMeasures of sampling errors; measures of non-sampling errors;
frame coverage errors; measurement errors; processing errors; model assumption errors; non response errors; frame maintenance; follow up surveys; analysis of alternate data sources
Most importantly, was expertise available?
Administrative dataIs a comprehensive data policy in place? Is there compliance with the data policy?What access do people with a stake in the PI have?Level of key staff awareness of data policy?Did PI data audit show records to be accurate?
Identify risky datasets
Include risk areas in PI verification processes and/or in internal audit programme
Step 4: Assessing survey and administrative data for timeliness, interpretability and accessibility, coherence and integrity
TimelinessIs the data reference period aligned with the PI period; Is dataavailable punctually; Can PI be updated as required?
InterpretabilityIs metadata available for each dataset, is the PI Manual available, can and does the organisation certify accuracy of PI data, set out features that affect its quality?
AccessibilityCan survey and administrative data be accessed in a variety of formats, are surveys and admin records catalogued transparently,are access restrictions documented, can data users access support?
CoherenceAre common frameworks, concepts, definitions, classifications and methodologies agreed, documented and used within and across datasets; are data series consistent and reconcilable over time, aredepartures from common sources identified;
Identify risky datasets
Step 5: Design and undertake data verification processes
Step 6: Develop remedial strategies to address data quality risks and include in PI Plan
Completion of the data assessment tool will provide (i) description of PI data sets; (ii) identification of key weaknesses (iii) description of verification processes and (iv) strategies for remedial action for inclusion in PIP.
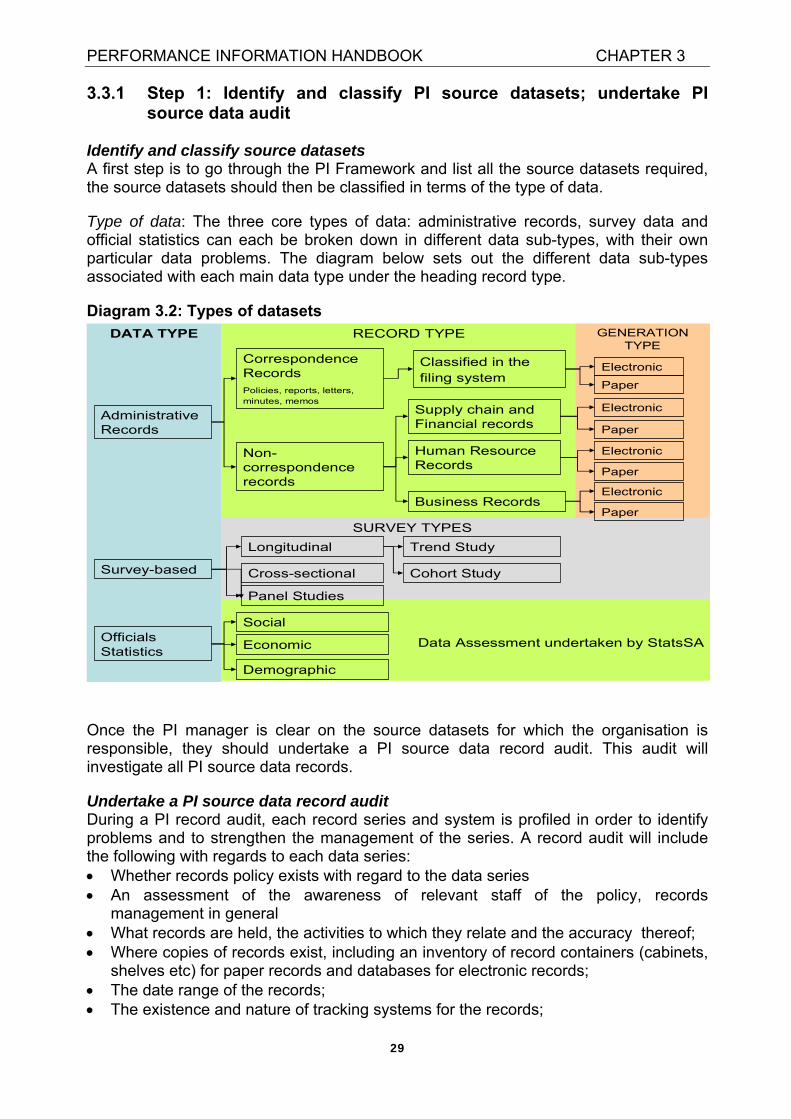
PERFORMANCE INFORMATION HANDBOOK CHAPTER 3
29
3.3.1 Step 1: Identify and classify PI source datasets; undertake PI source data audit
Identify and classify source datasets A first step is to go through the PI Framework and list all the source datasets required, the source datasets should then be classified in terms of the type of data.
Type of data: The three core types of data: administrative records, survey data and official statistics can each be broken down in different data sub-types, with their own particular data problems. The diagram below sets out the different data sub-types associated with each main data type under the heading record type.
Diagram 3.2: Types of datasets
Data Assessment undertaken by StatsSA
GENERATION TYPE
RECORD TYPE
SURVEY TYPES
DATA TYPE
Administrative Records
Survey-based
Officials Statistics
Supply chain and Financial records
Human Resource Records
Business Records
Correspondence RecordsPolicies, reports, letters, minutes, memos
Non-correspondence records
Classified in the filing system
Electronic
Paper
Electronic
Paper
Electronic
Paper
Electronic
Paper
Social
Economic
Demographic
Longitudinal
Cross-sectional
Trend Study
Panel Studies
Cohort Study
Once the PI manager is clear on the source datasets for which the organisation is responsible, they should undertake a PI source data record audit. This audit will investigate all PI source data records.
Undertake a PI source data record audit During a PI record audit, each record series and system is profiled in order to identify problems and to strengthen the management of the series. A record audit will include the following with regards to each data series: Whether records policy exists with regard to the data series An assessment of the awareness of relevant staff of the policy, records
management in general What records are held, the activities to which they relate and the accuracy thereof; Where copies of records exist, including an inventory of record containers (cabinets,
shelves etc) for paper records and databases for electronic records; The date range of the records; The existence and nature of tracking systems for the records;

PERFORMANCE INFORMATION HANDBOOK CHAPTER 3
30
The current records management system and competence levels of records management staff;
An inventory of records documentation (catalogues, file lists, indices, etc); A PI source data record audit will help the PI manager to develop an understanding of the organisation’s record keeping strengths and weaknesses and particular issues with regards to data series required to calculate PI indicators.
3.3.2 Step 2: Ensure quality data from external agencies
To qualify the accuracy of data means to alert users to any features of data collection or storage that may affect the quality of the data. With regards to data sourced from other organisations for use in a PI Framework, the Data Quality Assessment Tool only requires that organisations ensure that the providing organisation has certified the data as accurate, or note any qualifications provided when the data is utilised.
Data can either be collected by another organisation or by an external agency on behalf of the department. However an organisation is deemed responsible for data collection when it is finally accountable for that data. If an agency collects the data on behalf of the organisation, the agency running the taxi recapitalisation programme on behalf of the Department of Transport, for example, it is still deemed to be internal data to the Department of Transport. However, if the required data is collected by another organisation not directly connected to the information, for example the Department of Tourism, then the Department of Transport cannot be held accountable for the quality of the data, it is deemed to be collected by an external “agency”.
In addition, if an organisation requires data from an external agency for its own PI purposes it is recommended that a memorandum of understanding is entered with the external agency specifying: The data that is required including metadata which is often called “data about data”.
Metadata requires structured information that describes, explains, locates, or otherwise makes it easier to use or interpret an information resource.
The frequency of data provision The format in which data will be provided Responsibility for data provision in the providing agency Such a memorandum of understanding will ensure that data sharing procedures and coordination among data producing agencies are specified clearly and adhered to.
Finally, the agency using the data should ensure that there is coherence between internal and external data (see section below on coherence of data).
3.3.3 Step 3: Assess the accuracy of internally collected data
Assess internally collected survey data for accuracy Types of surveys: Simple surveys are used when an organisation polls its comprising units or a limited number of external organisations in full (i.e. not using random sampling) in order to collect comprehensive data. An example of such a survey is when the Department of Sport and Recreation polls all sports bodies on the demographics of national sports teams. These kinds of surveys do not incur sampling and other statistical errors.

PERFORMANCE INFORMATION HANDBOOK CHAPTER 3
31
Statistical surveys comprise the systematic collection of information about a group using random sampling in order to describe the total target group in relation to one or more characteristics. Often surveys used in performance information are statistical in nature and have the following elements in common: The information is gathered by asking people questions Information is collected from a sub-set, in other words a sample of the total target
group to be described, rather than the entire target group. There are different statistical survey types. Many surveys done for the purpose of performance information are a mix of cross-sectional and longitudinal surveys.
Cross-sectional surveys: Cross sectional surveys collect data on a group at a specific point in time. Typical cross-sectional surveys will investigate the relationships between one or more segments of the group. Cross sectional surveys involve one time period and different observation points. Examples are a survey of how citizens experience different Home Affairs service points at one point in time and a survey that investigates how many households have access to education services against their income levels at one point in time.
Longitudinal surveys: Longitudinal surveys undertake the same survey more than once in order to compare results between surveys or to strengthen the reliability of results. There are different types of longitudinal surveys. While samples are of the same group profile (e.g. matriculants), they are typically
not composed of the same people being interviewed in different time periods. A cohort study tracks changes over time among the same cohort (the same people).
An example is a study that tracks the numeracy of learners who entered the schooling system in a specific year.
Panel surveys: A panel survey is a cross-section study (e.g. across a number of countries, business units or departments) or group of people who are surveyed periodically over a given period of time. A panel survey studies the behaviour of these people or units over time. An example would be how many households in two provinces who have family members who are enrolled in tertiary institutions, measured yearly between 1994 and 2010. Assessing survey data for accuracy: The pursuit of quality survey information is equal to the effort to minimise errors, or deviations between the ‘true’ value of the characteristic in the group that is being studied and the value returned through the survey. The questions asked in the questionnaire, how the answers are collected and who answers the questions can all affect the quality of the survey information. Survey methodology provides a mechanism to ensure that statistical errors are minimised and sampling and non-sampling errors are measured correctly. The table below sets out key questions organisations can ask to ensure that their survey data is reliable:

PERFORMANCE INFORMATION HANDBOOK CHAPTER 3
32
Key questions to assess accuracy of survey data 1. Are measures of sampling errors calculated and are the returned values within
acceptable standards? Sampling error measures: standard error, coefficient of variation, confidence interval, mean square error.
2. Are non-sampling errors assessed to determine the extent of bias introduced? Frame coverage errors (under and over coverage); duplication in frame used to conduct a survey; the number of statistical units that are unintelligible; misclassification errors and systematic errors
3. Are measurement errors assessed? Questionnaire design effects; data collection mode effects; interviewer effects; respondent effects; question bias
4. Are processing errors assessed? Data entry error rates; coding errors; editing failure rates; imputation rates
5. Are model assumption errors assessed? 6. Are non-response errors assessed?
Overall response rate; Item response rate; Unit non-response rates; Are the register/frame maintenance procedures adequate for surveys?
7. Is a regular follow-up survey conducted based on a sample drawn from the records and does it match the frequency of data releases?
8. Is an analysis of alternate data sources conducted to determine the cause, extent and type of errors in the framework used?
Assessing data drawn from administrative records for accuracy The component of the data assessment tool aimed at assessing the accuracy of administrative records uses key aspects of NARSSA’s record policies that are designed to deliver authentic and reliable records of which the integrity is ensured. Its use of these aspects is premised on the principle that good underlying system arrangements will ensure accurate records. Key questions to assess the accuracy of administrative data for each PI source record set: 1. Does the organisation have a data policy in place that sets the following key
parameters for the PI administrative records?- - Where the records are kept - Who has control of the records - What format they should be kept in (e.g. paper, electronic) - What measures should be in place for their security, particularly with regards
to control over access and removal from their designated storage, prevention of unauthorised access, protection against alteration or deletion
- The audit trail with regards to each dataset. 2. Did the record audit reveal compliance with the data policy? What level of
compliance is in place? 3. What access do individuals have to data that are relevant to the performance of
their units or themselves? Under what conditions do they have access and are these conditions known?
4. Are key staff members aware of the records policy and the specifications with regards to the records that are relevant to their tasks?
5. Based on the PI Record Audit, do records reflect accurately the events and transactions to which they relate?

PERFORMANCE INFORMATION HANDBOOK CHAPTER 3
33
Data quality will be supported if, when designing an indicator and developing its metadata for the PI Plan and PI Manual (the internal organisation guide on PI), the organisation indicates what evidence should be kept at site level to verify the existence and accuracy of the underlying records supported PI. However, when first drafting a PI Framework and undergoing a data assessment, the processes of the first PI record audit can be used to identify evidence that is kept already and identify evidence gaps. After the completion of the record audit a list of evidence against each indicator can be developed, listing existing evidence and new evidence that should be kept.
3.3.4 Step 4: Assessing survey and administrative data for the timeliness, interoperability and accessibility, and coherence and integrity
Assessing data for timeliness: Key questions to assess the timeliness of data: 1. Taking into account the timing of the PI period and the underlying event in the
case of administrative records or the survey in the case of survey data, (i) does the data relate to the PI reporting period; (ii) is the information still meaningful with regards to the PI reported period?
2. Is the data collected frequently enough to update the indicator as required? 3. Will the data be available at the same time for every PI period?
Interpretability: Organisations should include metadata on each indicator and dataset used to calculate indicators in the organisational PI Manual to inform users and guide their usage of the PI. Metadata on indicators and underlying PI source datasets should:
For PI indicators include the metadata as set out in Chapter 2 of this Handbook. For internal administrative and survey data include the concepts, definitions,
classification and methodologies used in collecting and processing data. This is particularly important for administrative records that are organisation-specific and not managed or controlled through transversal standards (such as public sector accounting standards) and IT systems such as PERSAL and BAS.
Certify or alternatively qualify the accuracy of internal data and qualify indicators using external data that was not certified as accurate.
For data received from other organisations include the name of the organisation and a short description of the dataset. Responsibility for making the metadata on datasets transparent rests with the collecting organisation.
Accessibility: Standards of accessibility require that the data required to report on PI indicators is available to the manager(s) of an indicator and the users of the indicator. This will ensure that the indicator can be calculated and that further analysis can be undertaken. The data should be available on time and in the format that is required.

PERFORMANCE INFORMATION HANDBOOK CHAPTER 3
34
Key questions to assess the accessibility of data: 1. Are the arrangements in place to access survey and administrative data,
automatically or on request? 2. Is the data accessible in a variety of formats that satisfy the requirements of the
manager of the indicator and other users? 3. Are surveys and administrative records and their available data catalogued and
are the catalogues available? 4. Are rules regarding the restricted availability of administrative records well
described and documented? 5. Can the users of the data access any user support services?
Coherence: If common concepts, definitions, variables and classifications are not used across indicators and source datasets, departures from the norm should be identified in the metadata. Key questions to assess the coherence of PI source datasets: 1. Is data within a survey data series and all administrative systems based on
common frameworks with regards to concepts, definitions, classifications and methodologies?
2. Is data across comparable series or across administrative data series based on common timeframes, common identifiers (units, concepts, definitions and classifications?
3. Can departures within and between series or over time be identified in the metadata?
4. When data series from an external data source used, are they checked for consistency with organisational datasets?
3.3.5 Step 5: Design and undertake data verification process The completion of a data assessment using the questions set out above allows the PI manager to identify datasets that are risky and that should be subjected to verification checks and/or an internal audit.
3.4 Verifying PI source data and the role of internal audit Ensuring that accurate data is used to calculate indicators is a key task of the unit that manages an organisation’s PI and/or managers of specific indicators. Organisations carry the risk that the rules to ensure the authenticity, reliability and integrity of records and systems used to extract data from primary records, are not followed. Organisations should follow a three-pronged approach to address this risk:
1) The internal audit function, under direction of the audit committee, must include in their annual audit plans reviews of the effectiveness of internal controls with regards to records management and performance information. The annual risk assessment undertaken by the accounting officer must identify the emerging risks with regards to records management and performance information, which will guide the aspects that should be included in the audit plan. This risk assessment can draw on the results of the PI source data assessment set out above.

PERFORMANCE INFORMATION HANDBOOK CHAPTER 3
35
2) The collection and storage of performance information should routinely include basic accuracy, validity and completeness checks, such as ensuring that the data submitted is internally consistent with previous data submissions, or that data is verified by a level of the organisation or a third party that is either close to the operations of the related information or maintains an independent set of records (for example Provincial Treasuries in the case of the quarterly monitoring system indicators). If electronic data capturing systems are used, procedures should be built in to prevent capturing errors and to support data completeness and accuracy.
3) The official and unit tasked with responsibility for PI should draw up an annual plan, within the context of the PI Plan – to schedule the verification of PI-relevant records and PI which have been identified as risky using the data assessment tool. The section below discusses approaches to data verification.
3.4.1 Verifying PI Data For each record type, data verification will involve techniques that are very similar to audit techniques. Notwithstanding the type of record, the verification process involves the selection of a sample of reported PI data points within a dataset, and for the sample checking whether (i) the records exist and (ii) are authentic and reliable representations of the actual transaction or event. The evidence that will be required will differ from indicator to indicator. For correspondence records verification requires tracking the documentation and its
proper management within organisational processes. For example, for the production of a policy document it requires checking that the document exists as is purported and that there is primary evidence that the document was adopted within the organisation, through checking signatures on the document tracking system and whether the minutes of meetings have been signed off.
For non-correspondence records, verification requires that a sample of data points are matched to records and that the records are matched with other evidence kept by the organisation of the event or transaction or with external data sources.
The table below sets out a few examples of possible data verification activities against specific indicators: Indicators, datasets and appropriate evidence Indicator Data series and records Data audit evidence Number of beneficiaries of an animal husbandry training programme for emerging farmers
Administrative records of beneficiaries Evidence of beneficiaries status
Existence of list of beneficiary names and identity numbers Existence and accuracy of application records of sample of individual beneficiaries
Production and adoption of a policy document
Correspondence records of organisation
Existence of document in appropriate filing system Signatures on document tracking system Signed minutes of meeting to adopt policy document
Number of additional people provided with basic water supply by water services
Correspondence records of reports from consulting engineers to Water Affairs Administrative records
Existence of report and accuracy or recorded data Existence and accuracy of primary records of water connections provided Data correlates with municipal reports

PERFORMANCE INFORMATION HANDBOOK CHAPTER 3
36
authorities of consulting engineers
Number of hectares of land redistributed to land reform beneficiaries
Beneficiary records Case files
List of beneficiaries and identity numbers, hectares distributed to each Existence and accuracy of underlying sample of case files for each of the individual beneficiaries
Outstanding cases on the court roll at end of each financial year
Court roll data Case files
Consistency of flow statistics for court cases Existence of a sample of paper case files and accuracy of electronic records of case files
Number of malaria cases
Clinic and hospital records
Availability of a list of sites and malaria cases per site Match of site records against the overall number of malaria cases reported
Where achievement against an indicator is signalled by a reduction in the number of records that qualify for inclusion in the sum of records, an additional risk arises namely that individual records have been left off or deleted from a database, or removed from or not deposited in a paper record registry. The reliability of records in such cases depends heavily on the quality of internal controls to ensure that all records are processed appropriately. PI managers can in addition select a sample of sites for an individually designed audit process to ensure that records are complete. Recording match rates Match rates between the record and PI on the underlying event or transaction is a key indicator of the quality of performance data and of the need for remedial action. Three rates are important to calculate:
1) Match rate as a percentage of the total records 2) The proportion of false negative matches in total false matches (the record
did not exist) 3) The proportion of false positive matches (the record matched, but incorrectly
or related to a different organisation) Organisations can track improvements in the quality of their data over time through the use of match rates from periodic PI data audits.
3.4.2 Step 6: Develop remedial strategies to address data quality risks and include in PI plan
During the development or updating of the organisational PI Plan, the organisation should use data assessments, data verification processes and the internal audit findings on PI source datasets to design strategies to address data collection and data storage risks and include the strategies systematically in the PI Plan. This will be elaborated on in coming chapters.
3.5 Developing strategies to store PI This section addresses the assessment and development of systems, manual or electronic, to store PI information once it has been extracted from the underlying record systems and collated into PI data.

PERFORMANCE INFORMATION HANDBOOK CHAPTER 3
37
It is recommended that organisations assess systems to collect, store and access PI datasets using the data assessment and improvement tool provided above and use the results to improve their PI data systems.
Key issues to emphasise are that a PI data system should: Have transparent rules and systems for the calculation of PI data to ensure data
consistency; Have clear rules with regards to the format (electronic or paper based) of PI data; Have clear record management rules with regards to the location of PI data: in other
words specify the localities, offices, electronic systems, hard drives, directories and sub-directories where data is kept;
Specify under whose control master PI files are kept; Have clear rules for corrections and adjustments: one way of approaching the issue
is to allow for data to be recorded first as preliminary data, which can be adjusted and is finalised with a next data submission;
Have clear rules on how often PI is refreshed from the underlying source data series, compiled and stored as PI records. Back up versions of PI should be accessible to users in the organisation, either continuously or on request. For organisations where PI is kept in spreadsheets or other electronic forms that are updated manually, an electronic or paper copy of the record(s) should be created at pre-set points and stored appropriately;
Ensure audit trails are created of access to and alteration of PI data; Have the underlying data with its metadata available in the PI System or secure links
to the underlying data.
3.6 The development of electronic record and PI systems Most records management systems are a hybrid of paper-based and electronic records and the degree to which an organisation makes use of the latter is constantly evolving.
Key considerations for the development of electronic PI management solutions are7:
Before setting out in the development of an IT solution, current record keeping practices should be evaluated against national and international standards: Problems arise on account of poor underlying business process design or poor compliance with required processes. Implementing an IT solution is unlikely to solve these problems unless thorough account is taken ex ante of the poor practices that currently exist and drive data problems. IT management projects should be developed with improved records management practices and culture as the ultimate goal: The IT aspects of an electronic solution project might be the easiest part. It is the establishment of good records management practices that is the challenge and these are more about changing organisational culture than anything else.
7 Organisations are advised to also consult the NARSSA guidelines for managing electronic records in government.
PERFORMANCE INFORMATION HANDBOOK CHAPTER 3
38
Evaluate existing record creation, collection and storage practices to ensure that they can be applied to electronic records: The development of an electronic system provides the opportunity to redesign business processes to increase reliability and efficiency. Before applying current practices in an electronic environment, it is worthwhile evaluating them and identifying opportunities for improvement. Define user requirements: The PI manager should be integrated into processes to identify the user requirements of the new system. This includes identifying and describing the business process which should be automated, the mapping of process and information flows and the identification of transactions and documentation used in the business process. Ensure that solutions take a long-term view: The PI managers should be driving decisions with regards to whether the system should be an integrated solution for all aspects of PI management, or whether PI needs should be covered by separate systems that interlink. It is important to take a long-term view and ensure that the system is flexible to include future PI management needs. It is also important that the IT system can interface with other systems in the organisation and in government generally. This is important firstly in view of the Presidency’s establishment of a central outcomes framework and its ability to access systems across government to extract data for monitoring purposes. Secondly, at sector level compatible PI and source data systems will facilitate improved intergovernmental sector management. The Minimum Interoperability Standards (MIOS) released by DPSA and set by State Information Technology Agency (SITA) provides government’s technical principles and standards for achieving interoperability and information systems coherence across the public sector. These standards are mandatory and would apply at a minimum to any PI IT system development. Take stock of the paper-based systems that will need to migrate to the new IT system: Not all existing PI or PI source data will need to be included. It is important that PI managers develop a schedule of PI source data and historical information that need to be imported into the new system and where the relevant records are held (and in which format). Evaluate the human skills available to collect and keep records for the new IT system and make clear the roles and responsibilities of actors in the new system: The quality of outputs from the IT system will only be as good as the quality of data captured into the system, albeit at site-level or the transfer of information into a standalone PI IT system. An evaluation of the readiness of existing staff to use new systems against a clear understanding of roles and responsibilities and the implementation of training and capacity building programmes necessary to ensure that the new IT system will improve the quality and efficiency of PI management.
PERFORMANCE INFORMATION HANDBOOK CHAPTER 4
39
4 CHAPTER 4 ANALYSIS AND REPORTING OF PI DATA
4.1 Introduction The chapter is structured to include advice on different techniques to analyse PI data and on the use of PI at different points in the budget cycle.
4.2 Analysis tools/techniques This section introduces techniques that can be used to compare performance across indicators (i) within the same unit over time or (ii) between units or (iii) both. Analysis of indicators should be done once the indicators have been developed and assessment of the quality, accuracy and completeness has been done. Discussed techniques are:
Basic comparative analysis
Benchmarking
Rating and Scoring
PI Integration
PI should be used in management with care. Box 4.1 illustrates how important it is that PI management is not ‘blindly’ applied, but that ‘underlying’ causes be evaluated to ensure that the PI result is credible.
Box 4.1 Mini-cases: Underlying causes of performance results
Example 1: Schools have been known to encourage parents to enrol students in a particular school based on the fact that no student had ever failed in the final year, but what parents are not told is that the underperformers are identified during the year and ‘encouraged’ to improve their performance.
Example 2: It needs to be recognised that an area with a higher rate of particular serious illness prevalence, such as HIV, is likely to have medical facilities experiencing higher mortality rates than in areas with lesser rates of infection.
The ‘measurement’ process has also been found to be a ‘cause’ of the PI result, where it becomes known that an assessment of performance will be undertaken in a particular week of the year, special arrangements are made for high levels of performance to occur during that week.
It is important to always analyse lower level and other related performance results in conjunction with the results one is seeking to explain.
4.2.1 Basic comparative analysis PI managers can provide several analyses to help the organisation and its stakeholders to interpret the information, for example Measure change: show percentage increase or decrease in performance for
example from the previous time period measured; from the average performance of a number of previous time periods; from performance in the same period in the previous year.
Measure deviation: explain percentage shortfall/’surplus’ in performance against the target set for the indicator; against average performance of similar units; against performance of a top-performing unit..

PERFORMANCE INFORMATION HANDBOOK CHAPTER 4
40
Provide a graphic analysis: plot performance against the indicator over periods of time on a graph; plot deviation from target over time on a graph; plot measurements of the change in performance between one period and another over time on a graph.
Develop ratios: many PI Framework indicators may already be expressed as ratios or percentages (for example number of assaults per 100 000 inmates). Many however are provided as absolute numbers (for example number of malaria cases reported). In addition to comparing performance for these indicators against previous time periods, targets or other organisational units, PI managers can also make absolute number indicators more meaningful by relating them to contextually important data, for example the number of malaria cases per 100 000 people, when preparing reports. Section 4.2.4 below briefly discusses how integrating PI (i.e. developing ratios using different indicators) can be useful for the interpretation.
Present data as indices: select a meaningful value for an indicator (for example target performance; average performance; highest performance or lowest performance) and express comparable values as an index in relation to the meaningful value, e.g. inflation.
4.2.2 Benchmarking Benchmarking involves measuring the organisation in terms of the best practice within the industry. This is important in assessing if the organisation‘s performance is in par with what is expected in the sector or area of operation. Benchmarking identifies a realistic sense of the capability of the organisation.
One of the difficulties for the public sector is identifying best practice, and it has been acknowledged that “it is difficult to produce reliable data that enable accurate international comparisons” (OECD, 2007, p63).
But there are also public sector advantages in seeking to compare, such as the ability to benchmark within government by identifying best practice functions in one department that can be used as a benchmark for other departments.
Organisations can also choose to benchmark their performance informally, in other words select areas of comparison with other organisations or between units internally that are relevant to the activities and performance of the organisation. Even for informal benchmarking, it is useful to know at the time of indicator selection what benchmarking will be undertaken in order to ensure that indicators are consistent as a basis of comparison between units or organisations.
4.2.3 Scoring & rating There are at least two uses of a ‘scoring and rating’ approach for performance information. Firstly an organisation can choose to compare the performance between different units of the same type by scoring them against common indicators and rating their relative performance. The second is a narrower application where ‘scoring and rating’ involves the use of a scoring/rating system to indirectly assess data. The scorer assigns the PI values from a given definition (e.g. on a scale of 1 to 10, 10 being the best). Details of the two approaches are discussed below:

PERFORMANCE INFORMATION HANDBOOK CHAPTER 4
41
Scoring and rating similar units In this approach the performance of individual units are scored and rated against common criteria in order to monitor their performance and encourage improvement. A first principle of developing such a system is that the rules of comparison, in other words the tool that is developed, should be fair. Such a tool should:
Compare ‘like’ with ‘like’: only units with identical service delivery responsibilities should be compared.
Take account of differences between units: even when units have exactly the same service delivery responsibilities, their operating circumstances might differ. A police station in the Northern Cape which covers an area of several hundred square kilometres for example, cannot have the same average response time to emergency calls as a station in Gauteng. Weighting scores should be developed, i.e. a set of weighting principles that will allow the scores of the police station in the Northern Cape to be compared fairly and sensibly to the scores of the police station in Gauteng.
Use data that is reliable across units: in cases where data was consistently reliable across units before the introduction of the tool, systematic comparison between units creates the incentive for unit managers to ‘game the system’. The introduction of such a tool therefore has to be accompanied by rigorous data assessment and routine data verification checks on units (see Chapter 3 for approaches to ensuring data quality).
Target and assess improvement in performance against the unit’s own previous performance as well as against system-wide performance. The wider the differences between the performances of different units the more important it is to have several types of indicators to target and assess performance. For example, if the assessment focuses only on improvement against previous performance, units that routinely perform close to 100% achievement will seem comparatively worse in effecting improvements than units that improved by 20 to 30% from a lower base (an initially bad performance).
The comparison of units with a scoring and rating tool can be used to identify units that are in need of support or where corrective measures are required, or to incentivise and award relative good performance. The tool can also be used to identify twinning arrangements where a better performing unit can be partnered and used to improve the performance of a lagging unit of a similar nature and in similar circumstances within selected performance bands8.
It is important that a scoring and rating tool is well documented. A technical document is essential that describes the tool and how the ratings should be interpreted. Buy-in by the service delivery units being measured and their involvement in its design will prevent perceptions of unfair rating and increase the effectiveness of the tool.
Scoring and rating data (Indirectly) Scoring and rating data can be used in the form of a ‘proxy’ indicator where performance cannot be directly measured, and a scoring/rating system can be used as an indirect measure of the data. A commonly accepted example and approach is the use of a ‘Likert’ scale. Readers would likely be familiar with the common survey
8 A performance band is commonly used to stratify (distinguish) units to make comparison easier, e.g. emergency response times might be the percent of actual achievement classified within the bands of 0-15 minutes, 16-20 minutes, 21-30 minutes etc.

PERFORMANCE INFORMATION HANDBOOK CHAPTER 4
42
alternatives response of ‘strongly agree’, ‘agree’, ‘neither agree nor disagree’, ‘disagree’ or ‘strongly disagree’. As advised in chapter 3, anyone intending to apply a statistical technique, such as a ‘Likert’ scale, in performance measurement should get expert advice (also refer chapter 6).
4.2.4 PI integration PI integration refers to combining financial and non-financial indicators, or combining more than one PI indicator as part of performance evaluation, to create useful information for decision making. PI integration can take various forms, including:
‘Explaining’ a budget or financial outcomes Input economy ‘unit rate’ indicators e.g. average labour cost Output efficiency ‘unit rate’ indicators e.g. average house construction cost Cost distribution indicators e.g. allocation of corporate overhead costs
proportionally Combining indicators to explain trends and multiple factors that affect outcomes
e.g. compare employment performance with economic growth to understand the impact that each indicator is having on the other and on the overall outcome of a better life for all.
An indicator hierarchy so that a ‘lower level9’ indicator is used to explain ‘higher level’ PI performance, e.g. the higher level indicator might be the crime rate and other indicators such as economic performance and probability of arrest etcetera can be used to explain the value attained in terms of that outcome.
The non-financial information used for determining cost distribution, such as the number of pupils in a provincial school system, is usually referred to as a ‘cost driver’. There are many instances where non-financial information is useful for measuring costs, especially for budget development purposes, but may not qualify as ‘strategic’ PI, e.g. hours worked by staff performing administrative tasks. There are also cost drivers that may not usually be used as ‘strategic’ PI, but because of a change in national priorities may be elevated to a strategic level; e.g. megawatts of electricity consumed or mega litres of water consumed may be important for sub-programme costs, but would become strategic PI related to electricity and water conservation or environmental objectives. A common approach to PI presentation with financial information is discussed in the next section.
4.3 Using PI in the annual budget cycle This section discusses key concepts and principles in developing systems to use PI effectively in the budget cycle.
This is illustrated by the diagram below. Especially note that indicator target setting is closely associated with the budget cycle, and therefore discussed in this chapter, as targets should generally only be developed in relation to consideration of available resources (Section 4.3).
9 The ‘level’ only refers to the place in the organisational hierarchy constructed for the purpose and is not intended to assign a rating or value judgement regarding its importance

PERFORMANCE INFORMATION HANDBOOK CHAPTER 4
43
Diagram 4.1: Use of performance information in the budget cycle
(Chapter 2)(Section 4.3.1) (Section 4.3.2)
(Section 4.3.3) (Section 4.3.3)
Budget preparation
Operational Planning
Budget ImplementationAudit and Annual Reporting
Performance information used to make judgements about allocation of resources
(Section 5.4)
Performance information used to track performance against pre-set targets, to report quarterly and implement corrective action
(Section 5.3)
Performance targetsset against available resources and service delivery circumstances
(Section 5.4.6)
Iterative process
Performance Informationpresented against objectives and targets set in the Strategic Plan
(Section 5.3)
Strategic PlanningSelection of performance indicators for assessment through PI Framework (Chapter 3)
Review and evaluation of current performance feeds into strategic planning
4.3.1 Setting targets Meaningful target setting requires that the level and standard of performance targeted must be affordable. The box below explains the difference between service levels and service standards.
Box 4.4 Service levels and service standards
A service level is the ‘amount’ or type of service that is to be provided, often expressed in quantitative terms e.g. immunise 500 000 individuals in a vaccination campaign.
A service standard refers to the quality of the service to be provided, benchmarked against international standards whilst taking into account South Africa’s current level of development. An example of a service standard is the quality of the vaccination efforts against measles and de-worming- e.g. illness incidences reduce to less than 1000 in a province.
Realism and ‘stretch’: The emphasis on ‘realistic and achievable’ targets should be counterbalanced with an emphasis on ‘stretching’ targets, to improve performance over time. In order to achieve the right balance between ‘realistic, achievable’ and ‘stretch’, target setting processes should not be entirely top-down, nor entirely bottom-up. The current practice in government, targets are often set as part of the strategic plan or budgeting exercise in isolation from the units that are expected to deliver the services in line with target, without a good enough understanding of the baseline performance and of how quickly it can be improved.
PERFORMANCE INFORMATION HANDBOOK CHAPTER 4
44
Box 4.5: Target setting example
A municipality had an internal construction team that built footpaths, commonly using concrete, tar or pavers. The ‘paving’ gang consistently achieved the laying of paving material covering a certain number of square metres per day over a long period of time. It was generally agreed that this work output was ‘realistic and achievable’ as it had been proven. This enabled the Finance department to calculate the budget based on the expected output.
However, due to additional external funding one financial year there would be far more work undertaken than the ‘gang’ could manage, so some contract staff were engaged to assist. The project manager formed the contract staff into a separate team that was located close to the existing ‘gang’, effectively creating competition between permanent and contracted staff.
Consequently the rate of laying paving material for both teams far exceeded the ‘historic’ rate, so much so that all internal and external funds were spent that financial year and many more square meters had been completed using those funds. The project manager had stretched the targets!
Multi-year targets: Best practice financial management demands multi-year financial forecasts and targets. In setting performance targets organisations should not only focus on the budget year ahead but also provide realistic ‘outer-year’ targets.
Target setting must also recognise the ‘power of incremental achievement’, where small steps each year toward an objective over time could compound into a giant step in some future year. Avoid setting unrealistic targets in the short term.
Performance management of individuals: Performance bonuses can have an influence on targets. Where some form of management reward is related to performance, care must be taken to avoid the ‘under-promise or over achieve syndrome’ in setting performance targets.
It is clear that a shift to performance targeting linked to budgets may require a newly structured budgeting process in some organisations: if the strategic plan and budget are to be implemented with the use of performance information, processes to draft these will necessarily be participative and iterative.
4.3.2 Using PI in budget preparation The process of applying non-financial performance information into the ‘budget’ process is generally known internationally as ‘Performance Budgeting’. There seems to be general acceptance that there are 3 levels of PI used in financial planning: Presentational (or performance ‘informed’) - the PI are included in the budget or
MTEF documentation but there is not a direct link between the targets and the funding allocations
Performance-based budgeting - there is systematic use of PI in establishing funding allocations
Formula-based budgeting - at this level there is a consistent direct formula link between PI outcomes and targets and the funding allocation. A good example is what is known as ‘case-mix’ in the health sector, where hospitals negotiate an amount of funds based on the types and number of services and operations they are expected to provide.
Whilst ‘presentational’ PI has been criticised as being ineffective, "simply including information on performance in budget documents is a long way from performance

PERFORMANCE INFORMATION HANDBOOK CHAPTER 4
45
budgeting” (OECD, 2008, p2), it does represent an improvement on a budget only with ‘financial numbers’.
It is important to use PI to inform the allocation process using ‘unit rates’ and target setting combined with the need to assess related performance issues and to make a concluding comprehensive judgement.
Using PI in the allocation process requires the annual review of medium term performance targets and setting targets for the new outer year, linked to resources. In agreeing to targets it is essential to know: what the current baseline performance is, what the trend against the indicator for the past three years has been, what circumstances will influence the demand for services or the achievement of the
target in future, and the level of resources the organisation is prepared to commit to the service. The calculation of unit costs against the target would be an important factor but, the unit costs cannot be applied blindly. There might be opportunities for efficiency savings that allow the unit to deliver more services for less, or particular circumstances in the year ahead might mean that fewer units will be delivered for the same cost.
Budget baselines and unit costs A budget baseline is defined as the “existing level of resources available to continue existing/approved service levels/standards”.
In calculating the relationship between funds provided and target performance it is preferable to obtain, wherever possible, ‘unit cost’ information based on the total cost of the programme assuming specific service standards and levels, and the planned outputs and possibly outcomes (although it is usually much more difficult and complex to cost ‘outcomes’ compared to outputs).
Total cost is defined as the total direct sub-programme resources together with an appropriate allocation of overhead costs that support the sub-programme. Total cost can be determined by the attribution of overheads. For example, Justice & Constitutional Development’s (J&CD) overheads for 2009/10 were estimated as:
These corporate overheads were then attributed to sub-programmes. This would be a 2-step process, with corporate overheads from the Administration programme attributed to all programmes first. Within the programmes, the administration overheads were attributed to sub-programmes. Programme overheads were attributed to the sub-programmes of the specific programme (e.g. Support Services attributed to all sub-programmes of the National Prosecuting Authority Programme). Departmental capital expenditure should normally be excluded from overhead attribution, although
Original Budget
Corporate overheadAdministration 1 162 082 783 Court Services - Facilities Management 145 384 000Court Services - Administration of Courts 1 110 605 600 National Prosecuting Authority - Support Services 400 341 000

PERFORMANCE INFORMATION HANDBOOK CHAPTER 4
46
consideration should be given to including it where the capital items are regularly recurring and of similar budget proportion.
The calculation of unit costs using total sub-programme cost (including costs that are not overhead costs as well) then enables organisations to match total sub-programme budget allocations to targeted performance and vice versa. This can be done initially at a broad level, for example by calculating the cost per house delivered at the current service standard using non-financial and financial performance data (see reporting example in Appendix D. Over time organisations can become far more sophisticated by breaking programmes down into their component activities, establishing activity-based baselines.
4.3.3 Budget Implementation and PI Reporting In addition to reporting on performance against objectives to the executive authority every quarter and to the legislatures annually (in the Annual Report) as required in terms of the Treasury Regulations, each organisation will also develop its own reporting schedules, methodologies and formats – which should be included in the PI Plan and the PI Manual. All performance reporting should adhere to common principles, namely: Information should be presented succinctly (see next sub-section for a proposed
format), A brief narrative explaining deviation from targets should be included, Information should be presented on previous performance in order to allow for
comparison, for example in quarterly reports for the same indicator: the year to date performance, performance over the three previous quarters and the average quarterly performance for the previous year,
Adjusted targets for the forward period should be included in the case of in-year reporting in order to be able to reach the annual target set,
The accuracy, validity and completeness of the data should be certified and/or any qualifications on the accuracy, validity and completeness set out (see Chapter 3 for a discussion on data quality assessment).
Reporting formats Appendix F contains an example of a possible reporting format. The format is also available in a simple Excel spreadsheet template. The format achieves: Performance budgeting ‘informed’ approach, comparing the financial resources
required with the PI targets, Benchmarking information, calculating a unit rate, Illustrative charts that compare budget and PI trends and monthly reporting, Brief explanation of performance trends. A key feature of the example is illustrating the aim of demonstrating all information on the particular PI subject on one page to improve speed of management comprehension.
It is recommended that those in the earlier stages of PI implementation would simplify the reporting by focussing on one indicator per report sheet. However, it is generally found that one indicator alone will not explain the interrelated causes of performance and that, “it is important not to view each indicator in isolation since there may be a clear inter-relationship between individual indicators” (Evans and Richardson, 2009, p16). PI interpretation can be enhanced if related indicators are considered together, preferably on the same page. Reference to the PD classification of indicators will facilitate this grouping of indicators.

PERFORMANCE INFORMATION HANDBOOK CHAPTER 4
47
‘Dashboard’ report Organisations can also develop PI Dashboards at various levels of the organisation for use in periods between the formal quarterly reports.
An accounting officer for example can be provided with a weekly (or monthly) one or two page report providing an analysis of performance against strategically important indicators. The indicators selected for a ‘dashboard report’ would highlight performance issues in time for the accounting officer or senior management to institute remedial action when performance falls below par. The report can make use of the type of analyses described in section 4.2.1 above. Similarly, managers at lower levels can work with PI managers to design a dashboard report relevant to their sub-programmes or units.
External reports drawing on PI Organisations may consider compiling key PI of interest to external stakeholders in organisational reports other than the Annual Report. These reports can merely provide comparable PI data over a selected period or the data can be supplemented with analyses of performance provided by the organisation. The Department of Water Affairs for example publishes a report on the provision of access to water and sanitation annually. The Department of Education is considering publishing a regular report on performance against key sector indicators, drawing on their Education Management Information System and other data sources.

PERFORMANCE INFORMATION HANDBOOK CHAPTER 5
48
5 CHAPTER 5 ASSESSING AND BUILDING PI CAPACITY
5.1 Introduction This chapter provides a checklist of the human resource and system capacity required to implement an effective PI System and provides advice on locating PI capacity and the prioritisation of PI capacity development.
5.2 Capacity requirement checklist The following human resource and system capacity is required for all organisations to be able to successfully develop and implement a PI Plan.
General capacity requirements Administrative time to review and understand handbook requirements, undertake the
development of a medium to long term PI strategy, draft the PI Plan and an organisational PI Manual and coordinate and implement the various activities proposed
Administrative knowledge of all legislation and regulations that impact on PI management and related data management
Computer skills to use the excel tools provided with this Handbook and to develop and use reporting formats using financial and non-financial data
A conducive organisational structure (alignment of Monitoring and Evaluation (M&E) capacity with strategic planning; access of PI managers to accounting officer) and appropriate processes (structured planning, budgeting, monitoring and review processes)
A system (manual and/or electronic) to collect, store and retrieve PI.
Human resource requirements to develop PI Framework Strategic planning knowledge and the ability to align PI to organisational strategy,
necessary for designing the Performance Dimension Template M&E and sector knowledge to categorise, score, select and develop indicators M&E / Audit capacity to identify valid evidence for PI source data Facilitation skills to manage PI development, internal validation and external
consultation processes.
Human resource requirements to assess and improve PI data Organisational knowledge to identify PI source datasets Organisational knowledge, skills and time to undertake data assessment, record
audits and identify risky datasets Administrative time, research skills and organisational knowledge to design and
manage processes to verify performance information Skill to design and maintain PI collection and storage systems Information technology knowledge of PI Systems solutions(if electronic systems are
to be used). Human resource and system requirements to ensure effective use of PI Organisational and M&E knowledge to design systems to use PI and report on PI,
including designing reporting formats Financial management knowledge to align PIs to financial outputs and align
reporting relative to financial outcomes

PERFORMANCE INFORMATION HANDBOOK CHAPTER 5
49
Analytical skill to analyse and interpret PI results Writing skills to produce PI report Administrative time and skills to disseminate PI Framework and PI results to certain
staff groups and other stakeholders User capacity to understand the nature of PI and utilise it effectively in managerial
decision-making.
Specialist skills Access to statistical sampling, survey and other statistical analysis skills If developing a comparative scoring and rating system to compare performance
across units, access to capacity to design and implement the system and support management in the use of the system
Internal audit capacity to undertake audits of data collection and storage
Skills to manage PI capacity development Skills to identify M&E training needs Skills to identify training opportunities for staff and management Time and skills to develop and implement internal PI training programmes. This checklist can be used to undertake an audit of PI capacity and skills in the organisation and develop strategies to address capacity shortfalls. To ensure accuracy and usefulness of PI, it is important that departments build and strengthen internal capacity when it comes to collection, analysis and interpretation of information.
Locating PI capacity in the organisation
Different organisations will set up their PI capacity differently: some may centralise the capacity in an M&E Unit or in the accounting officer’s or Chief Executive’s office, others might prefer putting M&E capacity in each division or region, or some combination of the two. In some departments, the PI capacity is situated in the Strategic Management units.
It is however important to acknowledge that even if PI capacity is decentralised, the PI function will interface with several other functions in the organisation, for example the accounting officer or Chief Executive and senior management; the CFO and budget planning and management unit; the Internal Audit Manager and function; the Information Manager and the IT function; the Communications Officer and function and so forth. It is therefore important that the organisation provides for strong central coordination of the PI function. This coordinating capacity must be placed at a senior level, as is required by the Regulations on Programme Performance Information. Due to fiscal constraints, departments will need to reprioritise funds to establish posts.
5.3 Guidance on priority capacity building activities Building organisational capacity for the management of performance information requires a combination of formal training, internal capacity development initiatives and ‘hands-on’ practice.
PERFORMANCE INFORMATION HANDBOOK CHAPTER 6
50
6 CHAPTER 6 DOCUMENTING PI SYSTEMS
6.1 Introduction The Regulations on Programme Performance Information require departments, constitutional institutions and Public Entities to develop PI Plans. The Plans are required to be a medium term statement to Parliament on what PI the organisation will collect, how it will manage and use the PI and how it intends improving PI. The purpose of the Plans is to ensure the progressive development of PI Systems.
In addition this Handbook advises that organisations should develop an internal PI Manual, which provides an up to date description of the PI System to internal stakeholders.
This chapter provides guidance on the content of and approaches to drafting these two documents.
6.1.1 Performance Information Plans A PI Plan must describe an organisation’s PI System and set out organisational strategies to improve it. A PI System is defined to be: The organisational PI Framework Systems to determine and review the organisational performance information
framework Systems to collect, verify and store the data required for the selected performance
indicators Systems to calculate and interpret the selected performance indicators (that are
strategic) and to analyse, report on and use the resulting performance information in organisational planning, budgeting and management processes.
A PI Plan must also indicate who will manage PI, how it is to be managed and what capacity building the organisation will undertake.
A PI Plan must be submitted every five years with an organisation’s Strategic Plan to Parliament. Organisations can update the PI Plan during the five years if necessary, by submitting an adjusted plan.
Organisations are required to report to Parliament on the implementation of their PI Plan annually through their Annual Report. The Regulations provide for the report to be as simple as a certification by the accounting officer or accounting authority in the Annual Report that the PI Plan has been implemented as planned, or has not, with the reasons provided. This would then form part of what the Auditor General would audit. Organisations can however elaborate on their implementation, or provide reasons for deviation from plan, as required.

PERFORMANCE INFORMATION HANDBOOK CHAPTER 6
51
6.1.2 The organisational PI Manual The organisational PI Manual will contain more detail on the PI System in use than the PI Plan. Its audience is internal and its primary function is as a guide to assist staff to fulfil their roles in the organisation’s management and use of strategic PI. The PI Manual is to be updated regularly and is used as a policy document and capacity building tool within the organisation. Its development is not required in terms of the Regulations and is at the discretion of the organisation.
6.2 Developing a PI Plan The Regulations on Programme Performance Information do not prescribe a template for PI Plans. It is up to organisations to structure their PI Plans in ways that fit their business and structures. The following diagram outlines some aspects of a PI Plan.
Diagram 8.1: Checklist for contents of PI Plan
PI FrameworkIndicators, connected to objectives and programmes, metadata in respect of these
Future development of Framework
Data collection, verification and storage
Description of source data systemsDescription of PI StorageDescription of Verification processesAssessment of data collection, storage verification
Strategies to improve the quality of data by improving source data and PI collection and storage
Analysis, use and reporting
of PI
Describe processes to quality assure calculation of PIDescribe links between PI and budget processes, additional PI uses and internal and external reporting processes and instruments, including quarterly reviews and follow-up if deviation from targets
Strategies to improve
usage of PI, eg
improved reporting,
performance
budgeting
Capacity Building Describe current structures for PI management, evaluate capacity
Strategies to improve capacity
Annexes Strategies, responsibility for their implementationPI Source Data for inclusion in internal audit and verification programmesExternal data requirements
Exemptions Exemptions applied for and date of expiry of exemption(s)
Who is responsible for PI?Designation of responsible individuals. The organisational PI Manager must report directly to the Accounting Officer
Systems for reviewing PI and monitoring PIP Implementation
Frequency and nature of processes by which the organisation
periodically reviews its PI Framework and PI System.
Process to review implementation of PIP
Content requirements Requirement details
The remainder of this section provides a sequenced approach to the development of a PI Plan to cover all content requirements, using the tools provided in the Handbook. Included in the approach is a suggestion for structuring a PI Plan, however, the section suggestions must not be read as the only right PI Plan structure: exactly how a PI Plan is structured is up to the organisation itself.
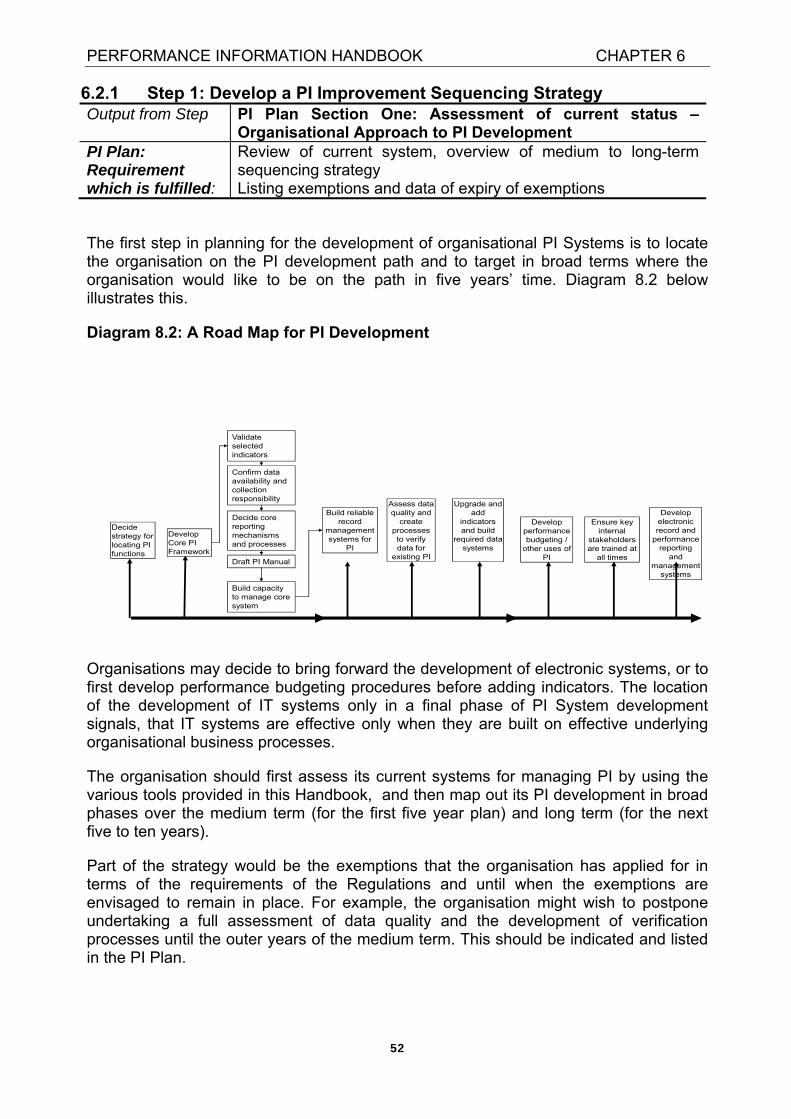
PERFORMANCE INFORMATION HANDBOOK CHAPTER 6
52
6.2.1 Step 1: Develop a PI Improvement Sequencing Strategy Output from Step PI Plan Section One: Assessment of current status –
Organisational Approach to PI Development PI Plan: Requirement which is fulfilled:
Review of current system, overview of medium to long-term sequencing strategy Listing exemptions and data of expiry of exemptions
The first step in planning for the development of organisational PI Systems is to locate the organisation on the PI development path and to target in broad terms where the organisation would like to be on the path in five years’ time. Diagram 8.2 below illustrates this.
Diagram 8.2: A Road Map for PI Development
Develop Core PI Framework
Build reliable record
management systems for
PI
Validate selected indicators
Draft PI Manual
Decide core reporting mechanisms and processes
Confirm data availability and collection responsibility
Build capacity to manage core system
Assess data quality and
create processes to verify data for
existing PI
Upgrade and add
indicators and build
required data systems
Ensure key internal
stakeholders are trained at
all times
Develop electronic record and
performance reporting
and management
systems
Develop performance budgeting /
other uses of PI
Decide strategy for locating PI functions
Organisations may decide to bring forward the development of electronic systems, or to first develop performance budgeting procedures before adding indicators. The location of the development of IT systems only in a final phase of PI System development signals, that IT systems are effective only when they are built on effective underlying organisational business processes.
The organisation should first assess its current systems for managing PI by using the various tools provided in this Handbook, and then map out its PI development in broad phases over the medium term (for the first five year plan) and long term (for the next five to ten years).
Part of the strategy would be the exemptions that the organisation has applied for in terms of the requirements of the Regulations and until when the exemptions are envisaged to remain in place. For example, the organisation might wish to postpone undertaking a full assessment of data quality and the development of verification processes until the outer years of the medium term. This should be indicated and listed in the PI Plan.

PERFORMANCE INFORMATION HANDBOOK CHAPTER 6
53
6.2.2 Step 2: Who is responsible for PI Organisational Arrangements?
Output from Step PI Plan Section Two: Organisational arrangements for Managing Performance Information
PI Plan: Requirement which is fulfilled:
Designation of responsible manager Illustrates direct access to accounting officer or Executive Officer Sets out structures and capacity to manage PI throughout organisation Sets out organisational plans to review PI System and monitor the PI Plan
Select the organisational PI Manager: When drafting the first PI Plan the organisation must decide which unit and manager will have primary responsibility for PI. This does not mean that the full burden of responsibility for deciding, collecting, analysing and reporting on PI will rest with the manager and their unit. The management of PI is an organisation-wide task involving strategic planning, monitoring and evaluation and other business unit managers as well as the Chief Financial Officer. However, the Regulations require that one manager, with direct access to the Accounting or Executive Officer, must have ultimate responsibility for directing, controlling, monitoring and reviewing the PI System.
Depending on organisational need and capacity, organisations may decide that the responsibility for managing PI should be added to the job description of an existing senior manager, such as the CFO or the head of the strategic planning or monitoring unit.
Describe the current strategy, if any, for the management of PI in the organisation: A key decision in this regard will be the degree to which PI responsibility is centralised. Some organisations might pool its PI and M&E capacity in a central unit such as the strategic planning and/or M&E unit, others will prefer that PI and M&E capacity is located in each main programme or each chief and/or regional division. If the organisation has not yet taken a decision in this regard it should weigh the pros and cons of each approach against its circumstances.
Set out a strategy for how the structures to manage PI will be strengthened: If the organisation is planning to shift the primary function for PI, develop or extend structures to manage PI or improve the organisational standing of the PI unit over the five-year plan period, it should (i) set out these strategies in the main document and (ii) list them in the annexure, with an indication of who will be responsible for their implementation.
Set out how the organisation intends reviewing the PI Framework and a System periodically and monitor PI Plan implementation: The final part of step two of the PI Plan can describe organisational approaches and systems to reviewing the PI Framework and PI System and monitoring PI Plan implementation. Key parameters are: How frequently will the organisation review its PI Framework: annually, every two
years, once every five years? When in the organisational planning and budgeting cycle? As the PI Framework is linked to the indicators proposed in the Strategic Plan and the Estimates of National Expenditure, the proposal is that these should come from the core PI Framework. An annual review of the PI Framework will be effective. Updated PI Plans can be submitted with marginal changes.
How frequently will the other assessments be undertaken, for example on source PI datasets, capacity etc? Will these only be done every five years, given how time-
PERFORMANCE INFORMATION HANDBOOK CHAPTER 6
54
consuming they are, or will specific datasets be identified in addition to the period between major exercises of assessment and possible inclusion in internal audit and verification programmes?
Who will be responsible for the review? How will it be done:
- will it be part of the strategic planning process, - will an oversight review exercise involving the PI Manager and a core team be
undertaken annually supplemented by an organisation-wide thorough exercise every five years,
- Will a thorough review accompanied by data assessments be done every year?
6.2.3 Step 3: Develop PI Framework
Output from Step PI Plan Section Three: Providing a framework of indicators which the organisation will manage as its PI
PI PLAN Requirement which is fulfilled:
Lists all the strategic indicators the organisation will manage as PI with their metadata Sets out how the organisation intends extending the framework/improving indicators over the five year period
The instruments provided in chapter 2 will assist organisations to sort through their existing indicators, select the set of indicators (i) for which they can collect data, (ii) which provides sufficient coverage of organisational programmes and objectives and (iii) which comply best with the standards set in the FMPPI and map the forward development of the PI Framework. Organisations which are at the start of developing a PI Framework and system are advised to make use of the flowchart provided in chapter 2 to develop a first core framework.
In writing up Step 3 of the PI Plan, organisations can choose simply to provide a short narrative on the process they followed to select their performance indicators, including the key criteria for selection supplemented by the Annexure required in terms of the Regulations which lists the indicators against performance dimensions and provides the required metadata.
Step 3 should then detail how the organisation will improve its PI Framework over the five year period. Will it increase the breadth of the Framework (i.e. measure its values/more values in
addition to measuring objectives and programmes; measure objectives in greater detail),
increase the intensity of the Framework (add indicators against objectives, programmes and sub-programmes or values),
replace proxy indicators with improved indicators as it develops data collection systems, and/or
increase the depth of the framework (i.e. add indicators that measure performance at lower levels of programme and organisational structure)?
The organisation should draw on its sequencing strategy to make these choices and describe its selected course of action. It does not have to name the indicators that it will add to the framework: that can be done in revised PI Plans as the additional indicators are added and data for them is collected.
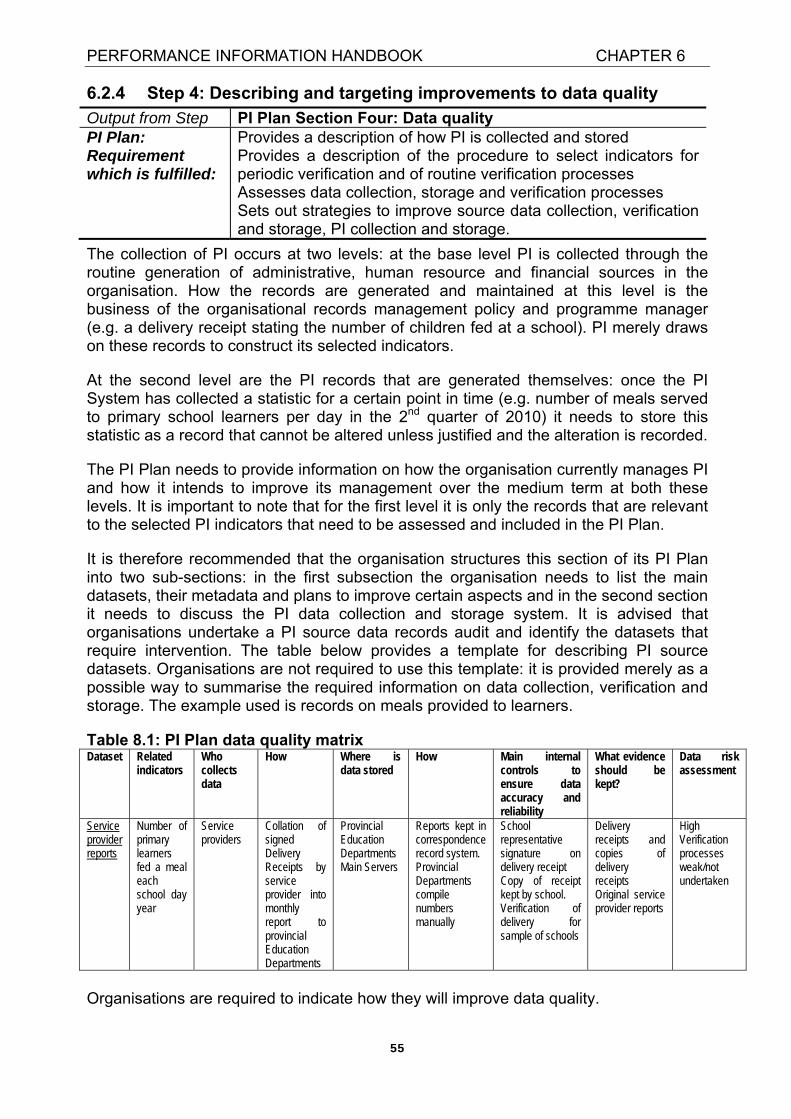
PERFORMANCE INFORMATION HANDBOOK CHAPTER 6
55
6.2.4 Step 4: Describing and targeting improvements to data quality
Output from Step PI Plan Section Four: Data quality PI Plan: Requirement which is fulfilled:
Provides a description of how PI is collected and stored Provides a description of the procedure to select indicators for periodic verification and of routine verification processes Assesses data collection, storage and verification processes Sets out strategies to improve source data collection, verification and storage, PI collection and storage.
The collection of PI occurs at two levels: at the base level PI is collected through the routine generation of administrative, human resource and financial sources in the organisation. How the records are generated and maintained at this level is the business of the organisational records management policy and programme manager (e.g. a delivery receipt stating the number of children fed at a school). PI merely draws on these records to construct its selected indicators.
At the second level are the PI records that are generated themselves: once the PI System has collected a statistic for a certain point in time (e.g. number of meals served to primary school learners per day in the 2nd quarter of 2010) it needs to store this statistic as a record that cannot be altered unless justified and the alteration is recorded.
The PI Plan needs to provide information on how the organisation currently manages PI and how it intends to improve its management over the medium term at both these levels. It is important to note that for the first level it is only the records that are relevant to the selected PI indicators that need to be assessed and included in the PI Plan.
It is therefore recommended that the organisation structures this section of its PI Plan into two sub-sections: in the first subsection the organisation needs to list the main datasets, their metadata and plans to improve certain aspects and in the second section it needs to discuss the PI data collection and storage system. It is advised that organisations undertake a PI source data records audit and identify the datasets that require intervention. The table below provides a template for describing PI source datasets. Organisations are not required to use this template: it is provided merely as a possible way to summarise the required information on data collection, verification and storage. The example used is records on meals provided to learners.
Table 8.1: PI Plan data quality matrix Dataset Related
indicators Who collects data
How Where is data stored
How Main internal controls to ensure data accuracy and reliability
What evidence should be kept?
Data risk assessment
Service provider reports
Number of primary learners fed a meal each school day year
Service providers
Collation of signed Delivery Receipts by service provider into monthly report to provincial Education Departments
Provincial Education Departments Main Servers
Reports kept in correspondence record system. Provincial Departments compile numbers manually
School representative signature on delivery receipt Copy of receipt kept by school. Verification of delivery for sample of schools
Delivery receipts and copies of delivery receipts Original service provider reports
High Verification processes weak/not undertaken
Organisations are required to indicate how they will improve data quality.

PERFORMANCE INFORMATION HANDBOOK CHAPTER 6
56
6.2.5 Step 5: Setting up systems to analyse, report and use PI
Output from Step PI Plan Section Five: Analysing, using and reporting PI PI Plan: Requirement fulfilled:
Provides a description of the use of PI in strategic and operational management processes Provides a description of reporting processes and instruments, including how the organisation will identify and address deviations from performance targets Sets out strategies to improve the use of PI, PI reporting instruments and processes
Section five of the PI Plan will describe organisational systems to ensure quality use of PI in strategic and operational management processes and to report on PI.
The PI Plan should list all external reporting requirements and how the organisation intends fulfilling these.
The PI Plan should identify changes that the organisation wants to make to how it uses PI for internal and external decision making, accountability and communication. This may include increasing the frequency of reporting, improving PI reporting formats (clarity, coverage, depth), using it systematically to develop flexible budgets (see chapter 4), and using PI to manage unit performance across the organisation.
6.2.6 Step 6: Capacity building and training
Output from Step PI Plan Section Six: Capacity building and training PI Plan: Requirement which is fulfilled:
Provide a capacity development and training plan aligned to the current practices and strategies for the management of performance information
This section will be focused on assessing the human resource capacity (number of people, skill levels) in the organisation’s structures, systems and processes (using the capacity assessment tool) and detail a capacity building and training plan for the five years.
The capacity assessment tool provided in chapter 5 will assist the organisation to describe and assess existing human resource capacity, for example capacity in the central unit responsible for PI, the understanding of PI throughout the organisation and the capacity to use PI in
strategic and operational management processes, the capacity of data collection staff and their understanding of why the data is
collected. The PI Plan would provide an organisational strategy to build capacity against these dimensions and detail the internal and external training planned. Development of systems (ICT and other) may be noted as part of the strategy.
6.2.7 Step 7: Compile the annexures The final step in compiling a PI Plan is compiling the annexures. There are four annexures:
i. An annexure that provides the PI Framework and metadata.

PERFORMANCE INFORMATION HANDBOOK CHAPTER 6
57
ii. An annexure that lists strategies from PI sections 3, 4, 5 and 6 to improve PI, with the responsible person for their implementation indicated.
iii. An annexure that lists PI source datasets that have been selected for inclusion in the internal audit programme and verification by the PI Manager.
iv. An annexure that lists and describes datasets that the organisation commits to provide to other organisations, the frequency of their provision and who is responsible for the provision.
6.3 Organisational PI Manuals The core of the PI Manual will overlap with what is in the PI Plan, but will expand on the PI Plan with details that are important to the organisation internally to manage PI. The PI Manual will also be used to build understanding and capacity internally on the indicators selected for PI, the collection of data for the indicators and their use.
The PI Manual will Describe PI indicators
- The PI Manual purpose is not to demarcate what the organisation commits to in terms of PI indicators (as in the case of the PI Plan), but to describe all the organisation’s indicators in such a way that all staff in the organisation who are involved in collecting data, storing data, calculating and using an indicator for reporting and/or management purposes will understand the indicator, its limitations and its use.
- Therefore the PI Manual will pay far more attention to the description of each indicator, the definition and explanation of the terms used in relation to the indicator and a description of its purpose.
- The PI Manual will also indicate what objectives and values are measured by the indicator and at which level of the organisation the indicator is managed.
- Primary data collection for the indicator. - The PI Manual will direct managers with regards to what data should be collected
for the indicator (including the metadata for the dataset, i.e. definitions, terms, classification and categorisation of data), by whom, how frequently and how frequently it should be recorded as a PI record.
- The PI Manual will direct managers with regards to which evidence to keep for each indicator.
- The PI Manual will also provide direction on how to construct the indicator . The PI Manual will specify how the indicator must be calculated, using which
datasets and the specifications of the datasets as well as definitions of indicators. Direct how changes in the indicator should be interpreted and provide any
qualifications on the accuracy, validity and completeness of the data or information on limitations of the indicator itself. The directions should indicate whether the indicator is a leading or a lagging indicator and what complementary data or management information can be investigated to understand and interpret changes in the indicator.
Provide direction on how units of the organisation should use the PI in strategic and operational management processes.
Act as a records policy for PI data. The PI Manual will direct how PI data is to be captured, how frequently, by whom, where it will be stored, in which format and what the rules are with regards to accessing and amending the data.
Advise staff on available capacity building or external training that can be accessed to build PI capacity.

PERFORMANCE INFORMATION HANDBOOK CHAPTER 6
58
In short, the PI Manual will capture at any point in time, the systems in use in the organisation to select, collect, store, verify and use PI.

PERFORMANCE INFORMATION HANDBOOK CHAPTER 7
59
CHAPTER 7 PREPARING FOR PI AUDITS
7.1 Introduction The Public Audit Act (PAA) requires the Auditor General to audit performance information on an annual basis. Sections 20(2)(c) and 28(1)(c) require that the audit report reflect at least an opinion or conclusion on the reported information relating to performance of an institution against predetermined objectives.
The Auditor General has adopted a phasing-in approach to compliance with the Public Audit Act with regards to expressing an audit opinion on reported performance information. Since 2005/06 auditees have been subjected to a review of their policies, systems, processes and procedures for the management of and reporting on performance against their predetermined objectives and of the accuracy, validity and completeness of the information presented. Findings in this regard have been included in the audit reports and as from 2009/10 audits, audit opinions are included in the management reports issued to the auditees. From 2010/11 onward the Auditor General may decide to provide an audit opinion on reported performance information in the audit reports.
This brief chapter is aimed at illustrating to organisations how the application of various tools in the handbook will assist them in preparing for audits of performance information.
7.2 Justifying the selection of indicators Few public sector organisations can select a set of indicators that jointly and for every single indicator fulfil all the criteria put forward in the FMPPI and elaborated on further in chapter 2 of this Handbook. It is therefore crucial that organisations appropriately document their indicators using the processes provided in the Handbook. This will allow them to record why specific indicators were selected and to illustrate that they are optimally covering the organisation’s objectives and measuring their performance against their existing PI management capacity.
7.3 Ensuring the availability of supporting evidence Chapters 2 and 3 of this Handbook advise organisations to ensure at the point of selecting indicators, that the necessary evidence to support the indicators will be available. In addition, it provides the organisation with the tools to select the risky source datasets that underlie their indicators for further assessment through internal verification and audit processes. The purpose of these processes is not only to achieve an unqualified PI audit opinion, but rather to ensure that the data used to review performance internally is accurate, valid and complete. Furthermore, organisations’ ability to report to Parliament or provincial legislature fairly and accurately provides a clear indication of what has actually been achieved against predetermined objectives.By extension it will also assist the organisation to be audit-ready.

PERFORMANCE INFORMATION HANDBOOK CHAPTER 7
60
7.4 Documenting and pacing the development of systems During the audit of performance information, the Auditor General uses the following sources as a basis for audit conclusions:
All relevant laws and regulations; The framework for Managing Programme Performance Information issued by the
National Treasury in 2007; and Relevant frameworks, circulars and guidance issued by the National Treasury and
the Presidency regarding the planning, management, monitoring, evaluation and reporting of performance information.
With the introduction of the Regulations on Programme Performance Information which are in chapter 5 of the Treasury Regulations, organisations will be more able to control the pace of development of PI Systems in line with their PI needs and capacity to manage PI against the relevant legislation and regulations as well as the FMPPI requirements. The Regulations require an organisation to set out the pace of development of its PI in its PI Plan. Its PI Plan is built around its PI Framework, which is as extensive and sophisticated as the organisation chooses it to be, while adhering to an organisation-specific interpretation of the PI. An organisation’s PI in terms of the Regulations comprises only the indicators included in its PI Framework.
7.5 Preparing for audits During the audits, organisations should be open with auditors in the provision of information and documentation. The collection of evidence, streamlined by the organisation’s own efforts to improve PI evidence, should be facilitated. An open external audit process will assist organisations to further strengthen their PI and to ensure accountability in terms of service delivery.

PERFORMANCE INFORMATION HANDBOOK BIBLIOGRAPHY
61
7 Bibliography
Accounting for Sustainability Initiative: http://www.accountingforsustainability.org/reporting/ accessed 10/2009
Allen, R 2008, Reforming Fiscal Institutions: The Elusive Art of the Budget Advisor, OECD Journal on Budgeting, 2008/3, p67-75
Businessdictionary.com: http://www.businessdictionary.com/ accessed 10/2009
Department of Performance Monitoring and Evaluation (2009), Improving Government Performance: Our Approach, p14
Evans, C and Richardson M 2009, How to Manage Effectively with Performance Indicators, The British Journal of Administrative Management, Summer 2009, p16-17
Global Reporting Initiative (GRI): http://www.globalreporting.org/AboutGRI/WhatIsGRI/ accessed 10/2009
National Treasury 2007, Framework for Managing Programme Performance Information
National Treasury 2009, Guidelines: Budget baseline tool, p3
OECD 2007, Performance Budgeting in OECD Countries, p1-79
OECD 2007b, Jacobzone, S., C. Choi and C. Miguet (2007), "Indicators of Regulatory Management Systems", OECD Working Papers on Public Governance, 2007/4, OECD Publishing
OECD 2008, Performance Budgeting: A Users’ Guide, OECD Observer, p1-7
Noman, Z, 2008, Performance Budgeting in the United Kingdom, OECD Journal on Budgeting, p75 - 90
Robinson, M & Last, D 2009, A Basic Model of Performance-Based Budgeting, International Monetary Fund, p1-12
Rowley, J 1998, Quality Measurement in the Public Sector, Total Quality Management, May 2/3, p321 – 333)
Schacter, M 2006, The Worth of a Garden, Performance Measurement and Policy Advice in the Public Service, a discussion paper, p1-12
Talluri, S, 2000, Data Envelope Analysis: Models and Extensions, Decision Line, May 2000, p8-11
Westhuizen and Dollery 2009, South African Local Government Efficiency Measurement, Centre for Local Government University of new England, April 2009, p1-19

Appendices
PE
RF
OR
MA
NC
E IN
FO
RM
AT
ION
HA
ND
BO
OK
A
PP
EN
DIC
ES
i
INDICATORGATHERING
STRUCTURING A Performance
Dimension TEMPLATE
CATEGORISATION, FILTERING,
SCORING
INDICATORSELECTION
MEASUREMENTBENCHMARKING
& OTHER ANALYSIS
REPORTING & PUBLICATION (INCL MEDIA)
PERIODIC PI REVIEW
DATA COLLECTION
MTEFMTSF
BUDGET PRIORITISATION & ADJUSTMENT
Regulations
Systems
TARGET SETTING
DATASET ANAYSIS
INDICATOR SOURCE DOCUMENTS, e.g. STRATEGIC PLAN
Appendix A
: The P
I System
at a Glance

ii
Appendices
ppg
Flowchart
PE
RF
OR
MA
NC
E IN
FO
RM
AT
ION
HA
ND
BO
OK
A
PP
EN
DIC
ES
2
Appendix B
: PI Framew
ork Decision m
aking

PERFORMANCE INFORMATION HANDBOOK APPENDICES
iii
Decision flowchart steps 1. Ascertain whether department has entities (if user of this guide is not an entity) and
agree if their PI should be included in the departmental PI Framework (for minor entities) or if the Public Entity should prepare a separate PI Framework
2. Review existing strategic/service delivery plans for existing PI for review
3. Confirm if existing PIs have been based on strategy maps. If the previous PI selection was based on a Balanced Scorecard implementation then strategy mapping will have been completed
4. Complete strategy maps where not currently available
5. Identify all known PIs and input to PI ‘dimension’ template
6. Determine SMART score for all PIs in template
7. Sort PI proposals by the Performance Dimension (Strategy, Structure, Value)
8. Identify PD gaps – what cubes are not being measured – and agree to create a new PI or mark as ‘NMR’ (No measure required)
9. Complete PI ‘data availability question of PD template
10. Complete PI criteria – leading/lagging, Effectiveness/Efficiency, TBL
11. Complete PI ‘customer satisfaction influence’ question of PD template
12. Complete PI ‘departmental (or entity) influence’ question of PD template
13. Decide if capacity now available to include sustainability indicators
14. Agree sustainability reporting (financial, economic, and environmental?)
15. Agree number of manageable PIs for organisation structure
16. Prioritise PI proposals by SMART score and select final PIs
17. Review all PI proposals for high priority, but low control low influence PIs
18. Agree whether a weighted index would be useful, and if so, develop index
19. Establish targets, then review/update benchmarking
20. Agree a benchmarking approach where appropriate (external or time)
21. Collect data and conduct regular reporting
22. Undertake an annual review of the PIs to ascertain if they suit management purposes

PERFORMANCE INFORMATION HANDBOOK APPENDICES
iv
Appendix C: Approaches to measuring environmental sustainability
Global Reporting Initiative (GRI) “GRI is a network-based organisation that has pioneered the development of the world’s most widely used sustainability reporting framework and is committed to its continuous improvement and application worldwide”.
“The Global Reporting Initiative's (GRI) vision is that disclosure on economic, environmental, and social performance become as commonplace and comparable as financial reporting, and as important to organizational success”.
GRI has developed a public sector ‘Agency’ supplement to its guidelines. Whilst the public agency supplement is still in the piloting phase the reporting framework would provide useful ideas for sustainability indicators. Appendix D is one example extracted from the public agency supplement as an illustration of the type of material presented there. The full ‘Public Agency’ supplement is included in the additional reading pack which can be accessed at:
http://www.globalreporting.org/ReportingFramework/SectorSupplements/PublicAgency/
Accounting for Sustainability Initiative This initiative is sponsored by HRH Prince of Wales, and is described as, “Accounting for Sustainability”. It brings organisations together to “develop practical tools to enable environmental and social performance to be better connected with strategy and financial performance, and thereby embedded into day-to-day operations and decision making”.
In terms of reporting the aims of the initiative are described as:
“In the context of reporting, a crucial element of achieving change is for mainstream reporting to reflect, not just the organisation's financial performance, but also its sustainability performance, demonstrating the strategic importance of sustainability factors and how these factors form part of the decision-making process of the business.” (http://www.accountingforsustainability.org/reporting/)
This initiative included the establishment an international forum for the sharing of ideas and experiences. The South African Institute of Chartered Accountants is a forum network accounting body member, along with 17 other international accounting bodies.
The full report, created when the initiative was launched in 2007, is available in the separate Readings pack. (http://www.accountingforsustainability.org/output/page1.asp)
One of the techniques used by the Initiative is to highlight areas of best practice application. In this regard there are currently 2 public sector documents promoted by the Initiative as representing best practice. Both papers are included within the Readings Pack (link to be provided).
England’s Cabinet Office 2007/08 Annual Report – the section most probably of most relevance to environmental sustainability is ‘Taking a Greener Approach’,

PERFORMANCE INFORMATION HANDBOOK APPENDICES
v
from pages 50 to 51. Especially note the inclusion of ‘Climate waste and resource indicators’ mainly related to the need to minimise carbon and waste production and promote efficient water utilisation, as part of their Performance Framework. There is a general trend internationally for these types of indicators to become a standard requirement for all government departments.
West Sussex County Council Sustainability Report 2007/08 – this short report also focuses on waste and emissions, but also refers to energy consumption and modes of business travel (encouraging sustainable travel options).
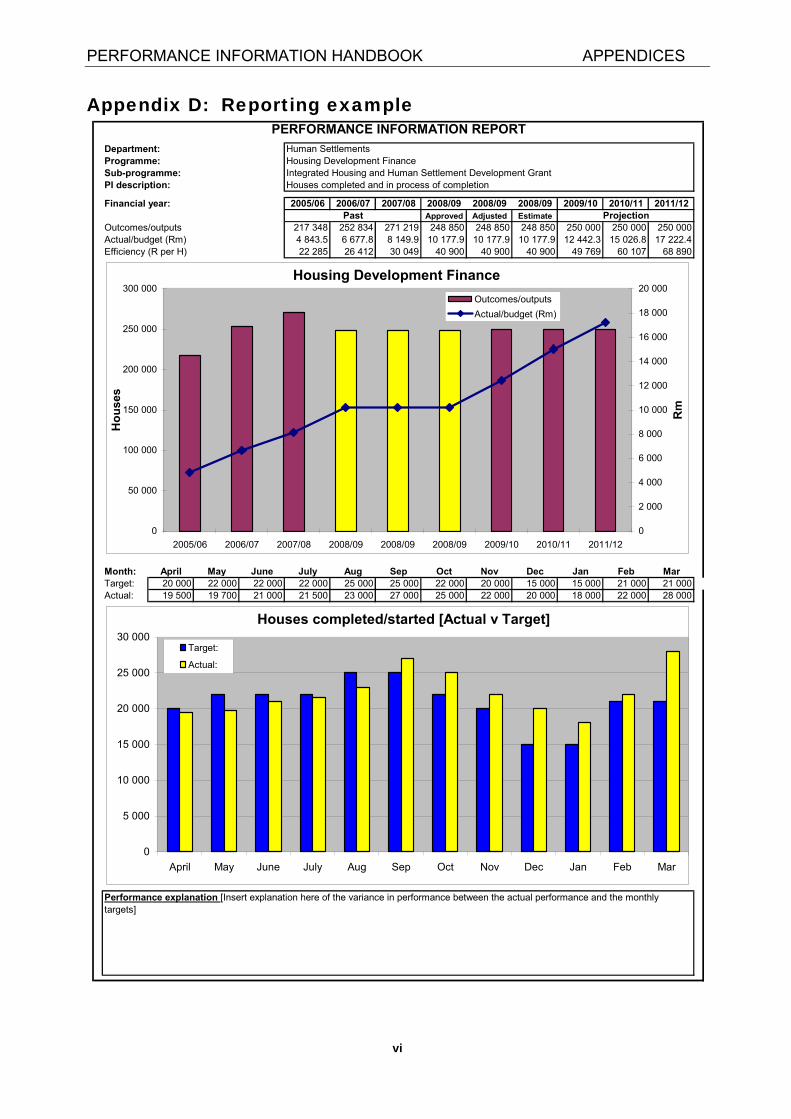
PERFORMANCE INFORMATION HANDBOOK APPENDICES
vi
Appendix D: Reporting example
2005/06 2006/07 2007/08 2008/09 2008/09 2008/09 2009/10 2010/11 2011/12Approved Adjusted Estimate
217 348 252 834 271 219 248 850 248 850 248 850 250 000 250 000 250 0004 843.5 6 677.8 8 149.9 10 177.9 10 177.9 10 177.9 12 442.3 15 026.8 17 222.4
Efficiency (R per H) 22 285 26 412 30 049 40 900 40 900 40 900 49 769 60 107 68 890
Month: April May June July Aug Sep Oct Nov Dec Jan Feb MarTarget: 20 000 22 000 22 000 22 000 25 000 25 000 22 000 20 000 15 000 15 000 21 000 21 000Actual: 19 500 19 700 21 000 21 500 23 000 27 000 25 000 22 000 20 000 18 000 22 000 28 000
PERFORMANCE INFORMATION REPORT
Projection
Human SettlementsHousing Development FinanceIntegrated Housing and Human Settlement Development GrantHouses completed and in process of completion
Department:Programme:Sub-programme:PI description:
Outcomes/outputsActual/budget (Rm)
Performance explanation [Insert explanation here of the variance in performance between the actual performance and the monthly targets]
Financial year:Past
Housing Development Finance
0
50 000
100 000
150 000
200 000
250 000
300 000
2005/06 2006/07 2007/08 2008/09 2008/09 2008/09 2009/10 2010/11 2011/12
Ho
use
s
0
2 000
4 000
6 000
8 000
10 000
12 000
14 000
16 000
18 000
20 000
Rm
Outcomes/outputs
Actual/budget (Rm)
Houses completed/started [Actual v Target]
0
5 000
10 000
15 000
20 000
25 000
30 000
April May June July Aug Sep Oct Nov Dec Jan Feb Mar
Target:
Actual:
PERFORMANCE INFORMATION HANDBOOK APPENDICES
vii
Appendix E: SASQAF data standards The SASQAF framework sets out eight dimensions of quality that are to be met for data to be certified as official, namely relevance, accuracy, timeliness, accessibility, interpretability, coherence, methodological soundness and integrity.
Relevance of information: The degree to which it meets the real needs of the organisation. The PI Framework discussed in chapter 2 is the primary tool in the PI domain for ensuring that PI is relevant to the real needs of the organisation.
Accuracy of information: The degree to which data correctly describes the phenomena it was designed to measure. This relates to the closeness between the estimated and the true (but unknown) values. The data assessment tool utilises the SASQAF criteria for accurate statistics to assess survey or sample-based data and NARSSA criteria for assessing data arising out of administrative records.
The timeliness of information: This refers to the delay between the measured event and the date on which the information becomes available for use as PI.
The accessibility of information: This refers to the ease with which data can be obtained. This includes the ease with which the existence of information can be ascertained, as well as the suitability of the form or medium through which the information can be accessed10.
The interpretability (credibility) of information: The ease with which users can understand statistical information through the provision of metadata. Metadata is the description of indicators. For example, what are the concepts, definitions and classifications used in the collection of data? Who collects the data? Whether information is provided by the organisation that will assist the user to assess the accuracy of the data produced.
The coherence of information: The degree to which it can be successfully brought together with other information. The use of standard concepts, classifications, time periods and target groups in respect of many indicators promotes coherence.
Methodological soundness of information: Refers to the application of international, national or peer-agreed standards, guidelines and practices to produce data.
Integrity of information: Refers to the presence of values and practices within the organisation that ensure users’ confidence in the organisation and its information.
NARSSA Standards The NARSSA records management policies pose key dimensions for quality administrative records, namely authenticity, reliability, integrity and usefulness and provide instruction on how to achieve these dimensions.
10 Accessibility however, has to be weighed up against the cost of providing accessibility. The PI Framework in Chapter 2 applied cost as a concept of the indicators chosen.

PERFORMANCE INFORMATION HANDBOOK APPENDICES
viii
Key dimensions of quality administrative records Dimension Description Organisational requirement Authenticity An authentic record is one that
can be proven i) to be what it purports to be, ii) to have been created or sent by the person purported to have created or sent it, and iii) to have been created or sent at the time purported.
To achieve the authenticity of records, organisations should implement and document policies and procedures which control the creation, receipt, transmission, maintenance and disposition of records to ensure that records creators are authorised and identified and that records are protected against unauthorised addition, deletion, alteration, use and concealment.
Reliability A reliable record is one whose contents can be trusted as a full and accurate representation of the transactions, activities or facts to which they attest and can be depended upon in the course of subsequent transactions or activities.
Records should be created at the time of the transaction or incident to which they relate, or soon afterwards, by individuals who have direct knowledge of the facts or by instruments routinely used within the body to conduct the transaction.
Integrity The integrity of a record refers to its being complete and unaltered.
It is necessary that a record be protected against unauthorised alteration. Records management policies and procedures should specify what additions or annotations may be made to a record after it is created, under what circumstances additions or annotations may be authorised, and who is authorised to make them. Any authorised annotation, addition or deletion to a record should be explicitly indicated and traceable.
Useability A useable record is one that can be located, retrieved, presented and interpreted. It should be capable of subsequent presentation as directly connected to the business activity or transaction that produced it.
The contextual linkages of records should carry the information needed for an understanding of the transactions that created and used them. It should be possible to identify a record within the context of broader business activities and functions. The links between records that document a sequence of activities should be maintained.
Source: NARSA, 2007, Records Management Policy Manual.

PERFORMANCE INFORMATION HANDBOOK APPENDICES
ix
Appendix F: Correctional Services Centre Level Monitoring Tool
The Correctional Centre Level Monitoring Tool had its origins in efforts to measure one of the immediate outcomes of the Department of Correctional Services (DCS), which required constructing an index of seven indicators. It was soon clear that the tool could be expanded to measuring organisational performance more broadly, by introducing a refined scoring mechanism that will assign scores to individual centres based on quantitative performance reports.
The original tool was developed on the following principles: All indicator data had to be currently available All data should provide a fair comparison between centres, notwithstanding centre
specialisation All data had to be valid and reliable Indicators can be weighted according to a set of criteria Where necessary, the value entered for each Centre is expressed in terms of a proportion
per 1000 inmates (according to the average in each Centre for that year) An equation was used in the tool to turn the reported performance of a Centre into a score The scoring mechanism of the tool needed to be sensitive enough that small performance
improvements at Centre level can be seen, both in relation to the individual indicator and the total score.
The essence of the basic tool is an Excel spreadsheet file, consisting of two worksheets. One is the data worksheet, in which data is imported and managed. The second is the Interface worksheet where the comparative performance ratings are calculated, sorted and viewed.
Against each selected indicator, a centre will achieve a score somewhere between 0.0 and 10.0. A 10 should be scored when ‘perfection” is attained. A zero reflects a dismal performance. The former is obviously more difficult to determine, and a decision on what constitutes ‘perfect’ performance is necessary for each indicator. Once values are assigned they remain across years. For example, if the value achieved by the best performing centre is selected to be the 10 score, the value should remain over years notwithstanding changes in what the best performing centre actually scores at.
A common approach for statistical measurement was that the purpose of each indicator scoring equation was to spread the scores. Ideally, there should be a few Centres that perform extremely well, a few that perform dismally, with the vast bulk somewhere in the middle. This distribution of scores will also ensure sensitivity to changes. It is important that not too many centres actually score a zero (or a 10 for that matter) for any one indicator. The decision on the target score was made separately for each individual indicator. As mentioned above, each Centre is given a rating out of 10 against each indicator, based on an equation that should provide a reasonable distribution across a histogram11 for all Centres. Once weighted, these indicator scores combine to provide an index score out of 10.
Indicators are of three major types. There are positive, negative and parabolic indicators. Negative indicators are those that measure performance of a Centre in trying to prevent
something happening, and ideally achieving a reported score of zero. Examples are assaults, escapes and unnatural deaths. A problem associated with negative indicators is
11 A histogram is a bar chart that presents a frequency distribution.

PERFORMANCE INFORMATION HANDBOOK APPENDICES
x
that undetected non-reporting of such incidences will earn a perfect score of 10. Positive indicators are those in which the Centre has to provide something of substance in
order to score, and the higher the result the higher the score. Examples are the provision of resources, such as nurse attendance and education, rehabilitation programmes or security measures.
Parabolic indicators are those for which the achievement of a percentage of 100 is ideal, and in which scores of 10 less than 100 and a score of 10 more than 100 produce an equal score in the tool. As an example, under spending can be as bad as overspending, and reaching less than 100% accommodation capacity can be as bad as overcrowding by 10%, as it is a waste of resources.
Source: Department of Correctional Services