performance improvement report - maine medication best ... the sample is based on a 13-week session...
TRANSCRIPT

Performance Improvement Report
Quarter 1 FY 2006 July, August, September
David Proffitt, Superintendent November, 2005

Table of Contents
INTRODUCTION page 3
HOSPITAL INDICATORS
FINANCIAL MANAGEMENT page 4 PEER SUPPORT: page 5 NURSING ASPECT: MEDICATION ERRORS page 6 REHABILITATION page 7 HUMAN RESOURCES page 9 ENVIRONMENT OF CARE page 13 HOUSEKEEPING page 14 DIETARY page 15 PROFESSIONAL & ORGANIZATIONAL DEVELOPMENT page 16 INFECTION CONTROL page 17 CLIENT SATISFACTION page 18 MEDICAL STAFF page 20 NURSING : CODE CART & REDLINING page 22 NURSING: PAIN MANAGEMENT page 24 NURSING: CHART REVIEW page 26 CAPITOL COMMUNITY CLINIC page 31 VOCATIONAL SERVICES PROGRAM page 32 HEALTH INFORMATION SERVICES page 33
HOSPITAL PERFORMANCE MEASURES RESTRAINTS page 36 SECLUSIONS page 39 ALOS FOR HOSPITAL DISCHARGES page 40 HOSPITAL STAY/DISCHARGE DATA page 41 READMISSIONS page 44 VOLUNTARY AND INVOLUNTARY ADMISSION page 44 ELOPEMENT RATE-COMPARISONS WITH NASMHPD page 46 NEW GENERATION ANTIPSYCHOTIC USE-COMPARISON WITH NASMHPD page 48 PREVALENCE OF CO-OCCURRING PSYCHIATRIC AND SUBSTANCE DISORDERS (COPSD)-COMPARISONS WITH NASMHPD page 49

HOSPITAL PERFORMANCE IMPROVEMENT QUARTERLY REPORT
JULY, AUGUST, SEPTEMBER, 2005
INTRODUCTION
During this past quarter, the quality indicators have been closely analyzed and monitored to ensure they capture and reflect key hospital efforts affecting client care. Each hospital care unit, as well as the hospital department/discipline, has created its own quality plan. This has resulted in better client-specific indicators that have given the hospital precise monitoring data with the opportunity for performance improvement, not only by department and discipline, but also by units. This document will refer to a Performance Improvement Team (PIT), which is a method of comprehensive analysis and multi-disciplinary assessments of a problem. Riverview will continue to use this mechanism as a way to address issues identified through the quality assurance and quality improvement processes. This quarterly report contains two sections. The first section presents the core Aspects of Quality for each discipline or topic area within the hospital. The data collected this quarter is presented for each aspect , and is compared to the indicator “threshold percentile” which reflects the quality standard the hospital uses to define when corrective actions are required. The report then describes specific findings based on the data, and the action steps planned or underway to address problem areas. The term “compliance” is used to reflect the extent to which the data shows achievement of the quality indicator in relation to the threshold. Overall compliance for each indicator shows the average degree of compliance for the indicators and time periods listed. The second section presents a series of “Hospital Performance Measures” which describes occurrences of important hospital activities. These activities are routinely monitored and trended. These measured occurrences assist the hospital in identifying additional areas that may require increased surveillance, study or action.

HOSPITAL INDICATORS
FINANCIAL MANAGEMENT ASPECT: MANAGE FINANCIAL NEEDS WITHIN EXISTING, ALLOCATED RESOURCES
RPC YT D BUDGE T VS ACTUALQ1 FY200 6
5.2 3
7.96
5 .05
3.0 2
2
4
6
8
10
12
Personal Services General Operations
Mill
ions
of
Dol
lars
BUDG ET
EXPENDIT URE
FINDINGS: The hospital continues to operate within budget.
PROBLEM: None noted
STATUS: Finances are now tracked on a monthly basis and expenditures measured against YTD allocations.
ACTIONS: Continued aggressive management of contractual services via fiscal and programmatic accountability,
using monthly YTD , Budget vs. Actual expenditures. Through aggressive fiscal management, and enhanced revenues via aggressive billing and participation
with the Department in Meditech, be able to self-fund additional critical hospital services such as a Forensic Community Transition Program..
NEXT REPORTING DATE: JANUARY 2006
PEER SUPPORT:
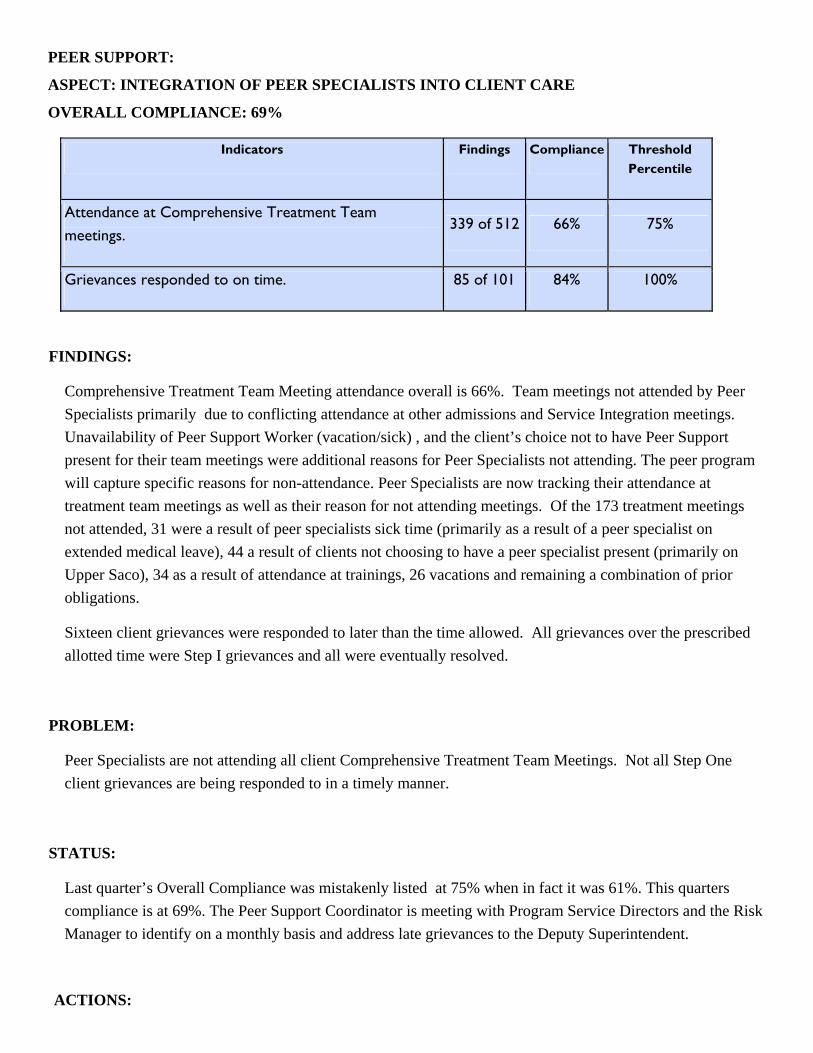
ASPECT: INTEGRATION OF PEER SPECIALISTS INTO CLIENT CARE
OVERALL COMPLIANCE: 69%
Indicators Findings Compliance Threshold Percentile
Attendance at Comprehensive Treatment Team meetings.
339 of 512 66% 75%
Grievances responded to on time. 85 of 101 84% 100%
FINDINGS:
Comprehensive Treatment Team Meeting attendance overall is 66%. Team meetings not attended by Peer Specialists primarily due to conflicting attendance at other admissions and Service Integration meetings. Unavailability of Peer Support Worker (vacation/sick) , and the client’s choice not to have Peer Support present for their team meetings were additional reasons for Peer Specialists not attending. The peer program will capture specific reasons for non-attendance. Peer Specialists are now tracking their attendance at treatment team meetings as well as their reason for not attending meetings. Of the 173 treatment meetings not attended, 31 were a result of peer specialists sick time (primarily as a result of a peer specialist on extended medical leave), 44 a result of clients not choosing to have a peer specialist present (primarily on Upper Saco), 34 as a result of attendance at trainings, 26 vacations and remaining a combination of prior obligations.
Sixteen client grievances were responded to later than the time allowed. All grievances over the prescribed allotted time were Step I grievances and all were eventually resolved.
PROBLEM:
Peer Specialists are not attending all client Comprehensive Treatment Team Meetings. Not all Step One client grievances are being responded to in a timely manner.
STATUS:
Last quarter’s Overall Compliance was mistakenly listed at 75% when in fact it was 61%. This quarters compliance is at 69%. The Peer Support Coordinator is meeting with Program Service Directors and the Risk Manager to identify on a monthly basis and address late grievances to the Deputy Superintendent.
ACTIONS:
The Peer Support Coordinator will submit monthly reports on grievance response time to the Deputy Superintendent to monitor and address late grievances.
Peer Specialists will continue to meet with their respective Program Services Directors to address late grievances and assure that they are responded to in a timely manner.
NEXT REPORTING DATE: JANUARY 2006
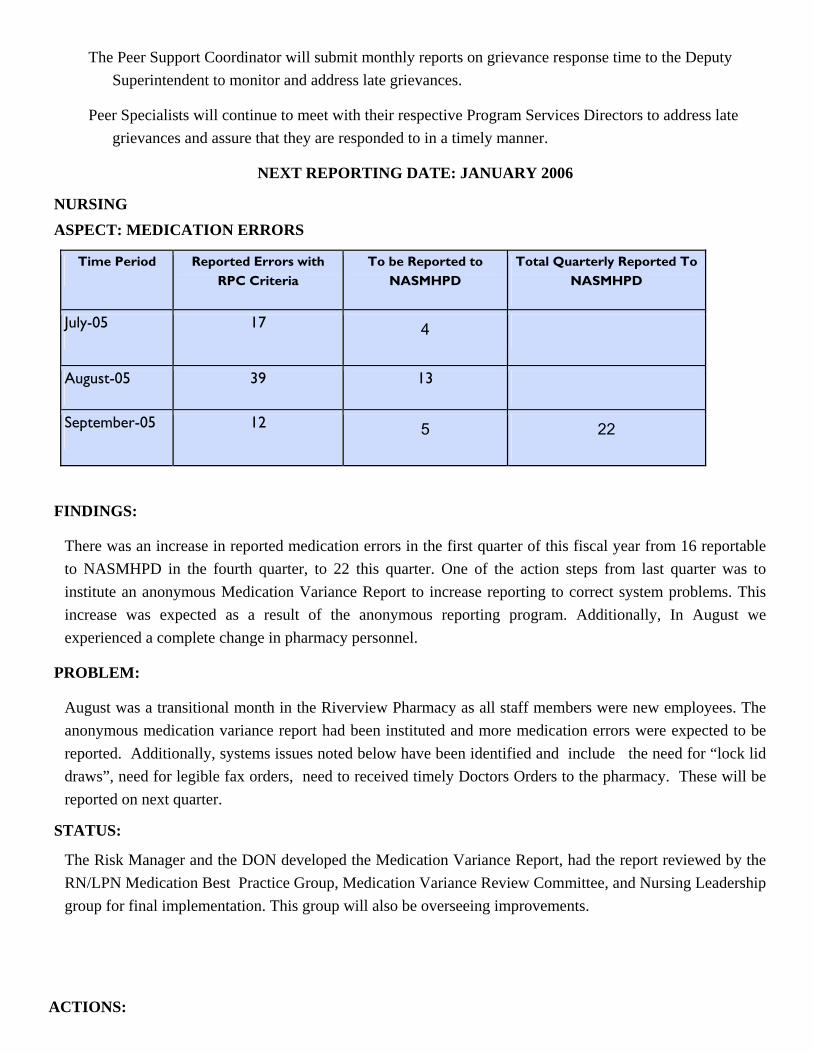
NURSING ASPECT: MEDICATION ERRORS
Time Period Reported Errors with RPC Criteria
To be Reported to NASMHPD
Total Quarterly Reported To NASMHPD
July-05 17 4
August-05 39 13
September-05 12 5 22
FINDINGS:
There was an increase in reported medication errors in the first quarter of this fiscal year from 16 reportable to NASMHPD in the fourth quarter, to 22 this quarter. One of the action steps from last quarter was to institute an anonymous Medication Variance Report to increase reporting to correct system problems. This increase was expected as a result of the anonymous reporting program. Additionally, In August we experienced a complete change in pharmacy personnel.
PROBLEM:
August was a transitional month in the Riverview Pharmacy as all staff members were new employees. The anonymous medication variance report had been instituted and more medication errors were expected to be reported. Additionally, systems issues noted below have been identified and include the need for “lock lid draws”, need for legible fax orders, need to received timely Doctors Orders to the pharmacy. These will be reported on next quarter.
STATUS:
The Risk Manager and the DON developed the Medication Variance Report, had the report reviewed by the RN/LPN Medication Best Practice Group, Medication Variance Review Committee, and Nursing Leadership group for final implementation. This group will also be overseeing improvements.
ACTIONS:

In mid-June a pilot of an anonymous Medication Variance was instituted, with the intent to decrease the fear of reporting, and to improve the actual issue reporting so system issues can be addressed. This system will be continued.
A detailed process is in place to scrutinize all medication variance reports. This review process will allow review of the medication variance on the shift that it occurred by the clinical nurse manager and the Director of Nursing. The Medication Safe Practice group has been working to make the implementation successful and will continue to encourage reporting.
NEXT REPORTING DATE: JANUARY 2006
REHABILITATION ASPECT: CLIENT ATTENDANCE AT HARBOR MALL
OVERALL COMPLIANCE: 64% Indicators Findings Compliance Threshold Percentile
Attendance by clients scheduled to attend mall groups on a daily basis 3410 of 5317 64% 70%
Attendance at morning programming 1912 of 2755 69% 70%
Attendance at afternoon programming 1498 of 2562 58% 70%
FINDINGS:
The sample is based on a 13-week session of the Harbor Mall from 7/01/05 to 9/30/05. For the 13-week period, the morning programming had 1912 client interactions out of a possible 2755 for a 69% total, up 4% from last report. The afternoon programming had 1498 client interactions out of 2562 for a 58% total, which is up 1 % from the last report. This means that for the 64 days the mall was in session we had a compliance rate of 64% compared to last quarter’s 60%. This percentage is growing every quarter. As a result of the action steps implemented last quarter we are finding that more clients are attending the morning sessions.

PROBLEM:
Possibility of reduced opportunities for client participation due to conflict in schedules, appointments, work.
STATUS:
The Treatment Mall staff continues to work with the action steps outlined last quarter, including using summary sheets to identify trends. Engagement plans are in place for clients refusing groups. The morning program improved by 490 while the afternoon program improved by 190. Overall compliance rose slightly this quarter from 60% t0 64%.
ACTIONS:
Director of Rehabilitation modified the unit sheets to better reflect reasons clients not attending the mall programming.
Rehabilitation Therapy staff are identifying the clients who have a pattern of refusing to attend their groups and are developing engagement plans as part of the client’s treatment plan.
Treatment Mall staff to conduct survey to assess programs clients would like to have.
The Mall will structure the afternoon programs with more skill building/treatment focused groups and less recreation participation type groups.
Hospital-wide training on Psych Rehab and engagement planning to be implemented next 2 quarters.
NEXT REPORTING DATE JANUARY 2006

HUMAN RESOURCES
ASPECT: PERFORMANCE EVALUATIONS
OVERALL COMPLIANCE: 42%
Indicators Findings Compliance Threshold Percentile
July 2005 (May evals) 19 of 27 70% 85%
Aug 2005 (June evals) 7 of 34 20% 85%
Sept 2005 (July evals) 5 of 14 36% 85%
FINDINGS: Last quarters Overall Compliance was at 71%. This quarters dropped significantly to 42% . During this quarter 75 performance evaluations were sent out; 31 were received in a timely manner. At the Bi-weekly Managers Meeting, Human Resources continues to stress the importance of timely submission and requested from all Department Heads to submit their evaluations for processing for timely merit increases for staff. There was a decrease by the end of this rating period 42% as compared to 71% last quarter. Data from the past few weeks is showing continual improvement, increasing 20% in August, 36% in Sept and 46% in Oct, although still far below the compliance threshold.
PROBLEMS: Supervisors are not submitting performance evaluations on a timely basis.
STATUS: A PIT was formed and the committee met and presented solutions and recommendations to assist supervisors in timely submission. They were:
An e-mail was sent by the Deputy Superintendent to all requesting that any/all overdue performance evaluations be completed immediately; and
All supervisors first expectation on their own performance evaluations will be that they complete their evaluations by 30 days of the due date. We remain under our target of 85% compliance.
ACTION:
Human Resources will report weekly to the Superintendent on the progress of compliance. The Superintendent will follow-up with all Program Service Directors/Unit/Division Directors on
outstanding/overdue evaluations, and build this into that Supervisors performance appraisal.
NEXT REPORTING DATE: JANUARY 2006
HUMAN RESOURCES

ASPECT: OVERTIME HOURS
Overtime hours FY2006
0.00
500.00
1,000.00
1,500.00
2,000.00
2,500.00
7/6/200
5
7/20/2
005
8/3/200
5
8/17/2
005
8/31/2
005
9/14/2
005
9/28/2
005
10/12
/2005
10/26
/2005
11/9/
2005
11/23
/2005
12/7/
2005
12/21
/2005
1/4/200
6
1/18/2
006
2/1/200
6
2/15/2
006
3/1/200
6
3/15/2
006
3/29/2
006
4/12/2
006
4/26/2
006
5/10/2
006
5/24/2
006
6/7/200
6
6/21/2
006
By pay period
Num
ber o
f hou
rs
FINDINGS
Overtime has decreased this FY06 , by over 700 hours a pay period since July 05. The hospital did experience an expected spike during the summer months as a result of staff vacations.
PROBLEMS:
None, as overtime is decreasing.
STATUS:
Automation of the scheduling process, adherence to staffing within an acuity plan, and tighter management of staff assignments on the unit level have all contributed to reduced overtimes.
ACTION:
Developing two Staffing Coordinator positions, one for the Civil side and one for the Forensic side.
NEXT REPORTING DATE JANUARY 2006
HUMAN RESOURCES
Mandates FY2006
0
5
10
15
20
25
7/6/200
5
7/20/2
005
8/3/200
5
8/17/2
005
8/31/2
005
9/14/2
005
9/28/2
005
10/12
/2005
10/26
/2005
11/9/
2005
11/23
/2005
12/7/
2005
12/21
/2005
1/4/200
6
1/18/2
006
2/1/200
6
2/15/2
006
3/1/200
6
3/15/2
006
3/29/2
006
4/12/2
006
4/26/2
006
5/10/2
006
5/24/2
006
6/7/200
6
6/21/2
006
By pay period
Num
ber o
f Man
date
s
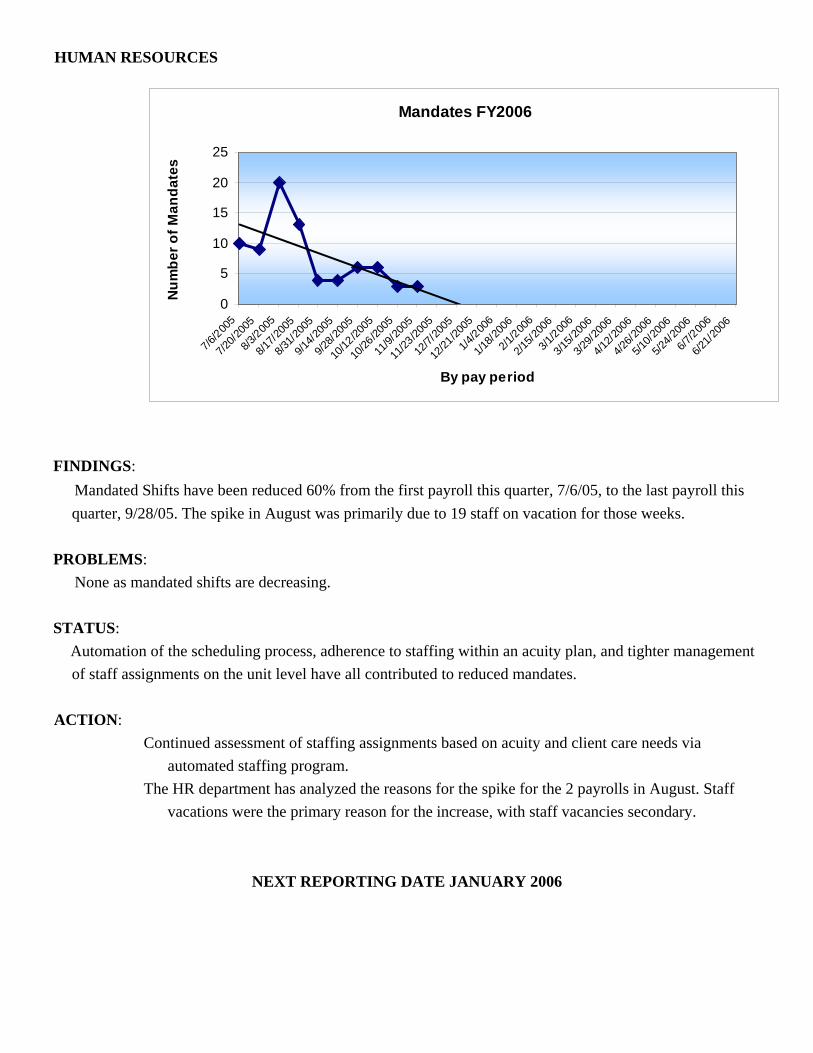
FINDINGS: Mandated Shifts have been reduced 60% from the first payroll this quarter, 7/6/05, to the last payroll this quarter, 9/28/05. The spike in August was primarily due to 19 staff on vacation for those weeks.
PROBLEMS: None as mandated shifts are decreasing.
STATUS: Automation of the scheduling process, adherence to staffing within an acuity plan, and tighter management of staff assignments on the unit level have all contributed to reduced mandates.
ACTION:
Continued assessment of staffing assignments based on acuity and client care needs via automated staffing program.
The HR department has analyzed the reasons for the spike for the 2 payrolls in August. Staff vacations were the primary reason for the increase, with staff vacancies secondary.
NEXT REPORTING DATE JANUARY 2006
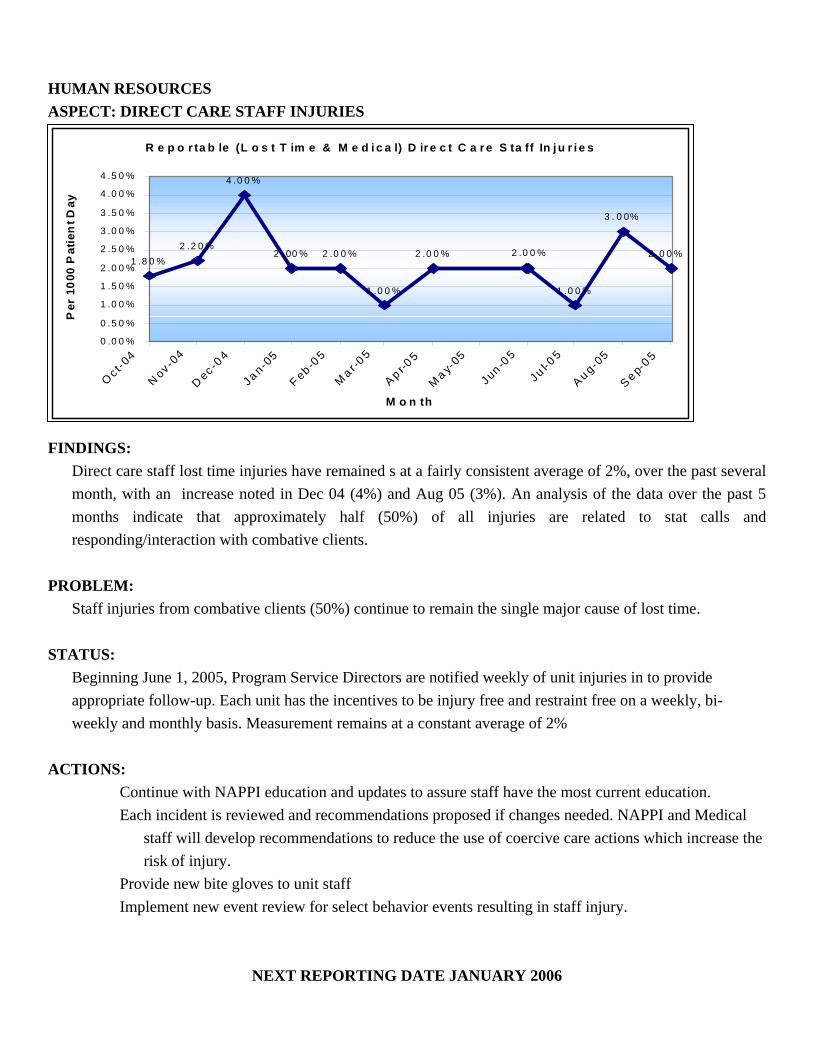
HUMAN RESOURCES ASPECT: DIRECT CARE STAFF INJURIES
R e p o r ta b le (L o s t T im e & M e d i c a l) D ir e c t C a r e S ta ff In j u r i e s
1 .8 0 %2 .2 0 %
4 .0 0 %
2 . 00 % 2 .0 0 %
1 .0 0 %
2 .0 0 %
1 .0 0 %
3 . 0 0%
2 .0 0 %2 .0 0 %
0 .0 0 %
0 .5 0 %
1 .0 0 %
1 .5 0 %
2 .0 0 %
2 .5 0 %
3 .0 0 %
3 .5 0 %
4 .0 0 %
4 .5 0 %
Oc t-04
N ov -04
D ec -04
Ja n-05
F eb -05
Ma r -0
5
A p r-05
Ma y-
05
Jun -05
Ju l-05
A u g-05
Se p-0 5
M o n th
Per
100
0 P
atie
nt D
ay
FINDINGS: Direct care staff lost time injuries have remained s at a fairly consistent average of 2%, over the past several month, with an increase noted in Dec 04 (4%) and Aug 05 (3%). An analysis of the data over the past 5 months indicate that approximately half (50%) of all injuries are related to stat calls and responding/interaction with combative clients.
PROBLEM: Staff injuries from combative clients (50%) continue to remain the single major cause of lost time.
STATUS: Beginning June 1, 2005, Program Service Directors are notified weekly of unit injuries in to provide appropriate follow-up. Each unit has the incentives to be injury free and restraint free on a weekly, bi-weekly and monthly basis. Measurement remains at a constant average of 2%
ACTIONS:
Continue with NAPPI education and updates to assure staff have the most current education. Each incident is reviewed and recommendations proposed if changes needed. NAPPI and Medical
staff will develop recommendations to reduce the use of coercive care actions which increase the risk of injury.
Provide new bite gloves to unit staff Implement new event review for select behavior events resulting in staff injury.
NEXT REPORTING DATE JANUARY 2006

ENVIRONMENT OF CARE ASPECT: STAFF INJURIES DUE TO ENVIRONMENT- CORRECTED OVERALL COMPLIANCE: 100%
Indicator Findings Compliance Threshold Percentile
Total of staff injuries reported due to environment. 4 of 38 100% 100%
FINDINGS:
4 of 38 staff injuries were reported due to the environment this quarter; elevator door closed on staff-Increased time on door to be open; staff slipped on wet floor in L. Saco bathroom 1-522.-Installed shower curtain that fits better in opening preventing water overspray; staff slipped on water/vegetable oil on floor-Supervisor instructed staff not to carry heavy containers filled with liquid, use carts; staff tripped over cord of buffer, L. Kennebec Sally port-Instructed staff to reposition cords .
PROBLEM:
None. Environmentally related issues contributing to injury addressed within 24 hours.
STATUS:
All 4 incidents of staff injuries were repaired or addressed within 24 hrs. of report. Last quarters results also showed all environmental issues were repaired/addressed within 24 hours.
ACTIONS:
• Repairs and necessary changes to be made in a timely manner. (within 24 hours).
NEXT REPORTING DATE: JANUARY 2006
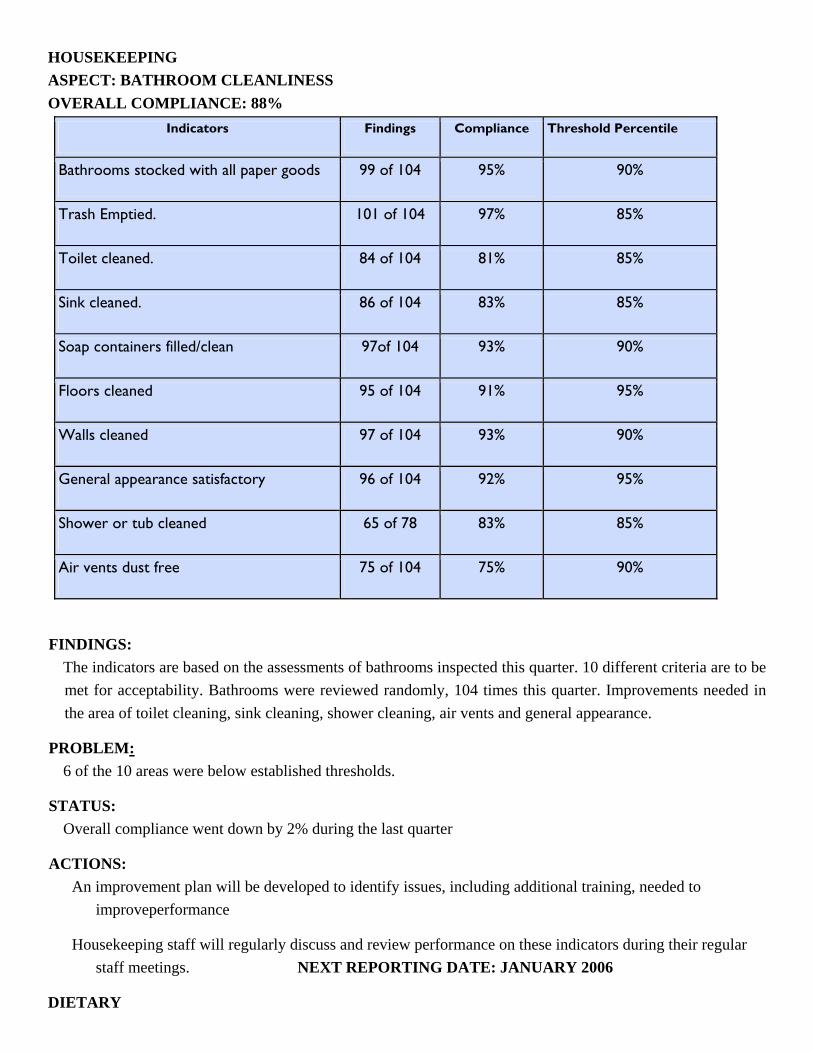
HOUSEKEEPING ASPECT: BATHROOM CLEANLINESS OVERALL COMPLIANCE: 88%
Indicators Findings Compliance Threshold Percentile
Bathrooms stocked with all paper goods 99 of 104 95% 90%
Trash Emptied. 101 of 104 97% 85%
Toilet cleaned. 84 of 104 81% 85%
Sink cleaned. 86 of 104 83% 85%
Soap containers filled/clean 97of 104 93% 90%
Floors cleaned 95 of 104 91% 95%
Walls cleaned 97 of 104 93% 90%
General appearance satisfactory 96 of 104 92% 95%
Shower or tub cleaned 65 of 78 83% 85%
Air vents dust free 75 of 104 75% 90%
FINDINGS: The indicators are based on the assessments of bathrooms inspected this quarter. 10 different criteria are to be met for acceptability. Bathrooms were reviewed randomly, 104 times this quarter. Improvements needed in the area of toilet cleaning, sink cleaning, shower cleaning, air vents and general appearance.
PROBLEM: 6 of the 10 areas were below established thresholds.
STATUS: Overall compliance went down by 2% during the last quarter
ACTIONS: An improvement plan will be developed to identify issues, including additional training, needed to
improveperformance
Housekeeping staff will regularly discuss and review performance on these indicators during their regular staff meetings. NEXT REPORTING DATE: JANUARY 2006
DIETARY

ASPECT: UNIT KITCHEN CLEANLINESS
OVERALL COMPLIANCE: 88% Indicators Findings Compliance Threshold Percentile
1. All surfaces clean 41 of 54 76% 90%
2. Thermometers in frig / freezers 54 of 54 100% 95%
3. Clipboards clean? 47 of 54 87% 80%
4. Frig clean 49 of 54 91% 80%
5.Walls clean 53 of 54 98% 90%
6. Toasters clean 47 of 54 87% 85%
7. Microwave clean 48 of 54 89% 85%
8. Sinks clean 51 of 54 94% 90%
9.Assorted fruit fresh 43 of 47 91% 85%
10. All food dated 38 of 54 70% 95%
FINDINGS: This is a new indicator. Unit kitchens were reviewed randomly, 54 times this quarter. Improvement is needed keeping the counters clean and labeling and dating all foods that have been opened.
PROBLEMS: The unit kitchens were checked prior to 10 am, the time that the main kitchen staff go to the units to clean and stock them. Kitchen staff were not aware of the exact areas they are responsible for. Kitchen staff are nervous entering the SCU areas due to client acuity. Therefore, the unit kitchens are not attended to as they should be. Unit staff do not consistently label and date food that they open. The unit kitchens are used a minimum of six times daily. Dietary staff cleans them once a day.
STATUS: This first quarter measurement shows a 76% compliance keeping counters clean and a 70% compliance labeling and dating all foods that are opened. There is an 88% overall compliance.
ACTIONS: Unit kitchens will be checked before and after 10 am to assure consistent cleanliness. Kitchen staff will request assistance in the SCU areas if they feel uncomfortable. Unit staff will be reminded of the importance of dating foods, Dietetic Services Manager will recommend that clients clean the area as a job.

PROFESSIONAL & ORGANIZATIONAL DEVELOPMENT
ASPECT: COURT COORDINATOR WILL MEET WITH CLIENTS PRIOR TO HEARINGS
OVERALL COMPLIANCE: 91% Indicators Findings Compliance Threshold
Percentile
The Court Coordinator will meet with 100% of the RPC clients awaiting a District Court Commitment hearing and explain the court process to them.
31-34 91% 100%
FINDINGS:
This indicator is based on 13 court sessions during the months of July, August and September of 2005. It does ninclude 18 patients who had hearings at the Riverview Psychiatric Center who were from the Maine General MedicCenter and the Veterans Administration at Togus. The Court Coordinator did not visit these individuals prior to thhearings as it is beyond the scope of his responsibility.
PROBLEM: The Court Coordinator did not meet with two RPC Clients because they refused to meet with him on two occasions. Hdid not meet with one client after being informed by the staff that the patient was two hostile and threatening to mewith him safely.
STATUS: Last quarters Overall Compliance was 97% with 1 client refusing a pre-court meeting. Coordinator continues to meet
with clients willing to do so.
ACTION: The Court Coordinator will monitor the clients who refuse to meet with him on a daily basis up until the
time of the hearing in an attempt to provide assistance.
The Court Coordinator will monitor the condition of patients whom the staff indicates are too hostile to meet with. Should their behavior improve, he will meet with them to discuss the court commitment process and assist them with issues related to the hearings.
Reporting will be reduced to semi-annually.
NEXT REPORTING DATE: JUNE 2006

INFECTION CONTROL ASPECT: HOSPITAL INFECTION CONTROL
OVERALL COMPLIANCE: Hospital average (36 months): 3.0
Indicators Number Rate Threshold Rate
Hospital Acquired (healthcare associated) infection rate, infections per 1000 patient-days
28 3.4 5.8 or less
FINDINGS:
Infection rate is obtained by total house surveillance. This remains the best method for behavioral healthcare facilities to identify trends and problems. Surveillance accomplished by chart reviews, review of antibiotic prescribing (used for infections or prophylaxis), and clinical staff reporting.
PROBLEM:
Last Quarters measurements indicated 10 infections per 1000 patient days for a 1.26 rate. This quarters numbers are 28 infections for a 3.4 rate and although is still well within the threshold percentile, with the flu season approaching, aggressive preventative measures are being implemented.
STATUS: Infection rate for this period was within the accepted 2 standard deviation for threshold of action
ACTIONS: Addressed concerns of unit staff and clients regarding prevention and treatment of tinea pedis
(athlete’s foot). Increased attention to shower cleaning by staff and clients after each use as well as client education
of appropriate foot care and footwear education will continue. Hand hygiene continues to be stressed to staff and clients. Informational e-mails have been routinely sent out to staff regarding the flu, availability of vaccines
and clinics, and information of the recent possibility of the flu pandemic.
NEXT REPORTING DATE: JANUARY 2006

CLIENT SATISFACTION ASPECT: SATISFACTION SURVEYS OVERALL COMPLIANCE 71%
Indicators Findings Compliance Threshold P til
1. Has anyone informed you about your rights? 55 of 71 77% 85%
2. Has anyone talked to you about the services that are available to you? 56 of 71 78% 85%
3. Are you informed ahead of time of changes in your privileges, appointments or daily routines?
50 of 71 70% 85%
4. Do you know someone who can help you get what you want or stand up for your rights?
56 of 71 79% 85%
5. Has your Community Worker visited or contacted you since you have been in the hospital? (32 Patient’s answered Non Applicable )
29 of 39 74% 85%
6. Do you know how to get in touch with your Community Worker? 31 of 37 84% 85%
7. Do you have an Individualized Support Plan (ISP)? 28 of 37 76% 85%
8. I feel more confident in my ability to deal with crisis situations? 55 of 71 77% 85%
9. I am less bothered by my symptoms now? 53 of 71 75% 85%
10. I am better able to function? 60 of 71 85% 85%
11. I do better in social situations? 54 of 71 76% 85%
12. I experience less difficulty in my life 45 of 71 63% 85%
13. I am treated with dignity and respect? 62 of 71 87% 85%
14. I feel comfortable asking questions about my treatment and medications? 57 of 71 80% 85%
15. I am encouraged to use self-help/peer support /groups after discharge? 52 of 71 73% 85%
16. My medication benefits and risks were discussed with me? 47 of 71 66% 85%
17. I am given information about how to understand and manage my illness? 50 of 71 70% 85%
18. My other medical conditions are being treated? 35 of 71 49% 85%
19. I feel free to complain without fear of retaliation? 59 of 71 83% 85%
20. I feel safe to refuse medication or treatment during my hospital stay? 49 of 71 69% 85%
21. I participate in planning my discharge? 41 of 71 58% 85%
22. I feel I had enough privacy in the hospital? 61 of 71 86% 85%
23. I feel safe while I am in the hospital? 62 of 71 87% 85%
24. If I had a choice of hospitals, I would still choose this one? 58 of 71 82% 85%

FINDINGS: A Peer Survey Representative collects patient satisfaction information in several areas. The opportunity to respond is provided to every client scheduled for discharge, as well as to other clients randomly chosen to complete the survey after they have been in the hospital at least 2 weeks. A quarterly report is developed and reported to the Executive Leadership Committee, the Quality Council (QIC) and the Advisory Board. The hospital feels that selecting 7 areas, (identified in white) may allow a more focused effort for improvement.
PROBLEM: The survey demonstrates substantial need for continued improvement in all areas.
STATUS: Overall, more clients have been interviewed for this survey and the percentage of compliance has increased from 66% in the last quarter to 71% during this quarter.
ACTIONS: Nursing staff on each unit will continue to offer medication education opportunities for clients during the
daily medication administration on each unit and document those sessions in the menu driven NAP note (which contains a specific note for medication education.
Client choices and being treated with support and respect in those choices will continue to be emphasized, such as the choice to refuse medications/treatment without reprisals.
Self-expression training to facilitate clients expressing self and increasing a real sense of recovery will be implemented on all units.
Continuity of Care Manager (CCM) staff will develop better mechanisms to incorporate ISPs into treatment planning and to involve CSWs in client treatment/discharge.
Superintendent will continue to hold quarterly “Client Forums” to discuss client concerns. Peer Specialists have developed performance indicators for clients and will continue tracking. A “Rights Handout” will be made available to all clients on admission.
NEXT REPORTING DATE JANUARY 2006

MEDICAL STAFF-INTERNAL PEER REVIEW ASPECT: REVIEW OF MEDICAL STAFF DOCUMENTATION OF PHYSICAL EXAMS OVERALL COMPLIANCE: 59%
Indicator Findings Compliance Threshold Percentile
Total documentation of physical exams reviewed will meet minimum passing requirements as detailed in the “physical exam peer review form.”
13 of 19 notes
68% 90%
All individual practitioners’ documentation of physical exams will meet min passing requirements.
3 of 6 individuals
50% 100%
FINDINGS: In July and September all physical exam documentation rated the passing threshold of 90%; all individual practitioners met the passing threshold of 100%. In August, documentation of 6 physical exams reviewed fell below the passing threshold of 90%; three (3) after -hours practitioners fell below the threshold of 100%.
PROBLEM The overall compliance dropped from 74% in the 4th Quarter FY05 to 59% this Quarter.
STATUS:
Specific individuals were counseled and improvements have been noted. ACTIONS:
Continue to monitor. Individuals counseled about substandard documentation. Discussed at after-hours Medical Staff meeting on October 11, 2005.
NEXT REPORTING DATE: JANUARY 2006
MEDICAL STAFF ASPECT: MEDICAL STAFF PRESCRIBING ERRORS OVERALL COMPLIANCE: 100%
Indicator Findings Compliance Threshold Percentile
Med staff members will have no prescribing errors . 33 Med staff, no errors
100% 90%
FINDINGS:
July: August: September: no prescribing errors
PROBLEM:
None noted as a result of actions steps last Quarter.
STATUS: This Quarter was improved from 86% compliance to 100%. Practitioners meeting threshold.
ACTIONS: Continue to monitor.
NEXT REPORTING DATE: JANUARY 2006
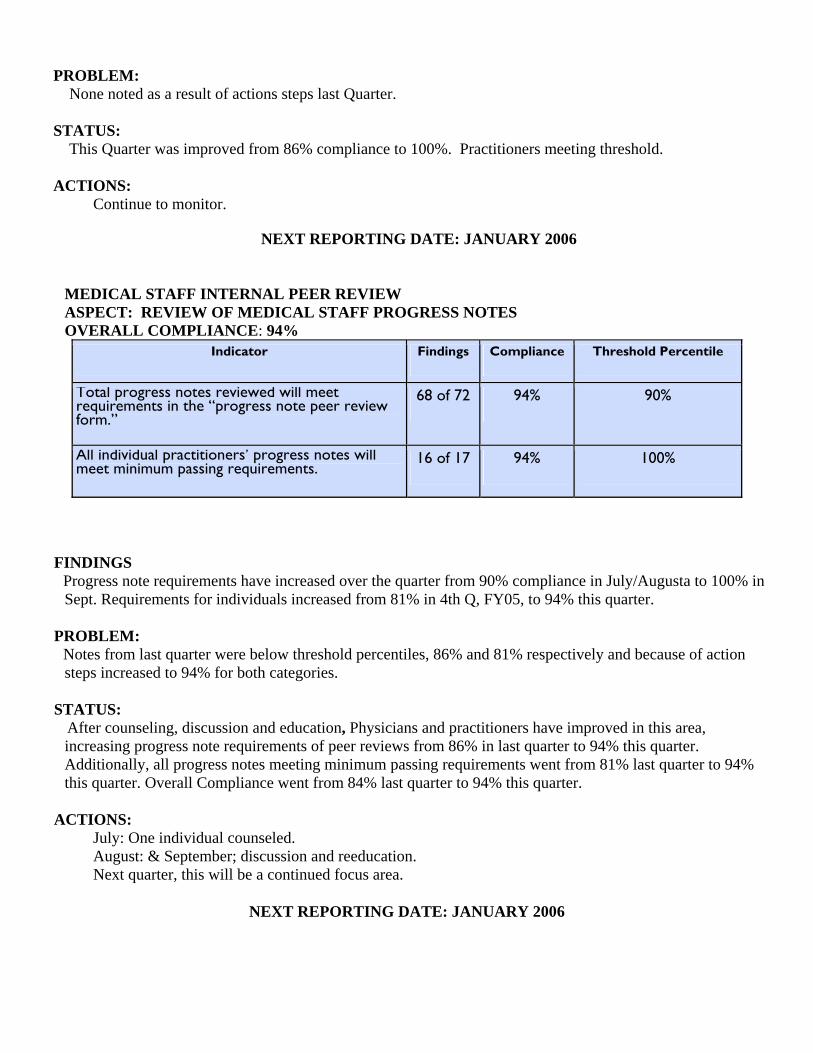
MEDICAL STAFF INTERNAL PEER REVIEW ASPECT: REVIEW OF MEDICAL STAFF PROGRESS NOTES OVERALL COMPLIANCE: 94%
Indicator Findings Compliance Threshold Percentile
Total progress notes reviewed will meet requirements in the “progress note peer review form.”
68 of 72 94% 90%
All individual practitioners’ progress notes will meet minimum passing requirements.
16 of 17 94% 100%
FINDINGS Progress note requirements have increased over the quarter from 90% compliance in July/Augusta to 100% in Sept. Requirements for individuals increased from 81% in 4th Q, FY05, to 94% this quarter.
PROBLEM: Notes from last quarter were below threshold percentiles, 86% and 81% respectively and because of action steps increased to 94% for both categories.
STATUS: After counseling, discussion and education, Physicians and practitioners have improved in this area, increasing progress note requirements of peer reviews from 86% in last quarter to 94% this quarter. Additionally, all progress notes meeting minimum passing requirements went from 81% last quarter to 94% this quarter. Overall Compliance went from 84% last quarter to 94% this quarter.
ACTIONS: July: One individual counseled. August: & September; discussion and reeducation. Next quarter, this will be a continued focus area.
NEXT REPORTING DATE: JANUARY 2006

NURSING ASPECT: MEDICATION ERRORS, SECLUSION & RESTRAINT RELATED TO STAFFING EFFECTIVENESS OVERALL COMPLIANCE: 99%
Indicators Findings Compliance Threshold Percentile
Medication Errors related to staffing effectiveness:
1. Staff mix appropriate 13 of 13 100% 100%
2. Staffing numbers within appropriate acuity level for unit 13 of 13 100% 100%
Seclusion/Restraint related to staffing effectiveness:
1. Staff mix appropriate 93 of 93 100% 100%
2. Staffing numbers within appropriate acuity level for unit 93 of 93 100% 100%
3. Debriefing completed 83 of 93 89% 100%
4. Dr. Orders 93 of 93 100% 100%
FINDINGS: All staff effectiveness indicators are at 100% with the exception of debriefing at 90%.
PROBLEM: None noted and this indicator will be retired shortly
STATUS: Compliance is very high and has shown considerable improvement.
ACTIONS: A new debriefing protocol was developed. All Program Service Directors, Nurse IV’s and NODs were
trained in the process. Reporting will be reduced to semi-annually
NEXT REPORTING DATE: June 2006

NURSING
ASPECT: CODE CART & REDLINING
OVERALL COMPLIANCE: CODE CART 98%; REDLINING 98%
Indicators-Redlining Findings Compliance Threshold Percentile
Lower Kennebec 90 of 93 97% 100%
Upper Kennebec 93 of 93 100% 100%
Lower Saco 177 of 186 95% 100%
Upper Saco 91 of 93 98% 100%
Indicators-Code Cart Sign Off Findings Compliance Threshold Percentile
1) Lower Kennebec 89 of 93 96% 100%
2) Upper Kennebec 91 of 93 98% 100%
3) Lower Saco 93 of 93 100% 100%
4) Upper Saco 88 of 93 95% 100%
5) NOD Building Control 93 of 93 100% 100%
6) NOD Staff Room I 580 93 of 93 100% 100%
FINDINGS: Compliance with both redlining and crash cart sign offs are running at 98%. This is continually improving.
PROBLEM: Three of the units’ code carts are still not at 100%.
STATUS: Both of these areas are improving each quarter.
ACTION: Each individual identified not completing either function has received and will receive individual
counseling and quality assurance alert.
NEXT REPORTING DATE: JANUARY 2006

URSING ASPECT: PAIN MANAGEMENT OVERALL COMPLIANCE 81%
Aspect Indicator Findings Compliance Threshold
Assessment Assessed upon admission. 92 of 95 97% 85%
If pain present., plan identified. 14 0f 27 54% 100%
Assessed using pain scale. 49 of 54 91% 100%
New complaints assessed using 5 of 9 55% 100%
Plan identified. 4 of 14 29% 100%
Reassessment Acute: every 2 hours. 19 of 26 73% 100%
a. 60 min. post analgesic 7 of 10 70% 100%
Chronic: weekly 7 of 12 58% 100%
Assessed using pain scale. 8 of 12 67% 100%
Findings:
Thirteen audited charts, identifying pain as a problem, did not have evidence of a care plan associated with that problem. If the pain was a chronic condition and was not acute, a medical care plan was not initiated. When it was not actively being treated as the problem, the plan was deferred. This accounted for the majority of this category. In 5 of the charts audited, pain was assessed as a response, not using the pain scale. In 4 charts, new complaints of pain were assessed using the pain scale but did not include the full-page pain questionnaire when it was a complaint relating to headache or other isolated conditions requiring non-narcotic pain relief. This also was the contributing factor to the low compliance in the initiation of a care plan. The assessment of acute pain every two hours was inhibited in 5 cases due to the client being unavailable for reassessment, i.e. at the mall, asleep, etc. The auditor counted asleep as not reassessed. Reassessment of chronic pain every two weeks was again not completed in those cases of chronicity that were not receiving active acute treatment. Reassessment utilizing the pain scale did not occur in 4 of the audited charts.
Problems: In cases of chronic pain assessed upon admission that were deferred, there was no documentation of deferment in the admission note. Isolated complaints of pain not requiring a nursing care plan were counted in the audit as not having a nursing care plan. Isolated complaints of pain not requiring a full pain questionnaire were also counted in the audit as not having a pain questionnaire completed. Chronic pain conditions not requiring acute treatment were not documented in the progress notes although it was addressed at the biweekly treatment team meetings as a standard assessment area. Small sample size contributed to a greater variance in non-compliance.

Status: Pain assessment upon admission increased from 95% to 97%. Assessment utilizing a pain scale increased from 75% to 91%. New complaint assessment increased from 25% to 55%. Identification of a plan decreased from 72% to 29%. (The 29% figure is suspect since it was collected by an inexperienced QA staff person no longer here and they counted pain events such as “isolated pain,” headache, which when immediately remedied, does not require a subsequent plan) Reassessment 60 minutes post administration increased from 62% to 70%. Chronic assessment increased from 38% to 58%. Assessment of chronic pain using the pain scale increased from 18% to 67%.
Actions: Clarification of the indicator with those performing audits of the differential of isolated complaints of
pain such as headache that require non-narcotic intervention vs. those that are of greater severity requiring a nursing care plan for purposes of these audits.
Education of the auditors to monitor the treatment plan review summaries for the assessment and reassessment of acute and chronic pain conditions, rather than only auditing the progress notes for documentation of the assessment.
Clarification of the indicators and where to audit the information will occur by the DON with those conducting the audits.
A competency based training on the assessment and reassessment of pain to include the utilization of the pain questionnaire will occur with all RNs by the NS IV or Nurse educator by 1-1-06.
The protocol will be revised by the DON to include assessment of isolated complaints of pain not requiring administration of narcotic pain medication and to clarify the reassessment of deferred chronic conditions not requiring treatment.
In order to increase sample size, pain assessment data will be collected weekly from each unit for every client receiving PRN pain medication for the assessment of pre and post administration pain level.
Pain scales will be added to all PRN stickers to prompt the documentation of the assessment using the pain scale.
NEXT REPORTING DATE JANUARY 2006

NURSING:
ASPECT: CHART REVIEW
OVERALL COMPLIANCE 78 % Indicator Findings Compliance Threshold
Percentile
Universal Assessment
Universal Assessment completed by RN within 24 hours.
89 of 94 95 100%
Sections completed/deferred with documentation.
48 of 87 55% 95%
Initial nursing care plan initiated. 78 of 84 93% 100%
Item's triggered to integrated problem needs list.
70 of 106 67% 90%
All sheets authenticated by assessing RN 69 of 81 85% 100%
Findings:
Of the 5 charts that did not indicate an assessment within 24 hours, 2 assessments were not timed and were done by an RN that is no longer employed with RPC, and 2 charts were audited by an RN no longer employed at RPC who documented an inability to locate all sections of the assessment. Of the 6 charts not including an initial nursing care plan, 3 were by the same RN doing the 2 charts not timed and 3 were audited by the same RN unable to locate the all sections of the assessment.
Problem:
All sections completed or deferred with documentation is at 55%. While the sections on the assessment were deferred, this was not reflected in the admission note in 45% of the audited charts. Using an * to identify identified problems to be included on the problem list is still below threshold. The identified problems were included on the problem list but not identified on the assessment with an * in 33% of the charts audited. While the RNs signed all sheets indicating an RN signature, all sheets were not authenticated in 15% of the charts.
Status:
The compliance has increased from 75 to 78% since last quarter. The universal assessment has increased from 86% in 4th Q-05 to 97 % completion in the 1st Q-06. Initiation of a nursing care plan has increased from 84% to 93%. Items triggered with an * increased from 62% to 67%. All sections completed or deferred decreased from 57% to 55%.
Actions: The nurse educator will reinforce the need to document all deferred sections of the assessment in the
admission note and the need to identify with an asterisk the identified problems on the problem/needs list.
All admissions will be audited within 1 working day of admission to ensure initiation of treatment occurs at time of admission and ensure completeness of the medical record for a more immediate response and corrective action related to initiation of treatment.
Each RN will have competencies completed in the above areas. The admitting RN will complete the admission assessment prior to leaving duty for that shift.
NEXT REPORTING DATE JANUARY 2006
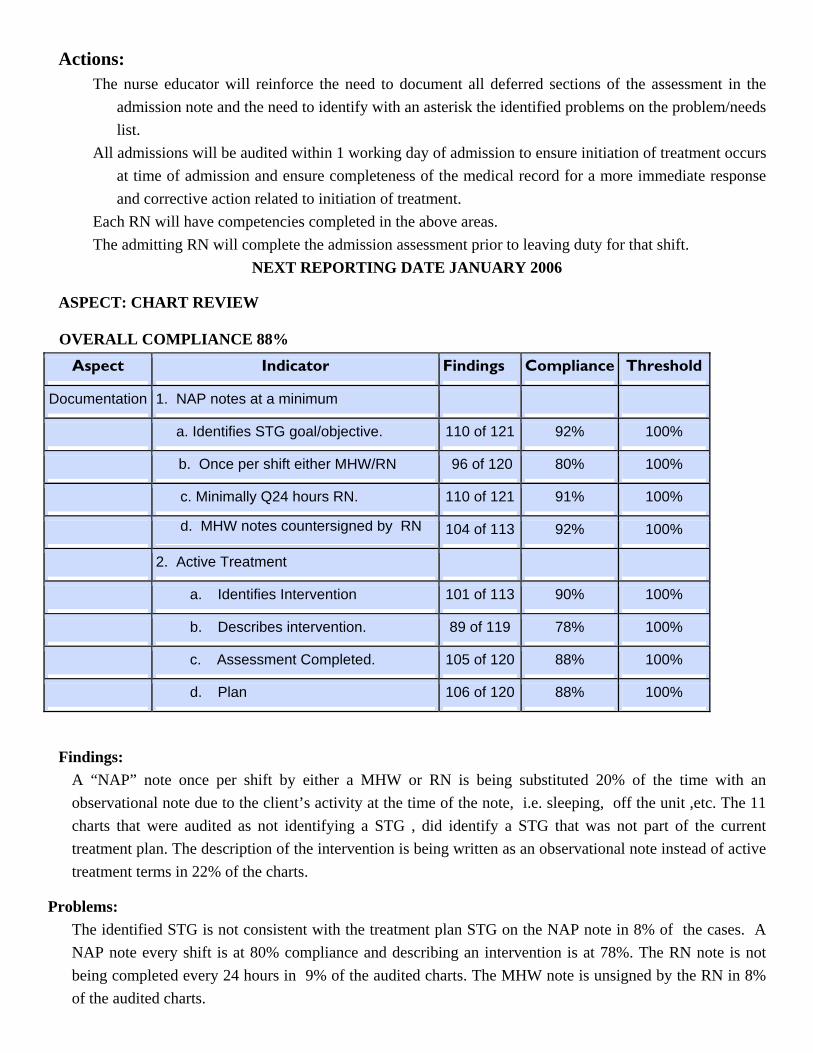
ASPECT: CHART REVIEW
OVERALL COMPLIANCE 88% Aspect Indicator Findings Compliance Threshold
Documentation 1. NAP notes at a minimum
a. Identifies STG goal/objective. 110 of 121 92% 100%
b. Once per shift either MHW/RN 96 of 120 80% 100%
c. Minimally Q24 hours RN. 110 of 121 91% 100%
d. MHW notes countersigned by RN 104 of 113 92% 100%
2. Active Treatment
a. Identifies Intervention 101 of 113 90% 100%
b. Describes intervention. 89 of 119 78% 100%
c. Assessment Completed. 105 of 120 88% 100%
d. Plan 106 of 120 88% 100%
Findings: A “NAP” note once per shift by either a MHW or RN is being substituted 20% of the time with an observational note due to the client’s activity at the time of the note, i.e. sleeping, off the unit ,etc. The 11 charts that were audited as not identifying a STG , did identify a STG that was not part of the current treatment plan. The description of the intervention is being written as an observational note instead of active treatment terms in 22% of the charts.
Problems: The identified STG is not consistent with the treatment plan STG on the NAP note in 8% of the cases. A NAP note every shift is at 80% compliance and describing an intervention is at 78%. The RN note is not being completed every 24 hours in 9% of the audited charts. The MHW note is unsigned by the RN in 8% of the audited charts.

Identification of the intervention is not done in 10% of the charts. Description of the intervention is not occurring in 22% of audited charts it is being written in observational terms. The MHW intervention is not being assessed in 12% of the audited charts. The notes are countersigned but an actual assessment of effectiveness of the intervention did not occur. When the assessment is not completed the plan to change treatment also did not occur.
Status: Overall compliance with documentation increased from 65 % to 88 %. Identification of the STG increased from 71% to 92%. The effort to ensure that a “NAP” note is done on every client every shift has increased from 55% to 80 %. Q 24 hours by an RN increased from 72% to 91%. MHW notes countersigned by RN increased from 77% to 92%. Active treatment documentation increased from 68 % to 86 %. Identification of intervention increased from 68% to 90%. Description of the intervention increased from 57% to 78%. RN completing assessment of MHW intervention increased from 63% to 88%. Identification of new plan increased from 61% to 88%.
Action: The indicator for a NAP note will be changed to include observational notes as appropriate based on client
activity.
The threshold for these indicators will be adjusted from 100% to account for normal expected variances.
The nurse educator has developed and is delivering a comprehensive training on the different types of notes, goal of each note, and components of each type of note to each unit. This material is available on the intranet for use with those staff unable to attend the scheduled trainings.
The Director of Staff Development and the Director of Nursing will develop a “Competency Assessment”, which will identify levels of staff competency, but more importantly, additional training needed unit by unit for staff to fully comply with NAP, Active Treatment, and Comprehensive Service Plan documentation and implementation.
Information gathered from the routine chart reviews will trigger a specific staff “competency assessment,” which in turn will be used to develop specific staff skills training.
NEXT REPORTING DATE JANUARY 2006

NURSING ASPECT: COMPREHENSIVE SERVICE PLAN
This indicator tracks the compliance with aspects of the comprehensive service plan documentation with samples from all units of the hospital.
OVERALL COMPLIANCE 78%
Indicators Findings Compliance Threshold Percentile
1. Initial treatment documented within 24 hours. 47 of 55 85% 100%
2. Preliminary Continuity of Care meeting completed by end of 3rd day.
50 of 59 85% 95%
3. Participation in Prelim. Continuity of Care meeting.
Client 49 of 60 82% 80%
CCM 53 of 60 88% 80%
Family 49 of 60 82% 80%
Comm. 26 of 60 43% 80%
4. Presenting Problem in behavioral terms. 64 of 69 93% 85%
5. Strengths and preferences are identified. 69 of 74 93% 85%
6. Identifies all of client’s long term goals. 41 of 74 55% 85%
7. Comp. Plan complete by the 7th day. 42 of 46 91% 100%
8. Observable behavioral goals are written. 52 of 74 70% 85%
9. Observable behavioral objectives are written. 52 of 74 70% 85%
10. Interventions are identified. 53 of 67 79% 85%
11. Integrated Needs/Assessment
a. Prioritized by scale at bottom of sheet. 57 of 72 79% 85%
b. Contains all needs/ issues/problems. 56 of 72 78% 85%
12. Active medical issues addressed via Medical/ Nursing care plans.
44 of 66 67% 85%
FINDINGS:Charts were reviewed on all four units and summary reports outlining areas of improvement were presented. Areas for improvement were identified throughout all units. Additional training to reach compliance, will need to be provided to all staff on all units.

PROBLEMS:
There were 10 areas of chart review that are below the desired threshold. These will need continued education and review.
STATUS:
On-going chart review by both the Unit PSD on their own unit , as well as reviewing charts on other units, has helped identify needed improvements. With the addition of the Deputy Superintendent for Clinical Services, it is anticipated more hands-on, direct and practical assistance can be provided on the units.
ACTIONS:
As with the case of the earlier description of NAP note documentation and Active Treatment, the Director of Staff Development and the Director of Nursing will develop a “Competency Assessment,” which will identify levels of staff competency, but more importantly, will identify additional training needed, unit by unit, for staff, to fully comply with NAP, Active Treatment, and Comprehensive Service Plan documentation and implementation.
Information gathered from the routine chart reviews will trigger a specific staff “competency assessment, which in turn will be used to develop specific staff skills training.
The Nurse Educator will focus on education sessions, training staff to write long-term goals, by January 1, 2006.
The Nurse Educator within the Office of the Director of Nursing will focus on educational sessions, training staff to write behavioral goals, by January 1, 2006.
Encourage and develop ways to facilitate community workers’ involvement in treatment team meetings including the use of video conferencing or audio attendance.
NEXT REPORTING DATE: JANUARY 2006
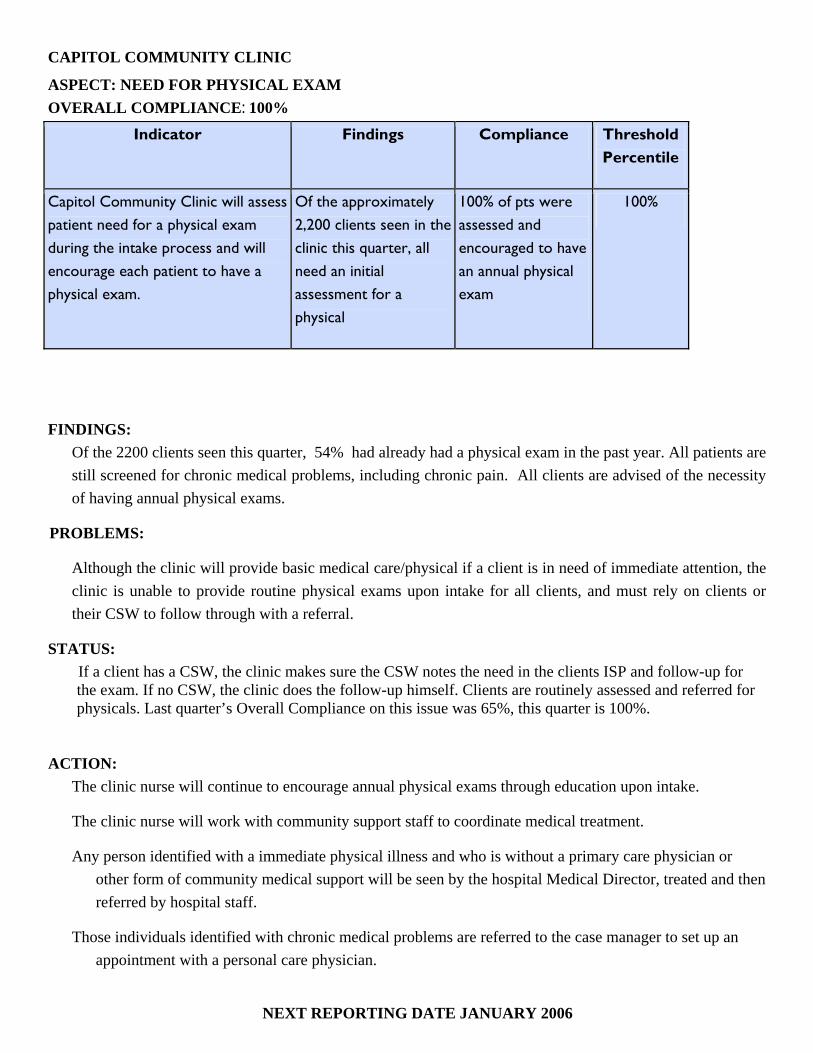
CAPITOL COMMUNITY CLINIC
ASPECT: NEED FOR PHYSICAL EXAM OVERALL COMPLIANCE: 100%
Indicator Findings Compliance Threshold Percentile
Capitol Community Clinic will assess patient need for a physical exam during the intake process and will encourage each patient to have a physical exam.
Of the approximately 2,200 clients seen in the clinic this quarter, all need an initial assessment for a physical
100% of pts were assessed and encouraged to have an annual physical exam
100%
FINDINGS: Of the 2200 clients seen this quarter, 54% had already had a physical exam in the past year. All patients are still screened for chronic medical problems, including chronic pain. All clients are advised of the necessity of having annual physical exams.
PROBLEMS:
Although the clinic will provide basic medical care/physical if a client is in need of immediate attention, the clinic is unable to provide routine physical exams upon intake for all clients, and must rely on clients or their CSW to follow through with a referral.
STATUS: If a client has a CSW, the clinic makes sure the CSW notes the need in the clients ISP and follow-up for the exam. If no CSW, the clinic does the follow-up himself. Clients are routinely assessed and referred for physicals. Last quarter’s Overall Compliance on this issue was 65%, this quarter is 100%.
ACTION: The clinic nurse will continue to encourage annual physical exams through education upon intake.
The clinic nurse will work with community support staff to coordinate medical treatment.
Any person identified with a immediate physical illness and who is without a primary care physician or other form of community medical support will be seen by the hospital Medical Director, treated and then referred by hospital staff.
Those individuals identified with chronic medical problems are referred to the case manager to set up an appointment with a personal care physician.
NEXT REPORTING DATE JANUARY 2006
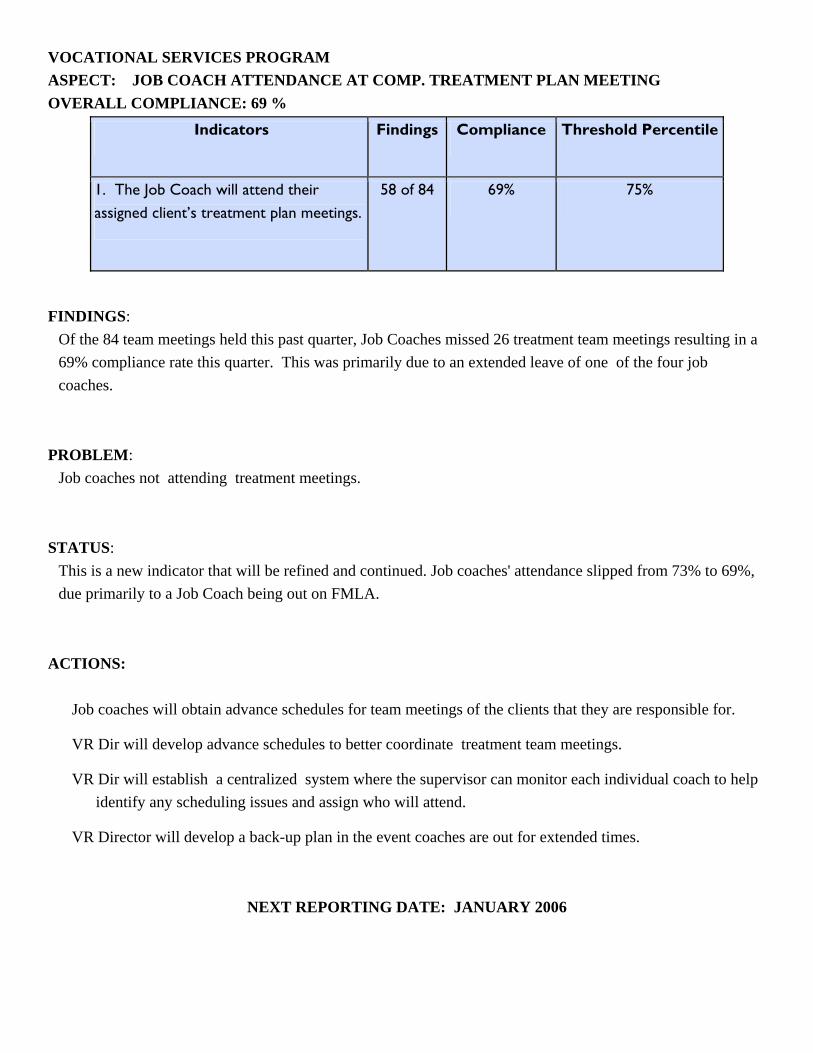
VOCATIONAL SERVICES PROGRAM ASPECT: JOB COACH ATTENDANCE AT COMP. TREATMENT PLAN MEETING OVERALL COMPLIANCE: 69 %
Indicators Findings Compliance Threshold Percentile
1. The Job Coach will attend their assigned client’s treatment plan meetings.
58 of 84 69% 75%
FINDINGS: Of the 84 team meetings held this past quarter, Job Coaches missed 26 treatment team meetings resulting in a 69% compliance rate this quarter. This was primarily due to an extended leave of one of the four job coaches.
PROBLEM: Job coaches not attending treatment meetings.
STATUS: This is a new indicator that will be refined and continued. Job coaches' attendance slipped from 73% to 69%, due primarily to a Job Coach being out on FMLA.
ACTIONS:
Job coaches will obtain advance schedules for team meetings of the clients that they are responsible for.
VR Dir will develop advance schedules to better coordinate treatment team meetings.
VR Dir will establish a centralized system where the supervisor can monitor each individual coach to help identify any scheduling issues and assign who will attend.
VR Director will develop a back-up plan in the event coaches are out for extended times.
NEXT REPORTING DATE: JANUARY 2006

HEALTH INFORMATION SERVICES ASPECT: CONFIDENTIALITY
OVERALL COMPLIANCE: 100%
Indicators Findings Compliance Threshold Percentile
All client information released from the Health Information department will meet all JCAHO, State, Federal & HIPAA standards.
All requests met standards. 100% 100%
All new employees/contract staff will attend confidentiality/HIPAA training.
8 new staff in July, 9 in Aug. 6 in Sept.
100% 100%
The Director of Health Information will track the number of confidentiality/privacy issues through incident reports.
0 for July, 0 for August, and 0 for September 100% 100%
FINDINGS: The indicators are based on the review of all requests for information, orientation for all new employees/contract staff and confidentiality/privacy-related incident reports. 2325 out of 2325 (100%) requests for information (2038 police checks and 287 requests for client information) were released from the Health Information Department during this quarter. 23 out of 23 (100%) new employees/contract staff attended Confidentiality/HIPAA training. All indicators remained at 100% compliance for quarter 1-FY 2006.
PROBLEM: None found. Still, the introduction and compliance with current law and HIPAA regulations needs to be strictly adhered to, requiring training, education, and policy development at all levels.
STATUS: No issues during quarter 1. Continue to monitor.
ACTIONS: All staff have confidentiality/HIPAA training upon hire and annually. The above indicators will continue to be monitored.
NEXT REPORTING DATE: JANUARY 2006

HEALTH INFORMATION SERVICES
ASPECT: DOCUMENTATION & TIMELINESS
OVERALL COMPLIANCE: 95%
Indicators Findings Compliance Threshold
Percentile
Records will be completed within JCAHO standards, state
There were 18 discharges in July. Of those, 15 were completed by 30 days.
83% 80%.
For the 28 discharges in August.,, 24 were completed within 30 days.
86% 80%.
There were 21 discharges in September. 18 were completed within
86% 80%
Discharge summaries will be completed within 15 days of
17 out of 18 were completed within 15 days in July.
94% 100%.
27 out of 28 were completed within 15 days in August. 96% 100%
20 out of 21 were completed within 15 days in September.
95% 100%
Forms used in the medical record will be reviewed by the
0 forms were approved/revised in July. 100% 100%
0 forms were approved/revised in August
100% 100%
0 forms were approved/revised in September
100% 100%
Medical transcription will be timely & accurate.
no errors/issues in April. 100% 90%
no errors/issues in May. 100% 90%
no errors/issues in June. 100% 90%

FINDINGS:
For records completed in 30 days, there was an 85% average compliance rate. For discharge summaries completed within 15 days, there was a 95% average compliance rate. For both correct forms used and medical transcription accuracy, there was 100% compliance for both.
PROBLEMS:
Records completed within 30 days and the discharge summary completion remains above the threshold. Last quarter data was at 86% compliance for this indicator, this quarter’s average is 85%. For discharge summaries, last quarter was at 89% compliance, this quarter’s total is 95%. All other indicators were at 100% compliance.
STATUS:
Overall 95% compliance this quarter as compared with 94% last quarter.
ACTIONS:
All medical staff receive weekly notification regarding “charts needing attention.”
Medical Staff are notified via telephone call and/or e-mail regarding any discharge summaries that need to be completed prior to deficiency.
The indicators will continue to be monitored.
Two physicians are responsible for most of the late documentation and their names are forwarded to the Medical Director.
NEXT REPORTING DATE: JANUARY 2006
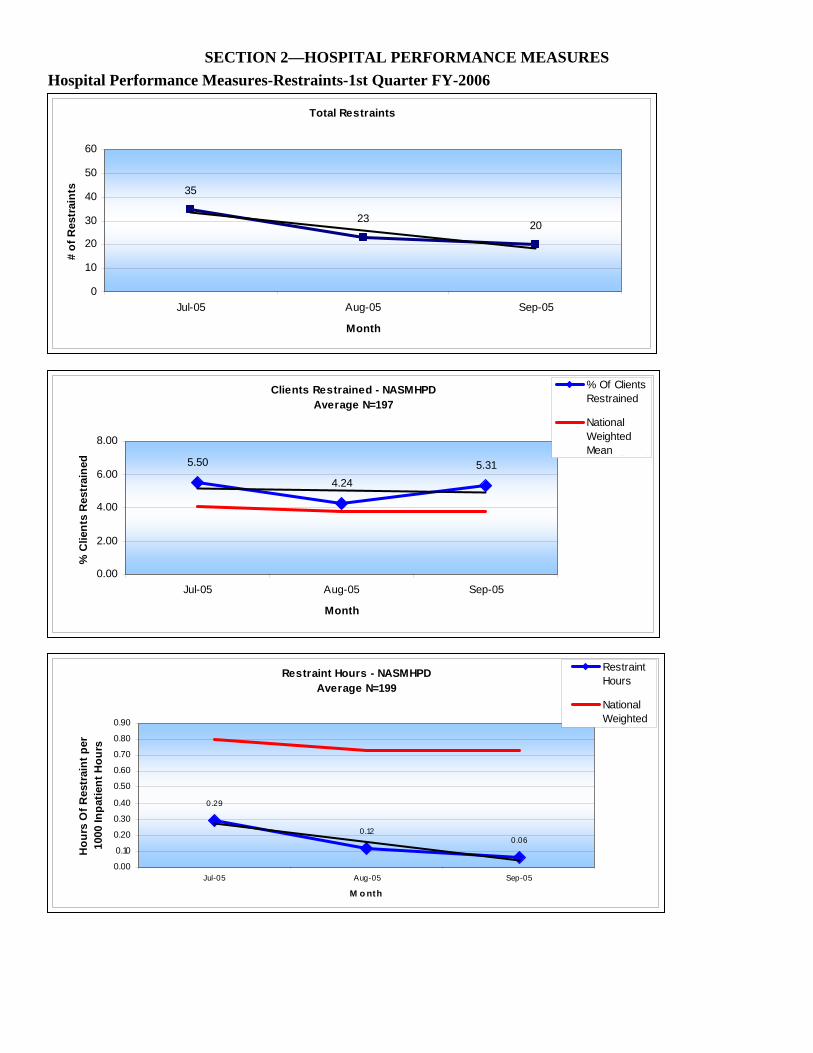
SECTION 2—HOSPITAL PERFORMANCE MEASURES Hospital Performance Measures-Restraints-1st Quarter FY-2006
Total Restraints
35
23 20
0
10
20
30
40
50
60
Jul-05 Aug-05 Sep-05
Month
# of
Res
trai
nts
Clients Restrained - NASMHPDAverage N=197
5.50
4.245.31
0.00
2.00
4.00
6.00
8.00
Jul-05 Aug-05 Sep-05
Month
% C
lient
s R
estr
aine
d
% Of ClientsRestrained
NationalWeightedMeanLi (% Of
Restraint Hours - NASMHPDAverage N=199
0.29
0.120.06
0.00
0.10
0.20
0.30
0.40
0.50
0.60
0.70
0.80
0.90
Jul-05 Aug-05 Sep-05
M o nth
Hou
rs O
f Res
trai
nt p
er
1000
Inpa
tient
Hou
rs
RestraintHours
NationalWeighted
Restraints by Type
31
18 19
4 510
5
10
15
20
25
30
35
Jul-05 Aug-05 Sep-05
Month
# of
Res
trai
nts Hands on
Restraint
MechanicalRestraint
Average Length of Mechanical Restraint
3.58
1.08 0.88
0.000.501.001.502.002.503.003.504.00
Jul-05 Aug-05 Sep-05
Month
Hou
rs
Average Length of Hands On Restraint
12 119
0
5
10
15
20
25
30
Jul-05 Aug-05 Sep-05
Month
Min
utes

HOSPITAL PERFORMANCE MEASURES DISCUSSION
The Hospital continues to show measured and significant improvements in the reduction of the use of restraints.
Total restraints have decreased from a high of 46 in March 2004 (not presented on this quarters chart, but data available) , to 35 in July 2005, to 20 in September 2005. This is a 43 % reduction for this quarter (Jul-Sept) and a 46% reduction since March 2005.
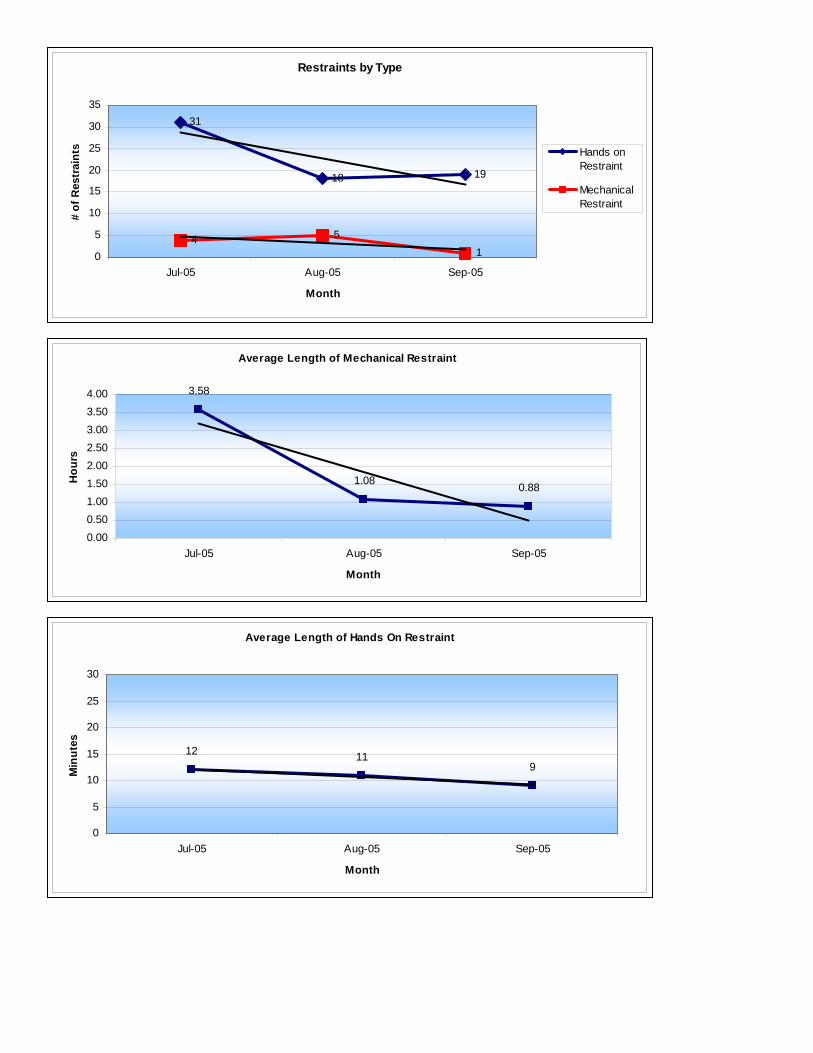
The types of restraints used have also decreased this quarter, with hands-on restraints going from
a high of 31 in Jul 2005 to 19 in September. This is a 39% reduction. The more remarkable reduction is seen in the use of mechanical restraints, which went from a
high of 15 in March 2005 (data not shown in this quarter, but available) to 1 in Sept. 2005, a 93% reduction. The % reduction for just FY06 (Jul-Sept) is 75%.
Finally, the average length of time someone spent with hands on restraint went from a high of 28
minutes in February 2005 (again not shown but available) to 12 minutes in July 06, to 9 minutes in September 2005. This is a 33% reduction this quarter and a 71% reduction since Feb 2005.
Hands on restraint is a technique for holding a client to keep him/her safe that is much less restrictive than mechanical restraints. Although staff is encouraged to use this technique to avoid mechanical, the expectation is that the time clients actually spend in this hold will be short. The average length of hands on restraint has been decreasing steadily since February. This shows an increased understanding of and use of the skills involved in NAPPI. Similar reduction in time is also noted for the use of mechanical restraints. The goal is to decrease the number of events as well as the time it takes for a client to resume being safe. RPC staff has been working to decrease the length of time in hands on restraint. The training for staff has been ongoing for the past year, as all staff has had the initial training and is now beginning their recertification. When a client is in restraints, the treatment team will meet to review and adjust the treatment plan to decrease such events. Five point restraints have dramatically decreased as staff are using hands on restraints more frequently. Adoption of and comprehensive staff training in the Recovery approach, training in DBT, debriefings after all restraint events, engagement plans, training and re-training in the principles and techniques of NAPPI, adjustments in the Clients Comprehensive Service Plans, have all collectively contributed to these reductions. However, it is important to note the mere absence of restraints, although impressive, is in itself, an insufficient indicator. The primary “substitute” of restraints has been an aggressive move to more active treatment and earlier therapeutic interventions. The goal for Riverview remains clear. Aggressive use of active treatment through out the hospital by a well trained staff will move Riverview toward a restraint free hospital.
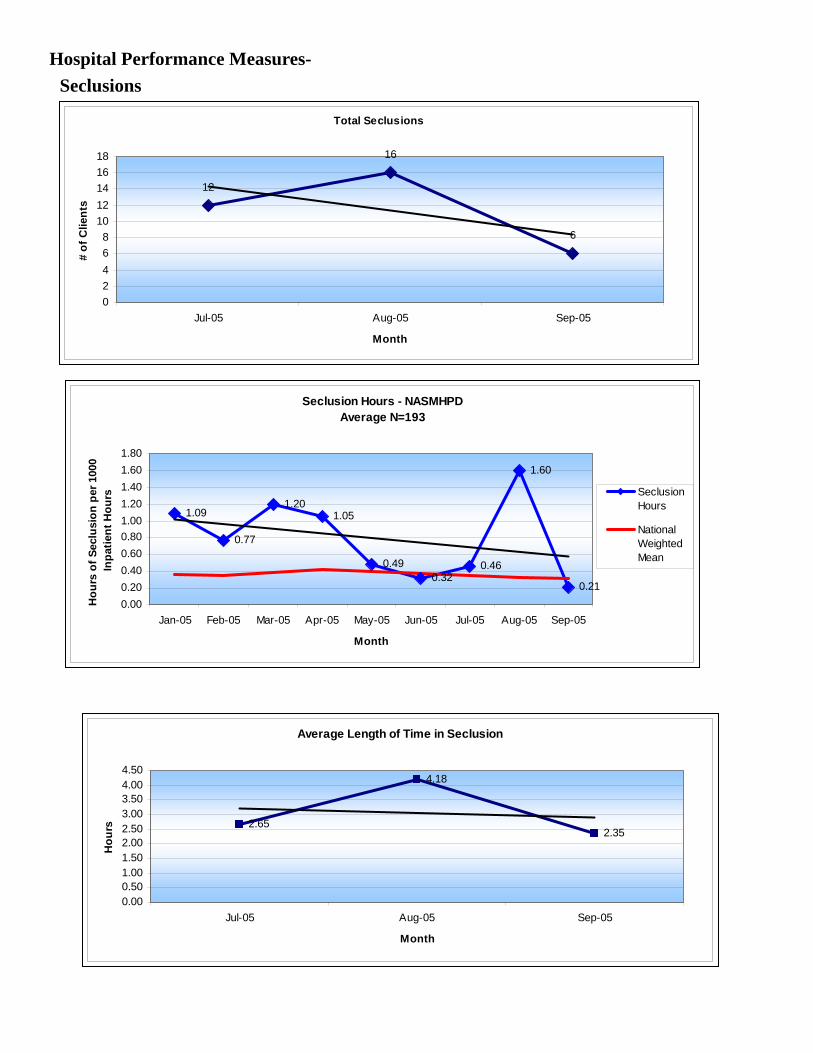
Hospital Performance Measures-Seclusions
Total Seclusions
12
16
6
02468
1012141618
Jul-05 Aug-05 Sep-05
Month
# of
Clie
nts
Seclusion Hours - NASMHPDAverage N=193
1.09
0.77
1.201.05
0.490.32
0.46
1.60
0.210.000.200.400.600.801.001.201.401.601.80
Jan-05 Feb-05 Mar-05 Apr-05 May-05 Jun-05 Jul-05 Aug-05 Sep-05
Month
Hou
rs o
f Sec
lusi
on p
er 1
000
Inpa
tient
Hou
rs SeclusionHours
NationalWeightedMean
Average Length of Time in Seclusion
2.65
4.18
2.35
0.000.501.001.502.002.503.003.504.004.50
Jul-05 Aug-05 Sep-05
Month
Hou
rs

HOSPITAL PERFORMANCE MEASURES DISCUSSION
Like restraints, use of seclusion since January 05 (see prior quarterly reports) had been decreasing. In August, there was a significant spike, in the use of seclusion and the average length of time clients spent in seclusion. This was a result of a need of 1 client to use seclusion extensively to feel safe and control behavior. 1 client accounted for 59% of all events ( 10 of 17 ) and 73% of the time spent in seclusion. The following month, September, both the use and average time in seclusion dropped back to pre-August levels. Data for this chart includes Jan 2005 pulled forward in order to provide the reader a context for the August spike. The goal of the hospital is to decrease the number of events as well as the time it takes for clients to resume being safe. In several instances, unit staff used seclusion as a way for the client to regain control without continuing dys-control in the common areas of the units. Riverview continues to work to identify strategies to reduce utilization and duration of seclusion. The problem continues to be the need to use seclusion at all as we strive to work with clients in varying therapeutic manners and eliminate seclusion. Riverview continues to train staff on principles of NAPPI which decreases the use of seclusion as the staff become more expert in the techniques. Hospital Performance Measures-ALOS FOR HOSPITAL
DISCHARGES
F Y 2 0 0 5 / 2 0 0 6 A L O S F o r D i s c h a r g e s
6 4 . 1 7
5 5 . 7 8
6 6 . 9 7
7 5 . 7 5
5 6 . 1 2 5 5 . 3 4
3 6 . 1 5
4 3 . 4 7
0
1 0
2 0
3 0
4 0
5 0
6 0
7 0
8 0
Q 2 2 0 0 5 C iv i l = 5 7F o r e n s ic = 3 2
Q 3 2 0 0 5 C iv i l= 6 9F o r e n s ic = 2 8
Q 4 2 0 0 5 C iv il = 5 6F o r e n s ic = 3 5
Q 1 2 0 0 6 C iv il = 4 8F o r e n s ic = 1 8
Q u a r t e r
Ave
rage
Day
s
C iv i l A L O S
F o r e n s ic A L O S
Calculation: Civil ALOS = Total Civil Patient days / Total Civil Discharges for the reporting period
Forensic ALOS = Total Forensic Patient days / Total Forensic Discharges for the reporting period
HOSPITAL PERFORMANCE MEASURES DISCUSSION
The hospital operates two distinct units for both the civil and the forensic population. The forensic units consist of Upper and Lower Saco Units. The hospital’s Upper Saco unit houses the long stay NCR clients and is really not reflected in this chart since there are so few discharges of these clients in any given quarter. The forensic population that is reflected in this chart includes the short-term jail transfers, clients undergoing Stage III evaluations for competency, and ISTs. The average length of stay for the civil client is increasing over the past 3 quarters, while the average length of stay for the forensic unit has been decreasing. This decrease in the forensic stays may be influenced by new initiatives by the hospital with the Correctional System. These initiatives are improving the flow of critical information (specifically treatment plans), the transfer of clients, and the follow-up by the hospital once the client is returned. The Department has initiated regular discharge meetings with community personnel to facilitate placements, and the hospital provides a weekly report on all clients deemed ready for discharge to the Central and Regional Office.
Hospital Performance Measures-Hospital Stay/Discharge Data
Q1 2006 Admission to Discharge Readiness Date - ALL CLIENTS
35.78
116.88
24
57
0
20
40
60
80
100
120
140
Lower Kennebec N=23 Upper Kennebec N=17
Day
s AverageMedian
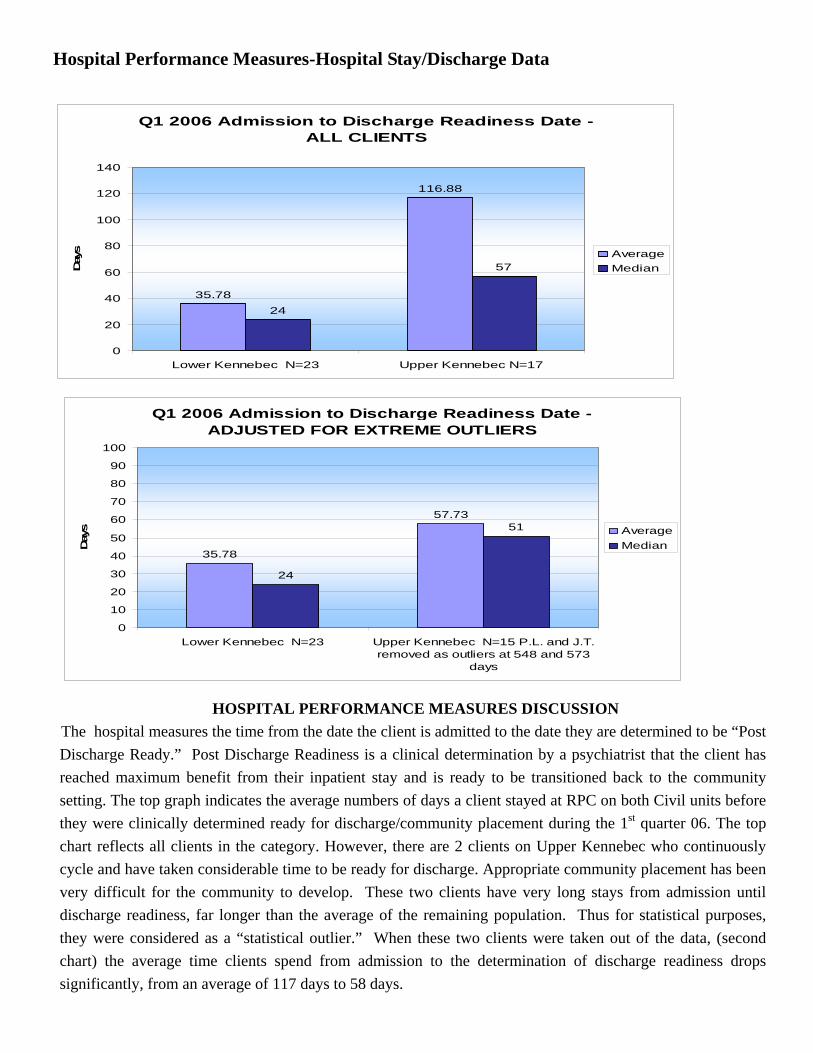
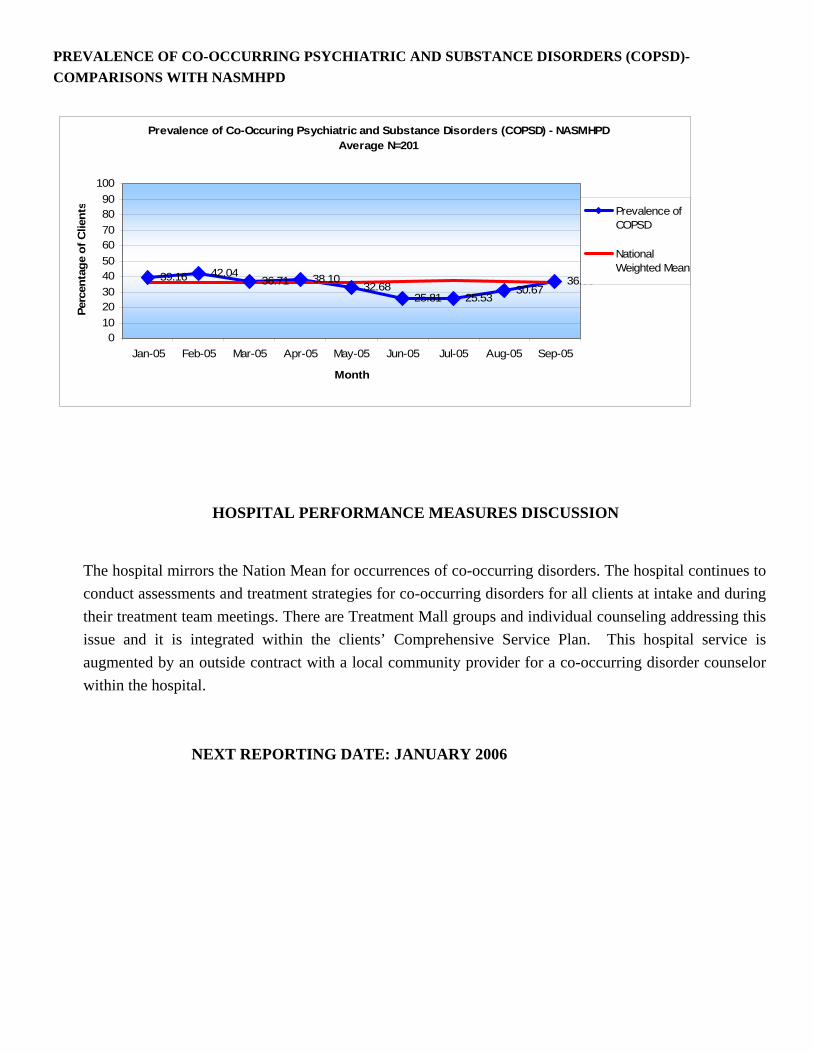
HOSPITAL PERFORMANCE MEASURES DISCUSSION The hospital measures the time from the date the client is admitted to the date they are determined to be “Post Discharge Ready.” Post Discharge Readiness is a clinical determination by a psychiatrist that the client has reached maximum benefit from their inpatient stay and is ready to be transitioned back to the community setting. The top graph indicates the average numbers of days a client stayed at RPC on both Civil units before they were clinically determined ready for discharge/community placement during the 1st quarter 06. The top chart reflects all clients in the category. However, there are 2 clients on Upper Kennebec who continuously cycle and have taken considerable time to be ready for discharge. Appropriate community placement has been very difficult for the community to develop. These two clients have very long stays from admission until discharge readiness, far longer than the average of the remaining population. Thus for statistical purposes, they were considered as a “statistical outlier.” When these two clients were taken out of the data, (second chart) the average time clients spend from admission to the determination of discharge readiness drops significantly, from an average of 117 days to 58 days.
Q1 2006 Admission to Discharge Readiness Date - ADJUSTED FOR EXTREME OUTLIERS
35.78
57.73
24
51
0
10
20
30
40
50
60
70
80
90
100
Lower Kennebec N=23 Upper Kennebec N=15 P.L. and J.T.removed as outliers at 548 and 573
days
Day
s AverageMedian

Hospital Performance Measures-Discharges
Median Vs. Average for Post Readiness Discharge For Those Discharged Q1 2006 - ALL CLIENTS
17
4346.82
40.56
05
101520253035404550
Lower Kennebec (N=17) Upper Kennebec (N=9)
Day
s
Median
Average
HOSPITAL PERFORMANCE MEASURES DISCUSSION
The hospital also collects data on the time that a client will spend in the hospital after they have been determined ready for discharge, and when they are actually discharged. For Upper Kennebec the average time is 40 days. For Lower Kennebec, the admissions unit, a similar issue of the presence of a “statistical outlier” arose. Due to the clinical fit of the LK treatment team with a particular client, that unit worked with and developed a treatment/discharge plan for a complicated client. This client spent a long time, past discharge readiness on LK, while a very specific community placement was developed. The inclusion of this client into the data increased the average length of time on that unit considerably. When the single client was taken out of the data, the average time dropped from 47 days to 23 days (more in line with the experience of that unit)
NEXT REPORTING DATE: JANUARY 2006
Median Vs. Average for Post Readiness Discharge For Those Discharged Q1 2006 - ADJUSTED FOR
EXTREME OUTLIERS
15.5
43
22.94
40.56
05
101520253035404550
Lower Kennebec (N=16) **C.T Removedas an Outlier at 429 Days
Upper Kennebec (N=9)
Day
s
Median
Average

POST DISCHARGE READINESS—BY REGION
P os t D isc ha rge R e a din es s Q 1 2 00 6 by R e gio n
32
1
9
7
32
1 1
0 01
00 0 01
0
2
4
6
8
10
12
0 - 5 D a ys 6 - 1 5 D a ys 16 - 30 D a ys 3 1+ D ays
# o
f Clie
nts
Re gion 1
Re gion 2
Re gion 3
Un know n/Out- of-State
HOSPITAL PERFORMANCE MEASURES DISCUSSION
The length of stay for clients at Riverview has increased over the past quarter as the more difficult to place clients seem to recently be staying longer. Last quarter, 10 of 44 clients (23%) were discharged within 3 days, this quarter 10 of 40 clients (25%) were discharged. Last quarter 18 of 44 clients ( 40%) were discharged within 15 days. This quarter, 15 of 40 clients (38%) were discharged. Last quarter, 25 of 44 clients (57%) were discharged within 30 days. For the first quarter of 06, 19 of 40 clients (48%) were discharged within 30 days. Proportionately, regions have approximately the same placement percentages.
NEXT REPORTING DATE: JANUARY 2006

Hospital Performance Measures- READMISSIONS
30 Day Readmit (Discharge Cohort) - NASMHPDAverage N=201
0.00
16.00
11.43
8.11
4.55
0.00
5.88
0.00
8.00
0.002.004.006.008.00
10.0012.0014.0016.0018.00
Jan-05 Feb-05 Mar-05 Apr-05 May-05 Jun-05 Jul-05 Aug-05 Sep-05
Month
% R
eadm
issi
on
% Readmitted
NationalWeighted Mean
HOSPITAL PERFORMANCE MEASURES DISCUSSION
The graphs depicting the 30-day readmission rate show mixed results with a continued decrease for the measurement period.
NEXT REPORTING DATE: JANUARY 2006
Hospital Performance Measures-Voluntary and Involuntary Admission
Q 2 2 0 0 5 - Q 1 2 0 0 6 V o l u n t a r y v s . I n v o l u n ta r y A d m i ss i o n s
V o l u n t a ry N = 9 5 ,
2 7 . 4 6 %
In vo lu n t a r y N = 2 5 1 , 7 2 .5 4 %

HOSPITAL PERFORMANCE MEASURES DISCUSSION
During the 2nd quarter 2004-2005(Q2) Voluntary Admissions were 27, Involuntary Admissions were 65,
during the 3rd quarter 2004-2005(Q3) Voluntary Admissions were 25, Involuntary Admissions were 70 ,
during the 4th quarter 2004-2005(Q4) Voluntary Admissions were 27, Involuntary Admissions were 62,
during the 1st quarter 2005-2006 (Q1) Voluntary Admissions were 16, Involuntary Admissions were 53. The
proportion of voluntary admissions to involuntary admissions has not appreciably changed over the past 9
months as shown above, and historical data for the prior year indicates the same.
CLIENT INJURY RATE - COMPARISONS NASMHPD
Client Injury Rate - NASMHPDAverage N=156
0.54
0.87
0.52
0.27 0.26
0.850.78
0.26
0.53
0.10
0.30
0.50
0.70
0.90
1.10
1.30
1.50
Jan-05 Feb-05 Mar-05 Apr-05 May-05 Jun-05 Jul-05 Aug-05 Sep-05
Month
Inju
ries
Per 1
000
Pt. d
ays
Client Injury
National WeightedMean
HOSPITAL PERFORMANCE MEASURES DISCUSSION
Client injury reported to NASMHPD includes injuries when a client incurs physical harm that requires medical treatment more intensive than minor first aid. This chart includes injuries that are the result of accidents from unintentional occurrences such as slips, trips, falls or injuries sustained during a seizure; assault when a client is injured by another client; self-inflicted injuries resulting from deliberate actions by a client such as punching a wall or cutting; and injuries when the cause is not determined. The client injury graph shows Riverview Psychiatric Center’s 1st Quarter FY2006 average injury rate to have declined from the 4th Quarter FY2005 data. The increase seen in June (still below 1SD of the National Mean) was attributed to the Self-Injurious Behavior (SIB) of two clients. The spike in Sept 04 was attributed to 6 instances of SIB for 3 clients. The general trend, when averaged by quarter, continues to decrease.Direct care staff have had the opportunity to learn more about SIB, how to work with clients who display such behavior (what works and what does not) through classes required for direct care staff and offered by a staff psychologist over the last three months. When clients demonstrate SIB, individual client treatment plans are adjusted to try to avert future incidents.

NEXT REPORTING DATE: JANUARY 2006
ELOPEMENT RATE-COMPARISONS WITH NASMHPD
Elopement Rate - NASMHPDAverage N=189
0.81
0.00
0.26
0.00
0.26 0.28 0.26 0.26
0.53
0.00
0.10
0.20
0.30
0.40
0.50
0.60
0.70
0.80
0.90
Jan-05 Feb-05 Mar-05 Apr-05 May-05 Jun-05 Jul-05 Aug-05 Sep-05
Month
Elop
emen
t Per
100
0 Pt
. day
s
Elopment Rate
NationalWeighted Mean
HOSPITAL PERFORMANCE MEASURES DISCUSSION
The definition of elopement is when clients are absent without authorization regardless of their leave status. A client is considered to have eloped if the client has not been accounted for when expected to be present and has not been found on the grounds of the facility or has left the grounds of the facility without permission. The above chart captures all clients (voluntary as well as involuntary, and both civil and forensic) who were reported as having been absent without leave or on unauthorized leave on a given month. Elopement decreased to zero in April and one each in May, June, July and August. The January increase triggered a request by the hospital for an outside review of the elopements coupled with internal examination of risk assessments. This review resulted in the reduction from Feb –Aug of this year. The hospital realizes more study/preventative interventions need to occur and have developed a PIT.
NEXT REPORTING DATE: JANUARY 2006

Hospital Performance Measures -MEDICATION ERROR RATE-COMPARISONS WITH NASMHPD
Medication Error Rate - NASMHPDAverage N=122
4.31
1.59
7.14
5.174.10
3.17 3.64
10.08
4.39
0.00
2.00
4.00
6.00
8.00
10.00
12.00
Jan-05 Feb-05 Mar-05 Apr-05 May-05 Jun-05 Jul-05 Aug-05 Sep-05
Month
Med
Err
ors
Per 1
00 E
piso
des
Of
care
Medication ErrorRate
National WeightedMean
HOSPITAL PERFORMANCE MEASURES DISCUSSION
Hospital error rates have fluctuated between 0.00 in Sept 04 and 10.08 errors per 100 episodes of care in Aug 05. The increasing error rate is troubling and attributed in large part to three factors. First, there continues to be emerging issues with the Acudose machines currently being used by the hospital. Riverview is now negotiating a system upgrade to address this issue or may go with another type of automated dispensing system. This decision will be made within the next month. Additionally, the entire pharmacy staff turned over in August and the new staff had to learn the dispensing procedures here at Riverview with McKesson and Acudose. Third, the introduction of the Medication Variance Reporting system, encouraging med error reporting, has also had the desired effect of an initial increase in med error reporting. The new pharmacy staff have been trained and are becoming more familiar with the system. As med errors are reported under the Medication Variance Report, they are immediately addressed and corrected by the medical staff. Additionally, the Medication Error Committee continues to meet on a monthly basis to analyze and compile medication error rates. RPC continues to be concerned with periodic incidents of type I (NASPMHD reportable) errors. Finally, RPC is undertaking an initiative to go to a "primary nursing" model, which should lessen the pressure on the medication nurse to pass a lot of medications quickly. RPC has increased the window of time to complete a scheduled medication pass from one hour to two hours, again reducing time pressures on the medication nurse.
NEXT REPORTING DATE: JANUARY 2006

NEW GENERATION ANTIPSYCHOTIC USE-COMPARISON WITH NASMHPD
New Antipsychotics Use - NASMHPDAverage N=115
89.090.4 90.4
92.9
90.1
92.9
88.089.6
84.9
83
88
93
98
Jan-05 Feb-05 Mar-05 Apr-05 May-05 Jun-05 Jul-05 Aug-05 Sep-05
Month
% R
ecei
ving
New
Ant
ipsy
chot
ic
NewAntipsychoticUseNational WeightedMean
HOSPITAL PERFORMANCE MEASURES DISCUSSION
For twelve months RPC tracked the percentage of all antipsychotic prescriptions that were represented by the atypicals. The National benchmark 9 +/- 6 percent was established by NASPMHPD. This goal was endorsed by the hospital's Medical Staff as desirable. For 8 of 12 data points the hospital was within the mean +/- the standard deviation. In 3 of 12 observations the hospital was below the standard deviation. The overall trend was positive, with all 3 substandard data points occurring in the early months of the observation. In July 2005 there was a drop in usage to 88 % which rose again in August to 89% but that remains slightly below what NASMHPD would like. This remains an area that is discussed at the monthly Pharmacy and Therapeutics Committee meetings. Physicians are encouraged to use more atypical antipsychotics. The Medical Director will analyze occurrences of persons with a primary thought disorder that are not receiving new generation medications and report to the Med Exec and Executive Leadership Committee as needed.
NEXT REPORTING DATE: JANUARY 2006
PREVALENCE OF CO-OCCURRING PSYCHIATRIC AND SUBSTANCE DISORDERS (COPSD)-COMPARISONS WITH NASMHPD
Prevalence of Co-Occuring Psychiatric and Substance Disorders (COPSD) - NASMHPDAverage N=201
39.16 42.0436.71 38.10
32.6825.81 25.53
30.6736.55
0102030405060708090
100
Jan-05 Feb-05 Mar-05 Apr-05 May-05 Jun-05 Jul-05 Aug-05 Sep-05
Month
Perc
enta
ge o
f Clie
nts Prevalence of
COPSD
NationalWeighted Mean
HOSPITAL PERFORMANCE MEASURES DISCUSSION
The hospital mirrors the Nation Mean for occurrences of co-occurring disorders. The hospital continues to conduct assessments and treatment strategies for co-occurring disorders for all clients at intake and during their treatment team meetings. There are Treatment Mall groups and individual counseling addressing this issue and it is integrated within the clients’ Comprehensive Service Plan. This hospital service is augmented by an outside contract with a local community provider for a co-occurring disorder counselor within the hospital.
NEXT REPORTING DATE: JANUARY 2006

NOTES