performance evaluation wpan of rn-42 bluetooth based (802...
TRANSCRIPT

(IJACSA) International Journal of Advanced Computer Science and Applications,
Vol. 9, No. 12, 2018
612 | P a g e
www.ijacsa.thesai.org
Performance Evaluation WPAN of RN-42 Bluetooth
based (802.15.1) for Sending the Multi-Sensor LM35
Data Temperature and RaspBerry pi 3 Model B for
the Database and Internet Gateway
Puput Dani Prasetyo Adi
Micro - Electronics Research Laboratory
Kanazawa University
Kanazawa, Ishikawa, Japan
Akio Kitagawa
Micro - Electronics Research Laboratory
Kanazawa University
Kanazawa, Ishikawa, Japan
Abstract—This research will be a test of a multi-sensor data
transmission using the Wireless Sensor Network based on
Bluetooth RN-42. Accordingly this research, LM35 is a type of
Temperature Sensor, furthermore, this research will be used two
LM35 sensors installed on the Arduino board and to be
processed by Arduino Integrated Development of Environment
(IDE) with C++ language. Arduino will be sending of all sensor
data from LM35 temperature sensor by Slave RN-42 Bluetooth
Configuration to master RN-42 Bluetooth configuration.
Furthermore, the temperature data will be sending on Raspberry
Pi 3 as an Internet Gateway then data will be sent to the internet
and sensor data will be stored in the MySQL database.
Furthermore, Sensor data can be accessed by other computers on
the internet network using PuTTY with the Raspberry Pi 3 IP
Address 192.168.1.145. Moreover, testing is also done by
measuring the Signal power of Wireless Personal Area Network
with the Receive Signal Strength Indicator variable, so the
Bluetooth signal strength in sending multi-sensor data can be
known appropriately.
Keywords—RSSI; Bluetooth; Raspberry pi 3; Internet Gateway
I. INTRODUCTION
Wireless Sensor Network technology continues to grow rapidly including Bluetooth, one of the advantages of sensor data delivery systems based on Wireless Sensor Network is the Low Power Consumption, currently the technology of Wireless Personal Area Network (WPAN) developed in the world of research by the telecommunications world is Bluetooth Low Energy (BLE), the Bluetooth Low Energy (BLE) specification is (10.1 uA, 3.3 V supply at 120 s interval), therefore the energy needed is the smallest compared to ZigBee (15.7 uA) and ANT (28.2 uA) [1].
In this research using Bluetooth RN-42, one of the advantages of Bluetooth RN-42 is Low power (26 uA sleep, 3 mA connected, 30 mA transmit) but when compared to the energy needed by Bluetooth Low Energy (BLE) adrift to 20 uA, this includes a fairly large value [13], another advantage of Bluetooth RN-42 is compatible with the Arduino Microcontroller, this is because many types of Bluetooth are not compatible with certain types of microcontrollers that are
easy to complete coding programs inside Integrated Development of Environment (IDE) [13].
Wireless Personal Area Network (WPAN) 802.15.1 or Bluetooth is very suitable to be used in short distances areas, unlike ZigBee (802.15.4) which has mesh capability so that more sensor nodes as router nodes will minimize the distance of one node to another node so can minimize the use of battery or power [4]. The standard Bluetooth protocol in sending and receiving data is 2.4 GHz. Bluetooth is used as a data sending device for short-range, another advantage of Bluetooth is low-power and low-cost sensors [10].
Bluetooth can send short-range sensor data approximately less than 100 meters. bluetooth is a Radio Frequency (RF) transmission device using serial communication. Bluetooth devices have an address usually presented as the hexadecimal value [10]. Parameters for the quality of sending Radio Frequency on Bluetooth are using the Received Signal Strength Indicator (RSSI). In this research, the measurement of the Received Signal Strength Indicator (RSSI) values on Bluetooth RN-42 will be measured with different distances so that the distance ratio and RSSI value (dBm) can be known [2].
The sensor used for this research is an LM35 temperature sensor and one of the characteristics of this sensor is that it is sensitive to heat, therefore, This sensor can be implemented in various fields. e.g. monitor the temperature in concrete, this is very important because the amount of heat need to manage properly, one method to monitor on the temperature of the concrete during the hardening process, the sensor used is LM35 [6].
The position of Bluetooth compared to other data sending devices is still popular, with short distance prosperity in addition to audio and stereo communication, Bluetooth is also used to support the Internet of Things (IoT) and Machine to Machine (M2M) application using Bluetooth Low Energy (BLE), therefore it is expected that Bluetooth will remain the device for sending data packages to date [5].
(IJACSA) International Journal of Advanced Computer Science and Applications,
Vol. 9, No. 12, 2018
613 | P a g e
www.ijacsa.thesai.org
II. RELATED STUDIES
Artem Dementyev [1] in this research, discussed Power Consumption analysis of Bluetooth Low Energy, ZigBee and ANT sensor nodes in a cyclic sleep scenario. therefore, it was concluded that Bluetooth Low Energy (BLE) is a data sending device that has power consumption lowest, compared to ZigBee and ANT. accordingly the theory and benefit of Wireless Sensor Network, This is very important in considering long life factors on sensor nodes seen from energy use factors.
Guoquan Li [2] in this research examined the Received Signal Strength Indicator (RSSI) by placing the sensor node in the indoor position using the Positioning algorithm approach. therefore, The RF radio used is Bluetooth by using mobile technology development. furthermore, with the Positioning algorithm, the results are better than real-time RSSI values.
Janire Larranaga, Leire Muguira, Juan-Manuel Lopez-Garde and Juan-Ignacio Vazquez [3], take measurements using positioning algorithms, while the parameters used are The RSSI (Received Signal Strength Indicator) I refer to this research, while the device used is ZigBee, accordingly by using the positioning algorithm, we estimate the node position with good resolution (3 m average error).
Manuel Ramos [6] in this research, use an LM35 is one of the sensors used to examine the quality of Concrete during heated conditions.accordingly from the system block diagram, the temperature sensor used is 2-32 LM35 sensors that are connected to the Data Acquisition Module and Personal Computer. Based on the results of an analysis, the more sensors used can significantly provide accurate tracking of the internal temperature of the concrete so that the quality of concrete can be known.
M. Niswar [7] in his study of sending Wireless Sensor Network data using ZigBee, the data sent was Pulse Sensor, his research examined Quality of Service (QoS) when data transmission took place, experiments were carried out at different distances, Packet Loss was obtained when sending 4 sensor nodes (ED) simultaneously to the Coordinator Node, so that only 3 sensor nodes can be accommodated by the Coordinator node without packet loss.
Besides [7], the application of RF Bluetooth signals in the health field was carried out in the research of Ying Zhang, Hannan Xiao, [12], moreover, the use of RF Bluetooth signals in this research is combined with intelligent physiological sensors that involve technology integration RF Bluetooth, hardware and software organization and solution for onboard signal processing.
P. Ferrari [8] in this research, the application of Graphical User Interface (GUI) using Web interfaces is one of the implementations in supporting Internet Of Things applications, P. Ferrari uses Bluetooth-based RF Radio in sending sensor data. Measurement about power dissipation, area coverage, and response time confirm the proposed network feasibility and effectiveness.
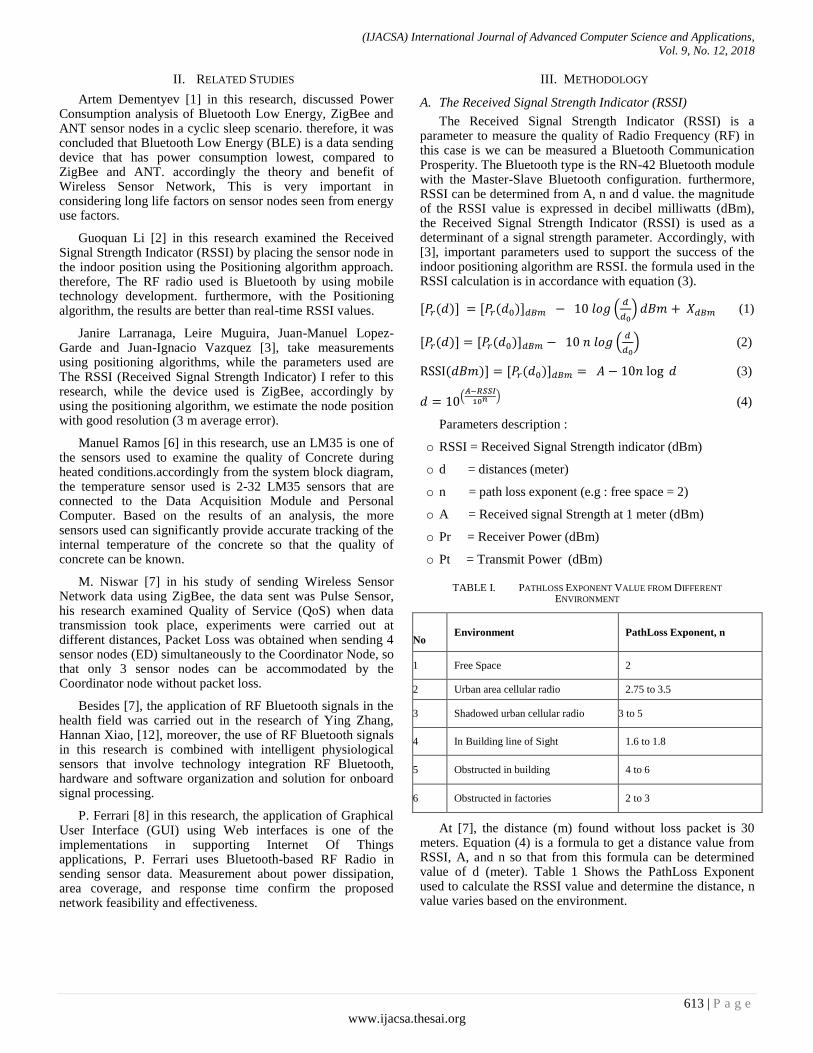
III. METHODOLOGY
A. The Received Signal Strength Indicator (RSSI)
The Received Signal Strength Indicator (RSSI) is a parameter to measure the quality of Radio Frequency (RF) in this case is we can be measured a Bluetooth Communication Prosperity. The Bluetooth type is the RN-42 Bluetooth module with the Master-Slave Bluetooth configuration. furthermore, RSSI can be determined from A, n and d value. the magnitude of the RSSI value is expressed in decibel milliwatts (dBm), the Received Signal Strength Indicator (RSSI) is used as a determinant of a signal strength parameter. Accordingly, with [3], important parameters used to support the success of the indoor positioning algorithm are RSSI. the formula used in the RSSI calculation is in accordance with equation (3).
(
) (1)
(
) (2)
(3)
(
) (4)
Parameters description :
o RSSI = Received Signal Strength indicator (dBm)
o d = distances (meter)
o n = path loss exponent (e.g : free space = 2)
o A = Received signal Strength at 1 meter (dBm)
o Pr = Receiver Power (dBm)
o Pt = Transmit Power (dBm)
TABLE I. PATHLOSS EXPONENT VALUE FROM DIFFERENT
ENVIRONMENT
No Environment PathLoss Exponent, n
1 Free Space 2
2 Urban area cellular radio 2.75 to 3.5
3 Shadowed urban cellular radio 3 to 5
4 In Building line of Sight 1.6 to 1.8
5 Obstructed in building 4 to 6
6 Obstructed in factories 2 to 3
At [7], the distance (m) found without loss packet is 30 meters. Equation (4) is a formula to get a distance value from RSSI, A, and n so that from this formula can be determined value of d (meter). Table 1 Shows the PathLoss Exponent used to calculate the RSSI value and determine the distance, n value varies based on the environment.

(IJACSA) International Journal of Advanced Computer Science and Applications,
Vol. 9, No. 12, 2018
614 | P a g e
www.ijacsa.thesai.org
Fig. 1. Schematic of LM35 Temperature Sensor.
B. LM35 Temperature Sensor
The LM35 temperature sensor is used to convert temperature to electrical quantities in the form of voltage. nevertheless, this sensor has high accuracy and easy to design. accordingly, the input pins of LM35 temperature sensors different with DHT11 Temperature and humidity sensors, the difference is in the position of the input data. the theory of LM35 use analog input data from Arduino board and DHT11 use Digital input data from Arduino board, following the schematic of the LM35 temperature sensor like a show at figure 1 [14].
Figure 1 shows the schematic of an LM35 Temperature sensor, in a schematic, describes 3 input/output pins GND, data / Vout and Vs, Vs 4 to 20 Volt Dc, Vout of 10 mV / C
o.[14]
LM35 Temperature Sensors work with change a temperature value into a voltage quantity. Accordingly The ideal voltage of LM35 temperature sensor has a temperature ratio of 100°C equivalent to 1 volt. and This sensor has self-heating <0.1 ° C. therefore, LM35 sensor converts the physical temperature to a voltage that has a coefficient of 10 mV / °C, which means a rise in temperature of 1 ° C will increase in temperature by 10 mV.
Figure 2 describes the schematic between Arduino, 2 LM35 Temperature sensors and Bluetooth modules, figure 2 is a Slave module.
C. Analog to Digital Converter (ADC) and Relationship
between Temperature and Voltage
Figure 2 show LM35 temperature sensor connected with A0 Arduino board, accordingly temperature data is derived from analog data, therefore LM35 Temperature sensor produces the analog signal data. Microcontroller ATmega 328p have an 8 and 10 Bit ADC and have the same function and number of pins. the type of microcontroller used in this research has a 10 Bit ADC, meaning that the digital data from the conversion of 10 Bit ADC is 2^10 the result is 1024.
Fig. 2. Temperature Sensor LM35 at Arduino Board.

(IJACSA) International Journal of Advanced Computer Science and Applications,
Vol. 9, No. 12, 2018
615 | P a g e
www.ijacsa.thesai.org
The conversion results of ADC = (Vin x 1024) / Vref (5V) (5)
for example, Vin is 1000mV, then the conversion result
is ADC = (1000mV x 1024) / 5000mV = 205
Vin= results of ADC x (5/1023) = 1 Volt or 1000 mV
Temperature °C = Vin / 0.01 Volt (10mV / Celsius, LM35) (6)
0.01 volt from the characteristics of LM35 (10mV / Celsius)
For example Vin =1Volt, then T = 1/0.01 =100°C
0 V DC = 0 °C, 10 mV DC = 1 °C, 100 mV DC = 10 °C, 1000 mV DC = 100 °C, 1500 mV DC = 150 °C
D. dBm and mWatt
Power below 1 mW is expressed as a negative dBm value, on the contrary above mW is a positive dBm value. accordingly, dBm to measure signal strength, the logarithmic scale is easier to understand, by measuring where 1 mW (milliwatt) of power is defined as 0 dBm. the normal signal strength ranges from -100 dBm to -50 dBm, even though there are smaller or larger ones than this range, accordingly the theory, this is the normal range. The following is the conversion from dBm to Watts, from Watts to dBm and Milliwatts to dBm [15].
dBm = 30 + Log 10 (Watts) (7)
Watts = 10^((dBm - 30)/10)
milliWatts = 10^(dBm/10)
E. RaspBerry Pi 3 Model B Board
Raspberry Pi 3 is a board that has many advantages compared to the previous RaspBerry version moreover RaspBerry Pi 3 is equipped with On-Board Bluetooth 4.1 Wi-Fi, 4 USB 2 Port, 10/100 LAN Port, 40 Pin Extended GPIO, Micro SD Card Slot, Full-Size HDMI Video Output, CSI Camera port, 3.5 mm 4 pole composite video and audio output jack, Micro USB Power Input. an upgraded switched power source that can handle up to 2.5 Amps, Broadcom BCM2837 64 bit Quad Core CPU at 1.2 GHz, 1 GB RAM, the difference from the previous lies in On Board Bluetooth 4.1 Wi-Fi [16].
Figure 3 is a Raspberry Pi 3 model B, In this research, accordingly the schematic of RaspBerry Pi 3 Model B Board will be connected to the Arduino UNO Board via USB 2.0 Port Cable Arduino, in this case, the prosperity of Raspberry Pi as the IoT devices will be tested, the ability of raspberry pi 3 in sending data to the database is very strong, the database which is MariaDB, remote IP can be done using PuTTY, this is done to work on the Raspberry Pi processor. on the Arduino board, Master Bluetooth node will be used as the recipient of temperature data from the LM35 sensor on the Slave Bluetooth node. the initial experiment is to use LEDs.
More application can be used LEDs to make the indicators, this is important things. The Slave Bluetooth node sends a command to turn on the Blinking LED on the Bluetooth master node. consequently, the data displayed on the master Bluetooth node Serial monitor. the data output at Master Bluetooth is LM35 Sensor node. accordingly, The function of
RaspBerry pi 3 is to send real-time data from RaspBerry pi 3 to a MySQL database using the Python programming language, Raspberry Pi 3 Compatible with Python 3 programming language, e.g. a pymysql database library compatible with python 3.
Furthermore, in experimental data using LEDs, Commands in programming languages used using strings or char (characters) by sending L and H values. while in this experiment, the temperature (°C) data using float on the data type [5].
Fig. 3. RaspBerry Pi 3 Model B Board.
F. RN-42 Bluetooth Module
The RN-42 Bluetooth module has been created by a wireless serial communication interface between two devices, e.g. a microcontroller, PC, Smartphone and other modules.on the schematic of the RN-42 Bluetooth module will send the LM35 temperature sensor data. accordingly, the RN-42 Bluetooth breadboard-friendly module is compatible with all 5V and 3.3V microcontroller platforms, e.g. this research use Arduino Microcontroller [13].
Fig. 4. Bluetooth RN-42 Module and Dimension.

(IJACSA) International Journal of Advanced Computer Science and Applications,
Vol. 9, No. 12, 2018
616 | P a g e
www.ijacsa.thesai.org
Figure 4 is the module and dimension of the RN-42 Bluetooth module [13], the RN-42 module is compatible with the Arduino IDE programming using C ++. The RN-42 Bluetooth module has 4 pins that are used to communicate, VIN, TX, RX, and GND, the rest are not used. The command to communicate between slave and Bluetooth master is shown in the following program code:
//puput MERL Code_Master
String Remote ="0006664FBB11"; // slave
void setup()
{
Serial.begin(9600);
Serial.print("$$$");
delay(1000);
Serial.println("c,"+ Remote +"\r");
delay(1000);
Serial.println("SM,1"); // Master
delay(1000);
Serial.println("---,"+ Remote +"\r");
delay(1000);
}
------------------ Code Program 1 ------------------
The master Bluetooth node, number 0006664FBB11 is the MAC ID from the slave Bluetooth node, the MAC ID very important for identity. accordingly 00066660618D is the MAC ID by the master Bluetooth module sent by the Slave Bluetooth module, furthermore, the Slave Bluetooth command is shown in the following program code :
//puput MERL Code_Slave
String Remote ="00066660618D"; // master
void setup()
{
pinMode(led,OUTPUT);
Serial.begin(9600);
Serial.print("data dari slave");
delay(100);
Serial.println("c,"+ Remote +"\r");
delay(100);
Serial.println("SM,0"); // Slave
delay(100);
Serial.println("---,"+ Remote +"\r");
delay(100);
}
------------------ Code Program 2 ------------------
Fig. 5. The Flowchart System.

(IJACSA) International Journal of Advanced Computer Science and Applications,
Vol. 9, No. 12, 2018
617 | P a g e
www.ijacsa.thesai.org
G. Flowchart System
The method in this research can be seen in the flowchart in figure 5. accordingly there are 3 important parts that are presented in this flowchart and all three are related. The three parts are Bluetooth Slave, Bluetooth master, and RaspBerry Pi 3. Furthermore, Bluetooth Slave is a node unit formed from an Arduino microcontroller, LM35 temperature sensor, and one unit RN-42 Bluetooth module. Same with Bluetooth master. The difference is the function of each node. In Bluetooth slave, the program created is how to send LM35 temperature sensor data to a Bluetooth master, then the master node sends LM35 sensor data to MySQL using compatible python code in the RaspBerry Pi 3.
The process of sending LM35 sensor data to this Bluetooth Master will be analyzed the ability of the reception signal, which needs to be considered is the python program in displaying data from the sensor, then RaspBerry Pi 3 read to the MySQL database. the arrow at the flowchart shows the connectivity between slave and master Bluetooth RN-42 and then show the data at Raspberry Pi.
Figure 5 describes the flowchart system in this research. In the flowchart section 1 explains how the Slave Bluetooth node communicates with part 2 of the flowchart or master Bluetooth node with all configurations used then after successfully and validated correctly, the data sent to part 3 of the flowchart, RaspBerry pi 3 which is then processed using the Python programming language and then will be sent to the MySQL database, there needs to be a library to connect Python and MySQL so that the LM35 sensor temperature data can be successfully sent and stored in the MySQL database and data can be viewed easily at PHPMyAdmin. to access PHPMyAdmin, the default IP Address is 127.0.0.1/ PHPMyAdmin.
Important to configure start and stop on MySQL to know a MySQL running or not. For example # sudo service mysql stop and Sudo mysql_safe –skip-grant-tables & then easy to enter the MySQL without the password.
Figure 6 shows The Hardware Connectivity and Communication Testing. accordingly, temperature data send from the master Bluetooth to Bluetooth slave, if testing the delivery of masters have succeeded with the code in Arduino use C++ language, then the LM35 temperature sensor data sent through Python programming using RaspBerry pi to store the data in the MySQL Database, therefore MySQL database library in Python is needed.
Fig. 6. Hardware Connectivity and Communication Testing.
Figure 6 shows the two RN-42 Bluetooth module, two Arduino microcontroller modules, and one raspberry pi 3 modules each of which is connected.
Figure 7 shows the Design system in this research as a whole. Where during the process described in the flowchart then the data is processed by RaspBerry Pi 3 using the Python programming language then the data is sent to the database and other computers can be read the data in realtime using PuTTY Configuration.
Fig. 7. Design System at this Research.
IV. RESULT AND ANALYSIS
A. Voltage and Temperature
On voltage and temperature measurement of an LM35 temperature sensor using an Arduino microcontroller, the value of the input voltage (Vin) is determined from the reading of the Analog-Digital Converter (ADC).
Then the temperature value depends on the input voltage (Vin) value. an increase in the temperature value in ordinarily give impact on voltage value, this condition is shown in figure 8 & 9.
Figure 8 shows the temperature change at a certain time, The graph shows an increase in temperature value consequently give the impact in voltage value, as for the number of sensor used is 1 Temperature sensor.
Fig. 8. Voltage and 1 Temperature Sensor Graph.

(IJACSA) International Journal of Advanced Computer Science and Applications,
Vol. 9, No. 12, 2018
618 | P a g e
www.ijacsa.thesai.org
Figure 9 shows the temperature change at a certain time, The graph shows an increase in temperature value consequently give the impact in voltage value, as for the number of sensors used is 2 Temperature sensors.
float temp1;
float temp2;
int led=13;
void setup() {
pinMode(led,OUTPUT);
Serial.begin(9600);
}
void loop() {
temp1=analogRead(A0);
temp1=temp1*0.4428125;
Serial.print("1= ");
Serial.print(temp1);
Serial.print(" ");
delay(500);
temp2=analogRead(A1);
temp2=temp2*0.4428125;
Serial.print("2= ");
Serial.println(temp2);
Serial.print(" ");
delay(500);
}
--------------- Code Program 3 -----------------
After the two LM35 temperature sensors that are initialized in the code program 3, furthermore continue to proceed temperature to voltage conversion.
//Puput Code ~ Voltage Temp Convert
//temperature voltage (T): 0-500
// voltage input(v in) : 0-1024
//T=(vin*500)/1024;
float data,suhu,vref;
float voltage;
String Remote ="0006664FBB11";
const int pSuhu=A0;
void setup()
{
pinMode(pSuhu,INPUT);
Serial.begin(9600);
Serial.print("$$$");
delay(1000);
Serial.println("c,"+ Remote +"\r");
delay(1000);
Serial.println("SM,1"); // master
delay(1000);
Serial.println("---,"+ Remote +"\r");
delay(1000);
}
void loop()
{
data=analogRead(A0);
data=data*0.4428125;
voltage=data*5000/1023;
Serial.print(" ");
Serial.print(voltage);
Serial.print(" mV");
Serial.println();
Serial.print(data);
Serial.print(" C");
delay(100);
}
--------------- Code Program 4 -----------------
Fig. 9. Voltage and 2 Temperature Sensor Graph.
Furthermore, the Calculation of temperature and voltage values can be seen in equation (6). C ++ language is a programming language in the Arduino IDE to represent temperature sensors, furthermore can be seen in program code 3 and 4.
B. Receiver Signal Strength Indicator (RSSI)
In Waltenegus's Dargie and Christian Poellabauer book references [11], says the method of received signal strength (RSS) is a signal that decays or decreases the distance traveled. therefore, the features found in wireless devices are received signal strength (RSSI) which can measure the amplitude of the incoming radio signal.
The one of analyzing indicator transmitting data on Master and Slave Bluetooth RN-42 is the Received Signal Strength Indicator (RSSI). to get the RSSI value, it is necessary to do the calculation as in equation 3. The graph in figure 10 is the measurement result of the signal strength generated parameter (dBm).
The level of packet loss data is also influenced by RF around the data packet delivery, therefore it is necessary to do data transmission without interruption Another RF, on [9], the level (Packet Error Rate) PER and (bit error rate) studied at the time of sending ZigBee RF with interference is examined some Bluetooth networks.
Fig. 10. RSSI WPAN 802.15.1 (Bluetooth RN-42) Graph with n = 2 (Free
space).

(IJACSA) International Journal of Advanced Computer Science and Applications,
Vol. 9, No. 12, 2018
619 | P a g e
www.ijacsa.thesai.org
Fig. 11. Comparison RSSI WPAN 802.15.1 (Bluetooth RN-42) with different
environment.
Table 1 explains about Pathloss Exponent Value from the different Environment. the value of n (Pathloss Exponent) will determine the value of RSSI. for example, the RF Bluetooth RN-42 signal strength at 1 m is -30 (dBm) with the path loss index n = 2 (free space) . therefore the RSSI (dBm) = A - 10.n log d, then RSSI (-dBm) = 30 - 10.2 log 1, then RSSI value is (dBm) -30 dBm.RSSI is obtained from the calculation of equation (3).
The graph in figure 10 is a comparison of Bluetooth signals (dBm) and distance (m). in figure 10, the distance in the experiment is 20 m, the further of the distance between Bluetooth End Device and the coordinator node consequently the value of RSSI shows a decreased strength of the signal (dBm).
The graph in figure 11 is a comparison of Bluetooth signals (dBm) and distance (m).in figure 11, the distance in the experiment is 20 m but displayed in more detail, the number of RSSI tested is 6 from the different Exponent or environment (n) Path Loss values.
The further the distance between the Bluetooth End Device and coordinator node, as a result, decreased signal strength (dBm).
C. Sending the Temperature Data to MySQL Database
Raspberry pi 3 uses Python 3 to programming and sends sensor data to the MySQL database.
Python requires the pymysql library for its MySQL database, beside pymysql library, time and serial library is required. Furthermore use the MySQL command to connect to the localhost network, root folder, username and password.Then analyze the variables that will be displayed for example x = Arduino.readline (), y = Arduino.readline (), then display (x, y) with the data type int or float, for example, float x, y.
to enter the temperature sensor data into the database, we use the INSERT command into the table name, in this case, the data temp table. as shown in figure 12.
Fig. 12. Phyton Code to sending the data temperature to MySQL database.
Finally, the puTTY command to connect the RaspBerry pi 3 device to another device with an IP address: 192.168.1.145, this the IP Address of the Raspberry Pi 3 device. furthermore, after doing a series of commands, finally, it can enter MySQL is possible.
Basic commands on MySQL database, for example, to viewing tables; show databases, select the databases; use database_name, show the tables; show tables, Look the tables Description or structure; desc tables_name and look the entry data in the tables; select * from tables_name.
Figure 13 shows the output from delivery data of LM35 temperature sensor in real time. accordingly the MySQL Table, There is data 2 temperature that can be monitored assuming that the two temperature sensors are placed in different places later.
Fig. 13. Output data Temperature sensor in Database.
ACKNOWLEDGMENT
Thanks to Professor Akio Kitagawa a helped correct this text and has prepared all the tools, nevertheless, the help is very useful for the author. furthermore, thanks to all researchers a helped in completing the research on Wireless Sensor Network using Bluetooth and implementation at Internet of Things (IoT) application.
V. CONCLUSIONS AND SUGGESTION
The theory of the RSSI value equation with a change in the value of n (Path Loss Index) has produced a different signal strength value, the greater the value of n, the greater the signal strength so that the signal strength weakens accordingly equation 3.

(IJACSA) International Journal of Advanced Computer Science and Applications,
Vol. 9, No. 12, 2018
620 | P a g e
www.ijacsa.thesai.org
From this research, successfully storing data to the database using the Python Language command in figure 12. The temperature data table output can be seen in figure 13. localhost / phpmyadmin used to manage the databases, furthermore interface development is needed by creating a Graphical User Interface (GUI) by the PHP, HTML, Javascript and JASON programming language to produce the real-time graph so that it is more user-friendly.
REFERENCES
[1] Artem Dementyev, Steve Hodges, Stuart Taylor, Joshua Smith, "Power consumption analysis of Bluetooth Low Energy, ZigBee and ANT sensor nodes in a cyclic sleep scenario", IEEE International Wireless Symposium (IWS), 2013.
[2] Guoquan Li, Enxu Geng, Zhouyang Ye, Yongjun Xu, Jinzhao Lin and Yu Pang, "Indoor Positioning Algorithm Based on the Improved RSSI Distance Model", Sensors MDPI Journals, Published: 27 August 2018.
[3] Janire Larranaga, Leire Muguira, Juan-Manuel Lopez-Garde and Juan-Ignacio Vazquez “An Environment Adaptive ZigBee-based Indoor Positioning Algorithm”, 2010 International Conference on Indoor Positioning and Indoor Navigation (IPIN), Zürich, Switzerland, 15-17 September 2010.
[4] Kazem Sohraby, Daniel Minoli, Taieb Znati, “Wireless Sensor Networks Technology, Protocols, and Application”, Wiley, 2007.
[5] Kuor-Hsin Chang, "Bluetooth: a viable solution for IoT? [Industry Perspectives]", IEEE Wireless Communications, Volume: 21 , Issue: 6 , December 2014.
[6] Manuel Ramos "Characterization of LM35 Sensor for Temperature Sensing of Concrete" Proceedings of the International MultiConference of Engineers and Computer Scientists 2017 , March 15 - 17, Hong kong Vol II, IMECS 2017.
[7] M. Niswar, A. A. Ilham, E. Palantei, R. S. Sadjad, A. Ahmad, A. Suyuti, Indrabayu, Z. Muslimin, T. Waris, and Puput Dani Prasetyo Adi, “Performance evaluation of ZigBee-based wireless sensor network for monitoring patients’ pulse status,” in Proceedings - 2013 International Conference on Information Technology and Electrical Engineering: “Intelligent and Green Technologies for Sustainable Development”, ICITEE 2013, 2013.
[8] P. Ferrari, A. Flammini, D. Marioli, E. Sisinni, A. Taroni, " A Bluetooth-based sensor network with Web interface", IEEE Transactions on Instrumentation and Measurement Volume: 54 , Issue: 6 , Dec. 2005.
[9] Soo Young Shin, Hong Seong Park, Sunghyun Choi, Wook Hyun Kwon, "Packet Error Rate Analysis of ZigBee Under WLAN and Bluetooth Interferences", IEEE Transactions on Wireless Communications, Volume: 6 , Issue: 8 , August 2007.
[10] Sparkfun, Bluetooth basics, Serial Communication and Hexadecimal learn.spurkfun.com/tutorials/Bluetooth-basics/all, 2017.
[11] Waltenegus Dargie and Christian Poellabauer “Fundamentals of Wireless Sensor Networks Theory dan Practice” Wiley Series on Wireless Communications and Mobile Computing, USA, 2010.
[12] Ying Zhang, Hannan Xiao, "Bluetooth-Based Sensor Networks for Remotely Monitoring the Physiological Signals of a Patient", IEEE Transactions on Information Technology in Biomedicine Volume: 13 , Issue: 6 , Nov. 2009.
[13] https://www.mouser.com/datasheet/2/268/rn-42-ds-v2.32r-268826.pdf access date : 21 Oktober 2018.
[14] http://www.ti.com/lit/ds/symlink/lm35.pdf access date : 12 November 2018.
[15] https://ww3.minicircuits.com/app/AN40-012.pdf access date : 24 September 2018.
[16] https://www.raspberrypi.org/products/raspberry-pi-3-model-b-plus/ access date : 17 Agustus 2018.