performance evaluation of the banking sector in bangladesh
TRANSCRIPT

Business and Economic Research
ISSN 2162-4860
2014, Vol. 4, No. 1
www.macrothink.org/ber 70
Performance Evaluation of the Banking Sector in
Bangladesh: A Comparative Analysis
Md. Ariful Islam (Corresponding author)
Deputy Manager, BASIC Bank Limited
Khulna Branch, 107 Sir Iqbal Road, Khulna, Bangladesh
Tel: 880-171-752-9503 E-mail: [email protected]
Mahmudul Hasan Siddiqui
Senior Territory Manager, Unilever Bangladesh Limited
M.N. Trading & Co, Modina Tower, Habibpur, Narayanganj, Bangladesh
Tel: 880-171-168-8592 E-mail: [email protected]
Kh. Fahim Hossain
Accountant, Chevron Bangladesh Ltd.
57 Gulshan Avenue (4th Floor), Gulshan-1, Dhaka-1212, Bangladesh
Tel: 880-192-666-2131 E-mail: [email protected]
Luthful Karim
Assistant Manager, BASIC Bank Limited
Khulna Branch, 107 Sir Iqbal Road, Khulna, Bangladesh
Tel: 880-191-212-5098 E-mail: [email protected]
Received: December 7, 2013 Accepted: December 31, 2013
doi:10.5296/ber.v4i1.4672 URL: http://dx.doi.org/10.5296/ber.v4i1.4672
Abstract
Banking sector plays an important role in the economic development of a country especially

Business and Economic Research
ISSN 2162-4860
2014, Vol. 4, No. 1
www.macrothink.org/ber 71
for Bangladesh, a sound and efficient banking system is one of the most important
preconditions to achieve economic development. At present, a total of 47 banks (4 SCBs, 4
DFIs, 30 PCBs and 9 FCBs) having 7246 branches are operating in Bangladesh with Tk.
4411.98billion total assets and Tk. 3329.08 billion deposits. The performance of 4types of
banks needs to be compared with each other as well as the overall performance of banking
sector needs to be compared with other countries. Quantitative comparison can be done on the
basis of CAMEL ratio. CAMEL ratios mainly indicate the adequacy of the risk based capital,
non-performing loan position, expenditure-income ratio, return on assets (ROA), return on
equity (ROE), net interest income (NII), writing of debt, liquid assets, excess liquidity, etc. The
study compares the 4 types of bank's time series performance on the basis of selected CAMEL
ratios. This thesis paper is divided into five chapters. Chapter one comprises introduction.
Chapter two includes overview of banking sector of Bangladesh. Performance of banking
sector is contained in chapter three. Chapter four covers analysis and interpretation. The last
chapter is about findings and conclusion.
Keywords: Banking System, ROI, CAMEL, Liquidity, Performance
1. Introduction
1.1 Background of the Study
The banking industry of Bangladesh is a mixed one comprising nationalized, private and
foreign commercial banks. Many efforts have been made to explain the performance of these
banks. Understanding the performance of bank requires knowledge about the profitability and
the relationships between variables like market size, bank‟s risk and bank‟s market size with
profitability. Indeed, the performance evaluation of commercial banks is especially important
today because of the fierce competition. The banking industry is experiencing major transition
for the last two decades. It is becoming an imperative for banks to endure the pressure coming
from both domestic and external factors and prove to be profitable. Until the early 1985,
Bangladesh had a highly repressed financial sector. Banks and other financial institutions were
fully owned by the government. In the early of 1980, Bangladesh entered into the IMF/ World
Bank adjustment programs and the process of privatization and liberalization gained
momentum under the influence of the World Bank and The IMF. Since then the banking
industry of Bangladesh has become an attractive ground for both domestic and foreign
investors to take part in the game. It is of the utmost important of these players to prove
themselves profitable and work on those pillars of the same.
1.2 Objectives of the Studies
The broader objectives of the study are as under:
a. To known the banking sector and its current trends.
b. To study the category wise performance of all banks operating in Bangladesh on the
basis of selected CAMEL ratio.
c. To examine the profitability of banks.
d. To analyze how the correlation of different ratios affects the net interest income of
banks.

Business and Economic Research
ISSN 2162-4860
2014, Vol. 4, No. 1
www.macrothink.org/ber 72
1.3 Methodology of the Study
The research methodology of the selected topic follows in these dimensions:
1.3.1 Population of the Study
All the banks in Bangladeshi banking sector are divided in following groups from the year
2004 to 2011:
i) State-Owned Commercial Banks ( SCB‟s)
ii) Development Financial Institutions (DFI‟s)
iii) Private Commercial Banks (PCB‟s)
iv) Nine Foreign Commercial Banks (FCB‟s)
1.3.2 The Period of the Study
The study is covered for eight years from the year 2004 to 2011.
1.3.3 Data Collection
This study is based on secondary data. For this purpose, the researcher has used the data
published in Annual reports of Bangladesh Bank and other related websites. Moreover, the
journals, articles, reports and surveys have been referred.
1.3.4 Data Analysis
For the comparison between the groups, some statistical tests have been used according to the
nature and objectives of the study. The collected information is analyzed by Anova test. The
conclusions have been drawn on the basis of 5% level of significance. Another statistical
technique 'Correlation' is used to find out the impact of different ratios. Anova test is done with
the help of SPSS software and correlation is done with the help of
http://ncalculators.com/statistics/correlation-coefficient-calculator.htm website.
1.4 Variables
To analyze the financial performance of banking sector different variables are included in this
study, they are as follow:
a. Deposits
Deposits are considered as banks‟ main source of funding and are the lowest cost of funds. The
more deposits are transformed into loans, the higher the interest margin and profit. Hence,
deposits generally have positive impact on profitability of the banks. But if a bank can‟t
transform its deposits into loans efficiently it may bring negative impact on profitability also.
b. Capital Adequacy (C)
Capital adequacy is a measure of the financial strength of a bank, usually express as a ratio of
its shareholders‟ fund to total assets. The ratio reflects the ability of a bank to withstand the
unanticipated losses. This ratio has a positive relationship with the financial soundness of the
bank.

Business and Economic Research
ISSN 2162-4860
2014, Vol. 4, No. 1
www.macrothink.org/ber 73
c. Asset Quality (A)
Asset quality is an important measure of the strength of banks. The ratio of non-performing
loans and advances as a share of total and advances is considered for the purpose of analysis. In
addition, the ratio of total loans and advances to total assets is utilized to measure the extent of
deployment of assets in earning assets.
d. Management Quality (M)
The capacity/efficiency of the management of a bank can be measured with the help of certain
ratios. To capture the possible dynamics of management efficiency, the following ratios are
considered: total loans and advances to total deposits, interest expenses to total deposits, and
operating expenses to total assets.
e) Earnings Ability (E)
Two ratios are used to assess the earnings ability of the banks under study. The first ratio is the
net income to total assets or “ROA”. The second ratio used is interest income to total assets.
The two ratios have positive relationship with the financial performance of the bank and
negative relationship the risk of bank failure.
f) Liquidity (L)
Two ratios are employed in this study to assess the liquidity level of the banks. The first one is
total liquid assets to total assets. The second ratio is liquid assets to customers‟ deposits.
1.5 Hypothesis
The broader hypotheses are as under
A) Ho= There is no significant difference in total deposits among all the banking groups.
H1= There is significant difference in total deposits among all the banking groups.
B) Ho= There is no significant difference in Capital adequacy ratio among all the banking
groups.
H1= There is significant difference in Capital adequacy ratio among all the banking
groups.
C) Ho= There is no significant different in Non Performing Loans to total loans ratios
among all the four banking groups during 2004 to 2011.
H1= There is significant different in Non Performing Loans to total loans ratios among
all the four banking groups during 2004 to 2011.
D) Ho= There is no significant different in Ratio of net Non Performing Loans to total
loans ratios among all the four banking groups.
H1= There is significant different in Ratio of net Non Performing Loans to total loans
ratios among all the four banking groups.
E) Ho= There is no significant different regarding Bad debts among all the four banking
groups.
H1= There is significant different regarding Bad debts among all the four banking
groups.

Business and Economic Research
ISSN 2162-4860
2014, Vol. 4, No. 1
www.macrothink.org/ber 74
F) Ho= There is no significant different regarding Expenditure-income among all the four
banking groups.
H1= There is significant different regarding Expenditure-income among all the four
banking groups.
G) Ho= There is no significant difference regarding Return on Assets in % among all the
four banking groups.
H1= There is significant difference regarding Return on Assets in % among all the four
banking groups.
H) Ho= There is no significant difference regarding Return on equity among all the four
banking groups.
H1= There is significant difference regarding Return on equity among all the four
banking groups.
I) Ho= There is no significant difference regarding net interest income ratio among all the
four banking groups during 2004 to 2011.
H1= There is significant difference regarding net interest income ratio among all the
four banking groups during 2004 to 2011.
J) Ho= There is no significant difference regarding liquid assets ratio among all the four
banking groups during 2004 to 2011.
H1= There is significant difference regarding liquid assets ratio among all the four
banking groups during 2004 to 2011.
K) Ho= There is no significant difference regarding Excess Liquidity ratio among all the
four banking groups during 2004 to 2011.
H1= There is significant difference regarding Excess Liquidity ratio among all the
four banking groups during 2004 to 2011.
1.6 Limitation of the Study
The study of this kind is generally encountered with some limitations. Unavailability of data is
a major problem. Data accuracy cannot be ensured as mainly secondary data collected from
Annual Report, Various Financial Stability reports, Economic trends is used in this study.
However, repeated and sincere efforts have been given to ensure the accuracy of the data used
in this study.
1.7 Literature Review
With respect to the Performances of Bangladeshi Banking sector, foreign and national experts
undertook number of studies.
Pandey (2006) stated that the easiest way to evaluate the performance of a firm is to compare
its present ratio with the past ratio. It gives an indicator of the direction of change and reflects
whether the firm‟s financial performance has improved, deteriorated or remained constant over
time.
Chowdhury and Ahmed (2009) observed that all the selected private commercial banks are
able to achieve a stable growth of branches, employee, deposit, loans and advances, net income,
earning per share during the period of 2002-2006. They indicate that the prospect of private

Business and Economic Research
ISSN 2162-4860
2014, Vol. 4, No. 1
www.macrothink.org/ber 75
commercial banks in Bangladesh is very bright.
Chowdhury (2002) observed that the banking industry of Bangladesh is a mixed one
comprising nationalized, Private and foreign banks. Many efforts have been made to explain
the performance of these banks. Understanding the performance of the bank requires
knowledge about the profitability and the relationship between variables like market size,
banks risk and banks market size with the profitability.
Chowdhury and Islam (2007) stated that deposit and loan advances of nationalized commercial
banks (NCBs) are less sensitive to interest changes than those of Specialized Banks (SBs). So,
SBs should not make abrupt change in lending or deposit by following the NCBs. If NCBs
change their lending rate, their deposit or loan and advances will be affected less than those of
CBs. Moreover, deposits of NCBs have higher volume and higher volatility than those of SBs.
However SBs offer higher deposit rates and charge higher lending rate than NCBs, which is
why the interest rate spread of SBs was higher than that of NCBs.
Siddique and Islam (2001) pointed out that the commercial banks, as a whole are performing
well and contributing to the economic development of the country. The average profitability of
all Bangladeshi Banks collectively was 0.09% during 1980 to 1995 which means that a profit
of Tk.0.09 was earned by utilizing assets of Tk.100 in every aspect of profit; banking sector
contributes the national economy as well as the individual organization. Despite overall growth
of the banking sector positive the performance of different categories of banks were not equally
attractive.
Mujeri & Younus (2009) stated that the higher the non interest income as a ratio of total assets
of banks the lower interest rate spread. Similarly market share of deposit of a bank, statutory
reserve requirement and NSD certificate interest rate affects the IRS. The analysis in terms of
banks group shows that IRS is significantly influenced by operating cost and classified loan of
state owned commercial bank and specialized banks while inflation, operating cost market
share of deposit, statutory reserve requirement and taxes are important for the private
commercial banks. On the other hand non interest income, inflation, market share and taxes
matter for the foreign Commercial banks.
Khan (2008) stated that bank is evaluated based on profit and loss as the same way for other
business. If the shareholders of the bank get more profit then the bank is identified as
successful. Banks can attain success if relevant risks are effectively controlled.
Van Horne & Wachowicz (2005) stated that to evaluate a firm‟s financial condition and
performance the financial analyst need to perform “checkups” on various aspects of a firm‟s
financial health. A tool frequently used these checkup is a financial ratio.
2. Overview of Banking Sector in Bangladesh
2.1 Financial System in Bangladesh
Financial System is the set of well organized institutional set up which helps to transfer excess
funds from surplus unit to deficit unit. The financial system in Bangladesh includes
Bangladesh Bank (the Central Bank), scheduled banks, and non-bank financial institutions like

Business and Economic Research
ISSN 2162-4860
2014, Vol. 4, No. 1
www.macrothink.org/ber 76
leasing etc, Microfinance institutions (MFIs), insurance companies, co-operative banks, credit
rating agencies and stock exchange. Banking sector occupies the lion portion share of financial
system in Bangladesh. Bangladesh bank is authorized for regulating and supervising financial
institutions in Bangladesh.
2.2 Banking sector in Bangladesh
Despite in recent years, many non-bank financial institution has been established, still the
financial system of Bangladesh is mainly banking sector based. Banking sector consists of
Bangladesh Bank as the central bank, four state-owned commercial banks, four specialized
bank/development financial institutions, thirty private commercial banks and nine foreign
commercial banks.
Banking sector in Bangladesh
2.3 Bangladesh Bank
Bangladesh Bank, the central bank and main regulatory body for the country's financial system
and monetary system, was established in Dhaka as an independent organization according to
the Bangladesh Bank Order, 1972 (P.O. No. 127 of 1972) with was effective from 16th
December, 1971 [Bangladesh Bank website]. Now, it has nine offices located at different
division of the country among which two in Capital city namely Motijheel and Sadarghat, two
in Rajshahi division namely Bogra and Rajshahi and one is each of the rest five divisions
namely Chittagong, Khulna, Sylhet, Barisal and Rangpur.
2.4 Functions of Bangladesh Bank
Bangladesh Bank basically responsible for all the core functions that are done by all the
monetary and financial sector regulators. Besides the core functions, Bangladesh Bank is also
responsible for some other supporting functions. The functions of Bangladesh Bank are cited in
below:

Business and Economic Research
ISSN 2162-4860
2014, Vol. 4, No. 1
www.macrothink.org/ber 77
To formulate and implement monetary and credit policies.
To regulate and supervise and monitor financial intermediaries like banks and
non-bank financial institutions.
Currency issuance and circulation across the country.
Payment system management.
Holder and manager of FX reserve of the country.
Bankers to the Government.
To prevent money laundering.
To implement Foreign exchange regulation Act.
Preserve all credit information.
Besides this function, Bangladesh Bank also responsible for asset classification, loan
concentration, setting up single borrower exposure limit, Licensing to the new bank and branch,
impose penalty for non-compliances, intervention in the management for assistance if any bank
face difficulties, prepare guidelines and issuance directives regarding banking operation,
guidelines for core risk management, publication of different economic review etc.
Bangladesh bank monitors the performance of all schedule banks operating in the country
through CAMEL rating system. The ratio used in CAMEL rating system reflects the
performance. Based on this CAMEL rating performance analysis, Bangladesh Bank
undertakes necessary initiatives. For this purpose, Bangladesh Bank depends mostly on
historic data. Bangladesh Bank also introduced the risk based inspection system for the
supervision of schedule banks. In a report of IMF 2010, it is stated that the supervision of
commercial banks is still compliance based to see whether policy and procedures are followed
for which it has to primarily rely on checklist and it lacks proper forward-looking qualitative
judgment [IMF, 2010].
2.5 History of Scheduled/Commercial Bank
2.5.1 State-Owned Commercial Bank
Bangladesh becomes independent after long nine months war. Before the liberation, most of
the banking company were owned by the then west Pakistanis. So, the then Government of
Bangladesh nationalized all the banks operating in Bangladesh except foreign Banks
(Incorporated in abroad). All these banks were grouped into commercial banks through merger
process. Among the six commercial banks, two banks namely Pubali bank and Uttara bank
were shifted to private sector in January, 1985 and another bank Rupali bank was incorporated
as public limited company with effect from December, 1986. The rest three banks namely
Sonali bank, Agrani bank and Janata bank were also transferred as public limited company in
2007. So, now there are four state owned commercial banks operating in Bangladesh.
In a report of IMF, it has been stated that the initial focus on state-led banking imitate the
Government„s lively quest of industrial policies to inspire growth. SCBs were considered as
the proper means of generating savings that could be facilitate industrial finance to the sectors
of the economy with the best growth prospects. SCBs major drawbacks are the lack of
corporate governance and undue political pressure even in loan disbursements without proper
Business and Economic Research
ISSN 2162-4860
2014, Vol. 4, No. 1
www.macrothink.org/ber 78
analyzing the prospects of the borrower. Despite recently some measures have been undertaken
but this legacy is still visible in high NPL ratios and frail solvency. The Government of
Bangladesh has indicated its desire to divest of the state owned banks, and took an initiative in
late 2008 to make them limited liability companies. The Ministry of Finance, in consultation
with the SEC and BB allowed the banks to move their accumulated losses into capital surpluses
based on the notion of Goodwill. The accumulated losses were converted in a Goodwill asset
that will be amortized out of future profits. This accounting treatment is questionable and
concerns remain regarding the true financial condition of these banks [IMF, 2010].
2.5.2 Specialized Bank/Development Financial Institutions (DFIs)
After liberation, two specialized bank operating in Bangladesh were also nationalized and
renamed as Bangladesh Krishi Bank and Bangladesh Shilpa Bank. But Bangladesh Krishi bank
was divided in 1987 and renamed as Rajshahi Krishi Unnayan Bank (RAKUB) for Rajshahi
Division to promote agricultural development in that region and Bangladesh Krishi bank for
the rest of part of the country. In 1988, another specialized bank name Bank of Small Industries
and Commerce Bangladesh Ltd. (BASIC) was established as private bank to promote small
and medium entrepreneurship. In 1993, the then Government of Bangladesh took the control of
BASIC and was declared it as a specialized bank. Bangladesh Shilpa Bank was merged with
Bangladesh Shilpa Rin Sangsta (BSRS) in 2010 and renamed as Bangladesh Development
Bank Limited (BDBL).
So, currently there are four specialized banks which are termed as Development Financial
Institutions (DFIs) operating in Bangladesh.
2.5.3 Private Commercial Bank
Local private commercial bank started operation in the decades of 1980's. We can categorize
local private bank in the following manner:
First generation bank: Those established in the decades of 1980s.
Second generation bank: These banks started operation in 1990 to 1995.
Third generation bank: After 1998, these banks are established.
At present, there are thirty local private commercial banks operating in Bangladesh. PCBs
dominate the banking sector of Bangladesh. More than fifty percent of total deposits and assets
are covered by the PCBs. The performance of PCBs is much better than SCBs and DFIs in all
respects. Client service innovation and banking service automation is one of the major reasons
for their domination over the SCBs and PCBs. among the three generation of PCBs, third
generation banks are more innovative and provide better client services through automation
whereas first generation banks are little bit in backward position though they continuously
improving their condition to compete in the market.
Bangladesh„s PCBs have quickly occupy market share at the expense of the state-owned
commercial banks (SCB) and presently grasp more than 59 percent of total deposits whereas it
is only 28 percent for the SCBs and PCBs assets coverage is 58% whereas it is only 29% in
SCBs.

Business and Economic Research
ISSN 2162-4860
2014, Vol. 4, No. 1
www.macrothink.org/ber 79
2.5.4 Foreign Commercial Banks (FCBs)
Before liberation, there were few FCBs operating in the country which was incorporated in
abroad. Among those foreign banks, Standard chartered Grindlays Bank was merged with
Standard Chartered Bank in 2003 and then American Express Bank further merged with
Standard Chartered Bank in 2005. Credit Agricole Indosuez bank was renamed as Commercial
Bank of Ceylon Ltd. in 2003. Currently, there are nine foreign commercial banks operating in
Bangladesh. Foreign Commercial Banks suffered for lack of wide spread branch network.
Their operation is basically limited to capital city and some other municipal city corporation
area.
2.6 Scheduled Bank According to the Law
According to Bank Company Act, 2007, "All such banks operating in Bangladesh with
different paid-up capital and reserves having a minimum of an aggregate value of Tk. 50 lacs
and conducting their affairs to the satisfaction of the Bangladesh Bank have been declared as
scheduled banks in terms of section 37(2) of Bangladesh Bank Order 1972. In terms of section
13 of Bank Company Act, 1991, the minimum aggregate value was Tk. 20 crores. From 30th
March, 2003, it was tk. 100 crores and from the 8th October 13, 2007, it has been raised at the
minimum of Tk. 200 crores" [Bank Company Act, 2007].
3. Performance Evaluation of Banking Sector
The concept of financial performance and research into its measurement is well advanced
within finance and management fields. Recently a well-judged technique named CAMEL
rating is widely used for evaluating performance of financial institutions, especially to banks.
In Bangladesh bank as a Central bank, which is regulatory body has been calculating this rating
till now. Performance of the banking sector under CAMEL frame work, which involves
analysis and evaluation of the five crucial dimensions of banking operations.
We now evaluate the performance of banks on the basis of CAMEL framework. This
evaluation is done for the four categories of banks, namely “state-owned commercial banks
(SCBs), government-owned development financial institutions (DFIs), domestic private
commercial banks (PCBs), and foreign commercial banks (FCBs)".
a) Capital Adequacy (C)
Capital adequacy is a measure of the financial strength of a bank, usually express as a ratio of
its shareholders' fund to total assets. The ratio reflects the ability of a bank to withstand the
unanticipated losses. This ratio has a positive relationship with the financial soundness of the
bank.
b) Asset Quality (A)
Asset quality is an important measure of the strength of banks. The ratio of non-performing
loans and advances as a share of total and advances is considered for the purpose of analysis.
In addition, the ratio of total loans and advances to total assets is utilized to measure the
extent of deployment of assets in earning assets.

Business and Economic Research
ISSN 2162-4860
2014, Vol. 4, No. 1
www.macrothink.org/ber 80
c) Management Quality (M)
The capacity/efficiency of the management of a bank can be measured with the help of
certain ratios. To capture the possible dynamics of management efficiency, the following
ratios are considered: total loans and advances to total deposits, interest expenses to total
deposits, and operating expenses to total assets.
d) Earnings Ability (E)
Two ratios are used to assess the earnings ability of the banks under study. The first ratio is
the net income to total assets or “ROA”. The second ratio used is interest income to total
assets. The two ratios have positive relationship with the financial performance of the bank
and negative relationship the risk of bank failure.
e) Liquidity (L)
Two ratios are employed in this study to assess the liquidity level of the banks. The first one
is total liquid assets to total assets. The second ratio is liquid assets to customers‟ deposits.
3.1 Banking System Structure
Source: Bangladesh Bank Annual Reports
The banking sector of Bangladesh comprises four categories of scheduled banks. These are the
state owned commercial banks (SCBs), the state owned development financial institutions
(DFIs), the private commercial banks (PCBs), and the foreign commercial banks (FCBs).
While the number of banks remained unchanged at 47 in 2011, the number of bank branches
increased from 7658 in 2010 to 7961 in 2011 reflecting the opening of new branches by the
PCBs. At the end of June 2012, the total number of bank branches increased further to 8059,
with total number of banks remaining unchanged at 47. The structure of the banking sector
with breakdown by type of banks is shown in the Table above.
3.2 Deposits
Deposits are considered as banks‟ main source of funding and are the lowest cost of funds. The
more deposits are transformed into loans, the higher the interest margin and profit. Hence,
deposits generally have positive impact on profitability of the banks. But if a bank can‟t

Business and Economic Research
ISSN 2162-4860
2014, Vol. 4, No. 1
www.macrothink.org/ber 81
transform its deposits into loans efficiently it may bring negative impact on profitability also.
Table 1. Total Deposits by Types of Banks (Taka in Billion)
Banks Types 2004 2005 2006 2007 2008 2009 2010 2011
SCB‟s 544.56 608.36 641.16 686.76 745.86 869.19 1044.96 1235.65
DFI‟s 75.10 89.50 100.20 115.60 137.80 161.10 183.4 214.40
PCB‟s 588.00 731.30 955.50 1150.20 1450.70 1792.40 2266.50 2787.5
FCB‟s 108.44 125.54 163.74 196.34 226.70 227.6 239.7 284.8
Total 1326.1 1554.7 1860.6 2148.90 2561.06 3050.29 3734.56 4522.35
Source: Bangladesh Bank Annual Reports (2004-2011)
Source: Bangladesh Bank Annual Reports (2004-2011)
Table 2. Market Share of Deposits by Types of Banks (percent)
Banks Types 2004 2005 2006 2007 2008 2009 2010 2011
SCB‟s 41.38% 39.13% 34.46% 31.96% 29.12% 28.49% 28.08% 27.40%
DFI‟s 5.71% 5.76% 5.39% 5.38% 5.38% 5.28% 4.93% 4.75%
PCB‟s 44.68% 47.04% 51.35% 53.53% 56.64% 58.76% 60.90% 61.81%
FCB‟s 8.24% 8.07% 8.80% 9.14% 8.86% 7.47% 6.10% 6.03%
Total 100% 100% 100% 100% 100% 100% 100% 100%
Source: Bangladesh Bank Annual Reports(2004-2011)

Business and Economic Research
ISSN 2162-4860
2014, Vol. 4, No. 1
www.macrothink.org/ber 82
Source: Bangladesh Bank Annual Reports(2004-2011)
Total deposits of the banks in 2011 rose to Taka 4509.7 billion from Taka 3721.9 billion in 2010
showing an overall increase of 21.2 percent. The SCBs' (comprising the largest 4 banks) share
in deposits decreased from 28.1 percent in 2010 to 27.4 percent in 2011. The PCBs' deposits in
2011 amounted to Taka 2787.5 billion or 61.8 percent of the total industry deposits against
Taka 2266.5 billion or 60.9 percent in 2010. The FCBs' deposits in 2011 rose by Taka 45.1
billion over the year. The DFIs' deposits in 2011 were Taka 214.4 billion against Taka 183.4
billion in 2010 showing an increase of 16.9 percent over the year.
Table 3. Growth of Deposits by Types of Banks (percent
Banks
Types
2005 2006 2007 2008 2009 2010 2011 Average rate of
Growth
SCB‟s 11.72% 5.39% 7.11% 8.61% 16.54% 20.22% 18.25% 12.55%
DFI‟s 19.17% 11.96% 15.37% 19.20% 16.91% 13.84% 16.90% 16.19%
PCB‟s 24.37% 30.66% 20.38% 26.13% 23.55% 26.45% 22.99% 24.93%
FCB‟s 15.77% 30.43% 19.91% 15.46% 0.40% 5.32% 18.82% 15.16%
Source: Bangladesh Bank Annual Reports(2004-2011)

Business and Economic Research
ISSN 2162-4860
2014, Vol. 4, No. 1
www.macrothink.org/ber 83
Source: Bangladesh Bank Annual Reports(2004-2011)
PCB‟s have the highest deposit growth rate 24.93% over last eight years while SCB‟s lowest
12.55% deposit growth rate. FCB‟s and DFI‟s deposit growth rate is 15.16% and 16.19%
respectively over the years 2004 to 2011.
3.3 Performance of the Types of Banks Based on Different Components of CAMEL
CAMEL is used to measure overall performance of the banking system as well as to find out
strength and weakness which ensures the safety and soundness of banking company.
Performance of the types of banks regarding different components of CAMEL has been
analyzed here in after. Financial indicators used are summarized in Table.
Table 4. Noted that these indicators are considered according to the CAMEL.
Key Indicator Indicators
Capital Adequacy Capital to Risk Weighted Assets Ratio
Assets Quality Non-performing Loan Rate
Management soundness Expenditure-Income Ratio
Earning performance Return on Assets
Return on Equity
Net Interset Income
Liquidity Liquid Assets/Deposit Ratio
Excess Liquidity/Deposit Ratio
Financial Indicators to Evaluate Bank Performance
3.3.1 Capital Adequacy
Capital adequacy focuses on the total position of banks' capital and the protection of depositors
and other creditors from the potential shocks of losses that a bank might incur. It helps
absorbing all possible financial risks like credit risk, market risk, operational risk, residual risk,
core risks, credit concentration risk, interest rate risk, liquidity risk, reputation risk, settlement
risk, strategic risk, environmental & climate change risk etc. Under Basel-II, banks in

Business and Economic Research
ISSN 2162-4860
2014, Vol. 4, No. 1
www.macrothink.org/ber 84
Bangladesh were instructed to maintain the Minimum Capital Requirement (MCR) at 10.0
percent of the Risk Weighted Assets (RWA) or Taka 4.0 billion as capital, whichever is higher,
with effect from July-September quarter in 2011. MCR was revised to increase the shock
resilient capacity of the bank. However, for the fourth quarter of 2011 MCR was lowered to 9.0
percent of RWA or Taka 2.0 billion, whichever is higher.
Under the Supervisory Review Process (SRP), banks are directed to maintain a level of
"adequate" capital which is higher than the minimum required capital and sufficient to cover
for all possible risks in their business. This higher level of capital for the banks is usually
determined and finalized through SRP-SREP dialogue.
3.3.1.1 Capital to risk weighted assets ratio
Table 5. Capital to risk weighted assets ratio by Types of Banks (percent)
Banks Types 2004 2005 2006 2007 2008 2009 2010 2011
SCB‟s 4.1 -0.4 1.1 7.96 6.9 9.0 8.9 11.7
DFI‟s 9.1 -7.5 -6.7 -5.5 -5.3 0.4 -7.3 -4.5
PCB‟s 10.3 9.1 9.8 10.6 11.4 12.1 10.1 11.5
FCB‟s 24.2 26.0 22.7 22.7 24.0 28.1 15.6 21.0
Total 8.7 5.6 6.7 9.6 10.1 11.6 9.3 11.4
Source: Bangladesh Bank Annual Reports (2004-2011)
Source: Bangladesh Bank Annual Reports (2004-2011)
Table 5 shows that on 31 December 2011 in aggregate the SCBs, DFIs, PCBs and FCBs
maintained CAR of 11.7, -4.5, 11.5 and 21.0 percent respectively. But individually, 3 PCBs
and 2 DFIs did not maintain the minimum required CAR. Whereas, all PCBs and FCBs
complied with the minimum required capital. The CAR for the banking industry as a whole
was 11.4 percent at end of 2011 as against 9.3 percent at end of 2010.
Business and Economic Research
ISSN 2162-4860
2014, Vol. 4, No. 1
www.macrothink.org/ber 85
3.3.2 Assets Quality
The most important indicator of bank asset quality in the loan portfolio is the ratio of gross
non-performing loans (NPLs) to total loans and the ratio of net NPLs to net total loans.
3.3.2.1 NPL to Total Loans Ratio
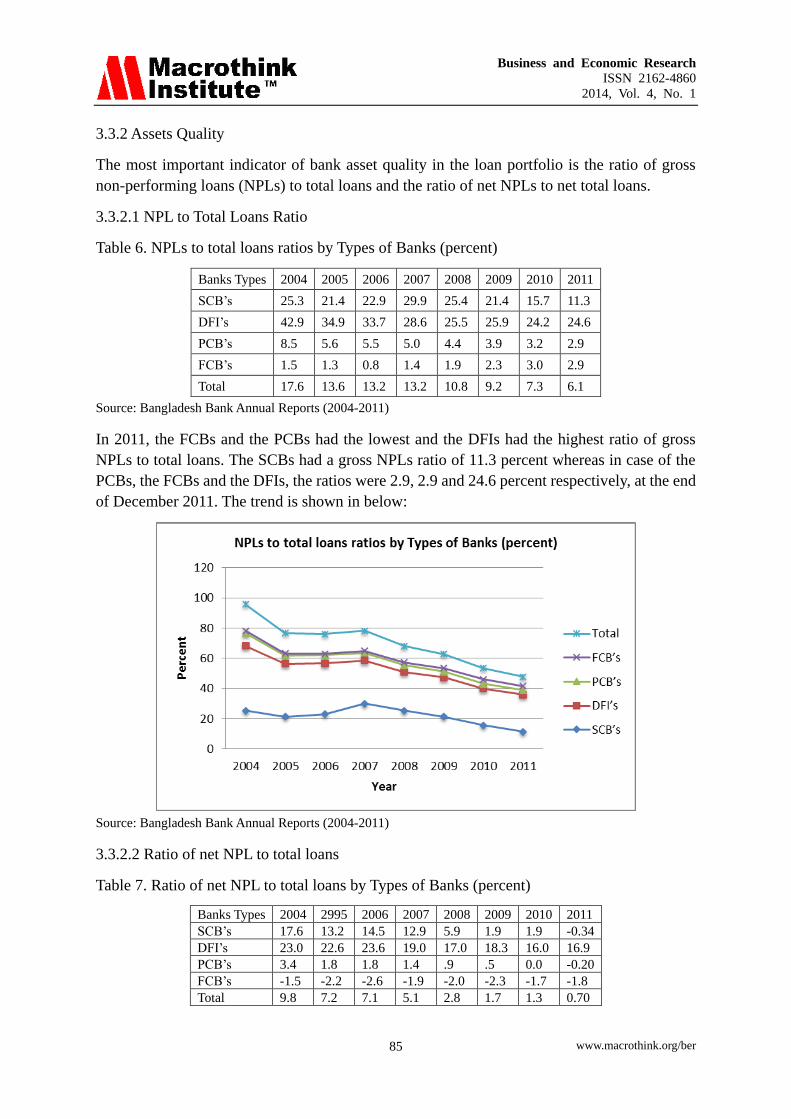
Table 6. NPLs to total loans ratios by Types of Banks (percent)
Banks Types 2004 2005 2006 2007 2008 2009 2010 2011
SCB‟s 25.3 21.4 22.9 29.9 25.4 21.4 15.7 11.3
DFI‟s 42.9 34.9 33.7 28.6 25.5 25.9 24.2 24.6
PCB‟s 8.5 5.6 5.5 5.0 4.4 3.9 3.2 2.9
FCB‟s 1.5 1.3 0.8 1.4 1.9 2.3 3.0 2.9
Total 17.6 13.6 13.2 13.2 10.8 9.2 7.3 6.1
Source: Bangladesh Bank Annual Reports (2004-2011)
In 2011, the FCBs and the PCBs had the lowest and the DFIs had the highest ratio of gross
NPLs to total loans. The SCBs had a gross NPLs ratio of 11.3 percent whereas in case of the
PCBs, the FCBs and the DFIs, the ratios were 2.9, 2.9 and 24.6 percent respectively, at the end
of December 2011. The trend is shown in below:
Source: Bangladesh Bank Annual Reports (2004-2011)
3.3.2.2 Ratio of net NPL to total loans
Table 7. Ratio of net NPL to total loans by Types of Banks (percent)
Banks Types 2004 2995 2006 2007 2008 2009 2010 2011
SCB‟s 17.6 13.2 14.5 12.9 5.9 1.9 1.9 -0.34
DFI‟s 23.0 22.6 23.6 19.0 17.0 18.3 16.0 16.9
PCB‟s 3.4 1.8 1.8 1.4 .9 .5 0.0 -0.20
FCB‟s -1.5 -2.2 -2.6 -1.9 -2.0 -2.3 -1.7 -1.8
Total 9.8 7.2 7.1 5.1 2.8 1.7 1.3 0.70

Business and Economic Research
ISSN 2162-4860
2014, Vol. 4, No. 1
www.macrothink.org/ber 86
Source: Bangladesh Bank Annual Reports (2004-2011)
Source: Bangladesh Bank Annual Reports (2004-2011)
Table 7 and Figure 3.6 present the ratio of the net NPLs (net of provisions and interest suspense)
to net total loans (net of provisions and interest suspense). It reveals from the table that the
DFIs' non-performing portfolios were still high after adjustment of actual provision and
interest suspense, whereas the SCBs, the FCBs and the PCBs had excess provision against their
NPLs in December 2011.
3.3.3 Writing-of Bad Debts
To wipe out unnecessarily and artificially inflated size of balance sheet, uniform guidelines of
write-off have been introduced in 2003. According to the policy, banks may, at any time,
classify write-off loans as bad/loss. Those loans, which have been classified as bad/loss for the
last 5 years and above and loans for which 100 percent provisions have been kept, should be
written-off immediately. The total amounts of written-off bad debts from June 2004 to June
2012 in different categories of bank are presented in Table 3.7.\
Table 8. Writing-of bad debts in different bank categories (billion Taka)
Banks
Types
30 June
2004
30 June
2005
30 June
2006
30 June
2007
30 June
2008
30 June
2009
30 June
2010
30 June
2011
30 June
2012
SCB‟s 26.3 29.7 35.7 42.8 48.4 64.5 70.5 82.4 92.3
DFI‟s 17.4 27.6 28.6 30.4 31.0 31.8 31.8 32.0 32.3
PCB‟s 21.2 32.9 40.7 45.5 49.4 54.7 69.6 77.1 85.5
FCB‟s 0.9 1.1 1.5 1.6 1.7 2.0 2.1 2.4 2.9
Total 65.8 91.3 106.5 120.3 130.5 153.0 174.0 193.9 213.0
Source: Bangladesh Bank Annual Reports (2004-2011)

Business and Economic Research
ISSN 2162-4860
2014, Vol. 4, No. 1
www.macrothink.org/ber 87
Source: Bangladesh Bank Annual Reports (2004-2011)
3.3.4 Management Soundness
Sound management is the most important and inevitable pre-requisite for the strength and
concrete growth of any financial institution. Since indicators of management quality are
primarily specific to individual institution, these cannot be easily aggregated across the sector.
In addition, it is difficult to draw any conclusion regarding management soundness based on
quantitative indicators, as characteristics of a good management are rather qualitative in nature.
Nevertheless, the total expenditure to total income, operating expenses to total expenses,
earnings and operating expenses per employee, and interest rate spread are generally used to
portray management soundness. Technical competence & leadership of mid and senior level
management, compliance with banking laws and regulations, adequacy, compliance of sound
internal policies, ability to plan and respond to changing circumstances etc. are also taken into
consideration to illustrate the quality of management.
3.3.4.1 Expenditure-Income Ratio
Table 9. Expenditure-income ratio by type of banks (percent)
Banks Types 2004 2005 2006 2007 2008 2009 2010 2011
SCB‟s 102.3 101.9 100.0 100.0 89.6 75.6 80.7 62.7
DFI‟s 104.0 103.9 103.5 107.7 103.7 112.1 87.8 88.6
PCB‟s 87.1 89.3 90.2 88.8 88.4 72.6 67.6 71.7
FCB‟s 76.3 70.8 71.1 72.9 75.8 59.0 64.7 47.3
Total 90.9 92.2 91.4 90.4 87.9 72.6 70.8 68.6
Source: Bangladesh Bank Annual Reports (2004-2011)

Business and Economic Research
ISSN 2162-4860
2014, Vol. 4, No. 1
www.macrothink.org/ber 88
Source: Bangladesh Bank Annual Reports (2004-2011)
As evident from Table 9 and Figure 3.8, in 2011, the expenditure-income (EI) ratio of the DFIs
was the highest among the shown bank clusters due to poor non-interest income and higher
operating expenses. The EI ratio of the PCBs was 71.7, the second highest, which could mainly
be attributable to high administrative and operating expenses. The EI ratio of the SCBs fell
from 80.7 in 2010 to 62.7 in 2011 mainly due to significant increase (Taka 60.5 billion to Taka
91.7 billion) in interest income.
3.3.5 Earning Performance
Strong earnings and profitability profile of a bank reflect its ability to support present and
future sound operation, absorb future contingent shocks and strengthen resilience capacity.
More specifically, this determines the capacity to absorb losses by building an adequate capital
base, finance its expansion and pay adequate dividends to its shareholders. Although there are
various indicators of earning and profitability, the most representative and widely used
indicator is Return on Assets (ROA), which is supplemented by Return on Equity (ROE) and
Net Interest Margin (NIM).
3.3.5.1 Return on Assets (ROA)
Return on Assets (ROA) indicates the productivity of assets i.e. how much income is earned
from per unit of assets. According to Basel-ІІ accord, ROA should be more than 1%.
Table 10. Return on assets (ROA) (Percent)
Banks Types 2004 2005 2006 2007 2008 2009 2010 2011
SCB‟s -0.1 -0.1 0.0 0.0 0.7 1.0 1.1 1.3
DFI‟s -0.2 -0.1 -0.2 -0.3 -0.6 0.4 0.2 .1
PCB‟s 1.2 1.1 1.1 1.3 1.4 1.6 2.1 1.6
FCB‟s 3.2 3.1 2.2 3.1 2.9 3.2 2.9 3.2
Total 0.7 0.6 0.8 0.9 1.2 1.4 1.8 1.5
Source: Bangladesh Bank Annual Reports (2004-2011)

Business and Economic Research
ISSN 2162-4860
2014, Vol. 4, No. 1
www.macrothink.org/ber 89
Source: Bangladesh Bank Annual Reports (2004-2011)
The Table 10 and Figure 3.9 show that SCBs achieved nearly zero percent of ROA over the
whole period. The scenario is much worst in case of DFIs where most of the time ROA was
negative. The reason behind this worse scenario of SCBs and DFIs is huge provision shortfall
and insignificant profit during the period. PCBs ROA was below the standard level but
gradually it was improved and reached at 2% in June, 2010 but again down to 1.6% in 2011.
FCBs ROA position is well strong over the whole period.
3.3.5.2 Return on Equity (ROE)
Return on Equity (ROE) is another important measure of earning and profitability
determination which indicates net income after tax to total equity. The amount of profit
generation for the equity shareholders is found from the ratio. Higher value of ROE is an
indication of high productivity of equity.
Table 11. Return on equity (ROE) (Percent)
Banks Types 2004 2005 2006 2007 2008 2009 2010 2011
SCB‟s -5.3 -6.9 0.0 0.0 22.5 26.2 18.4 19.7
DFI‟s -2.1 -2.0 -2.0 -3.4 -6.9 -171.7 -3.2 -0.9
PCB‟s 19.5 18.1 15.2 16.7 16.4 21.0 20.9 15.7
FCB‟s 22.5 18.4 21.5 20.4 17.8 22.4 17.0 16.6
Total 13.0 12.4 14.1 13.8 15.6 21.7 21.0 17.0
Source: Bangladesh Bank Annual Reports (2004-2011)

Business and Economic Research
ISSN 2162-4860
2014, Vol. 4, No. 1
www.macrothink.org/ber 90
Source: Bangladesh Bank Annual Reports (2004-2011)
The Table 11 and Figure 3.10 show that the SCBs' ROE was 26.2 percent in 2009, but
dropped down to 18.4 percent in 2010 as owners' equity had increased comparatively at a
higher rate than after tax profit. However, it increased to 19.7 percent in 2011. In case of the
DFIs, the ROE was still negative in 2011. The ROE of the PCBs was diverse but satisfactory
(except the year 2011) during the last five years. The ROE of the FCBs has been showing
gradual decline from 2009 due to increase in equity. The ROE of the FCBs in 2009 stood at
22.4 percent, which declined to 16.6 percent in 2011.
3.3.5.2 Net Interest Income (NII)
Another important tool to indicate the earning and profitability is Net Interest Income (NII).
Net interest income is the spread between interest receipts from loans and advances and interest
paid to the depositors. The high NII means the spread between interest receipts and paid is
high.
Table 12. Net interest income by type of banks (billion Taka)
Banks Types 2004 2005 2006 2007 2008 2009 2010 2011
SCB‟s -1.1 7.7 9.0 7.4 7.9 12.1 19.8 34.3
DFI‟s 1.8 1.0 1.7 1.4 1.9 1.9 6.2 4.9
PCB‟s 13.7 21.0 25.4 36.1 48.5 56.7 82.8 91.4
FCB‟s 4.2 5.6 8.2 9.9 12.6 10.7 13.0 16.1
Total 18.3 35.3 44.3 54.8 70.9 81.5 121.9 146.7
Source: Bangladesh Bank Annual Reports (2004-2011)

Business and Economic Research
ISSN 2162-4860
2014, Vol. 4, No. 1
www.macrothink.org/ber 91
Source: Bangladesh Bank Annual Reports (2004-2011)
The aggregate net interest income (NII) of the industry has consistently increased from Taka
18.3 billion in 2004 to Taka 146.7 billion in 2011. However, the NII of the SCBs was a negative
amount of Taka 1.1 billion in 2004 and had started to become positive (Taka 7.7 billion) from
2005. In 2011, the NII of the SCBs was Taka 34.3 billion. The DFIs had a positive trend in NII
since 2002 and it was Taka 4.9 billion in 2011.
Since 2005, the SCBs have been able to increase NII by reducing their cost of fund. The NII of
the PCBs has been incredibly high over the period from 2004 through 2011. The overall
industry NII shows a consistently upward trend. The trend of NII indicates that the PCBs and
the FCBs' interest spreads are higher than those of the SCBs and the DFIs.
3.3.6 Liquidity
Statutory liquidity reserve (SLR) varies according to the circular issued by the Bangladesh
Bank but in an average SLR is 18.5% of total deposits including cash reserve requirement at
least 5% in Bangladesh Bank account. Three DFIs are exempted from the requirement of SLR
and 7 Islami banks have to keep 10% SLR. Rest of all banks has to maintain the required SLR
[Bangladesh Bank].
3.3.6.1 Liquid Assets
Table 13. Liquid assets (Percent)
Banks Types 2004 2005 2006 2007 2008 2009 2010 2011
SCB‟s 22.8 20.0 20.1 24.9 32.9 25.1 27.2 34.7
DFI‟s 11.2 11.2 11.9 14.2 13.7 9.6 21.3 12.3
PCB‟s 23.1 21.0 21.4 22.2 20.7 18.2 21.5 23.9
FCB‟s 37.8 41.5 34.4 29.2 31.3 31.8 32.1 30.5
Total 23.4 21.7 21.5 23.2 24.8 20.6 23.0 26.5
Source: Bangladesh Bank Annual Reports (2004-2011)

Business and Economic Research
ISSN 2162-4860
2014, Vol. 4, No. 1
www.macrothink.org/ber 92
Source: Bangladesh Bank Annual Reports (2004-2011)
From the Table 13 & Figure 3.12, we find that all the banks have liquid assets. In 2011, SCBs
possessed highest liquid assets which are more than six times higher than that of PCBs in
2011. FCBs had highest liquid assets over the whole period except in 2008 & 2011. PCBs &
DFIs liquid assets are lower than industry liquid assets over last eight years.
3.3.6.2 Excess Liquidity
Table 14. Excess liquidity (Percent)
Banks Types 2004 2005 2006 2007 2008 2009 2010 2011
SCB‟s 6.8 2.0 2.1 6.9 14.9 17.6 8.2 15.7
DFI‟s 4.7 6.2 3.8 5.6 4.9 7.1 2.3 2.5
PCB‟s 8.8 5.1 5.6 6.4 4.7 5.3 4.6 7.0
FCB‟s 21.9 23.6 16.4 11.2 13.3 21.8 13.2 11.8
Total 8.7 5.3 5.1 6.9 8.4 9.0 6.0 9.3
Source: Bangladesh Bank Annual Reports (2004-2011)
Source: Bangladesh Bank Annual Reports (2004-2011)

Business and Economic Research
ISSN 2162-4860
2014, Vol. 4, No. 1
www.macrothink.org/ber 93
From the Table 14 & Figure 3.13, we find that all the banks had excess liquidity. In 2011,
SCBs possessed highest excess liquidity which is more than six times higher than that of
PCBs in 2011. FCBs had highest excess liquidity over the whole period except in 2008 &
2011. PCBs & DFIs excess liquidity is lower than industry excess liquidity over last five
years. Excess liquidity indicates available loan able fund at low cost.
3.3.7 CAMEL Rating of All Banks
CAMEL rating is expressed on a scale of 1 to 5 in ascending order of supervisory concern, 1
representing the best rating, while 5 indicating the worst. Any bank rated 4 or 5 i.e. Marginal or
Unsatisfactory under composite CAMEL rating is generally identified as a problem bank.
Activities of these banks are closely monitored by the BB.
On the basis of five components of CAMEL banks are rated from 2004 to 2011.
Table 15. CAMEL rating of all Banks in Bangladesh
Rating 2004 2005 2006 2007 2008 2009 2010 2011
1 or Strong 12 13 3 6 2 3 5 2
2 or Satisfactory 15 16 31 29 28 32 32 33
3 or Fair 10 8 7 5 10 7 7 9
4 or Marginal 8 6 5 6 4 4 2 2
5 or Unsatisfactory 4 5 2 2 4 1 1 1
Total 49 48 48 48 48 48 47 47
Source: Bangladesh Bank Annual Reports (2004-2011)
As of end 2011, CAMEL rating of 2 banks was 1 or Strong; 33 banks were rated 2 or
Satisfactory; 9 banks were rated 3 or Fair; 2 were rated 4 or Marginal and 1 bank got 5 or
Unsatisfactory rating.
4. Analysis & Interpretation
4.1 Deposits
Hypothesis Testing
The researcher wanted to find out that if there is any significant difference regarding the
performance related to deposits among all the four banking groups during 2004 to 2011 or not.
This was tested as under
Null Hypothesis
There is no significant difference in total deposits among all the banking groups during 2004 to
2011.
H0 = µ1 = µ2 = µ3 = µ4
H1 = µ1 ≠ µ2 ≠ µ3 ≠ µ4

Business and Economic Research
ISSN 2162-4860
2014, Vol. 4, No. 1
www.macrothink.org/ber 94
Descriptive
N Mean Std.
Deviation Std. Error
95% Confidence Interval for
Mean Minimum Maximum
Lower Bound Upper Bound
SCB's 8 797.0625 238.28992 84.24821 597.8471 996.2779 544.56 1235.65
DFI's 8 134.6375 48.66882 17.20703 93.9493 175.3257 75.10 214.40
PCB's 8 1465.2625 771.35661 272.71575 820.3922 2110.1328 588.00 2787.50
FCB's 8 196.6075 60.24405 21.29949 146.2422 246.9728 108.44 284.80
Total 32 648.3925 668.74615 118.21873 407.2838 889.5012 75.10 2787.50
ANOVA Table
Sum of Squares df Mean Square F Sig. 5% F Limit (From table F)
Between Groups 9259466.016 3 3086488.672 18.769 .000 F (3,28) 2.93
Within Groups 4604397.788 28 164442.778
Total 13863863.805 31
The above ANOVA table indicates that the calculated value of F is 18.77, which is more than
the table value of 2.93 at 5% level of significance. Hence, the null hypothesis is rejected. It
means that there is a significant difference in total deposits among all the four banking
groups.
4.2 Capital Adequacy Ratio (CAR)
Hypothesis Testing
The researcher wanted to find out that if there is any significant difference regarding the
performance related to capital Adequacy Ratio among all the four banking groups during 2004
to 2011 or not. This was tested as under.
Null Hypothesis
There is no significant different in capital adequacy ratio among all the four banking groups
during 2004 to 2011.
H0 = µ1 = µ2 = µ3 = µ4
H1 = µ1 ≠ µ2 ≠ µ3 ≠ µ4
Descriptives
N Mean Std.
Deviation
Std.
Error
95% Confidence Interval for
Mean Minimum Maximum
Lower Bound Upper Bound
SCB's 8 6.1575 4.19069 1.48163 2.6540 9.6610 -.40 11.70
DFI's 8 -3.4125 5.64205 1.99476 -8.1294 1.3044 -7.50 9.10
PCB's 8 10.6125 0.99490 .35175 9.7807 11.4443 9.10 12.10
FCB's 8 23.0375 3.71058 1.31189 19.9354 26.1396 15.60 28.10
Total 32 9.0988 10.38481 1.83579 5.3546 12.8429 -7.50 28.10

Business and Economic Research
ISSN 2162-4860
2014, Vol. 4, No. 1
www.macrothink.org/ber 95
ANOVA Table
Source of Variable SS DF MS F Ratio Sig. 5% F Limit (From table F)
Between Sample 2894 3 964.7 60.15 .000 F (3,28) 2.93
Within Sample 449.1 28 16.04
Total 3343 31
The above ANOVA table indicates that the calculated value of F is 60.15, which is more than
the table value of 2.93 at 5% level of significance. Hence, the null hypothesis is rejected. It
means that there is a significant difference in capital adequacy ratio between all the four
banking groups.
4.3 Assets Quality
4.3.1 NPLs to Total Loans Ratios
Hypothesis Testing
The researcher wanted to find out that if there is any significant difference regarding the
performance related to Non Performing Loans to total loans ratios among all the four banking
groups during 2004 to 2011 or not. This was tested as under.
Null Hypothesis:
There is no significant different in Non Performing Loans to total loans ratios among all the
four banking groups during 2004 to 2011.
H0 = µ1 = µ2 = µ3 = µ4
H1 = µ1 ≠ µ2 ≠ µ3 ≠ µ4
Descriptives
N Mean Std.
Deviation
Std.
Error
95% Confidence Interval for
Mean Minimum Maximum
Lower Bound Upper Bound
SCB's 8 21.6625 5.85124 2.06872 16.7707 26.5543 11.30 29.90
DFI's 8 30.0375 6.61080 2.33727 24.5107 35.5643 24.20 42.90
PCB's 8 4.8750 1.77100 .62614 3.3944 6.3556 2.90 8.50
FCB's 8 1.8875 .78819 .27867 1.2286 2.5464 .80 3.00
Total 32 14.6156 12.60684 2.22859 10.0704 19.1609 .80 42.90
ANOVA Table
Sum of Squares df Mean Square F Sig. 5% F Limit (From table F)
Between Groups 4355.021 3 1451.674 71.07
6 0.000 F (3,28) 2.93
Within Groups 571.881 28 20.424
Total 4926.902 31

Business and Economic Research
ISSN 2162-4860
2014, Vol. 4, No. 1
www.macrothink.org/ber 96
The above ANOVA table indicates that the calculated value of F is 71.08, which is more than
the table value of 2.93 at 5% level of significance. Hence, the null hypothesis is rejected. It
means that there is a significant difference in Non Performing Loans to total loans ratios among
all the four banking groups.
4.3.2 Ratio of net NPL to Total Loans
Hypothesis Testing
The researcher wanted to find out that if there is any significant difference regarding the
performance related to Ratio of net Non Performing Loans to total loans among all the four
banking groups during 2004 to 2011 or not. This was tested as under.
Null Hypothesis:
There is no significant different in Ratio of net Non Performing Loans to total loans ratios
among all the four banking groups during 2004 to 2011.
H0 = µ1 = µ2 = µ3 = µ4
H1 = µ1 ≠ µ2 ≠ µ3 ≠ µ4
Descriptives
N Mean Std.
Deviation
Std.
Error
95% Confidence Interval for
Mean Minimum Maximum
Lower Bound Upper Bound
SCB's 8 8.4450 6.88955 2.43582 2.6852 14.2048 -.34 17.60
DFI's 8 19.5500 3.06128 1.08233 16.9907 22.1093 16.00 23.60
PCB's 8 1.2000 1.16986 .41361 .2220 2.1780 -.20 3.40
FCB's 8 -2.0000 .35456 .12536 -2.2964 -1.7036 -2.60 -1.50
Total 32 6.7988 9.15964 1.61921 3.4963 10.1012 -2.60 23.60
ANOVA Table
Sum of Squares df Mean Square F Sig. 5% F Limit (From table F)
Between Groups 2192.548 3 730.849 50.117 .000 F (3,28) 2.93
Within Groups 408.321 28 14.583
Total 2600.870 31
The above ANOVA table indicates that the calculated value of F is 50.12, which is more than
the table value of 2.93 at 5% level of significance. Hence, the null hypothesis is rejected. It
means that there is a significant difference in Ratio of net Non Performing Loans to total loans
among all the four banking groups. The performance of all the banking groups regarding this
ratio is different.
4.4 Writing-Of Bad Debts
Hypothesis Testing

Business and Economic Research
ISSN 2162-4860
2014, Vol. 4, No. 1
www.macrothink.org/ber 97
The researcher wanted to find out that if there is any significant difference regarding Bad debts
among all the four banking groups during 2004 to 2011 or not. This was tested as under.
Null Hypothesis
There is no significant different regarding Bad debts among all the four banking groups during
2004 to 2011.
H0 = µ1 = µ2 = µ3 = µ4
H1 = µ1 ≠ µ2 ≠ µ3 ≠ µ4
Descriptives
N
Mean
Std.
Deviation
Std.
Error
95% Confidence Interval for
Mean Minimum Maximum
Lower Bound Upper Bound
SCB's 9 54.7333 23.71861 7.90620 36.5016 72.9651 26.30 92.30
DFI's 9 29.2111 4.71446 1.57149 25.5873 32.8350 17.40 32.30
PCB's 9 52.9556 21.06906 7.02302 36.7604 69.1507 21.20 85.50
FCB's 9 1.8000 .62650 .20883 1.3184 2.2816 .90 2.90
Total 36 34.6750 26.64957 4.44160 25.6581 43.6919 .90 92.30
ANOVA Table
Sum of Squares df Mean Square F Sig. 5% F Limit (From table F)
Between Groups 16624.216 3 5541.405 21.539 .000 F (3,28) 2.85
Within Groups 8232.771 32 257.274
Total 24856.988 35
The above ANOVA table indicates that the calculated value of F is 21.54, which is more than
the table value of 2.93 at 5% level of significance. Hence, the null hypothesis is rejected again.
It means that there is a significant difference in Bad debts among all the four banking groups.
The performance of all the banking groups regarding this ratio is different.
4.5 Management Soundness
4.5.1 Expenditure-income Ratio
Hypothesis Testing
The researcher wanted to find out that if there is any significant difference regarding
Expenditure-income among all the four banking groups during 2004 to 2011 or not. This was
tested as under.
Null Hypothesis:
There is no significant different regarding Expenditure-income among all the four banking
groups during 2004 to 2011.
H0 = µ1 = µ2 = µ3 = µ4

Business and Economic Research
ISSN 2162-4860
2014, Vol. 4, No. 1
www.macrothink.org/ber 98
H1 = µ1 ≠ µ2 ≠ µ3 ≠ µ4
Descriptives
N
Mean
Std.
Deviation
Std.
Error
95% Confidence Interval for
Mean Minimum Maximum
Lower Bound Upper Bound
SCB's 8 89.1000 14.76347 5.21967 76.7574 101.4426 62.70 102.30
DFI's 8 101.4125 8.66593 3.06387 94.1676 108.6574 87.80 112.10
PCB's 8 81.9625 9.52844 3.36881 73.9965 89.9285 67.60 90.20
FCB's 8 67.2375 9.90612 3.50234 58.9558 75.5192 47.30 76.30
Total 32 84.9281 16.32434 2.88576 79.0426 90.8137 47.30 112.10
ANOVA Table
Sum of Squares df Mean Square F Sig. 5% F Limit (From table F)
Between Groups 4887.138 3 1629.046 13.520 .000 F (3,28) 2.93
Within Groups 3373.866 28 120.495
Total 8261.005 31
The above ANOVA table indicates that the calculated value of F is 13.52, which is more than
the table value of 2.93 at 5% level of significance. Hence, the null hypothesis is rejected again.
It means that there is a significant difference in expenditure-income ratio among all the four
banking groups. The performance of all the banking groups regarding this ratio is different.
4.6 Earning Performance
4.6.1 Return on Assets
Hypothesis Testing
The researcher wanted to find out that if there is any significant difference regarding Return On
Assets in % among all the four banking groups during 2004 to 2011 or not. This was tested as
under.
Null Hypothesis:
There is no significant difference regarding Return on Assets in % among all the four banking
groups during 2004 to 2011.
H0 = µ1 = µ2 = µ3 = µ4
H1 = µ1 ≠ µ2 ≠ µ3 ≠ µ4
Descriptives
N
Mean
Std.
Deviation
Std.
Error
95% Confidence Interval for
Mean Minimum Maximum
Lower Bound Upper Bound

Business and Economic Research
ISSN 2162-4860
2014, Vol. 4, No. 1
www.macrothink.org/ber 99
SCB's 8 0.4875 0.59866 0.21166 -0.0130 0.9880 -0.10 1.30
DFI's 8 -0.0875 0.31368 0.11090 -0.3497 0.1747 -0.60 .40
PCB's 8 1.4250 0.33700 0.11915 1.1433 1.7067 1.10 2.10
FCB's 8 2.9750 0.33700 0.11915 2.6933 3.2567 2.20 3.20
Total 32 1.2000 1.24071 0.21933 0.7527 1.6473 -0.60 3.20
ANOVA Table
Sum of Squares df Mean Square F Sig. 5% F Limit (From table F)
Between Groups 42.932 3 14.311 83.698 .000 F (3,28) 2.93
Within Groups 4.788 28 .171
Total 47.720 31
The above ANOVA table indicates that the calculated value of F is 83.70, which is more than
the table value of 2.93 at 5% level of significance. Hence, the null hypothesis is rejected again.
It means that there is a significant difference in Return on Assets in % among all the four
banking groups. The performance of all the banking groups regarding this ratio is different.
4.6.2 Return on Equity
Hypothesis Testing
The researcher wanted to find out that if there is any significant difference regarding Return On
equity among all the four banking groups during 2004 to 2011 or not. This was tested as under.
Null Hypothesis:
There is no significant difference regarding Return on equity among all the four banking
groups during 2004 to 2011.
H0 = µ1 = µ2 = µ3 = µ4
H1 = µ1 ≠ µ2 ≠ µ3 ≠ µ4
Descriptives
N
Mean
Std.
Deviation
Std.
Error
95% Confidence Interval for
Mean Minimum Maximum
Lower Bound Upper Bound
SCB's 8 9.3250 13.62453 4.81700 -2.0654 20.7154 -6.90 26.20
DFI's 8 -24.0250 59.69675 21.10599 -73.9327 25.8827 -171.70 -.90
PCB's 8 17.9375 2.29965 0.81305 16.0149 19.8601 15.20 21.00
FCB's 8 19.5750 2.41823 0.85497 17.5533 21.5967 16.60 22.50
Total 32 5.7031 34.18884 6.04379 -6.6233 18.0295 -171.70 26.20
ANOVA Table
Sum of Squares df Mean Square F Sig. 5% F Limit (From table F)

Business and Economic Research
ISSN 2162-4860
2014, Vol. 4, No. 1
www.macrothink.org/ber 100
Between Groups 9911.906 3 3303.969 3.514 0.028 F (3,28) 2.93
Within Groups 26323.264 28 940.117
Total 36235.170 31
The above ANOVA table indicates that the calculated value of F is 3.514, which is more than
the table value of 2.93 at 5% level of significance. Hence, the null hypothesis is rejected again.
It means that there is a significant difference in Return on equity among all the four banking
groups. The performance of all the banking groups regarding this ratio is different.
4.6.3 Net Interest Income
Hypothesis Testing
The researcher wanted to find out that if there is any significant difference regarding net
interest income ratio among all the four banking groups during 2004 to 2011 or not. This was
tested as under.
Null Hypothesis:
There is no significant difference regarding net interest income ratio among all the four
banking groups during 2004 to 2011.
H0 = µ1 = µ2 = µ3 = µ4
H1 = µ1 ≠ µ2 ≠ µ3 ≠ µ4
Descriptives
N
Mean
Std.
Deviation
Std.
Error
95% Confidence Interval for
Mean Minimum Maximum
Lower Bound Upper Bound
SCB's 8 12.1375 10.65738 3.76795 3.2277 21.0473 -1.10 34.30
DFI's 8 2.6000 1.87769 .66386 1.0302 4.1698 1.00 6.20
PCB's 8 46.9500 28.58466 10.10620 23.0526 70.8474 13.70 91.40
FCB's 8 10.0375 3.95869 1.39961 6.7279 13.3471 4.20 16.10
Total 32 17.9313 22.74198 4.02025 9.7319 26.1306 -1.10 91.40
ANOVA Table
Sum of Squares df Mean Square F Sig. 5% F Limit (From table F)
Between Groups 9384.111 3 3128.037 13.173 .000 F (3,28) 2.93
Within Groups 6649.018 28 237.465
Total 16033.129 31
The above ANOVA table indicates that the calculated value of F is 13.17, which is more than
the table value of 2.93 at 5% level of significance. Hence, the null hypothesis is rejected again.
It means that there is a significant difference in net interest income ratio among all the four
banking groups. The performance of all the banking groups regarding this ratio is different.

Business and Economic Research
ISSN 2162-4860
2014, Vol. 4, No. 1
www.macrothink.org/ber 101
4.7 Liquidity
4.7.1 Liquid Assets
Hypothesis Testing
The researcher wanted to find out that if there is any significant difference regarding liquid
assets ratio among all the four banking groups during 2004 to 2011 or not. This was tested as
under.
Null Hypothesis:
There is no significant difference regarding liquid assets ratio among all the four banking
groups during 2004 to 2011.
H0 = µ1 = µ2 = µ3 = µ4
H1 = µ1 ≠ µ2 ≠ µ3 ≠ µ4
Descriptives
N Mean Std.
Deviation
Std.
Error
95% Confidence Interval for
Mean Minimum Maximum
Lower Bound Upper Bound
SCB's 8 25.9625 5.44844 1.92632 21.4075 30.5175 20.00 34.70
DFI's 8 13.1750 3.59196 1.26995 10.1721 16.1779 9.60 21.30
PCB's 8 21.5000 1.71548 0.60651 20.0658 22.9342 18.20 23.90
FCB's 8 33.5750 4.14789 1.46650 30.1073 37.0427 29.20 41.50
Total 32 23.5531 8.39443 1.48394 20.5266 26.5796 9.60 41.50
ANOVA Table
Sum of Squares df Mean Square F Sig. 5% F Limit (From table F)
Between Groups 1745.311 3 581.770 37.094 .000 F (3,28) 2.93
Within Groups 439.149 28 15.684
Total 2184.460 31
The above ANOVA table indicates that the calculated value of F is 9.554, which is more than
the table value of 2.93 at 5% level of significance. Hence, the null hypothesis is rejected again.
It means that there is a significant difference in liquid assets ratio among all the four banking
groups. The performance of all the banking groups regarding this ratio is different.
4.7.1 Excess Liquidity
Hypothesis Testing
The researcher wanted to find out that if there is any significant difference regarding Excess
Liquidity ratio among all the four banking groups during 2004 to 2011 or not. This was tested
as under.

Business and Economic Research
ISSN 2162-4860
2014, Vol. 4, No. 1
www.macrothink.org/ber 102
Null Hypothesis:
There is no significant difference regarding Excess Liquidity ratio among all the four banking
groups during 2004 to 2011.
H0 = µ1 = µ2 = µ3 = µ4
H1 = µ1 ≠ µ2 ≠ µ3 ≠ µ4
Descriptives
N
Mean
Std.
Deviation
Std.
Error
95% Confidence Interval for
Mean Minimum Maximum
Lower Bound Upper Bound
SCB's 8 9.2750 6.08928 2.15288 4.1842 14.3658 2.00 17.60
DFI's 8 4.6375 1.70037 .60117 3.2160 6.0590 2.30 7.10
PCB's 8 5.9375 1.41819 .50140 4.7519 7.1231 4.60 8.80
FCB's 8 16.6500 5.05399 1.78686 12.4248 20.8752 11.20 23.60
Total 32 9.1250 6.13882 1.08520 6.9117 11.3383 2.00 23.60
ANOVA Table
Sum of Squares df Mean Square F Sig. 5% F Limit (From table F)
Between Groups 695.567 3 231.856 13.735 .000 F (3,28) 2.93
Within Groups 472.673 28 16.881
Total 1168.240 31
The above ANOVA table indicates that the calculated value of F is 13.73, which is more than
the table value of 2.93 at 5% level of significance. Hence, the null hypothesis is rejected again.
It means that there is a significant difference in Excess Liquidity ratio among all the four
banking groups. The performance of all the banking groups regarding this ratio is different.
4.8 Correlation Analysis
4.8.1 Correlation between CRAR and Interest Income
CRAR will increase if capital increase at a rate higher than that of risk weighted assets increase.
Here, it is seen that industry CRAR increased gradually and reach a satisfactory level of 11.4%
in 2011 which is contributed by all type of banks except DFIs. Interest income also increased
over the period. The correlation between CRAR and interest income shows a positive result
which implies that increased capital base contributes to the interest income growth. The
correlation between CRAR and interest income is highest in PCBs and lowest in DFIs over the
period from 2004 to 2011.

Business and Economic Research
ISSN 2162-4860
2014, Vol. 4, No. 1
www.macrothink.org/ber 103
The industry correlation is 0.6385 which is significantly positive though DFI‟s correlation is
negative. So, we can say that as increased CRAR positively correlated with interest income and
it is possible for increasing the capital base which reduces the interest expenses to the
depositors.
4.8.2 Correlation between NPL to Loans Ratio and Interest income
NPL adversely affects interest income. NPL reduces bank's profit in two ways-first interest
suspense and second provision for NPL. Decreasing trend in NPL to loan ratio adversely
correlated with the increasing trend of interest income (See Figure 4.2).
Figure 5.19 show that there exists negative correlation between NPL to loan and interest
income. As NPL to loan ratio decreases, interest income increases and the correlation between
this two criteria is -.9622 for the industry as a whole over the period. So, we can say that Banks
should emphasize on reducing the NPL.
5.1 Findings
The performance of types of banks is not equal and there are some banks which are in need of

Business and Economic Research
ISSN 2162-4860
2014, Vol. 4, No. 1
www.macrothink.org/ber 104
monitoring closely to enhance sound banking. It is expected that the overall performance will
be improved in near future provided that appropriate actions are taken in some lagged areas.
5.1.1 Deposits
The ANOVA table indicates that the calculated value of F is 18.77, which is more than the table
value of 2.93 at 5% level of significance. Hence, the null hypothesis is rejected. It means that
there is a significant difference in total deposits among all the four banking groups.
5.1.2 Capital Adequacy Ratio (Car)
The ANOVA table indicates that the calculated value of F is 60.15, which is more than the table
value of 2.93 at 5% level of significance. Hence, the null hypothesis is rejected. It means that
there is a significant difference in capital adequacy ratio between all the four banking groups.
5.1.3 Npls to Total Loans Ratios
The ANOVA table indicates that the calculated value of F is 71.08, which is more than the table
value of 2.93 at 5% level of significance. Hence, the null hypothesis is rejected. It means that
there is a significant difference in Non Performing Loans to total loans ratios among all the four
banking groups.
5.1.4 Ratio of Net NPL to Total Loans
The ANOVA table indicates that the calculated value of F is 50.12, which is more than the table
value of 2.93 at 5% level of significance. Hence, the null hypothesis is rejected. It means that
there is a significant difference in Ratio of net Non Performing Loans to total loans among all
the four banking groups. The performance of all the banking groups regarding this ratio is
different.
5.1.5 Writing-of Bad Debts
The ANOVA table indicates that the calculated value of F is 21.54, which is more than the table
value of 2.93 at 5% level of significance. Hence, the null hypothesis is rejected again. It means
that there is a significant difference in Bad debts among all the four banking groups. The
performance of all the banking groups regarding this ratio is different.
5.1.6 Expenditure-income Ratio
The ANOVA table indicates that the calculated value of F is 13.52, which is more than the table
value of 2.93 at 5% level of significance. Hence, the null hypothesis is rejected again. It means
that there is a significant difference in expenditure-income ratio among all the four banking
groups. The performance of all the banking groups regarding this ratio is different.
5.1.7 Return on Assets
The ANOVA table indicates that the calculated value of F is 83.70, which is more than the table
value of 2.93 at 5% level of significance. Hence, the null hypothesis is rejected again. It means
that there is a significant difference in Return on Assets in % among all the four banking groups.
The performance of all the banking groups regarding this ratio is different.

Business and Economic Research
ISSN 2162-4860
2014, Vol. 4, No. 1
www.macrothink.org/ber 105
5.1.8 Return on Equity
The ANOVA table indicates that the calculated value of F is 3.514, which is more than the table
value of 2.93 at 5% level of significance. Hence, the null hypothesis is rejected again. It means
that there is a significant difference in Return on equity among all the four banking groups. The
performance of all the banking groups regarding this ratio is different.
5.1.9 Net Interest Income
The ANOVA table indicates that the calculated value of F is 13.17, which is more than the table
value of 2.93 at 5% level of significance. Hence, the null hypothesis is rejected again. It means
that there is a significant difference in net interest income ratio among all the four banking
groups. The performance of all the banking groups regarding this ratio is different.
5.1.10 Liquid Assets
The ANOVA table indicates that the calculated value of F is 9.554, which is more than the table
value of 2.93 at 5% level of significance. Hence, the null hypothesis is rejected again. It means
that there is a significant difference in liquid assets ratio among all the four banking groups.
The performance of all the banking groups regarding this ratio is different.
5.1.11 Excess Liquidity
The ANOVA table indicates that the calculated value of F is 13.73, which is more than the table
value of 2.93 at 5% level of significance. Hence, the null hypothesis is rejected again. It means
that there is a significant difference in Excess Liquidity ratio among all the four banking groups.
The performance of all the banking groups regarding this ratio is different.
Correlation Analysis
Correlation between CRAR and Interest Income
The industry correlation is 0.6385 which is significantly positive though DFI‟s correlation is
negative. So, we can say that as increased CRAR positively correlated with interest income and
it is possible for increasing the capital base which reduces the interest expenses to the
depositors.
Correlation between NPL to Loans Ratio and Interest income
Figure 5.19 show that there exists negative correlation between NPL to loan and interest
income. As NPL to loan ratio decreases, interest income increases and the correlation between
this two criteria is -.9622 for the industry as a whole over the period. So, we can say that Banks
should emphasize on reducing the NPL.
5.2 Conclusion
An efficient operation of banking sector enables the smooth financial resources intermediation
of an economy. Economic growth is contributed greatly by the efficiency of banking sector in
resources generation and its proper allocation. The smooth and efficient operation of banking
sector also helps to reduce risk of failure of an economy. Therefore, the performance of

Business and Economic Research
ISSN 2162-4860
2014, Vol. 4, No. 1
www.macrothink.org/ber 106
banking sector is always been a source of interest for researchers to judge the economic
condition of a country. Regulators of the banking sector always monitors the performance of
the banks to ensure efficient financial system based on CAMEL ratio.
Among the entire CAMEL ratio, some important ratios which are most significant are analyzed
to judge the performance of the banking industry in Bangladesh. Among the four categories of
banks operating in Bangladesh, DFIs has been found more vulnerable compared to the rest of
three categories. CRAR, NPL to total loan, EIR all are too high and provision maintenance
ratio, ROA, ROE, liquidity ratio is too low in DFIs and this scenario also reflects negatively in
overall banking industry performance of Bangladesh. FCBs shows and PCBs show all the
positive signal of well functioning whereas SCBs also shows a trend of improving
performance.
References
Ahmed, F. (1995) Performance of Commercial Banks in Bangladesh-A Note on Current trends.
Journal of the Institute of Bankers, Bangladesh. Vol. 36 -41, December 1992-June 1995.
Bangladesh Bank Annual Report, (2004-2011), (www.bangladesh-bank.org)
Bangladesh Bank Manual for Ratio Analysis and CAMEL Rating System (2006),
http://ncalculators.com/statistics/correlation-coefficient-calculator.htm
C, D, Parimal. K, G, Badal. Hasan Tuhin, Mehedi Financial Performance in Banking Sector in
Bangladesh: A Comparative Study of Some Selected Private Commercial Banks. Journal of
Banking & Financial Services, Department of Banking Faculty of Business Studies University
of Dhaka. Vol. 5 Number 1 July 2011
Chowdhury, A. (2002), “Politics, Society and Financial Sector Reform in Bangladesh”,
International Journal of Social Economics, 29(12), 963-988.
Chowdhury, H. A., & Islam, M. S. (2007), “Interest sensitivity of loans and advances: A
competitive study between nationalized commercial banks and specialized commercial banks”,
ASA University review, 1(1), 124-141.
Chowdhury, T. A., & Ahmed, K. (2009), “Performance Evaluation of Selected Commercial
Banks in Bangladesh”, International Journal of Business and Management, 4(4), 86-97.
Khan, A. R. (2009), “Sources and uses of funds, performance evaluation and bank failure”,
Bank Management: A fund Emphasis, (2nd edition), Dhaka: Decent Book House, pp. 51-68.
Mujeri, M. K., & Younus, S. (2009), “An analysis of interest rate spread in banking sector in
Bangladesh”, The Bangladesh Development Studies, 32(4), 65-89
Pandey I. M. (2004), “Financial statement analysis”, Financial Management, (9th edition).
New Delhi, India: Vikas, pp. 517-558.
Van Horne J. C. & Wachowicz Jr. J. M. (2005), “Financial statement analysis”, Fundamentals
of Financial Management, (11th edition). India, Pearson, pp. 125-168.

Business and Economic Research
ISSN 2162-4860
2014, Vol. 4, No. 1
www.macrothink.org/ber 107
Copyright Disclaimer
Copyright reserved by the author(s).
This article is an open-access article distributed under the terms and conditions of the Creative
Commons Attribution license (http://creativecommons.org/licenses/by/3.0/).