performance evaluation of road safety measures: a …
TRANSCRIPT

Transport and Communications Bulletin for Asia and the Pacific No. 74, 2005
33
PERFORMANCE EVALUATION OF ROAD SAFETYMEASURES: A CASE STUDY OF THE
DHAKA-ARICHA HIGHWAY IN BANGLADESH
Md. Shamsul Hoque*, Shah Md. Muniruzzaman**and Syed Noor-ud-Deen Ahmed*
ABSTRACT
The Dhaka-Aricha highway plays a vital role in interregional roadtransport in Bangladesh. In the past, this highway was considered asa man-made death trap owing to the frequency of fatal accidents. Withaccident reduction as one of the chief objectives, a major rehabilitation ofthe highway, including safety improvements at three black-spot areas, wasundertaken during the period 1995-2002.
An attempt has been made in this paper to evaluate the effectivenessof safety improvement measures. Their effectiveness was evaluated byapplying the “before-after” and “control-site” methods. Findings from theanalyses suggest that safety improvement measures were very effective inreducing the frequency as well as the severity of accidents. In economicterms, the estimated benefits from accident savings far outweighed theinvestment costs of safety improvements.
Keywords: Road safety in Bangladesh, effectiveness of safety improvement,block-spot safety improvement, cost-effectiveness of safetyimprovement.
INTRODUCTION
Road accident is an issue of ever growing concern in Bangladesh asthe road safety problem in the country is very serious by internationalstandards. The national trend of police reported road accidents, fatalities andinjuries for the period 1993-2000 in Bangladesh is presented in table 1. It also
* Department of Civil Engineering, BUET, Dhaka, Bangladesh; e-mail address of the first author:[email protected].
** Military Institute of Science and Technology (MIST), Dhaka, Bangladesh.

Transport and Communications Bulletin for Asia and the Pacific No. 74, 2005
34
includes the fatality rate per 10,000 motor vehicles on the road. It is clear thatthe number of fatalities has been rapidly increasing particularly in recent years.The number of fatalities increased from 1,495 in 1993 to 4,046 in 2000, nearlya threefold increase in a span of eight years.
The above statistics reveal that the fatality rate of road accidents inBangladesh is very high, with about 160 deaths per 10,000 motor vehicles ascompared with the rates of 2 in the United States of America and 1.4 in theUnited Kingdom of Great Britain and Northern Ireland. Together with the socialimpact in terms of pain, grief and suffering, road accidents appear to imposea serious economic burden on the country. At current prices, road accidents inBangladesh cost the country about taka 40,000 million (about 2 per cent ofGDP) per annum. Nearly 70-80 per cent of accidents occur on highways andrural roads and 70 per cent of the victims are pedestrians (Hoque, et al., 2003).The staggering human and economic cost figures indicate the gravity of theroad accident problem in the country and the need for urgent remedialmeasures.
Despite the recurrence of fatal accidents on roads in Bangladesh, untilvery recently road safety did not attract as much attention as it deserved fromconcerned authorities. However, during the period 1995-1999, with thefinancial assistance of Denmark, major rehabilitation work was completed ona 61-km segment of the highway from Aricha Ferry Ghat to Savar at a cost ofUS$ 43 million. Accident reduction was one of the chief objectives of this majorrehabilitation work. In addition, under the Jamuna Bridge Access Road Project(JBARP), a 14.4-km segment of the same highway from Aminbazar to Savarwas widened from a single to a dual carriageway road with a median barrier to
Table 1. Police reported road accidents in Bangladesh (1993-2000)
No. of No. of No. of TotalFatalities/
Yearaccidents fatalities injuries casualties
10,000vehicles
1993 3 140 1 495 2 409 3 904 122.1
1994 3 013 1 597 2 686 4 283 107.1
1995 3 346 1 653 2 864 4 517 110.1
1996 3 727 2 041 3 310 5 342 112.1
1997 5 453 3 162 5 076 8 238 138.2
1998 4 769 3 085 3 997 7 082 128.1
1999 3 942 3 314 2 620 5 934 140.4
2000 3 970 4 046 2 270 6 316 162.9

Transport and Communications Bulletin for Asia and the Pacific No. 74, 2005
35
enhance road safety and accommodate increasing traffic at a cost ofapproximately US$ 16.5 million (JBARP Contract Agreement Document, Roadsand Highways Department, 1997). In 1999, as a part of the nationwide safetyinitiative, 27 black spots were identified by RHD using accident data as reportedby police, of which 10 were selected for immediate improvement. Three ofthose were located along the Dhaka-Aricha highway and were improved underthe above-mentioned JBARP.
The improvement measures included pavement widening, installationof a median barrier and other safety-related features. They were implementedon the basis of the recommendations of various government and researchorganizations and donor agencies involved in the two projects. Unfortunately,no government or donor agencies involved have made any attempt so far tomonitor or evaluate the effectiveness of the implemented safety measures inimproving road safety. Also, cost-benefit analyses of such works areconspicuously missing and need be conducted very urgently. It is high timethat the effectiveness of the improvement measures are evaluated andinvestigated in order to develop future strategies and policies to combat theoverall accident problem in the country.
In this study an attempt has been made to evaluate the effectiveness ofthe safety improvement measures undertaken in three black-spot areas and twosections of the highway during the period 1995-2002. Data for such evaluationswere collected both “before” and “after” the implementation of the safetyimprovement works. Accident data were directly retrieved from the policerecords such as the First Information Report and Crime Index Register as wellas from the Hospital Road Traffic Accident register and Road Safety Cell forverification purposes.
The performance evaluation of safety measures was conducted byapplying the “before-after” technique and control-site method. An economicassessment of black-spot improvement works was also carried out to examinethe effectiveness of investments in such improvement measures. Finally,recommendations are made based on the findings of the study which may helpto implement safety improvement measures for other highways more effectivelyin the future.

Transport and Communications Bulletin for Asia and the Pacific No. 74, 2005
36
I. ROAD SAFETY SITUATION OF THEDHAKA-ARICHA HIGHWAY
The study area envisaged a total length of 75.4 km along theDhaka-Aricha highway, starting from the 11.9 km reference point at AminbazarBridge to 87.3 km at Aricha Ferry Ghat. It is a very important segment of thenational highway network, linking the capital city, Dhaka, with the ferry routes atAricha. It serves as a main connection to western and southwesternBangladesh. This highway is also a part of the Asian Highway Route AH1. Builtin 1960, it passes through six upazilas or subdistricts, namely Savar, Dhamrai,Saturia, Manikganj, Ghior and Shibalaya of Dhaka and Manikganj districts. Theyearly number of accidents on this highway between 1982 and 2003 arepresented in figure 1. It is evident from figure 1 that over this period, while totalaccidents per year have doubled, fatal accidents per year have increased morethan sevenfold. Figure 1 also shows that the rate of increase was verysignificant before 1995. After 1995, by and large a declining trend is shown forboth total accidents and fatalities.
Figure 1. Yearly accident statistics along the Dhaka-Aricha highway
Tota
l num
ber
of a
ccid
ents Banik,
1987
Hoque,1991
Present study
Total accidents Fatal accidents
1982
1983
1984
1985
1986
1987
1988
1989
1990
1991
1992
1993
1994
1995
1996
1997
1998
1999
2000
2001
2002
2003
16
4235
48
71
5062
68 69
5257
7783
102 99 96 9480
9186
90
122
160
140133
115123
136
172163164
193
174
120
84
125127
113
92
130
116119
92
78
When compared with the national accident figures presented in table 1,the total accidents and fatalities occurring on the Dhaka-Aricha highway in 1993were 5.5 per cent and 5.2 per cent of the total national accidents andfatalities respectively. The corresponding figures for 2000 were 2.9 per cent and2.5 per cent.

Transport and Communications Bulletin for Asia and the Pacific No. 74, 2005
37
II. BEFORE-AFTER ANALYSIS OF THREE BLACK SPOTS
In 1999, 27 black-spot areas were identified nationwide by RHD (RHD,1999 and 2000) using the accident database as reported by police, of which,10 were selected for immediate improvement. Three of these selected10 black-spot areas are located along the Dhaka-Aricha highway, namely theBalitha area, which is also known as Bethuli Bazaar (km 50.7-52.0), the secondGolara bridge area (km 56.0-56.7) and the Golara area (km 57.2-57.7). Theselocations are shown in figure 2.
Figure 2. Location of treated black-spot sites

Transport and Communications Bulletin for Asia and the Pacific No. 74, 2005
38
All three black spots are located on the Savar-Aricha segment of thehighway. As previously mentioned, the black spots were improved under theJamuna Bridge Access Road Project. The project commenced in 2001 and wascompleted in June 2002. In this analysis the 1996-1998 period is considered asthe “before period” while the “after period” comprises one-year data from June2002 to June 2003. The following sections provide details on the improvementmeasures undertaken in these black-spot areas.
A. Treated black-spot site 1: Balitha/Bethuli area(km 50.7-52.0)
Brief description of the treated site
Balitha area, which is also known as Bethuli Bazaar or Ballya to thelocal people, is located on a curve. It includes an unsignalized staggered-Tintersection. The pavement in this section is a 6.5 m wide single carriagewaywith 2.5-5.0 m wide paved and 2.0-2.5 m wide earthen shoulder on each side.The height of the embankment varies from 1.5 to 4 m.
Improvement measures undertaken
The major improvement measures included the widening of thecarriageway along with alignment correction, construction of bus bays,installation of concrete guard posts, warning gates with speed reducing signs atboth entry and exit points, etc.
Observations
The before-after analysis as presented in table 2 reveals that in theBalitha area significant improvement in accident reduction has taken placeowing to the improvement works undertaken. It can be seen that in this areathe total number of accidents has reduced by 68.42 per cent. A closeobservation of the table also reveals that during the “after” observation periodgrievous, property damage and simple types of accidents were eliminated andfatal accidents were reduced by about 33 per cent.
In relation to accident patterns the data in table 2 disclose thathead-on, hit-object and rear-end collisions were eliminated and pedestrianaccidents were reduced by 25 per cent. However, the overturning type ofaccident was found to have increased by 50 per cent. As only a one-year “afterperiod” is considered in this analysis, continuous monitoring is required to arriveat definite conclusions. Nevertheless, it can be inferred from the analysis that

Transport and Communications Bulletin for Asia and the Pacific No. 74, 2005
39
safety measures undertaken proved to be quite effective in reducing accidents,especially in eliminating head-on collisions. During field visits, it was observedthat although a speed limit sign was installed, it was generally ignored and oftenviolated especially by the through traffic. Buses hardly used the bus lay-bys;instead they continued to stop on the carriageway, which was highlyundesirable. Newly constructed bus sheds were already damaged and the roadshoulders were used for drying paddy.
Table 2. Before-after analysis of Balitha/Bethuli area (black-spot site 1)
Before period After period(1996-1998) (June 2002 - June 2003)
TotalAverage/
TotalAverage/
year year
Based on severity
Fatal 9 3.00 2 2 -33.33
Grievous 7 2.33 0 0 -100.00
Simple 1 0.33 0 0 -100.00
Property damage 2 0.67 0 0 -100.00
Total 19 6.33 2 2 -68.42
Based on collision type
Pedestrian 4 1.33 1 1 -25.00
Head-on 2 0.67 0 0 -100.00
Hit object 3 1.00 0 0 -100.00
Overturn 2 0.67 1 1 -50.00
Unidentified 8 2.67 0 0 -100.00
Total 19 6.33 2 2 -68.42
Notes: Fatal – An accident in which one or more persons are killed outright on the spotis called a fatal accident.
Grievous – An accident in which a person has received injuries, such asfractures, concussions, internal lesions, crushing, severe cuts and lacerationsand severe general shock, requiring medical treatment and detention in hospital.
Simple – An accident in which a person sustained injuries but need not beadmitted to hospital. It can also include an accident victim who sustainedinjuries and was treated in hospital but not detained overnight.
Property damage – A property damage type accident is when motor vehicleshit a pedestrian, another vehicle in traffic, a parked vehicle, an animal, a fixedobject, etc.
The figures were rounded to two places after the decimal, and as such they maynot sum up to the totals shown in the table.
Change ofaccident(per cent)
Basis ofcomparison

Transport and Communications Bulletin for Asia and the Pacific No. 74, 2005
40
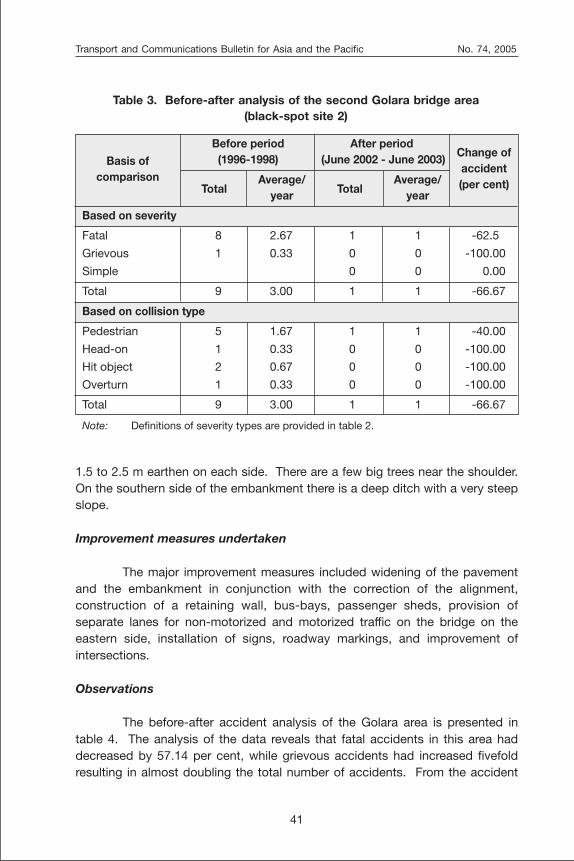
B. Treated black-spot site 2: second Golara bridge area(km 56.0-56.7)
Brief description of the treated site
The area includes a bridge with sharp bends and vertical curves. Attimes it is difficult to see the bends from both directions which restricts availablesight distance especially at night. The pavement in this section has two lanes,6.5-m in width and a smooth non-skid surface. The embankment height variesfrom 3 to 4.5 m. The average shoulder width ranges between 1.5-2.5 m pavedand 1.0-1.5 m earthen on each side. The bridge width is less than the approachwidth of the pavement.
Improvement measures undertaken
The major improvement works undertaken at this site includedwidening of the pavement and the embankment in conjunction with alignmentcorrection, installation of pavement markings and signs and safety guard postsat the bridge approaches.
Observations
From table 3 it is evident that significant improvement had taken placein accident reduction owing to the improvement works. At this black spot, thetotal number of accidents decreased by 66.67 per cent. Based on severity, thegrievous, property damage and simple types of accidents were totallyeliminated and fatal accidents were reduced by 62.5 per cent. Regardingaccident patterns, head-on, hit-object, overturning and unidentified collisionswere eliminated and pedestrian accidents were reduced by 40 per cent.
C. Treated black-spot site 3: Golara area(km 57.2-57.7)
Brief description of the treated site
The Golara area is located on a sharp curve. The area includesa T-type unsignalized major-minor intersection. There are two bridges withinthis area on the eastern and western sides at the entry/exit points to thissection. The pavement in this section has two lanes, 7.0-m in width, anda smooth non-skid surface. The height of embankment varies between 3.0 and5.0 m. The average shoulder width ranges from 2.0 to 3.5 m paved and from
Transport and Communications Bulletin for Asia and the Pacific No. 74, 2005
41
1.5 to 2.5 m earthen on each side. There are a few big trees near the shoulder.On the southern side of the embankment there is a deep ditch with a very steepslope.
Improvement measures undertaken
The major improvement measures included widening of the pavementand the embankment in conjunction with the correction of the alignment,construction of a retaining wall, bus-bays, passenger sheds, provision ofseparate lanes for non-motorized and motorized traffic on the bridge on theeastern side, installation of signs, roadway markings, and improvement ofintersections.
Observations
The before-after accident analysis of the Golara area is presented intable 4. The analysis of the data reveals that fatal accidents in this area haddecreased by 57.14 per cent, while grievous accidents had increased fivefoldresulting in almost doubling the total number of accidents. From the accident
Table 3. Before-after analysis of the second Golara bridge area(black-spot site 2)
Before period After period(1996-1998) (June 2002 - June 2003)
TotalAverage/
TotalAverage/
year year
Based on severity
Fatal 8 2.67 1 1 -62.5
Grievous 1 0.33 0 0 -100.00
Simple 0 0 0.00
Total 9 3.00 1 1 -66.67
Based on collision type
Pedestrian 5 1.67 1 1 -40.00
Head-on 1 0.33 0 0 -100.00
Hit object 2 0.67 0 0 -100.00
Overturn 1 0.33 0 0 -100.00
Total 9 3.00 1 1 -66.67
Note: Definitions of severity types are provided in table 2.
Change ofaccident(per cent)
Basis ofcomparison

Transport and Communications Bulletin for Asia and the Pacific No. 74, 2005
42
pattern data it can also be seen that after the improvement works, thehit-pedestrian and head-on types of accidents had increased threefold.Nevertheless, overturning, sideswipe and rear-end collisions had been totallyeliminated.
During field visits at this location, intense roadside non-motorizedactivities were observed on both sides of the road owning to the presence ofvendors, shops, mosque, offices, etc. Most importantly, a primary school islocated near the road, requiring the children to cross the busy road. No speedcalming device or pedestrian refuge could be found.
Change ofaccident(per cent)
Basis ofcomparison
Table 4. Before-after analysis of Golara area (black-spot site 3)
Before period After period(1996-1998) (June 2002 - June 2003)
TotalAverage/
TotalAverage/
year year
Based on severity
Fatal 7 2.33 3 3 -57.14
Grievous 2 0.67 4 4 500.00
Simple 1 0.33 0 0 -100.00
Total 10 3.33 7 7 110.00
Based on collision type
Pedestrian 4 1.33 3 3 125.00
Head-on 2 0.67 3 3 350.00
Hit object 1 0.33 0 0 -100.00
Overturn 1 0.33 0 0 -100.00
Sideswipe 1 0.33 0 0 -100.00
Rear end 1 0.33 0 0 -100.00
Dropped from bus 0 0.00 1 1 100.00
Unidentified 1 0.33 0 0 -100.00
Total 11 3.67 7 7 110.00
Notes: Definitions of severity types are provided in table 2.

Transport and Communications Bulletin for Asia and the Pacific No. 74, 2005
43
III. BEFORE-AFTER ANALYSIS OF TWO SELECTEDHIGHWAY SEGMENTS
A. Aminbazar-Savar section(selected segment 1; km 11.9-26.3)
With the assistance of the Asian Development Bank, this section of theDhaka-Aricha highway was rehabilitated under JBARP. Improvement of roadsafety along this corridor was one of the major objectives of this project. Themost important safety measures in this area included modifying the two-laneundivided carriageway road into a four-lane divided carriageway road, medianbarrier, embankment widening and correction of alignment geometrics. Theconstruction started in November 1997 and was completed in December 2000.
For the before-after analysis, the three-year period between 1995 and1997 was the before period and the two-and-a-half year period betweenJanuary 2001 and June 2003 was the after period. Data related to thebefore-after analysis are presented in table 5. It can be seen that the totalnumber of accidents, grievous accidents and property damage had decreasedby 10.0 per cent, 36 per cent and 20.0 per cent, respectively, while fatalaccidents unexpectedly had increased by 9.6 per cent.
On close observation of the data it was found that pedestrian fatalityhad increased significantly. Accident patterns show that head-on collisions,previously the most fatal type of accidents, were reduced by almost 60 per centand unidentified types of accidents were also dramatically reduced by 93 percent. On the other hand, rear-end and sideswipe accidents unusually increasedby nine- and eight-fold, respectively, and hit-pedestrians and overturningaccidents increased by 170 per cent and 80 per cent, respectively. Anotherimportant feature noticed was that two completely new forms of accidents,namely hit-island and right-angle collisions had emerged after implementationof the improvement works. This could be owing to the fact that medianopenings were provided without any protection for right turning vehicles.During field visits it was observed that in the absence of flaring or any protectiverefuge, the right turning vehicles needed to wait on the fast lane of thecarriageway before making the turn, which was undesirable for such a highstandard divided road.
The significant reduction of head-on collisions suggests that themedian was very effective in reducing this type of accident. Although it wasexpected that no head-on collisions would occur on a four-lane dividedhighway, it can be observed that this type of accident was still taking place.

Transport and Communications Bulletin for Asia and the Pacific No. 74, 2005
44
Field observations revealed that the installation of a continuous median hadprompted local truck drivers, particularly those engaged in roadside brick fieldsand earth filling activities, to take a shortcut by using the wrong side of the roadto avoid taking a detour. This type of contra-flow in a divided road oftensurprised the oncoming drivers and lead to unexpected head-on collisions.This grim picture definitely suggests that there is a need for strong enforcementin the form of highway police patrolling to catch and punish violators and toestablish disciplined traffic movements and thereby improve overall safety.Moreover, it was also observed that the low height mountable median wascontributing to many overturning accidents.
In consideration of the long implementation period of the project,an assessment of the performance evaluation of overall improvement workswas made by taking account of the real use of the highway in terms ofvehicle-kilometre (veh-km), which is a widely accepted practice in comparing
Table 5. Before-after analysis of the Aminbazar-Savar section(selected segment 1)
Before Period (1995-1997) After period (January 2001 - June 2003)
TotalAverage/ Accident/ Total Average/ Acc/km/ Change
year km/year No. year year (per cent)
Based on severity
Fatal 81 27.0 1.9 74 29.6 2.06 9.6
Grievous 32 10.7 0.7 17 6.8 0.47 -36.3
Simple 10 3.3 0.2 2 0.8 0.06 76.0
Property damage 9 3.0 0.2 6 2.4 0.17 -20.0
Based on collision type
Pedestrian 20 6.7 0.5 45 18.0 1.25 170
Head-on 3 1.0 0.1 1 0.4 0.03 -60
Hit island 0 0.0 0.0 2 0.8 0.06 200
Hit object 0 0.0 0.0 1 0.4 0.03 100
Hit parked vehicle 0 0.0 0.0 1 0.4 0.03 100
Overturn 2 0.7 0.05 3 1.2 0.08 80.0
Sideswipe 1 0.4 0.03 8 3.2 0.22 850
Rear end 3 1.0 0.08 26 10.4 0.72 940
Dropped from bus 0 0.0 0.0 2 0.8 0.06 100
Right angle 0 0.0 0.0 4 1.6 0.11 400
Unidentified 103 34.6 2.45 6 2.4 0.17 -93.1
Total 132 44.0 3.12 99 39.6 2.75 -10.0
Note: Definitions of severity types are provided in table 2.
Basis ofcomparison

Transport and Communications Bulletin for Asia and the Pacific No. 74, 2005
45
before-after data on an equal basis. Accident rates in terms of accidents per100 million veh-km are presented in table 6 and graphically depicted in figure 3.
In this study the average daily traffic (ADT) was estimated for the entireobservation period based on the Road Material Standard Study (RHD, 1995)and Roads and Highways Department traffic flow database for 1996-1998 and2003. From the estimated growth rates it is found that there was an increase of9.5 per cent per year in traffic flow during the 1990-1998 period. However, inthe two years following the opening of the Jamuna Bridge in 1998, nearly10.3 per cent of traffic was diverted from the Dhaka-Aricha segment of thehighway to the newly opened alternative high standard Jamuna Bridge corridor.This decline in traffic growth on the Dhaka-Aricha highway halted after 2000 andhas since started to increase at an annual rate of nearly 9 per cent. The detailsof ADT estimation can be found in Muniruzzaman (2004).
As can be seen from table 6, the total number of accidents haddecreased by 19.2 per cent after implementation of the improvement works.The recurrence of fatal accidents showed more encouraging results than thatshown in table 5. There was no increase in fatal accidents despite a 9.6 percent increase annual traffic volume.
Table 6. Change of accident rates along the Aminbazar-Savar section(selected segment 1)
1995 51 82.3 39.2
1996 50.6 112.6 85.0 75.1 52.1
1997 54.8 60.2 41.9
1998 48.8 57.3 32.8
1999 50.3 45.7 57.8 -19.2 35.8 44.4 0
2000 51.1 70.5 64.6
2001 54.1 77.6 55.5
2002 58.2 77.3 68.7 53.2 52.2
2003 62.7 51.1 47.9
Year
Obs
erva
tion
peri
od
Mot
oriz
edve
h-km
(mill
ion)
Tota
l acc
iden
tra
te/1
00 m
illio
nve
h-km
Year
ly a
vera
geac
cide
nt r
ate
Bef
ore-
afte
rch
ange
(per
cen
t )
Fata
l acc
iden
t/10
0 m
illio
nve
h-km
Year
lyav
erag
efa
talit
y ra
te
Bef
ore-
afte
rch
ange
(per
cen
t)
Aft
erco
n-st
ruct
ion
Bef
ore
con-
stru
ctio
n
Dur
ing
con-
stru
ctio
n

Transport and Communications Bulletin for Asia and the Pacific No. 74, 2005
46
1990 1991 1992 1993 1994 1995 1996 1997 1998 1999 2000 2001 2002 2003
Motorized veh-km Fatality rate/100 million veh-km
Accident rate/100 million veh-km Fatal accident rate/100 million veh-km
B. Savar-Aricha section (selected segment 2; km 26.0-87.0)
With the assistance of the Government of Denmark, about 61.0 km ofthe highway from Savar Bazaar (26.0 km) to Aricha (87.0 km) was rehabilitated.The project included 48.90 km of pavement construction, 12.10 km of overlay,repair/construction of bridges and culverts, and installation of safety features.One of the major objectives of the project was to reduce the incidence ofaccidents. Though the process started in 1991, actual construction workstarted in 1995 and was completed in 1999. Salient safety features of theproject included provision of road signs, pavement markings, kilometreage andguard posts, repair of shoulders, correction of alignment geometrics, provisionof crash barriers and footways/verges, approach slabs and protective works forbridge/roads.
This portion of the highway is a single carriageway. The widths of thepavement and shoulder vary between 6.5 and 7.0 m and 1.0 and 1.5 m,respectively. The height of the embankment is 2-6 m. The results of thebefore-after accident analysis of this area are presented in table 7. As may be
Figure 3. Accident rate in vehicle-km travel for the Aminbazar-Savarsegment (km reference, 11.9-26.3, JBARP)
Motorized veh-km
Accident rate/100 million veh-km
Fatality rate/100 million veh-km
Fatal accident rate/100 million veh-km
1990 1991 1992 1993 1994 1995 1996 1997 1998 1999 2000 2001 2002 2003
32.635.6
60.0
89.0
42.038.0
44.0
39.042.6
60.2
100.0
138.4
141.5
82.3
112.6
51.0
60.2
32.7 32.7
50.6
82.075.0
60.2
54.8
27.0
30.0
48.8
57.350.3
45.751.1
64.0
70.5
77.6 77.6
54.1
62.7
47.0
58.2
25.8
46.6
25.5
49.0

Transport and Communications Bulletin for Asia and the Pacific No. 74, 2005
47
Table 7. Before-after accident analysis of Savar-Aricha section(selected segment 2)
Before Period After period(1990-1995) (April 1999 - June 2003)
TotalAverage/ Rate/
TotalAverage/ Rate/
year year/km year year/km
Severity
Fatal 337 56.17 0.92 157 36.94 0.60 -34.23
Grievous 227 37.83 0.62 54 12.71 0.21 -66.42
Simple 51 8.50 0.14 26 6.12 0.10 -28.03
Property damage 17 2.83 0.05 6 1.41 0.02 -50.17
Total 632 105.33 1.72 243 57.18 0.93 -45.72
Collision type
Pedestrian 214 35.67 0.58 97 22.82 0.37 -36.01
Head-on 57 9.50 0.15 33 7.76 0.13 -18.27
Hit object 20 3.33 0.05 11 2.59 0.04 -22.35
Overturn 40 6.67 0.11 7 1.65 0.03 -75.29
Sideswipe 7 1.17 0.02 9 2.12 0.03 81.51
Rear end 22 3.67 0.06 30 7.06 0.12 92.51
Dropped from bus 2 0.33 0.01 1 0.24 0.00 -29.41
Unidentified 270 45.00 0.73 55 12.94 0.21 -71.24
Total 632 105.33 1.72 243 57.18 0.93 -45.72
Note: Definitions of severity types are provided in table 2.
The figures were rounded to two places after the decimal, and as such they maynot sum up to the totals shown in the table.
Basis ofcomparison
Change/km/year
(per cent)
seen, the accident situation along this segment of the highway has shownmarked improvement after implementation of the project. The total number ofaccidents and fatal accidents were reduced by 45.72 per cent and 34.23 percent, respectively. In terms of accident patterns, over turning, hit-pedestrian,hit-object and head-on collisions were drastically reduced by 75.29 per cent,36 per cent, 22.35 per cent and 18.27 per cent, respectively.
The significant improvement in the accident situation clearly indicatesthat the improvements of roadway geometric and operating conditionsundertaken in this segment were very effective in reducing these types ofaccidents. Although rear-end and sideswipe collisions showed significantincreases in percentage terms, this was due to the very low number of thesetypes of accidents in the before period. Their increases in terms of absolutenumbers were not of much significance.

Transport and Communications Bulletin for Asia and the Pacific No. 74, 2005
48
IV. EVALUATION OF BLACK-SPOT IMPROVEMENTMEASURES USING CONTROL-SITE TECHNIQUE
One of the popular and useful methods of evaluation is to compare theaccidents of treated sites with other sites of similar geometrics and trafficconditions, where no such improvement has been made. Such sites are knownas control sites. In this study those sites which satisfied the following criteriawere selected:
(a) Similarity in general characteristics (network configuration,geometry, land use, enforcement);
(b) Geographical closeness and one treated site must have twocontrol sites;
(c) Equivalent traffic flow;
(d) Unaffected by treatment at test site;
(e) Not treated within the designated before-after period;
(f) Availability of accident data.
In consideration of the above-mentioned criteria, the Shrirampur area(control site 1), Barbaria area (control site 2) and Jagir area (control sites 3) wereselected as control sites, as illustrated in figure 4. It can be seen that thetreated and control sites are on the same stretch of highway and the treatedsites are the same black spots referred to earlier. Comparisons of accidentsat these control sites and those at treated sites are presented in tables 8through 10.
Table 8. Comparison of before-after results for treatedsite 1 using control sites
Accident typeTreated site 1 Control site 1 Control site 2
(per cent) (per cent) (per cent)
Fatal -33.33 57.14 120.00
Grievous -100.00 -100.00 -100.00
Simple -100.00 -100.00 0.00
Property damage -100.00 -100.00 0.00
Total -68.42 -35.29 37.50
Note: Definitions of accident types are provided in table 2.

Transport and Communications Bulletin for Asia and the Pacific No. 74, 2005
49
Figure 4. Accident pin diagram for treated and control sites
Transport and Communications Bulletin for Asia and the Pacific No. 74, 2005
50
Data presented in table 8 reveal that at treated site 1 fatal and totalaccidents had decreased by 33.33 per cent and 68.42 per cent, respectively,whereas at control sites 1 and 2 fatal accidents had increased by 57.1 per centand 120 per cent, respectively. Total accidents at control site 2 had increasedby 37.5 per cent and at control site 1 had decreased by 35.29 per cent, but thisdecrease was much lower than the corresponding decrease at the treated site(68.42 per cent). Critical observations suggest that safety improvements attreated site 1 were apparently very effective in reducing accidents both in termsof their frequency and severity.
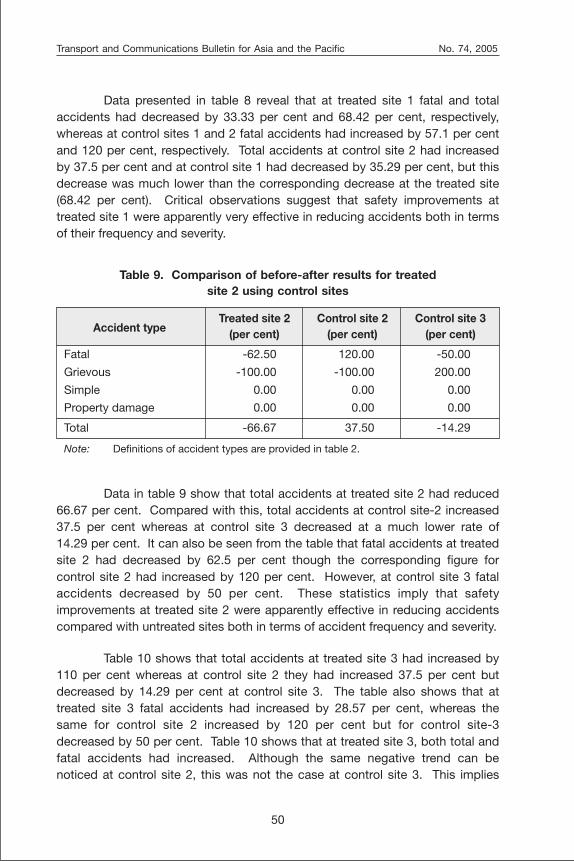
Table 9. Comparison of before-after results for treatedsite 2 using control sites
Accident typeTreated site 2 Control site 2 Control site 3
(per cent) (per cent) (per cent)
Fatal -62.50 120.00 -50.00
Grievous -100.00 -100.00 200.00
Simple 0.00 0.00 0.00
Property damage 0.00 0.00 0.00
Total -66.67 37.50 -14.29
Note: Definitions of accident types are provided in table 2.
Data in table 9 show that total accidents at treated site 2 had reduced66.67 per cent. Compared with this, total accidents at control site-2 increased37.5 per cent whereas at control site 3 decreased at a much lower rate of14.29 per cent. It can also be seen from the table that fatal accidents at treatedsite 2 had decreased by 62.5 per cent though the corresponding figure forcontrol site 2 had increased by 120 per cent. However, at control site 3 fatalaccidents decreased by 50 per cent. These statistics imply that safetyimprovements at treated site 2 were apparently effective in reducing accidentscompared with untreated sites both in terms of accident frequency and severity.
Table 10 shows that total accidents at treated site 3 had increased by110 per cent whereas at control site 2 they had increased 37.5 per cent butdecreased by 14.29 per cent at control site 3. The table also shows that attreated site 3 fatal accidents had increased by 28.57 per cent, whereas thesame for control site 2 increased by 120 per cent but for control site-3decreased by 50 per cent. Table 10 shows that at treated site 3, both total andfatal accidents had increased. Although the same negative trend can benoticed at control site 2, this was not the case at control site 3. This implies

Transport and Communications Bulletin for Asia and the Pacific No. 74, 2005
51
that safety improvement measures at treated site 3 apparently do not indicateany encouraging results in relation to the situation at untreated control sites.
From the above, it is evident that safety improvement measures werevery effective in accident reduction at treated sites 1 and 2 but were less attreated site 3 when accident situations at their respective control sites are takeninto consideration.
V. ECONOMIC EVALUATION OF THESAFETY MEASURES
In order to examine the justification of relatively large investmentrequirements for the safety improvement works, economic returns wereestimated by quantifying the gains in accident reduction in terms of theireconomic value. In this study, the before-after costs of accidents as well as thetotal economic losses due to accidents which occurred along this segment ofhighway during the whole analysis period were calculated. The costestimations were based on the average costs of accidents in Bangladesh asdeveloped by the World Bank (IDC, 1998). The unit costs for each type of roadtraffic accident are shown in table 11. More details of costing can be found inMuniruzzaman (2004).
The results of the estimated economic benefits presented in table 12show that, for the first year, accident savings in percentage of investment forBalitha, the second Golara Bridge area and the Golara area were 178.6 percent, 251.9 per cent and 9.4 per cent, respectively. The estimated high rates ofreturn justify the installation of safety measures to reduce accidents. Further, asunit costs at 1997 price were used, the return would be much higher at thecurrent pricing level.
Table 10. Comparison of before-after results for treatedsite 3 using control sites
Accident typeTreated site 3 Control site 2 Control site 3
(per cent) (per cent) (per cent)
Fatal 28.57 120.00 -50.00
Grievous 500.00 -100.00 200.00
Simple -100.00 0.00 0.00
Property damage 0.00 0.00 0.00
Total 110.00 37.50 -14.29
Note: Definitions of accident types are provided in table 2.

Transport and Communications Bulletin for Asia and the Pacific No. 74, 2005
52
Data in table 13 reveal that for the entire duration of the study (January1990-June 2003), the estimated total cost for all accidents along theDhaka-Aricha highway was 1,267 million taka with an average annual cost of93.86 million taka. The cost figures imply that economic losses due toaccidents in this corridor were very high even after significant improvement dueto site-specific investments. It suggests that there is further scope forimprovement in the overall accident situation of this important travel corridor.
Table 11. Average accident cost by type of severity and cost component(thousands of taka)
Component Fatal Grievous SimplePropertydamage
Lost output 591.3 7.9 0.5 0.0
Medical costs 6.2 7.4 0.2 0.0
Human costs 354.8 4.7 0.3 0.0
Vehicle damage 100.0 75.0 50.0 2.5
Administration 0.5 0.5 0.5 0.5
Total 1 052.8 95.5 51.5 3.0
Source: Institutional Development Component (IDC), 1998, Economic Working Paper E8on Accident Costs.
Table 12. Economic analysis of black-spot improvement(thousands of taka)
Yearly loss Yearly loss Benefit of Cost of First yearName of before after improve- improve- return
black-spot improve- improve- ment ment (per cent)ment ment
Balitha area 3 399.89 2 106 1 293.89 724.4 178.6
Second Golara 2 842.49 1 053 1 789.49 710.3 251.9 Bridge area
Golara area 2 533.97 1 433 1 100.97 11 746.1 9.4

Transport and Communications Bulletin for Asia and the Pacific No. 74, 2005
53
Tab
le 1
3.
Acc
iden
t co
sts
alo
ng t
he D
haka
-Ari
cha
hig
hway
(m
illio
ns o
f ta
ka)
Fata
l acc
iden
tG
riev
ous
acci
dent
Sim
ple
acci
dent
Pro
pert
y da
mag
eTo
tal
Upa
zila
acci
dent
acci
dent
s
No.
Cos
t
No.
Cos
t
No.
Cos
t
No.
Cos
tTo
tal c
ost
Tota
lP
erTo
tal
Per
Tota
lP
erTo
tal
Per
Tota
lP
erye
arye
arye
arye
arye
ar
Sav
ar53
155
941
263
251.
8636
1.85
0.14
720.
20.
0258
643
.42
Dha
mra
i18
919
915
878
0.62
40.
210.
0210
0.0
0.00
208
15.3
7
Sat
uria
6164
530
30.
214
0.21
0.02
30.
00.
0067
4.99
Man
ikga
nj11
712
39
888
0.62
381.
950.
148
0.0
0.00
134
9.89
Ghi
or82
866
646
0.45
30.
150.
012
0.0
0.00
936.
86
Shi
bal
aya
167
176
1319
20.
1344
2.26
0.17
0.0
0.00
180
13.3
3
Tota
l1
147
1 20
789
551
523.
9012
96.
630.
4995
0.2
0.02
1 26
893
.86
Transport and Communications Bulletin for Asia and the Pacific No. 74, 2005
54
CONCLUSIONS
Both before-after and control-site methods of analyses revealed thatthe limited site-specific safety improvement measures undertaken along theDhaka-Aricha highway were very effective in reducing the frequency as well asthe severity of accidents. However, in a few instances the implementedaccident countermeasures did not produce the desired level of positive effects.In such cases, as field surveys disclosed, for a number of reasons the safetyimprovement measures did not produce the desired effects. These include thepresence of intense roadside hawking and non-motorized activities, conflictinguse such as drying paddy and jute in marginal areas and the absence ofenforcement measures.
The economic benefits from accident savings are potentially very high.Considering the staggering economic losses resulting from accidents andevidence of good economic returns from investments related to safetyimprovement at the black-spot areas, it can be said emphatically that if safetyimprovement measures together with effective enforcement were undertaken forother black-spot areas of the country, considerable social and economicalbenefits to the nation would be achieved.
Finally, based on the findings of the study the followingrecommendations are made which may lead forward the implementation ofsafety improvement measures on other highways or accident-prone highwaylinks more effectively in the future:
● The placement of road medians on four-lane undivided highways wasfound to be a very effective countermeasure in reducing the incidenceof head-on collisions. However, it was observed that if the requiredopenings in the median island were not designed properly and placedat inappropriate locations, this resulted in right-angle collisions betweenthrough and turning vehicles and hit-island collisions at the mediannoses. As such, for better results openings should be provided toensure the safety of waiting right turning vehicles in the form offlaring, installing protective refuge island and proper treatment of themedian-noses. Further, in consideration of climb-ups and overturningtype accidents with low height mountable medians, the New Jerseytype of safety barrier, which has the potential for deflecting derailedvehicle as well as cutting headlight glare, should be used.
● Many discrete type guard-posts installed at the treated sites werefound to be broken during field visits. In consideration of the high

Transport and Communications Bulletin for Asia and the Pacific No. 74, 2005
55
embankment (4 to 8 m) without any at-grade recovery area as well asthe low performance of rigid guard-posts it is suggested that, in futuresafety improvement works, the continuous W-beam type of guard-railsafety barrier should be given preference over concrete guard-posts.
● It was also observed that at locations with intense pedestrian andnon-motorized activities, the installation of road signs, markings, buspull-outs, etc. was not enough to reduce the frequency and severity ofaccidents. In order to ensure pedestrian safety there is a need for theconstruction of parallel service roads on both sides of a highway,protective raised walking and crossing facilities as well as installation ofstreet lighting facilities.
● In some cases, the benefits of safety improvement measures fell shortof expectations owing to the lack of enforcement. This implies thateffective enforcement should be considered in tandem withimprovement works. In this respect, the introduction of a highwaysurveillance team involving local community leaders could bea possibility, in particular to control the conflicting uses of roadwaymarginal areas for purposes such as the following:
❏ Drying of agricultural products
❏ Keeping domestic animals near the highway for grazing
❏ Temporary markets and hawking
❏ Contra-flow on divided highway
❏ Operation of unlicensed non-standard vehicles, etc.
It is expected that when making investments on highway safetyimprovement works in the future, better results would be achieved if theserecommended measures are taken into cognizance and put into practice byrelevant organizations.
REFERENCES
Banik, G.C. 1987. Aspects of Road Geometry’s in Relation to Traffic and RoadAccidents – A Case Study of Dhaka-Aricha Road, MSc EngineeringThesis, Department of Civil Engineering, BUET, Dhaka.
Hoque, M.M, M.K.M. Habib and J.B. Alam, 2003. The Challenges ofAddressing Road Safety Problems, Proceedings of the National Seminaron Globalization and the Challenges for the Developing Countries:Bangladesh Perspective, 47th Annual Convention held at Chittagong,Institute of Engineers Bangladesh, Dhaka.

Transport and Communications Bulletin for Asia and the Pacific No. 74, 2005
56
Hoque, M.M., 1991. Accident Investigation for the Safety Improvement ofDhaka-Aricha Highway (A Section of Asian Highway), Bureau of ResearchTesting and Consultation, BUET, Dhaka.
Institutional Development Component, 1998. Economic Working Paper E8 onAccident Costs, Second Road Rehabilitation and Maintenance Project(RRMP), Roads and Highways Department, Ministry of Communications,Dhaka.
Ministry of Communications, 1994. Rehabilitation of Works between Savar toAricha Segment of N5 Highway, Tender Document, Bangladesh.
Muniruzzaman, S.M., 2004. Performance Evaluation of Road Safety Measuresin Dhaka-Aricha Highway, MSc Engineering Thesis, Department of CivilEngineering, BUET, Dhaka.
Roads and Highways Department, 1995. Development of Geometric DesignStandards, Final Report, volume VIIB, Road Materials and StandardsStudy Bangladesh, Ministry of Communications, Dhaka.
Roads and Highways Department, 1997. Improvement and Rehabilitation ofMirpur-Savar Road Section, Contract Agreement Document, JamunaBridge Access Road Project (JBARP), Dhaka.
Roads and Highways Department, 1999. Road Network Database Reportfor 1995-1998, Volume 2, Part C, RHD Detailed Zonal Report Series,1996-1998, Planning and Development Wing, Roads and HighwaysDepartment, Dhaka.
Roads and Highways Department, 1999. The Draft List of the Pilot ProjectAreas for Analysis to Identify the Black Spots on the Dhaka-ArichaHighway, RHD Report, Roads and Highways Department, Dhaka.
RHD Status Report and Monthly Progress Report, 2000. Road Safety Measureson National and Regional Roads, Roads and Highways Department,Dhaka.
RHD Report, 2003. Road Network Database Dhaka Zonal Report 2002, HDMCircle, Roads and Highways Department, Dhaka.