performance evaluation of mfis - microfinance … performance analysis– trias – brussels,...
TRANSCRIPT

MFIs Performance Analysis – TRIAS – Brussels, January 2005
Performance Evaluation of MFIs
TRIAS Training sessionBrussels
January 2005

MFIs Performance Analysis – TRIAS – Brussels, January 2005
Objective of the 2 sessions
! Give a brief overview about the concept of PerformanceEvaluation as a tool to:" have an opinion about the performance and risk profile of an MFI
(strengths/weaknesses) " to see how an MFI evolves" to compare an MFI to the sector
! Financial ratios and indicators are divided into four groups" Portfolio analysis" Efficiency and Productivity analysis" Financial Management analysis" Profitability analysis
! We will only show a couple of examples and illustrate a few indicators

MFIs Performance Analysis – TRIAS – Brussels, January 2005
Presentation of PILARH! Location: Honduras. !Type: rural microfinance!Main objective: enable a maximum of families to
access to farmland through two types of loans:" Long term loans (70% of the gross loan portfolio) - 750$
for 7 years on average- to purchase the land, at an annual interest rate of 24% secured by the land itself.
" Short-term loans (30% of the gross loan portfolio) – 300$ for 10 months on average- to pay for farm equipment and labour, at an annual interest rate of 30%.
!No savings services. !Compulsory life term insurance: 0.3% of the loan
amount per year.

MFIs Performance Analysis – TRIAS – Brussels, January 2005
What is « Performance Evaluation » ?! Analysis based on standard indicators to assess the level
of performance and risk of a microfinance institution (MFI)
! It might be a tool for the MFI" to have a clear view about its current performance and risks
(strengths and weaknesses)" to facilitate decision-making through the identification of
improvement areas." to motivate the entire institution towards performance
improvement" to follow up its development, assess progress in achieving
sustainability" to compare to its peers" To improve transparency and getting more credit from third-
parties" To present itself to potential funders
MFIs Performance Analysis – TRIAS – Brussels, January 2005
What is « performance evaluation »!It might be a tool for a donor or a
supporting NGO" to better know the performance / level of
sustainability of its partner" to better understand the kind of support its
partner is asking for" to easily follow-up the evolution of its partner
!It might be a tool for investors" to identify potential investments" to follow-up the MFIs they are investing into
MFIs Performance Analysis – TRIAS – Brussels, January 2005
What are the progress made in terms of Performance Evaluation ?
! About seven years ago..." MFI follow-up was based on:
• cumulative number of disbursed loans, members, clients,...• repayment rate, average loan size,...• net income
" Each entity (donor, NGO or investor) needed to assess the sustainability of itspartners through its own method which was time consuming for it and for theMFI as well.
! Today" There is a set of standard indicators (non exhaustive)" There is a consensus about terms and definitions to be used within the
microfinance industry" There are several agencies specialized in MFIs performance evaluation" MFIs may use one evaluation report internally as well as for several of their
partners (from donors up to investors)" The IADB/CGAP Rating Fund may co-finance a performance evaluation

MFIs Performance Analysis – TRIAS – Brussels, January 2005
Important rules when analyzing ratios! Ratios can help answer two primary questions that every
institution involved in microfinance needs to ask." Is this institution either achieving or progressing towards
sustainibility?" How efficient is it in achieving its given objectives?
! Ratios must be:" Analyzed together, " Consistently and periodically tracked over a period of time=
trend analysis
! In addition to analyzing past trends, ratios, in conjunction with policy decisions, are helpful when preparing financial projections.

MFIs Performance Analysis – TRIAS – Brussels, January 2005
Financial ratios and indicators
!They are usually divided into four groups:#Portfolio quality;#Efficiency and Productivity;#Financial management / Risk management;#Profitability and sustainibility.

MFIs Performance Analysis – TRIAS – Brussels, January 2005
The Loan Portfolio Quality Analysis

MFIs Performance Analysis – TRIAS – Brussels, January 2005
Gross Loan portfolio
!Portfolio :#Main assets, main source of revenue;#Main risk sources; especially given the fact
that microfinance clients do not offer collateraland are facing a lot of risks.
!Caracteristics in microfinance:" If well managed, portfolio quality is usually better than
in commercial banks" Portfolio quality may deteriorate or improve very
quickly.

MFIs Performance Analysis – TRIAS – Brussels, January 2005
Portfolio quality
#Portfolio Quality will depend primarily on:
# The portfolio affected by arrears
# The level of provisions
# Loan losses

MFIs Performance Analysis – TRIAS – Brussels, January 2005
Main indicators for portfolio quality
!PARn: Which part of my portfolio is at risk?
!Write-off ratio: which part of my portfolio is a loss?
!Risk coverage ratio: which part of myPortfolio at Risk is covered? How to protect myself against losses?
!Provision expense ratio: how much doesthis protection cost?

MFIs Performance Analysis – TRIAS – Brussels, January 2005
Portfolio at Risk: calculation! The PAR measures the risk to come: what is at risk of
not being repaid, notion of contamination.
! The MFI chooses the appropriate number of days: 1, 15, 30 days… It could also be useful to specify the end of the period of calculations: PAR30-365 or PAR 30-180
(1) Specify if the numerator includes the« refinanced/rescheduled » portfolio
PARn =
Outstanding Balance on Arrears over « n » days (1) + Total Gross Outstanding Refinanced (restructured) Portfolio (2)
Total Outstanding Gross Portfolio

MFIs Performance Analysis – TRIAS – Brussels, January 2005
Portfolio at Risk: Analysis!Should remain low and rather stable!A PaR > 10% IS WORRYING! The following points will be discussed to better
understand why the MFI has a good or bad PAR: " Appropriateness of the requested products;" Write-off policy" Loan repayment frequency" Period of growth" Seasonality " National crisis;" Guarantees quality.

MFIs Performance Analysis – TRIAS – Brussels, January 2005
Portfolio at Risk: limitations
!Non-integration of rescheduled and refinanced loans
!Bad accountancy of partial repayments

MFIs Performance Analysis – TRIAS – Brussels, January 2005
PILARH: Gross Loan portfolio and PAR30
6,2%
2,1%
9,9%
4,3%
0
2 000
4 000
6 000
8 000
10 000
12 000
14 000
16 000
18 000
20 000
2000 2001 2002 2003
Thou
sand
s $
-1%
1%
3%
5%
7%
9%
11%
Gross loan portfolio % PaR 30
Average PaR30 in LA: 5,6%
+ 21%
+ 48%+ 48%
+ 48%
+ 8%
MFIs Performance Analysis – TRIAS – Brussels, January 2005
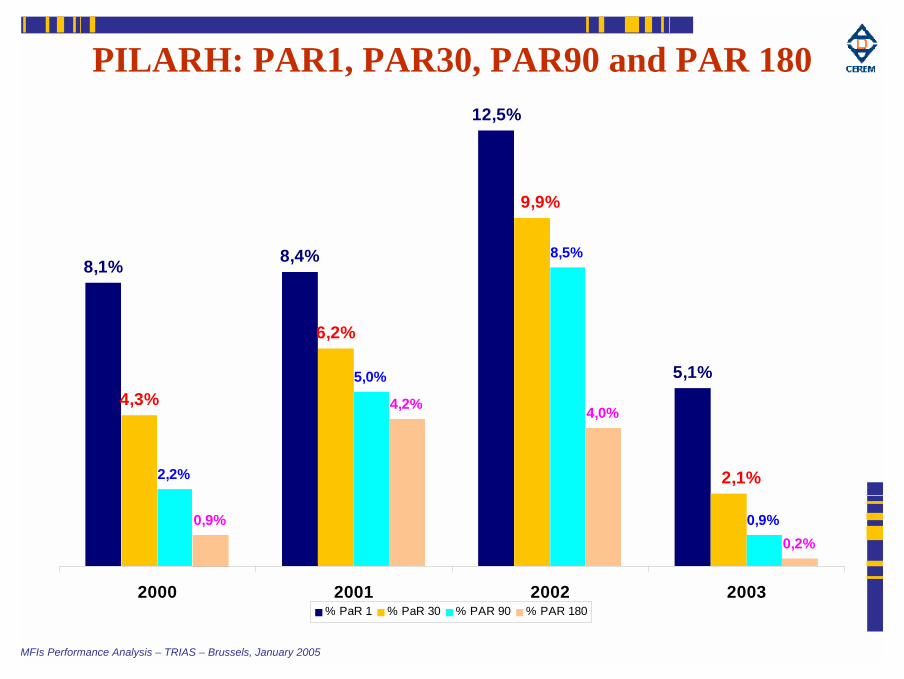
PILARH: PAR1, PAR30, PAR90 and PAR 180
8,1% 8,4%
12,5%
5,1%4,3%
6,2%
2,2%
5,0%
8,5%
0,9%0,9%
4,2% 4,0%
0,2%
9,9%
2,1%
2000 2001 2002 2003% PaR 1 % PaR 30 % PAR 90 % PAR 180

MFIs Performance Analysis – TRIAS – Brussels, January 2005
Risk coverage ratio: calculation
#Most of the time, the level is quite high (>100%).
Risk Coverage ratio = Loan Loss Reserves
(Outstanding Balance on Arrears over 30 days + Refinanced Loans)
#This ratio shows:# The part of the portfolio at risk that is
covered by provisions# The capacity of the MFI to create
adequate provisions for covering possible losses without cutting into its own funds.

MFIs Performance Analysis – TRIAS – Brussels, January 2005
Risk coverage ratio: analysis
!This ratio should be fairly constant.
!This ratio must be analyzed in conjunction with the PAR and Write-Off ratios, since all three are interdependent.
!Quality of the guarantees.

MFIs Performance Analysis – TRIAS – Brussels, January 2005
Risk coverage ratio: limitations
Pay attention to the influence of the existing regulatory framework regarding provisions: legal provision is theminimum, not the optimal amount.

MFIs Performance Analysis – TRIAS – Brussels, January 2005
Provisioning policies
MF Standards Rating agency Y
1-30 days : 10% 1-30 days : 10%
31-90 days: 30% 31-60 days: 30%
91-180 days: 60% 1-90 days: 60%
>180 days: 100% 90 days: 100%
Ren. Portf.: 100% Ren. Portf.: 50%
Ren. Portf. + 1d: 100%

MFIs Performance Analysis – TRIAS – Brussels, January 2005
PILARH: PaR 30
4,3%
6,2%
2,1%
9,9%
2000 2001 2002 2003

MFIs Performance Analysis – TRIAS – Brussels, January 2005
PILARH: Risk Coverage ratio and PaR
4,3%
6,2%
9,9%
2,1%
23%16%
49%
193%
0%
2%
4%
6%
8%
10%
12%
2000 2001 2002 20030%
20%
40%
60%
80%
100%
120%
140%
160%
180%
200%
% PaR 30 Risk coverage ratio

MFIs Performance Analysis – TRIAS – Brussels, January 2005
Monitoring the portfolio quality
1. Periodical analysis of the PaR through a delinquency report detailed:
" By term of the loan product" by activity sector" For each analyst⇒ Objective: understand why and identify where the PaR comes
from.
2. Credit demand analysis and process" Importance of the credit analyst" Role of the credit committee" Rigor in the implementation of the credit methodology
3. Define a conservative provisions and write-off policy and implement it

MFIs Performance Analysis – TRIAS – Brussels, January 2005
How to react when the portfolio deteriorates?
!Focus on the PaR analysis
!Increase provisions
!Check the credit demand analysis process
!Review credit methodology or markettargets.

MFIs Performance Analysis – TRIAS – Brussels, January 2005
A little exercise
0%
1%
2%
3%
4%
5%
6%
7%
PAR 31
A B

MFIs Performance Analysis – TRIAS – Brussels, January 2005
0%
1%
2%
3%
4%
5%
6%
7%
PAR 31 PAR 91
A B

MFIs Performance Analysis – TRIAS – Brussels, January 2005
0%
1%
2%
3%
4%
5%
6%
7%
PAR 31 PAR 91 Loan loss rate
A B

MFIs Performance Analysis – TRIAS – Brussels, January 2005
0%
10%
20%
30%
40%
50%
60%
70%
80%
90%
100%
PAR 31 PAR 91 Loan loss rate Risk coverage ratio
A B

MFIs Performance Analysis – TRIAS – Brussels, January 2005
0%
10%
20%
30%
40%
50%
60%
70%
80%
90%
100%
PAR 31 PAR 91 Loan loss rate Risk coverage ratio Provision expenseratio
A B

MFIs Performance Analysis – TRIAS – Brussels, January 2005
Conclusions on the portfolio quality

MFIs Performance Analysis – TRIAS – Brussels, January 2005
Main indicators of performance evaluation
TRIAS training session
Brussels
January 2005

MFIs Performance Analysis – TRIAS – Brussels, January 2005
Objective of the 2 sessions
! Give a brief overview about the concept of PerformanceEvaluation as a tool to:" have an opinion about the performance and risk profile of an MFI
(strengths/weaknesses) " to see how an MFI evolves" to compare an MFI to the sector
! Financial ratios and indicators are divided into four groups" Portfolio analysis" Efficiency and Productivity analysis" Financial Management analysis" Profitability analysis
! We will only show a couple of examples and illustrate a few indicators

MFIs Performance Analysis – TRIAS – Brussels, January 2005
Financial ratios and indicators
!They are usually divided into four groups:#Portfolio quality;#Efficiency and Productivity;#Financial management / Risk management;#Profitability and sustainibility.

MFIs Performance Analysis – TRIAS – Brussels, January 2005
Efficiency and productivity
!!Operating expense ratioOperating expense ratio
!!Active clients per staff memberActive clients per staff member
!!Active clients per loan officerActive clients per loan officer!Cost per borrower

MFIs Performance Analysis – TRIAS – Brussels, January 2005
Operating expense ratio: calculation
• The operating expense does not include the financial expense and the provision expense. It includes the staff expense, and the non-staff operating expense (i.e., “administrative expenses”, including depreciation and amortization).
Operating Expense ratio =Operating Expense
Average Gross Portfolio

MFIs Performance Analysis – TRIAS – Brussels, January 2005
Operating expense ratio: analysis
!This ratio provides the best indicator of the overall efficiency of a lending institution.
!The lower it is, the more efficient the MFI is.

MFIs Performance Analysis – TRIAS – Brussels, January 2005
Operating expense ratio: limitations
!Influence of:" The portfolio size
" Average loan amount
!Need to consider the specificities of theMFI such as salary scale, the division of work, rural/urban location, savingscollection

MFIs Performance Analysis – TRIAS – Brussels, January 2005
PILARH: Operating expenses vs Gross LoanPortfolio
29%31%
36%
-
2 000
4 000
6 000
8 000
10 000
12 000
14 000
16 000
18 000
2001 2002 2003
Thou
sand
s
0%
5%
10%
15%
20%
25%
30%
35%
40%
Average portfolio Operating expense ratio
Average: 22%

MFIs Performance Analysis – TRIAS – Brussels, January 2005
Staff and Loan officers’ productivity: calculation
! Active clients per staff member = Number of active clientsNumber of personnel
! Active clients per loan officers = Number of active clientsNumber of loan officers
" Consumer loans and pawn loans are excluded from thecalculation
" Voluntary work is not taken into account (cooperatives)
MFIs Performance Analysis – TRIAS – Brussels, January 2005
Staff and Loan officers’ productivity: analysis
1. The higher the ratio, the better the productivity2. Analyze jointly loan officers’ productivity and
staff productivity.3. Productivity is important because staff is the
main cost for the MFI.4. A low ratio does not mean that staff members
are not working hard. You should analyse the overall structure taking into account: " credit methodology (group-based, individual, credit
unions)" Staff division ( administrative / operational)" MFI’s background (location, density of clientele)

MFIs Performance Analysis – TRIAS – Brussels, January 2005
PILARH: productivity of staff members andloan officers
135
167182180
250
308
2001 2002 2003
Staff productivity Loan officers' productivity
331
Average : 134

MFIs Performance Analysis – TRIAS – Brussels, January 2005
Financial ratios and indicators
!They are usually divided into four groups:#Portfolio quality;#Efficiency and Productivity;#Financial management / Risk management;#Profitability and sustainibility.

MFIs Performance Analysis – TRIAS – Brussels, January 2005
Financial /Risk management
!!The Funding expense ratioThe Funding expense ratio!Cost of funds ratio
!Debt/Equity ratio

MFIs Performance Analysis – TRIAS – Brussels, January 2005
Funding expense ratio: calculation#This ratio measures the total interest
expense incurred by the MFI to fund its loan portfolio.
Funding Expense ratio =Interest and Fee Expenses
Average Gross Portfolio

MFIs Performance Analysis – TRIAS – Brussels, January 2005
Funding expense ratio: analysis
# This ratio added to the provision expense and to the operating expense ratios, allows to define the minimum lending rate to charge to clients in order to cover all the expenses;
# The difference between the portfolio yield and the funding expense ratio accounts for the net margin of interests
# The ratio depends much on the funding resources: debt or donations.
# This ratio tends to increase as the MFI becomes less dependant on donations: this is not a bad sign of performance! (contrary to other expense ratios);
# For MFIs collecting savings, this ratio will probably belower, but the operating expense ratio will be most likely higher.

MFIs Performance Analysis – TRIAS – Brussels, January 2005
PILARH: Funding expense ratio
1,7%
3,5%
7,0%
2001 2002 2003
Average in LA: 4,5%

MFIs Performance Analysis – TRIAS – Brussels, January 2005
Profitability
!Return on Equity (ROE)
!Return on Assets (ROA)
!!Portfolio yieldPortfolio yield

MFIs Performance Analysis – TRIAS – Brussels, January 2005
Portfolio yield: calculation
Portfolio yield = Interest and fee income from loan portfolioAverage Gross Loan portfolio
MFIs Performance Analysis – TRIAS – Brussels, January 2005
Portfolio yield: analysis
!This accounts for the amounts effectively received by the institution from the clients.
!It indicates the capacity of the MFI to generate revenues in order to cover its financial and operating costs.
!It is to be compared to the effective interest rate and to the quality of the portfolio.

MFIs Performance Analysis – TRIAS – Brussels, January 2005
Portfolio yield composition

MFIs Performance Analysis – TRIAS – Brussels, January 2005
PILARH’s portfolio yield composition
28,6% 30,6%35,9%
22%
4,7%
6,6%
2,90%
3,5%
7,0%
4,50%
-1,6%
-14,4%-11,2%
14,0%
0,2%
1,7%
-20,0%
-10,0%
0,0%
10,0%
20,0%
30,0%
40,0%
50,0%
60,0%
2001 2002 2003 Microrate average
Net Operatingmargin
Fundingexpense ratio
Provisionexpense ratio
Operatingexpense ratio

MFIs Performance Analysis – TRIAS – Brussels, January 2005
Conclusions on performance indicators
!Profitability is required to achieve growth (outreach), enables innovation and access to new sources of funding.
!Portfolio quality and Efficiency are the basis for sustainability.
!These ratios are part of the decision-making process

MFIs Performance Analysis – TRIAS – Brussels, January 2005
Conclusions on the PILARH case

MFIs Performance Analysis – TRIAS – Brussels, January 2005
ANNEXES

MFIs Performance Analysis – TRIAS – Brussels, January 2005
Portfolio Quality Indicators
PARn =
Outstanding Balance on Arrears over « n » days + Total Gross Outstanding Refinanced (restructured) Portfolio
Total Outstanding Gross Portfolio
Provision Expense ratio = Loan Loss Provision Expense
Average Gross Portfolio
Risk Coverage ratio = Loan Loss Reserves
(Outstanding Balance on Arrears over 30 days + Refinanced Loans)
Write-off ratio = Amounts written-off for the period
Average gross portfolio

MFIs Performance Analysis – TRIAS – Brussels, January 2005
Profitability ratios
ROE = Net Income after taxes and before donations
Average Equity
ROA = Net Income after taxes and before donations
Average Assets
Portfolio Yield = Interest and Fee Income
Average Gross Portfolio
OperationalSelf Sufficiency =
Financial Revenue
Operational Exp. + Loan loss provision Exp. + Financial Exp.
Operating Expense ratio =Operating Expense
Average Gross Portfolio
Funding Expense ratio =Interest and Fee Expense
Average Gross Portfolio

MFIs Performance Analysis – TRIAS – Brussels, January 2005
#Balance Sheet terms definition
Financial Terms
Assets
Short term assetsCash on hand / Non I –bearing depositsShort term I-bearing investmentsNet short term loan portfolio
Gross short term loan portfolioLoan loss reserves
Interests receivableOther short term assets
Long term assetsLong term investmentsGross long term loan portfolioNet fixed assetsOther long term assets
Liabilities
LiabilitiesShort term liabilities
SavingsShort term loansOther short term liabilities
Long term liabilitiesLoan term loansInsuranceOther long term liabilities
EquityPaid up share capitalDonated equityCurrent year profit/lossRetained earnings / ReservesOther equity accounts

MFIs Performance Analysis – TRIAS – Brussels, January 2005
#Income Statement terms definition
Financial Terms
! Financial Revenue- - Financial Expense- = Financial Income- - Operating Expense- - Net loans provision expense- = Operating Income- + Non-operating revenue- - Non-operating expense- = Net Operating Income before taxes and donations- - Income taxes- = Net Operating Income before donations- + Revenue from donations- = Net Income
We consider the Net IncomeBEFORE donations in order to mesure the real performance of
the MFI.
Net or gross provision expense ?
What do we include in « non-operating » ?

MFIs Performance Analysis – TRIAS – Brussels, January 2005
The « Vicious » cycle
Growth Inefficiency andLosses
Need for Capital
DonorFunds
High InterestRates
LessDemand
MicroRate A Rating Agency for Microfinance

MFIs Performance Analysis – TRIAS – Brussels, January 2005
The « Virtuous » cycle
Growth
IncreasedProfits
Access toCapital
Reduced InterestRates
IncreasedDemand
Increased Efficiency andPortfolio Quality
MicroRate A Rating Agency for Microfinance