performance evaluation of infosys …shodhganga.inflibnet.ac.in/bitstream/10603/57773/13/13... ·...
TRANSCRIPT

ChBf^ter '4
PERFORMANCE EVALUATION OF INFOSYS TECHNOLOGIES LIMITED
1. introciuction 2. Historical Perspective Z. Indian IT Industry and Infosys Technologies
Limited 4. Physical Performance Evaluation
a. Total Revenue, PAT, PBIDT b. Earnings by Industry Segments c. Earnings by Geographical Segments d. Share Capital And Earnings e. Human Resources f. Research and Development (R&D) g. Foreign Exchange Earnings h. Strategic Investments
5. Financial Performance Evaluation 6. Economic Value Added (EVA) 7. Social Performance Evaluation 8. Corporate Governance and Infosys Technologies
Limited 9. UN Global Compact Programme and Infosys
Technologies Limited Commitments 10 Conclusion 11. References

Performance Evaluation of Infosys Technologies Limited
Chapter 4
Performance Evaluation of Infosys Technologies Limited
1. Introduction
The previous chapter presented a detailed account as regards the
performance evaluation of iriformation Technology industry since economic
liberalization. The chapter also highlighted the performance of different
segments of iriformation technology from exports and domestic market
separately. It further discussed the present status of Indian IT industry in
global business milieu. It has incontrovertibly been proved that the IT
Industry has become the role model for the other industries of the economy.
The present chapter is devoted to assess the performance of Infosys
Technologies Limited. Infosys is a gold standard of the Indian Software
services industry. In this chapter, an attempt has been made to appraise the
physical and financial performances of Infosys from 1995-96 to 2003-04. This
chapter also discusses the expenditure on Research and Development (R & D)
and foreign exchange earnings of Infosys besides threadbare analysis of
different ratios including revenue earnings, exports, export market to total
earnings and export earnings by geographical segments. Socieil performance
of Infosys has also been measured in this chapter. The study also presents
analysis as regards Infosys investment in other global corporations along with
corporate governance.
2. Historical Perspective
The Infosys was established in 1981 by six young software engineers
under the stewardship of Mr. R. Narayan Murthy from Patni Computers, as a
private limited company under the name of Infosys Consultants Private
Limited. These software engineers brought into the company their wide
(135)

Performance Evaluation of Infosys Technologies Limited
experience, having handled projects in developed countries like USA, France
and Canada. The company's operations were carried out from a development
center in Banglore.'^ Infosys opened international office in US in 1987. Growth
came in the early 90's, when two large offshore contracts from US companies,
Reebok and GE were signed. The company was converted into a public
limited company and registered, as Infosys Technologies Limited in 1992. In
1993, the company had its IPO of 1.37 million shares at a premium of Rs. 85.^
The funds were used to set up a new development facility, at the outskirts of
Banglore city. In the same year the company obtained ISO 9001 and Tick IT
certificate.
The company made a private placement of 5,50,00 shares at Rs. 450
each to FIIs, financial institutions and corporate in 1994. In 1995, the company
set up development centers across cities in India, and the same year it bagged
best Annual Report Award from Institute of Chartered Accountancy of India
(ICAI).3 The Company established Infosys Foundation to focus on
contributing back to society in 1996. In 1996, the Infosys set up its first office
in Europe in Milten, Keynes, U.K. and started e-business practice through
Infosys Internet consulting practice. The company set up office in Toronto,
Canada and acquired SEI CMM level 4 certificates in 1997. In March 1999,
Infosys issued 2.07 million American Depositary Shares (ADS) equivalent to
1.035 million equity shares of Rs. 10 each at US$ 34 per ADS under the ADS
programme and crossed the US $ 100 million mark in annual revenue.^ In the
same year, Infosys became the first Indian registered company to get listed on
NASDAQ and acquired SEI-CMM Level 5 certificate. The company opened its
office in Germany, Sweden, Belgium and Australia and two more
development centers in US in 1999. In the same year, company also started
Infosys Business Consulting Services through reorganization for competences
building Domain Competency Group (DCG), Software Engineering and
(136)

Performance Evaluation of Infosys Technologies Limited
Technology Labs (SETLABS) and Communication Vertical Practices (CAPS).
In 1999, the Infosys became IT giant and strengthened its position further in
France by adding Schneider Electric, Alastam and EJC to its client list, adding
Toshiba System Finance, Schluniberger and Cardiff.
Infosys was the first company to be awarded "National Award For
Excellence in Corporate Governance" conferred by the Goverrunent of India
in the year 2000.5 j ^ j g same year, it crossed US$ 200 million mark in annual
revenue and established office in Hong Kong, Global Development Center in
Canada, U.K. and 3 more development centers in US. In 2001,the Infosys
touched US$ 400 million in annual revenue and opened offices in UAE,
Argentina and development center in Japan. Infosys entered into an alliance
with Sun Microsystems in 2001, to jointly market its products with Sun's
platform to banks across the world.^ In financial year 2002, Mr. Nandan
Nilikani took over as Chief Executive Officer while Mr. R. Narayana Murthy
became Chairman and Chief Mentor. The company also touched half billion
US$ and opened offices in Netherlands, Singapore and Switzerland in 2002.
The 2004 was the year of celebration, when Infosys crossed a US$ billion
height in annual revenue.
3. Indian IT Industry and Infosys Technologies Limited
The concept of Information Technology has revolutionized the Indian
economy. Now, it is flying high and is considered one of the fastest growing
industries of the economy. The Indian IT Industry has pasted its mark in the
global market by supplying high quality of software and services since the
economic liberalization of Indian economy showing tremendous growth
potential for future.^ Infosys Technologies Limited is a flag bearer and given
momentum of Indian IT revolution. Infosys have made millionaires to their
promoters, employees and as well as small investors. The mainstay of Infosys
(137)

Performance Evaluation of Infosys Technologies Limited
is enterprise application and it is well entrenched in the banking, financial
services and insurance segment.
Table 4.1 throws light on share of Infosys revenue in Indian IT Industry
total revenue from 1994-95 to 2003-04. Table also provides the revenue of
Indian IT industry and Infosys in terms of Rs. Crore. It is evident from the
table the share of Infosys revenue in the total revenue of Indian IT Industry
was 0.91 percent in 1994-95, which rose continuously to reach 5.33 percent
during the financial year 2003-04 accounting for a growth of more than 4
percent in a span of eight years. Table further reveals that the average revenue
of Infosys is Rs. 1837.42 crore with a S.D. 1714.81 for the period under study.
The C.V. indicates that there is a wide fluctuation in the total revenue of
Infosys.
Table - 4.1 Statement Showing Share of Infosys in Indian IT Industry Revenue
(1991-92 to 2003-04)
Year
1994-95 1997-98 1998-99
1999-2000 2000-01 2001-02 2002-03 2003-04 Mean S.D C.V.
Indian IT Industry
Revenue (Rs. Crore) 6,345
18,641 25,304 36,179 56,592 65,788 76,482 89,260
46823.88 29627.97
0.63
Infosys Revenue (Rs. Crore)
57.70 260.37 512.74 921.46
1,959.94 2603.59 3,622.69 4,760.89 1837.42 1714.81
0.93
Share of Infosys in Indian IT
Industry (Percentage)
0.91 1.40 2.03 2.55 3.46 4.74 4.74 5.33 3.14 1.67 0.53
Source: Compiled and computed from Nassocm's web portal and Various Annual Reports of Infosys and Annexure 1.
(138)

Performance Evaluation of Infosys Technologies Limited
4. Physical Performance Evaluation of Infosys Technologies
Limited
An attempt has been made in the following paragraphs to assess the
physical performance of Infosys Technologies Limited in terms of total
revenue from domestic and export market, PAT and PBIDT, the revenue by
industry segments and geographical segments during the period 1995-96 -
2003-04. Performance of human resources and Economic Value Added are
also evaluated along with share capital strengths of the company and the
strategic investments by Infosys for the period under review.
a. Infosys Earnings
One of the India's top information technology services firm, Infosys
offers a range of consulting and software services, including development and
maintenance. Infosys increased their revenue earnings from Rs. 93.41 crore in
the financial year 1995-96 to Rs. 4760.89 crore in 2003-04. The table 4.2
provides statistics regarding revenue. Profit after tax and operating profit in
terms of Rs. Crore from 1995-96 to 2003-04.
Along with this, the table also shows PAT as a percentage of total
income and operating profit (PBIBT) as a percentage of total revenue during
1995 - 2004. The first IPO of the company came in 1993. The company
registered its revenue earnings in 1993-94 at Rs. 30.08 crore and now it has
reached up to the level of Rs. 4760.89 crore during the year 2003-04. PAT and
PBIDT of the company are also increasing continuously with high growth
rate. Table further shows that average profit after tax of Infosys is Rs. 462.95
crore for the referred period. The S.D. and C.V. suggest wide fluctuating
tendency in PAT and PBIDT both during the period under review.
(139)

Performance Evaluation of Infosys Technologies Limited
Table - 4.2 Statement Showing Infosys's Total Revenue, Profit After Tax and
Operating Profit (1991-92 to 2003-04)
Year
1995-96
1996-97
1997-98
1998-99
1999-00
2000-01
2001-02
2002-03
2003-04
Mean
S.D.
C.V.
Revenue (Rs.Crore)
93.41
143.81
260.37
512.74
921.46
1959.94
2603.59
3622.69
4760.89
1653.21
1696.36
1.02
PAT (Rs. Crore)
21.01
33.68
60.36
132.92
285.95
623.32
807.96
957.93
1243.47
462.95
458.37
0.99
PBIDT
31.37
46.79
85.90
201.63
340.57
704.84
1037.63
1272.04
1584
589.41
585.35
0.99
PAT as a percentage of Revenue
22.49
23.41
23.18
25.92
31.03
31.80
31.03
26.44
26.11
26.82
3.62
0.13
PBIDT as a percentage of Revenue
33.58
34.81
34.03
37.40
41.12
41.27
39.85
35.11
33.26
37.04
3.11
0.08
Source: Compiled and computed from. Various Annual Reports of Infosys
The Infosys is a globally recognized brand in software sector. It is the
second largest software exporter in India. Infosys has registered 27.70 percent
growth in export earrungs and 12.83 percent growth in domestic earrungs
during 2003-04. Earnings from export market shared major portion of total
earnings of the Infosys. Table 4.3 renders an account of exports revenue and
domestic revenue in terms of Rs. Crore from 1996 to 2004. The table also
provides statistics regarding growth trends in exports and domestic market of
the company. It is indicated that the Infosys has recorded 23.90 percent
growth in total revenue earnings in 2003-04. The earnings from exports have
accounted for Rs. 125.30 crore and from the domestic market the earnings
(140)

Performance Evaluation of Infosys Technologies Limited
were registered to the tune of Rs. 18.51 crore in 1996-97. Infosys has earned
revenues amounting to Rs. 3544 crore from exports and Rs. 1216.89 crore from
the domestic market during the financial year 2003-04. The statistical
description in the table provides that the average exports and domestic
revenues are Rs. 1248.44 crore and Rs. 599.74 crore respectively. Table further
shows the S.Ds and C.Vs for the exports revenue and domestic revenue of
Ir\fosys for the period under study. The C.V. indicates that the revenue from
exports is widely fluctuating as compare to domestic revenue.
Table-4.3 Statement Showing Infosys Earning from Export and Domestic Market
(1996-97 to 2003-04) {Ks.'Crore)
Year
1996-97
1997-98
1998-99
1999-00
2000-01
2001-02
2002-03
2003-04
Mean
S.D.
C.V.
Export Revenue
125.30
250.90
260.90
500.70
869.70
1874.03
2562.0
3544.0
1248.44
1271.71
1.01
Domestic Revenue
18.51
9.47
251.84
420.76
1090.24
729.56
1060.69
1216.89
599.74
491.36
0.81
Total Revenue
143.81
260.37
512.74
921.46
1959.94
2603.59
3622.69
4760.89
1848.18
1702.27
0.92
Growth Export
(%) -
50.05
3.83
47.89
42.42
53.59
26.85
27.70
36.11
17.74
0.49
Growth Domestic
(%)
-95.38
96.23
40.14
61.40
-49.43
31.21
12.83
13.85
65.79
4.75
Growth Total
(%)
44.76
49.21
44.35
52.98
24.72
28.13
23.90
38.29
12.30
0.32
Source: Same as table 5.2
Infosys appears to have been attracting earnings mainly from exports
market through providing software and services to more than 200 companies
(141)

Performance Evaluation of Infosys Technologies Limited
globally. Table 4.4 presents the statistics regarding the share of exports
earnings and share of domestic earnings in the total earnings of the company
from 1996 to 2004. Table also throws light on the growth trends in the share of
exports and domestic market. It is evident from the tabular analysis that the
share of exports and domestic earnings accounted for 87.12 percent and 12.88
percent in the total earnings of the Infosys. The slow down of global economy
in 2000-01, the share breakup of the exports and domestic earnings has
changed major portion of earrungs accrued from domestic market i.e. 55.63
percent while the export earnings amounted to 44.37 percent. However, in the
successive years once again share of exports has dominated in the total
earnings of Infosys in 1996-97. The earnings from export was of the order of
74.43 percent as against the domestic market share of 25.57 percent in
company's total earnings during 2003-04.
Table - 4.4 Statement Showing Share of Exports and Domestic Earnings in Total
Earnings of Infosys (1996-2004)
(In terms of Percentage) Year
1996-97
1997-98
1998-99
1999-00
2000-01
2001-02
2002-03
2003-04
Share of Exports in
total Earning of Infosys
87.12
96.36
50.88
54.33
44.37
71.97
70.72
74.43
Share of Domestic in total Earning
ofInfosys 12.88
3.64
49.12
45.67
55.63
28.03
29.28
25.57
Growth share of Export Market
-
9.58
-89.38
6.35
-22.44
38.34
-1.38
4.98
Growth share of
Domestic Market
-
-253.84
92.58
-7.55
17.90
-98.46
4.26
-14.50
Source: Same as table 5.3
(142)
Performance Evaluation of Infosys Technologies Limited
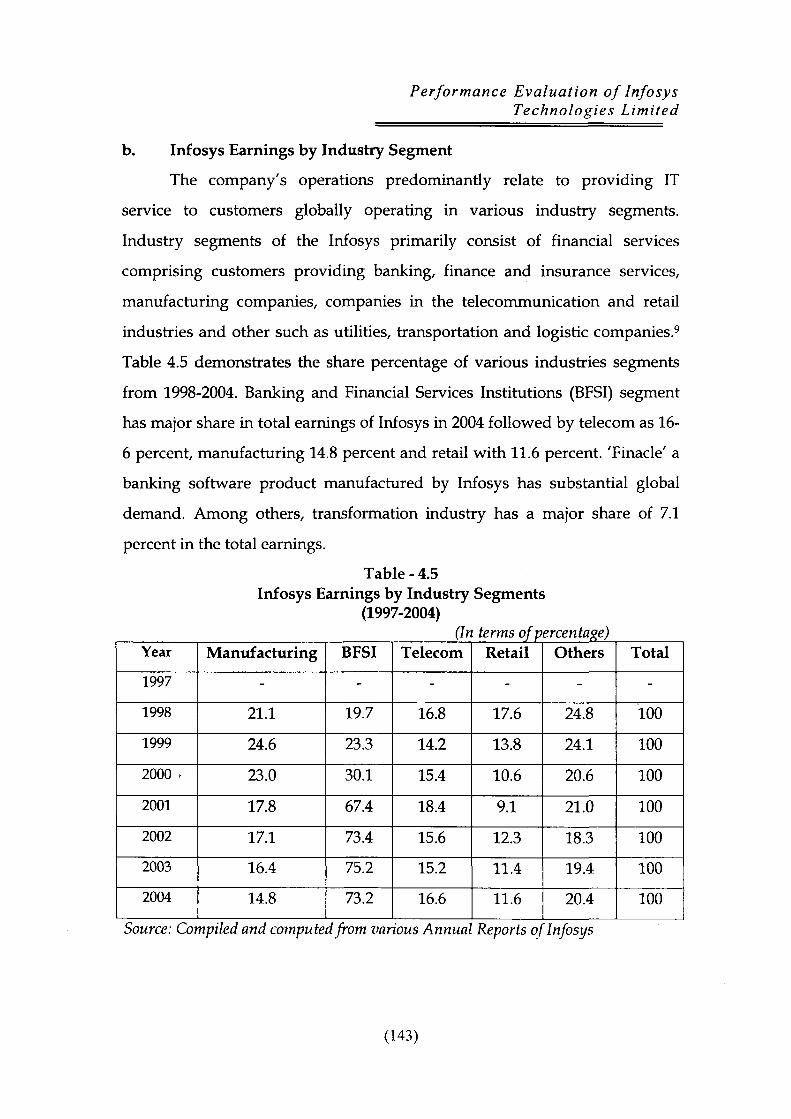
b. Infosys Earnings by Industry Segment
The company's operations predominantly relate to providing IT
service to customers globally operating in various industry segments.
Industry segments of the Infosys primarily consist of financial services
comprising customers providing banking, finance and insurance services,
manufacturing companies, companies in the telecommunication and retail
industries and other such as utilities, transportation and logistic companies.^
Table 4.5 demonstrates the share percentage of various industries segments
from 1998-2004. Banking and Financial Services Institutions (BFSI) segment
has major share in total earrungs of Infosys in 2004 followed by telecom as 16-
6 percent, manufacturing 14.8 percent and retail v^ith 11.6 percent. 'Finacle' a
banking software product manufactured by Infosys has substantial global
demand. Among others, transformation industry has a major share of 7.1
percent in the total earnings.
Table - 4.5 Infosys Earnings by Industry Segments
(1997-2004) (In terms of percentage)
Year
1997
1998
1999
2000 -
2001
2002
2003
2004
Source: Cm
Manufacturing
-
21.1
24.6
23.0
17.8
17.1
16.4
14.8
npiled and compute
BFSI
-
19.7
23.3
30.1
67.4
73.4
75.2
73.2
dfrom var
Telecom
-
16.8
14.2
15.4
18.4
15.6
15.2
16.6
ious Annua,
Retail
-
17.6
13.8
10.6
9.1
12.3
11.4
11.6
Reports of
Others
-
24.8
24.1
20.6
21.0
18.3
19.4
20.4
'Infosys
Total
-
100
100
100
100
100
100
100
(143)

Performance Evaluation of Infosys Technologies Limited
c, Infosys Earnings by Geographical Segments
A high geographical concentration of business leads to volatiUty
because of its economic condition, global trade policies, local laws, political
environment, work culture and ethics. Each market has distinct features
pertaining to growth potential, IT spend, willingness to outsource, cost of
penetration, country risk and price joint, Infosys does not impose any rigid
limits on geographical concentration. North American countries are the major
market where Infosys monitors geographical concentration.^^ Geographical
diversification into Europe and Asia has also been a key focus area. Infosys
has also strengthened its foothold in Australia with the formation of Infosys
Australia. Infosys Shanghai was established to serve the local markets and
meet global delivery requirements. Infosys now holds a premium position in
the Japanese market through its high value and high margin services.^^
It is discernible from Table 4.6 that major chunk of Infosys earnings
come from North America followed by Europe for the reviewed period.
Table - 4.6 Infosys Earnings from Various Destinations
(1996-2004)
Year
1996 1997 1998 1999 2000 2001 2002 2003 2004
North America
71.6 75.8 81.5 81.4 77.4 73.5 71.2 73.0 71.2
Europe
12.9 8.0 8.9 9.3 14.0 18.8 19.5 17.7 19.2
(In term of Percentage) Rest of
the World 1.5 1.6 6.0 6.9 5.7 1.4 2.0 2.1 1.4
India
14.0 14.6 3.6 2.4 2.9 6.3 7.3 7.2 8.2
Total
100 100 100 100 100 100 100 100 100
Note- North American market includes United States, Canada and Mexico, Europe consists East and West Europe, Ireland and United Kingdom. Source: Same as table 5.5
(144)

Performance Evaluation of Infosys Technologies Limited
Indian domestic market is also playing vital role with sizable earnings in the
total earnings of Infosys. North America has registered 71.6 percent share in
1996,which increased to 81.4 percent in 1999, however in 2004 it has declined
to 71.2 percent. Whereas European market has contributed 12.9 percent share
in the total earnings in 1996, which kept on increasing continuously reaching
19.2 percent in 2004.
d. Share Capital And Earnings of Infosys
Table 4.7 renders accounts with regard to company's share capital,
number of shareholders with Earnings Per Share (EPS) and Divided Per Share
(DPS) from 1991-92 to 2003-04. Infosys made an Initial Public Offer (IPO) in
February 1993 and was listed on stock exchange in India in June 1993. This
company converted into public company in the same year increasing its share
capital from Rs. 1.80 crore in 1991-92 to Rs. 3.35 crore in 1993-94 with 6,033
shareholders. The company issued 3,97,978 shares on the exercise of stock
options under employees stock option plans in 1998 and 1999. The
outstanding issued, subscribed and paid up share capital of Infosys increased
from Rs. 33.12 crore during 2002-03 to Rs. 33.32 crore during 2003-04.
In the first year as a public company, Infosys declared dividend of Rs.
1.75 per share, which increased to Rs. 29.50 per share in 2003-04. Infosys paid
interim dividend of Rs. 14.50 per share i.e. 29 percent on par value of Rs. 5 / -
and then directors reconunended a final dividend of Rs. 15 per share i.e. 300
percent on par value of Rs. 5 / - aggregating to Rs. 29.50 per share i.e. 590
percent on par value of Rs. 5 / - for the year 2003-04. The number of shares
holders also increased as public company from 6033 in 1993 to 66,945
shareholders in 2003-04, an increase of almost 92 percent on average.
(145)

Performance Evaluation of Infosys Technologies Limited
Table - 4.7 Share Capital And Earnings of Infosys
(1991-2004)
Year
1991-92
1992-93
1993-94
1994-95
1995-96
1996-97
1997-98
1998-99
1999-00
2000-01
2001-02
2002-03
2003-04
Share Capital
(Rs. Crore) 1.80
-
3.35
7.26
7.26
7.26
16.02
33.07
33.08
33.08
33.09
33.12
33.32
No. Of Shareholders
-
-
6,033
6,526
6909
6414
6622
9527
46,314
89,643
88,650
77,010
66,945
Book Value (Rs.)
-
-
4.34
9.44
12.07
17.06
26.15
86.84
125.97
210.05
314.31
431.84
488.20
EPS* (Rs.)
-
-
1.22
2.01
3.18
5.09
9.13
20.71
43.23
94.23
122.12
144.68
187.38
DPS** (Rs.)
-
-
1.75
2.25
2.50
2.75
3.00
3.75
4.50
10.00
20.00
27.00
29.50
* Basic Earning per share front ordinary business ** Calculated as a per share basis, not adjusted for bonus issues in
previous years. Source: Same as table 5.6
It is evident from table 4.8 that the founders and their families have
only 26.50 per cent voting strength. The table further provides the distribution
of shares by categories of shareholders as on March 31, 2004. The Foreign
Institutional Investors (FIl) have maximum voting strength of 41.82 percent as
2,78,72,439 number of shares are held by them, followed by founders and
their families with 1,76,69,995 shares. There are 66,945 shareholders of the
(146)

Performance Evaluation of Infosys Technologies Limited
company with 6,66,41/056 shares as on March 31, 2004. The Infosys stock is
more readily available to the public as its promoters hold just more than
quarter of 26.50 percent of the company's equity.
Table - 4.8
Distribution of Shares by Categories of Shareholders as on March 31,2004
Category
Individuals Companies/ Trusts
FIIs OCBs and NRls
Founders and their families Mutual Funds, Banks, FIs Equity Shares underlying
American Depository Shares* TOTAL
No. of Shareholders
63,466 2,112 346 787 23
210 1
66,945
Voting Strength (%)
13.95 2.32
41.82 0.70 26.50 6.77 7.94
100.00
No. of Shares hold
92,93,415 15,44,959
2,78,72,439 4,62,048
1,76,69,995 45,07,895 52,90,305
6,66,41,056 * Held by beneficial owners outside India
Source: Compiled from Annual Report of Infosys 2003-04, p. 110
e. Human Resource In Infosys
Employees are vital and key resource of any company. Infosys has
created a favorable work environment that encourages innovation and
meritocracy and enables to attract and retain high caliber employees. The
Infosys has changed the mindset from 'human resource utilization' to
'nurturing and leveraging talent'.^^xhe Infosys believes in investing in people
competencies for the business requirement.
Table 4.9 provides information regarding the number of employees, its
growth and per employee revenue earnings of the company from 1991-92 to
2003-04. The Infosys employed 176 employees in 1991-92 with a per employee
revenue earnings of Rs. 0.05 crore. The employee strength of the company is
growing rapidly over of tinre. These were 573 employees in 1993-94 when the
(147)

Performance Evaluation of Infosys Technologies Limited
company became public limited, the number of employees grew so much so
that it reached in four-digits in 1995-96 with 1172 employees and crossed five-
digits limit in 2001-02. In the year 2003-04, Infosys accounted for 25,634
number of employees with a per employees revenue earnings of Rs. 0.19
crore.
Table-4.9 Employees Strength and Per Employee Revenue Earning
(1991-92 to 2003-04) Year
1991-92
1993-94
1994-95
1995-96
1996-97
1997-98
1998-99
1999-00
2000-01
2001-02
2002-03
2003-04
Source: Technolo
No. of Employees
176
573
903
1172
1705
2605
3766
5389
9831
10738
15876
25634
Compiled am gies Limited
Growth (%)
-
69
37
30
45
53
45
43
82
9
48
61
i computea
Revenue (Rs. Crore)
9.46
30.08
57.70
93.41
143.81
260.37
512.74
921.46
1959.94
2603.59
3622.69
4760.89
from varic
Growth (%)
-
68.55
47.86
38.22
35.04
44.47
49.21
44.35
52.98
24.72
28.13
23.90
ms Annua
Per Employees
Revenue (Rs. Crore)
0.05
0.05
0.06
0.07
0.08
0.10
0.14
0.17
0.02
0.24
0.23
0.19
Reports of
Growth (%)
-
0
16.67
14.28
12.50
20.00
28.57
17.64
-750
91.67
-4.34
-21.05
Infosys
f. Research and Development (R & D)
Since business paradigms and technologies are changing coristantly,
continuous investment in research and development is of paramount
importance. Infosys has taken the approach that its research must be
beneficial to the company either in the short term or medium term. R&D of
(148)
Performance Evaluation of Infosys Technologies Limited
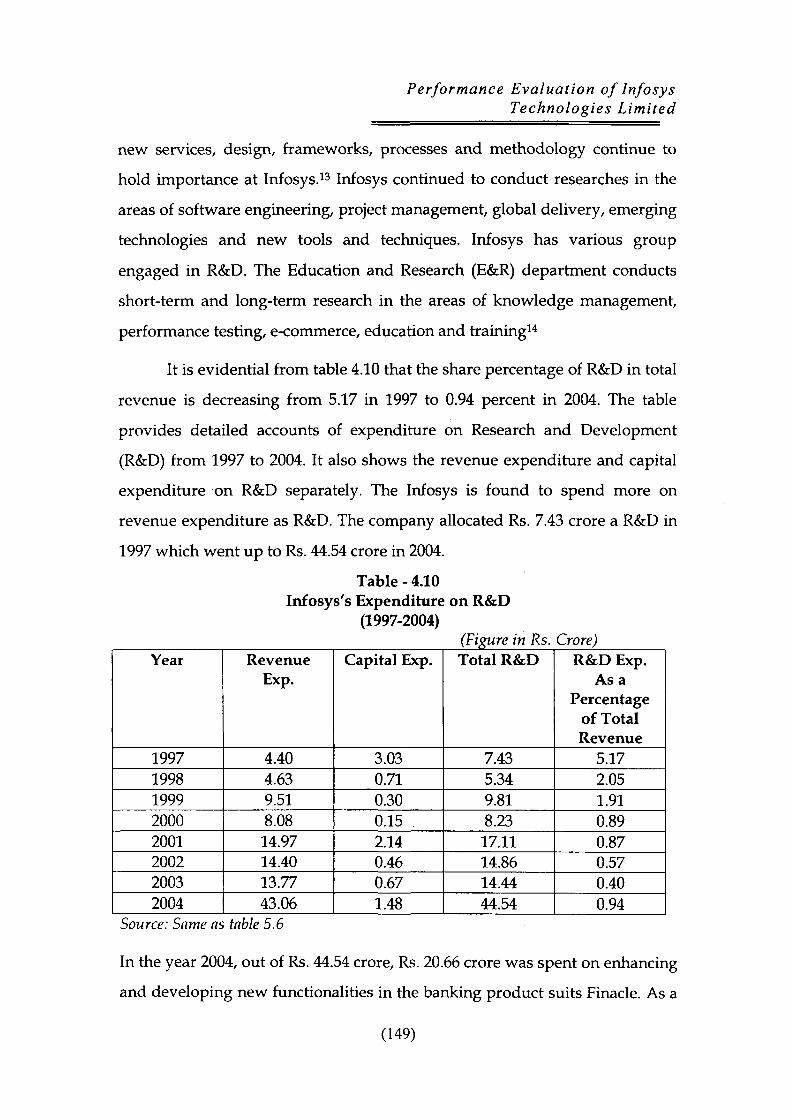
new services, design, frameworks, processes and methodology continue to
hold importance at Infosys.^^ Infosys continued to conduct researches in the
areas of software engineering, project management, global delivery, emerging
technologies and new tools and techniques. Infosys has various group
engaged in R&D. The Education and Research (E&R) department conducts
short-term and long-term research in the areas of knowledge management,
performance testing, e-commerce, education and training^^
It is evidential from table 4.10 that the share percentage of R&D in total
revenue is decreasing from 5.17 in 1997 to 0.94 percent in 2004. The table
provides detailed accounts of expenditure on Research and Development
(R&D) from 1997 to 2004. It also shows the revenue expenditure and capital
expenditure on R&D separately. The Infosys is found to spend more on
revenue expenditure as R&D. The company allocated Rs. 7.43 crore a R&D in
1997 which went up to Rs. 44.54 crore in 2004.
Table-4.10 Infosys's Expenditure on R&D
(1997-2004) (Figure in Rs. Crore)
Year
1997 1998 1999 2000 2001 2002 2003 2004
Revenue Exp.
4.40 4.63 9.51 8.08 14.97 14.40 13.77 43.06
Capital Exp.
3.03 0.71 0.30 0.15 2.14 0.46 0.67 1.48
Total R&D
7.43 5.34 9.81 8.23 17.11 14.86 14.44 44.54
R&D Exp. As a
Percentage of Total Revenue
5.17 2.05 1.91 0.89 0.87 0.57 0.40 0.94
Source: Same as table 5.6
In the year 2004, out of Rs. 44.54 crore, Rs. 20.66 crore was spent on enhancing
and developing new functionalities in the banking product suits Finacle. As a
(149)

Performance Evaluation of Infosys Technologies Limited
result, Finacle is one of the premier banking products in the world with over
94 customers across 27 countries.
g. Foreign Exchange Earnings
Infosys has established a substantial direct marketing network around
the world, including North America, Europe and the Asia Pacific regior\s. The
Infosys has also launched a global initiative to increase the awareness of the
Infosys brand and of its products and services.^^ It has earned the global name
for its services and product and as a result realized a significant portion of its
foreign exchange earnings from exports.
Table 4.11 shows the foreign exchange inflows and outflows by the
Infosys from 1997 to 2004. The company had registered Rs. 57.86 crore in net
foreign exchange in 1997 which has phenomenally swell on to Rs. 2525.02
crore in 2004, an increase of about 533 percent on average.
Table - 4.11 Foreign Exchange Inflows and Outflows in Infosys
(1997-2004) (In terms of Rs. Crore)
Year
1997 1998 1999 2000 2001 2002 2003 2004
Mean S.D. CV.
Inflows
114.03 226.04 477.44 851.72 1728.23 2495.50 3377.87 4532.56 1725.42 1619.92
0.93
Outflows
56.17 98.65 192.56 336.58 851.72 1072.15 1593.85 2007.54 776.15 735.76
0.94
Net Foreign Exchange
57.86 127.39 284.88 515.14 876.51 1423.35 1784.02 2525.02 949.27 887.19
0.93 Source: Same as table 5.6
The inflows in 1997 was Rs.114.03 crore which grew to Rs. 4532.56 in 2004
registering an increase of 484.4 percent on average. The outflow of foreign
(150)
Performance Evaluation of Infosys Technologies Limited
exchange in 1997 was Rs. 56.17 crore increasing to Rs. 2007.54 crore in 2004,
showing an upward trend by 434.3 percent on average. It is noticeable to see
that the growth in foreign exchange inflows is more than that of foreign
exchange outflows during the study period. The average net foreign exchange
is Rs. 949.27 crore with a S.D. of Rs. 887.19crore. The C.V. suggests the
fluctuating trends in net foreign exchange.
h. Strategic Investments
The Infosys has made several strategic investments aggregating to Rs.
153.13 crore in various companies by the end of 2003-04. These investments
are strategic in nature and are aimed at procuring substantial business
benefits to Infosys. Benefits from these investments are primarily in the form
of revenue and net income enhancements, through technology partnership
and access to the latest technological development.^^ Infosys invested an
amount of Rs. 6.85 crore in Asia Net Media Limited towards issue of 300,00
ordinary shares of par value $0.01 each at a issue price $0.05 per ordinary
share. Asia Net intends to leverage under exploited offline brands in media
and entertainment by delivery than through online channels and to establish a
synergetic network of companies in this space.^'' An amount of Rs. 13.40 crore
has been invested in CIDRA Corporation, USA towards issue of 33,333 fully
paid convertible preferred stock. CIDRA is a developer of photonic devices
for high precision wavelength management and control for next generation
optical networks.^^
Infosys invested an amount of Rs. 0.75 crore by holding a 12.5 percent
equity stake In JASDIC Park Company, Japan. JASDIC is an Indo-Japanese
consortium founded by few Japanese companies and three Indian Companies
including Infosys. JASDIC is providing high-quality software services from
India for the Japanese Market. This is a line with Infosys's strategy to
diversify its geographic client base.^^ (table 4.12)
(151)

Performance Evaluation of Infosys Technologies Limited
M-Coininerce Ventures Private Ltd., Singapore has bagged investment
Rs. 2.65 crore by Infosys. This company has been promoted by the Economic
Development Board, Singapore and intends to focus on companies offering
mobile portals, personal inforniation management and messaging bandwidth
optimization and other key enablers of M-Commerce.^o (table 4.12) Infosys
invested an amount of Rs. 8.95 crore in On Mobile Systems Inc., USA towards
the issue of 100,00 comma stock fully paid, at 0.4348,100,00 voting convertible
preferred stake, at $0.4348 and 44,000 non-voting convertible preferred stock
at $0.4348 fully paid. The investment was made in the form of transfer of
Intellectual property rights in Onsan - A web focused wireless enabled
notification product.^i
An amount of Rs. 2.33 crore has been invested in Stratify Inc., USA
towards the issue of 2,76,243 fully paid convertible preferred stock at $1.81
per share. It is a developer of Infrastructure software for ir\formation
networks that enables intelligent content management and efficient enterprise
wide knowledge management.22
Workadia Inc. USA received an investment of Rs. 10.32 crore
purchasing 22,00,00 fully paid convertible preferred stock at $1.00 each.
Workadia provides companies with comprehensive, customizable business
intranets through browser accessed hostel portals and also offers consulting
services to help customers select and deploy their intranet applications,
contents and services.^s Progeon Limited is a majority owned and controlled
subsidiary of Infosys established on April 3, 2002 to provide business process
management services. The total investment by Irifosys is Rs. 24.50 crore.
Progeon seeks to leverage the benefits of service delivery globalization,
process redesign and technology to drive efficiency and cost effectiveness in
customer business processes. Progeon obtained funding of Rs. 49.00 crore
from Citicorp International Finance Corporation, USA.24 On January 2, 2004
(152)

Performance Evaluation of Infosys Technologies Limited
the Infosys acquired 100 percent of equity in Expert Information Services Pvt.
Ltd., Australia. The acquired company has been renamed as Infosys
Technologies (Australia) Pvt. Ltd. This investment would be helpful to
increase the Infosys market share in Australian Market. The Infosys has
invested a sum of Rs. 66.69 crore in this company.^s The Infosys set up a
wholly owned subsidiary in the People's Republic of China named Infosys
Technologies (Shanghai) Company Limited on October 10, 2003. The Infosys
invested Rs. 4.55 crore in the subsidiary. This investment is helpful to tap the
large Chinese domestic market and also to deliver services for markets in Asia
Pacific.26
S.No.
1. 2.
3.
4. 5. 6.
7.
8.
9. 10.
11.
12.
Table - 4.12 Strategic Investment by Company
Yantra Corporation, USA Alpha Thinx Mobile Phone Services AG, Austria Asia Net Media (BVS) Ltd., the British Virgin Island CIDRA Corporation, USA J ASDIC Park Company, Japan M-Commerce Ventures Ptc. Ltd., Singapore On Mobile System Inc. (Formerly Onscan Inc.) USA Stratify Inc. (Formerly Purple Yogi Inc.), USA Workadia Inc. USA Progeon Limited (Subsidiary of Infosys) Infosys Technologies (Australia) Pty. Ltd. Infosys Technologies (Shanghai) Co. Ltd.
Infosys Investment in Rs. Crore
7.06 2.21
6.85
13.30 0.75 2.65
8.95
2.33
10.32 24.50
66.69
4.55
Financial Year
1998-99 2000-01
2000-01
2000-01 2001-02 2000-01
2000-01
2000-01
2001-02 2002-03
2003-04
2003-04
Source: Compiled from Various Annual Reports of Infosys Technologies Limited, Bangalore
(153)
Performance Evaluation of Infosys Technologies Limited
5. Financial Performance Evaluat ion of In fosys
Ratios are the best tools to analyze the financial performance of a
company. It allows inter company and intra company comparison and
analysis. Ratios also provide information pertaining to financial conditions of
the company.27 Ratio analysis in this section is divided into segments, viz. on
P&L analysis, ratios of Balance Sheet analysis, ratios of grow^th trends and
ratios related to shares.
Table 4.13 analyzes the ratio for financial performance of Infosys from
1995-96 to 2003-04. The analysis in the table has covered exports and domestic
ratio with total turnover, depreciation and tax ratio on the basis of total
turnover, operating profit ratio and net profit ratio during the period under
review. Table shows that the share of exports has increased from 86 percent in
1995-96 to 98.61 percent in 2003-04. The high growth in export earrungs of the
company is ascribed to the global competitiveness of the Indian software.
However, domestic turnover has shown a declining trend throughout the
period of study on account of more emphasis on foreign market by the
Infosys. The manpower cost as a percent of total turnover has registered an
increasing trend indicating that the company is spending huge amount on
grooming company's personnel. Increasing cost of labour is also responsible
for the high manpower cost. The table presents statistics with regard to
depreciation, tax on total turnover and tax on total PBT. Depreciation and tax
as a percent of total turnover registered a wavering trend during the period
under review. On an average Infosys paid 13.70 percent of PBT as tax during
the period under reference. Table demonstrates that trend with regard to
operating profit ratio is fluctuating with a 41.12 percent in 1999-2000 to 30.89
percent in 2003-04. Net Profit Ratio also shows that during the year 1995-96,
Infosys earned 22.49 percent net profit over the total turnover. It has
(154)

Performance Evaluation of Infosys Technologies Limited
registered the highest ratio of 31.80 percent during 2000-01. However during
the year 2003-04, Net Profit Ratio (NPR) declined to 26.12 percent.
Table - 4.13 Ratio Analysis for Financial Performance
(1995-96 to 2003-04)
Ratios (%)
Export Turnover/ Total Turn over (%) Domestic Turnover/ Total Turnover (%) Manpower Cost/Total turnover (%)
as 1
in
86.00
1.4.00
36.84
ON
T-t
87.12
12.88
35.90
CO ON
96.38
3.62
36.00
as as
1 00 as as
97.57
2.43
32.39
o o ON a\ r-i
94.38
5.62
36.31
rH O O o o
95.62
4.38
36.62
o 1
T-l o o
98.04
1.96
42.94
en o 1
o o
97.81
2.19
46.30
o 1 tr> o o
98.61
1.39
49.69
Depreciatior^ax Depreciation/ Total turnover (%) Tax/Total turnover (%) Tax/PBT (%)
9.24
4.61
17.02
7.31
3.65
13.48
8.74
2.11
8.35
7.00
4.47
14.72
5.78
4.31
12.19
5.76
3.71
10.45
6.17
5.20
14.36
5.22
5.55
17.34
4.85
4.37
15.44
Profit Operating Profit Ratio (%) Net Profit Ratio
(%)
36.35
22.49
34.81
23.42
34.03
23.18
37.40
25.92
41.1 :i
31.03
41.27
31.80
36.23
31.03
31.99
26.44
30.89
26.12
Source: Compiled and computed by the Research Scholar form various Annual Reports of Infosys Technologies Limited, Bangalore.
Table 4.14 provides ratio analysis from the company's balance sheet
during the period 1995-96 - 2003-04. Debt -Equity Ratio show^s that during the
year 1995-96, Infosys has applied debt to finance their business operations. It
is discernible from the table that the company has not used debt to finance its
operation during the remaining period under reference. It is also indicating
that owners of the company do not wish to dilute their controlling power over
(155)

Performance Evaluation of Infosys Technologies Limited
the affairs of the company. Debtor turnover ratio shows that Infosys is
efficiently managing its credit sales. Current ratio is higher than the normal
accepted current ratio, which shows Infosy's tendency to maintain its short-
tem liquidity. Cash to total assets ratio is also advocating that company is
maintaining a high balance of cash. Table further shows that during the initial
year of the referred period, Infosys has invested substantial arnount in
technologies, which has declined with the passage of time. ROCE and Return
an invested capital presents the higher profitability of the Infosys. Capital
output ratio shows the strong position of the Infosys during 2003-04. Overall
ratios presented in the table depict the healthy financial performance of the
Infosys.
Table - 4.14 Ratio Analysis from Balance Sheet
Ratios
Debt Equity Ratio
Debtor Turnover (days)
Current Ratio Cash/Total Assets (%)
Technologies Investment/ Tota
1 turnover (%) ROCE (%)
Return on Invested capital
(%) Capital output
Ratio
ON 1
in
0.05
46
4.17 35.4
1 9.81
33.1 2
43.0 1
1.22
(1995-9(
•
r-l
0.00
47
4.12 25.5
0 10.5
9
40.1 6
47.2 7
1.46
X) CT\
1 IN a\ OS rH
0.00
57
4.78 29.5
7 10.0
8
46.0 9
57.6 4
1.82
5 to 20(
O N 1
00
a\
0.00
61
6.57 72.5
1 8.55
63.5 1
86.3 0
2.09
33-04)
o o 1
0.00
56
4.69 61.00
5.86
46.27
111.6 8
1.31
o 1 o o o n
0.00
58
3.49 41.57
7.43
62.62
105.6 7
1.71
o 1
T-i O o
0.00
47
3.82 49.3
7 3.93
54.3 7
83.1 0
1.50
CD
o 1
o o
0.00
52
3.87 57.2
8 3.62
46.9 1
79.8 6
3.18
o O o
0.00
48
1.65 85.11
3.23
48.10
137.4 6
5.58
Source: Compiled and Technologies Limited.
computed from various Annual Reports of Infosys
(156)

Performance Evaluation of Infosys Technologies Limited
Table 4.15 furnishes the information regarding growth trends the
Infosys during the period 1995-96 - 2003-04. Table presents an analysis of
export turnover during the study period. Export turnover registered a healthy
but wavering trend. Growth in export turnover is the highest (115.48 percent)
in 2000-01 and the lowest (32.49 percent) during 2003-04. Growth of total
turnover has registered a fluctuating trend during the study period. It has
registered the highest growth of 112.70 percent during 2000-01 on account of
outsourcing boom in the global economy. However growth in total turnover
has declined to 31.42 percent during 2003-04 on account of keen competition.
Operating profit and net profit have also shown encouraging trend
throughout the referred period. However, the growth in net profit appears to
have been declining during 2002-03 - 2003-04.
Table-4.15 Statement Showing Growth Trends
Growth
Export turnover
Total turnover Operatin g Profit
Net Profit
Source: Co
as ID ON
57.6 6 61.8 8 70.9 7 57.6 8
mpiled
IN
a\
55.9 4 53.9 5 47.4 3 60.3 1 and C
(1995-9(
0 0 ON
I N
100.3 0 81.05
77.02
79.22
Zomputec
J to 2003
ON ON
0 0 ON ON rH
99.35
96.93
116.3 9 120.1 9
' from
-04)
o o ON O N ON t - l
73.85
79.71
97.59
115.1 4
various
rH O o o o
115.4 8 112.7 0 113.5 0 117.9 8 Annual
o r-l O O tv|
36.2 0 36.9 9 35.6 6 29.6 2 Revor
o o o
38.8 3 39.1 4 22.5 9 18.5 6
ts of i
o CO o o CS|
32.4 9 31.4 2 24.5 0 29.8 1
^nfosys Technologies Limited
Table 4.16 presents ratio regarding size of share capital from 1995-96 to
2003-04. Table has further covered Earning Per Share (EPS), Dividend Per
Share (DPS) and Book value. The Earning Per Share (EPS) is Rs. 13.12 during
(157)

Performance Evaluation of Infosys Technologies Limited
1995-96, which has increased to Rs. 187.38 during 2003-04. The increasing
trend in Earning Per Share (EPS) clearly shows the high earning capacity of
the company. The Dividend Per Share (DPS) is constantly increasing
throughout the period under study as a consequence book value of the share
has also registered an increasing trend during the referred period. Increase in
the book value of the capital is a result of bullish trend in the capital market.
Table-4.16 Statement Showing The Ratio Analysis Related to Share Earnings
Ratios
EPS* (Rs.) DPS (Rs.) Book Value (Rs.)
ON in ON as rH
13.12
5.00 50
ON O N rH
21.03
5.50 70
(IS
GO ON
O N ON rH
37.69
6.00 108
•95-96 to
ON ON
0 0 ON ON rH
40.19
7.50 174
2003-04
o o ON ON O N rH
43.23
4.50 125.97
rH O o o o
94.23
10.00 210.05
IN O
O o CM
122.12
20 314.31
CO
o Cs| o o CN
144.68
27 431.84
o o o CN|
187.38
29.50 488.20
* From ordinary Activities
Source: Compiled and computed by the Research Scholar from imrious Annual Reports of Infosys
6. Economic Value Added (EVA)
Economic value added measures the profitability of a company after
taking into account the cost of all types of capital including equity. It is the
post tax return on capital employed minus the cost of capital employed.
Companies, which earn higher return than cost of the capital are said to create
value. Those comparues, which earn lower return than cost of capital are
deemed destroyers of shareholders value.^s
(158)

Performance Evaluation of Infosys Technologies Limited
Table 4.17 throws on light Economic Value Added (EVA) by
subtracting tax and cost of capital from operating profit (from ordinary
business) from 1995 to 2004. The table shows the average capital employed
and EVA as a percentage of capital employed during the study. It is
discernible from the table that EVA of Infosys was Rs. 18.78 crore in the year
1995 which crossed three digits to touch Rs. 129.06 crore in 2000, and them to
scale another significant milestone by reach up to Rs. 689.63 crore in 2004
registering a whopping 9.70 percent growth rate on average. The table also
indicates the average of ten years of EVA, which was recorded to tune of Rs.
229.06 crore. Infosys has registered higher return on cost of capital during the
reviewed period. Table further analyze that the average EVA is Rs. 228.73 crore
for the referred period. The C.V. is 1.12 suggesting the variability of the EVA of
Infosys.
Table - 4.17 Econoinic Value Added (EVA) Analysis
(1995-2004)
Year
1995 1996 1997 1998 1999 2000 2001 2002 2003 2004 Mean S.D. C.V.
Operating Profit
(A)
15.26 25.32 38.93 65.86
155.86 325.65 696.03 943.39 1079.28 1357.46 470.30 506.31
1.07
Tax (B)
1.94 4.31 5.54 5.50
22.94 39.70 72.71
135.43 201.00 227.54 71.66 86.04 1.20
Cost of Capital
(C)
13.14 20.92 27.54 38.51 62.14 156.89 243.30 297.9Q 423.63 440.29 171.42 168.41 0.97
EVA D=A-B-C
18.78 0.94 5.85 21.85 70.78
129.06 386.02 510.06 454.65 689.63 228.73 256.21
1.12
Capital Employed
48.01 76.45 98.47
142.90 245.42 703.87
1111.47 1734.97 2493.40 3124.82 977.97 1118.35
1.14
(Figure in Rs EVA as a
Percentage of capital Employed
0.27 0.11 5.18 12.63 28.84 18.34 35.00 29.40 18.23 22.07 16.70 12.04 0.72
. Crore) Cost of Equity
(%)
28.80 28.80 28.40 26.95 25.32 22.29 21.08 17.10 16.99 14.09 22.98 5.49 0.23
* PBT excluding extra ordinary income
Source: Compiled and computed from Various Annual Reports of Infosys under EVA statement.
(159)

Performance Evaluation of Infosys Technologies Limited
7. Social Performance Evaluation of Irtfosys
A strong sense of social responsibility is foremost among the core
values of Infosys. This translates into a commitment to help people and
communities to enhance living conditions and to improve education. In 1996,
it established the Infosys Foundation as a not for profit trust but to support
initiatives that benefit the society at large. The foundation supports
programmes and orgaruzations devoted to the cause of the destitute, rural
poor, mentally challenged belonging to the economically backward sections
of the society. It also helps preserve certain arts and cultural activities of
India, which are under the threat of dying out. Infosys Foundation is
recognized under Section 80-G of the Income Tax Act 1961.29 Infosys built
super specially hospital at Pune, donated eye operating equipment to the
Chennai Ram Krishna Mission and built additional ward at the Swami
Sivananda Memorial Hospital, Pattamadai.^° Infosys constructed orphanages
in Rampur, Midnapur and Kalahandi in Orissa, Hostel for visually impaired
tribal girls in Banapur, Behrampur District of Orissa. Doneted to the
Department of Sainik Welfare and Resettlement towards education of
children of diseases Sainiks, established counseling centers for the
rehabilitation of devadasi women in North Karnataka and built cyclone, flood
relief shelters in different district of Orissa.^^ Infosys renovated Gandhinagar
and Kapikad Zila Panchyat Schools in Manglore, partially sponsored the air
force to US for talented students from the Ramana Maharishi Academy Blind
School, Banglore, donated study material to 20 schools in rural Karnataka and
sponsored 'Wig Kid Pavilion' in which more than 500 students and young
scientist participated at a science exhibition organized by National Science
Congress.32 Established a cash award corpus fund for each year's medal
(160)

Performance Evaluation of Infosys Technologies Limited
winner in Physics, Chenxistry, Biology, Astronomy, Information Science and
Mathematics Olympiads at the Tata Institute of Fundamental Research (TIFR).
The Infosys also donated towards installing traffic signals at Barmerghatta
Circle, Bangalore and distributed personnel computers to National Law
School of India University.33
Table 4.18 shows the allocation of grants to Infosys Foundation by the
company since its inception. In the very first year of establishment, company
allocated Rs. 27 lakhs for various social causes. And it continued increase up
to Rs. 12 crore in the year 2004 for the cause of health care, education Arts and
culture and other social benefits.^^
Table - 4.18 Statement of Grants Contributed to Infosys Foundation
(1996-2004) Year 1996 1997
1998
1999 2000 2001 2002
2003 2004
Grants (Rs. Crores) 0.27
0.30 0.40
1.36 2.80 5.26
3.75 5.53
12.00
Source: Compiled from Annual Report of 2001-02 and 2003-04 of Infosys
8. Corporate Governance And Infosys
Corporate Governance is a commitment to values and ethical business
conduct. It is about how an organization is managed. This includes its
corporate and other structure, its culture, policies and the manner in which it
deals with various stakeholders. Timely and accurate disclosure of
informatioris regarding the financial situation, performance, ownership and
(161)

Performance Evaluation of Infosys Technologies Limited
governance of the company is an important part of corporate governance.
This improves pubHc under standing of the structure, activities and policies of
the organisation.35
The concept of corporate governance emerged in the late 1980's w^hen
several companies collapsed in UK because inadequate of operating control.
This led to the setting up of Cadbury Committee on Corporate Governance in
1991 by the London Stock Exchange under the Chairmanship of Andrian
Cadbury, the report was submitted in 1992. The Cadbury Committee w as
succeeded by Greenbury Committee in 1995 and the Han\pel Report in 1998
both in UK36
The developments that have been taken place in UK have been
reflected on the corporate w^orld in India. The Confederation of Indian
Industries (CII) in 1998 was the first to evolve a desirable code of corporate
governmient in India. Thereafter, Security Exchange Board of India (SEBI) set
up a committee on 7* May 1998 under the Chairmanship of Mr. Kumar
Mangalam Birla to report on Corporate Governance and submitted report in
1999. The committee made twenty-five recommendations, nineteen of them
'Mandatory' in the sense that these are eriforceable.^^ Kumar Mangalam Birla
Committee on Corporate Governance has made 17 specific recommendations.
Infosys Complies with all recommendation except for the following:^^
1. Committee has recommended that in such companies the Chairman is also the Managing Director, at least non-executive directors should represent 50 percent of the Board. Ten Executive Directors constitute 40 percent of the board strength at present.
2. Committee has recommended that no single person should hold directorship in more than 10 companies. Two non-executive directors hold directorship more than 10 companies.
3. Committee has recommended that non-executive directors be entitled to stock options, so as to enable them to bring in long-term value to the shareholders.
(162)

Performance Evaluation of Infosys Technologies Limited
Infosys fully complies with all these recommendations on corporate
governance. SEBI also instituted a committee under the Chairmanship of Mr.
N. R. Narayan Murthy, which recommended enhancement in corporate
governance. The committee report is yet to be accepted by SEBI.39
In addition, the Department of company Affairs, Government of India
constituted a nine-members committee under the stewardship of Mr. Naresh
Chandra to examine various corporate governance issues and all
recommendations are now mandatory . o
Infosys believes that sound corporate governance is critical to enhance
and retain investors trust. Infosys always seeks to attain its performance rules
with integrity. Infosys disclosure always seeks to attain the best practices in
International Corporate Governance. The company also endeavors to enhance
long term shareholders value and respect minority rights in all business
decisions.
The Infosys corporate governance philosophy is based on the following
principles.4^
1. Satisfy the spirit of the law and not just the letter of the law. Corporate governance standards should go beyond the law.
2. Be transparent and maintain high degree of disclosure levels.
3. Make a clear distinction between personal convenience and corporate resources.
4. Communication externally in a truthful manner about how the company is run internally.
5. Comply with the laws in all the countries in which it operates.
6. Have a simple and transparent corporate structure driven solely by the business needs.
7. Management is the trustee of the shareholders capital and not the owner.
(163)

Performance Evaluation of Infosys Technologies Limited
At the core of its corporate governance practice is the Board, which
overseas how the mariagement serves and protects the long-term interests of
all the stakeholders of the company. Infosys have an active, well-informed
and independent board to ensure the highest standards of corporate
governance. Majority of the board, 8 out of 15, are independent members. The
Infosys has compensation, nomination and audit committees, which are fully
comprised of independent directors.^^
Infosys also adheres to the UN Global Compact Programme. Further, a
note on Infosys's Compliance with the corporate governance guidelines of six
countries in their national languages of Australia, Canada, France, Germany,
Japan and UK.43
9. United Nations Global Compact Programme And Infosys
Commitments^^
Announced by the United Nations Secretary General Mr. Kofi Annan
at World Economic Forum in Devos, Switzerland in January 1999 and
formally launched at the UN Headquarters in July 2000, the global compact
calls on companies do embrace nine principles in the areas of human rights,
labour standards and environment. The global compact is a value-based
platform designed to promote institutional learning. The nine principles are
drawn from the Universal Deceleration of Human Rights, the International
Labour Organization's fundamental principles rights at work and the Rio
Principles on Enviror\ment and Development. According to these principles,
business should-
1. Support and respect the protection of internationally proclaimed human rights.
2. Ensure that they are not complicit in human right abuses.
3. Uphold the freedom of association and the effective recognition of the right to collective bargaining.
(164)

Performance Evaluation of Infosys Technologies Limited
4. Support the elimination of all forms of forced and compulsory labor.
5. Support the effective abolition of child labour.
6. Eliminate discrimination in respect of employment and occupation.
7. Support a precautionary approach to environmental challenges.
8. Undertake initiatives to promote greater environmental responsibility.
9. Encourage the development and diffusion of environmentally friendly technologies.
On August 27, 2001, Infosys adopted the UN Global Compact
Programme and became a partner with the UN in this initiative.
10. Conclusion
Infosys Technologies Limited is one of the leading software companies
engaged in effective business of IT services in Internet technology product
development, engineering product design and data management. It was
incorporated in 1981 as a private company and later became a public
company in 1993. In the financial year 2003-04, it earned total revenue of Rs.
4760.89 crore and the Profit After Tax (PAT) to the tune of Rs. 1243.47 crore.
The Infosys is rated at level 5 of the capability Maturity Model (CMM), which
is the world-class benchmark in software process management.
Infosys has captured global i larket by providing its quality IT services
and increased their demand. Share of export market of total earnings of
Infosys accounted for 74.43 percent and foreign exchange inflows amounted
to Rs. 4532.56 crore in 2003-04. It is encouraging to note that Infosys is making
steady progress in its journey of Research and Development (R&D) spending
around 0.94 percent oi its revenue on R&D during 2003-04 as against 0.40
percent in 2002-03. North America is continuing to be a favorite destination of
its products followed by Europe. 71.2 percent of its total exports revenue
comes form North America, followed by European Market with 19.2 percent
during 2003-04. The company has also registered Rs. 689.63 crore as its
(165)

Performance Evaluation of Infosys Technologies Limited
Economic Value Added (EVA) in 2003-04. Ratio analysis of the Infosys
provides information regarding the financial performance of the company.
Most of the ratios are higher than the normally accepted norms in the IT
industry. Current ratio and profitability ratio, export growth, debtor turnover
ratio and other relevant ratios indicate a healthy financial position of the
company. The Infosys has complied with all the recommendations except
three of the Kumar Mangalam Birla Committee on Corporate Governance
Constituted by SEBI. Information Technology in India is a flavor of
globalization and Infosys is one of the cynosures of IT Industry in India.
11. References
1. Indian Business Year Book (2005), Vikas Publishing House Private Limited, New Delhi, p. III. 68
2. Ibid.
3. v^rww.indiainfoline.com (2004)
4. Ibid.
5. Indian Business Year Book (2005), op.cit.
6. www.infy.com
7. Ibid.
8. Azad, Imran (2002) "Pattern of FDI Since Economic Liberalization With Special Reference to IT", unpublished Ph.D. Thesis, Department of Commerce, A.M.U., Aligarh, p. 179
9. Annual Report of Infosys Technologies Limited 2003-04
10. Annual Report of Infosys 2001-02
11. Infosys 2003-04, op.cit
12. Trivedi, Bhairav (1999), "A Case Study of Infosys's Momentum of Growth", The Wharton School, University of Pennsylvania,
13. Annual Report of Infosys 1999-2000
14. Datta, Nandita (2004),"Infosys or Wipro", Outlook Money, May 15, pp. 38-40
15. Annual Report of Infosys 2003-04
16. Annual Report of Infosys 2002-03
17. Annual Report of Infosys 2001-02
(166)

Performance Evaluation of Infosys Technologies Limited
18. Ibid, p.l23
19. Ibid, p.l23
20. Ibid, p.l23
21. Ibid, p.l24
22. Ibid, p.l24
23. Ibid, p.l24
24. Annual Report of Infosys 2003-04
25. Ibid.
26. Ibid.
27. Sur, Debasish (2004), "Application of Selected Financial and Social Measures in Performance Evaluation", Management Insight, Cuttack, Vol. 4. No. 1, Jan-April, p. 54
28. Khan, Dr. A.Q. (2003), "TNCs And Ms & As for Growth And Globalization of Indian Economy", Department of Commerce, A.M.U., Aligarh, p. 59
29. Annual Report of Infosys 1997-98
30. Annual Report of Infosys 2000-01
31. Annual Report of Infosys 2001-02
32. Annual Report of Infosys 2002-03
33. Ibid.
34. Annual Report of Infosys 2003-04
35. Sumanjeet (2005), "Corporate Governance in Indian Perspective", Indian Journal of Applied Economics, University of Lucknow, Vo\. 2, No. 1, Jan., p. 103
36. Ibid.
37. Ibid.
38. Annual Report of Infosys 2001-02
39. Annual Report of Infosys 2002-03
40. Sumanjeet, "Corporate Governance in Indian Perspective", op.cit.
41. Annual Report of Infosys 2003-04
42. Annual Report of Infosys 2002-03
43. Annual Report of Infosys 2003-04
44. Ibid.
(167)