performance counters to rescue: a machine learning · pdf filelearning based safeguard against...
TRANSCRIPT

Performance Counters to Rescue: A MachineLearning based safeguard against
Micro-architectural Side-Channel-Attacks
Manaar Alam, Sarani Bhattacharya, Debdeep Mukhopadhyay, and SourangshuBhattacharya
Indian Institute of Technology, Kharagpur, India,[email protected], {sarani.bhattacharya, debdeep,
sourangshu}@cse.iitkgp.ernet.in
Abstract. Micro-architectural side-channel-attacks are presently daunt-ing threats to most mathematically elegant encryption algorithms. Eventhough there exist various defense mechanisms, most of them come withthe extra overhead of implementation. Recent studies have preventedsome particular categories of these attacks but fail to address the de-tection of other classes. This paper presents a generic machine learningbased multi-layer detection approach targeting these micro-architecturalside-channel-attacks, without concentrating on a single category. Theproposed approach work by profiling low-level hardware events usingLinux perf event API and then by analyzing these data with some appro-priate machine learning techniques. This paper also presents a novel ap-proach, using time-series data, to correlate the execution trace of the ad-versary with the secret key of encryption for dealing with false-positivesand unknown attacks. The experimental results and performance of theproposed approach suggest its superiority with high detection accuracyand low performance overhead.
Keywords: Micro-Architectural Side-Channel-Attack, Hardware Per-formance Counters, Machine Learning, Anomaly Detection, Classifica-tion, Time-Series
1 Introduction
Computer hardware is increasingly getting shared between multiple, potentiallyuntrusted programs, ranging from cloud services, where the workloads of multi-ple clients may be shared on a single computer, to mobile phones, where appsauthored by different developers run on a single hardware, to web browsers dis-playing pages from various sites. However, for most of these applications securityis imperative. But in spite of developments of strong cryptographic algorithms,confidentiality or integrity of information is threatened on these platforms dueto the presence of covert information leakage channels, which are exploited inseveral attacks. These attacks target the micro-architecture of the platforms andcan collapse the strongest of crypto-algorithms, like the Advanced Encryption

Standard (AES) or the mathematically elegant RSA or Elliptic Curve Cryptosys-tems. Popular examples of these attacks are those which target the events likecache accesses [1], branch instructions [2], etc. Modern microprocessors containa set of special purpose registers to measure hardware related activities knownas hardware performance counters, which leak valuable information regardingthe encryption algorithm [3]. Some attacks [4] analyze these performance coun-ters for compromising the security of the system. It is now well-established thatmodern computers will exhibit information leakages and we have to develop oursecurity defenses amidst the presence of these leakage avenues [5].
There are many state-of-the-art countermeasures to prevent these types ofbreach of security, but with the cost of a severe extra overhead which can blow upthe code size and cut down the performance and increase the energy consumptionof the device manifold. Some past works to defeat side-channel-attacks work bysignificantly changing the hardware [6, 7] or by obscuring timing information ofa program’s execution [8]. Implementations of these counter-measures are notfeasible in resource-constrained environments like IoT devices, Smart phones,etc. Even for standard commercial platforms, the protection costs may hinderthem as unusable.
In recent times, researchers are working to detect and prevent the side-channel-attacks without modifying the hardware of the system rather by im-plementing a user-level process which monitors the execution of all other pro-cesses [9, 10] in the system or by implementing lightweight patch [11] in theoperating system. These works concentrated on traditional non-trivial detectiontechniques like signature-based detection and anomaly-based detection. In theformer technique pattern recognition is used to detect known attack methods,and in the latter method, known and unknown attacks are detected by observingsignificant deviations from the normal behaviors. The former method is low infalse negatives but also have the risk of missing unknown adversaries, whereas,the latter method can successfully detect unknown attacks with the known onesbut can incur significant false positives, as sudden changes produced by benignprograms can be wrongly classified and raise triggers in the system.
M. Chiappetta et al. [9] experimented with both the approaches with threedifferent methods but have not addressed the difficulties caused by false nega-tives. On the other hand, T. Zhang et al. [11] used a multi-layer approach todeal with false positives and false negatives in a Cloud Environment, but thediscrimination between a side-channel-attack and a memory intensive programis difficult to obtain with high confidence with their approach. Moreover, most ofthese recent works address the detection of cache-based side-channel-attacks andnot considering the other forms of micro-architectural side-channel-attacks likebranch mis-prediction attacks or software driven fault attack such as Rowham-mer attacks, etc. Also, these works did not adequately address the detection ofan ‘intelligent’ potentially evasive attack process which changes its behavior byreducing the cache probing speed or by introducing some random cache accessesin the code thereby confusing the detection mechanism.

In this paper, we investigate an idea of three-step real-time detection mecha-nism to deal with these difficulties and for mitigation of the mentioned securitythreats. First, our approach is to generate significant volumes of low-level data byprofiling the hardware performance counters. The Linux perf utility allows for agranular profiling of chosen hardware events at a selected frequency, albeit withsome lower margin. The first step is to process this data through elaborate dataanalysis and machine learning methods to raise alarms in the system. In the nextstep, we determine the cause of abnormality for the warned process and identifythe possible attack-category the anomaly belongs to, by a pre-learned classifierwhich is learned with the behaviors of some state-of-the-art side-channel-attacks.Finally, we correlate the hardware performance counter values (determined basedon the classification result) of the execution of the potential attack process withthe secret key (which is known beforehand) of the encryption algorithm usinga time-series based approach. A large correlation value with the secret key sig-nifies true positive. We then with high confidence say that the warned processis an actual side-channel-attack and can take appropriate measure against theprocess.
Main idea and motivation
Most of the micro-architectural side-channel-attacks primarily work by analyz-ing the behavior of the CPU-cache, branch-predictor hardware for the secretcomputation. Abnormalities in the number of micro-architectural events in thenormal environment can be observed in the presence of side-channel-attacks.The first phase of our approach detects the presence of these abnormalities ina system and raises a warning of a possible side-channel-attack. Not only themalicious processes, but there can be some other benign processes also whichmay create these abnormalities to the micro-architectures. To deal with thesetypes of processes an anomaly detection module is used with a suitable thresholdsuch that the abnormalities exceeding threshold can be termed as a potentialside-channel-attack.
In the second phase, we analyze the cause of abnormality for the processesand categorize them using a pre-trained classifier (trained with the behavior ofsome state-of-the-art side-channel-attacks). The result of this phase would helpus to understand the type of the possible attack process (i.e., a cache basedattack or branch prediction based attack, and so on).
The classification phase can be confused with the presence of some false pos-itive processes with the approximately same behavior as that of the maliciousprocesses trained in the classifier. To remove these false positives from the de-tection mechanism we use the third phase of our detection where we correlatethe execution of the program with the secret key which is already known to theroot user. If the execution correlates with the key, then the warned process is atrue positive and can be removed from the system. This third module could alsobe used for removing the false negatives (i.e., the unknown ‘intelligent’ attacks,which can modify its behavior to evade the detection mechanism), as to be asuccessful attack its execution needs to correlate with the secret key.

Most of the micro-architectural side-channel-attacks work by continuouslymonitoring a particular event (such as cache misses, branch misses, etc.) of theexecution traces of the encryption algorithm. This abbreviates to the fact that,if we know the execution trace of the attacker exploited event for the encryptionalgorithm (say T1), this trace will be contained in the execution trace of the suc-cessful attack code (say T2) in addition to some noise because of the attackersown execution. To find the correlation, in this case, is nothing but the problemof temporal sequence alignment. This was the primary motivation behind us-ing time-series analysis for correlating the hardware performance counter valueswith the secret encryption key. We discuss this approach in more details in thesubsequent sections.
The correlation of performance counter values with the secret key can alsohelp us to handle some corner cases. For example, in a multi-user system if anyuser (say user1) is using the encryption algorithm with his own secret key andthe side-channel-attack on the other hand is trying to compromise the secret keyof another user (say user2), most of the recent detection algorithms will catego-rize it as a case of side-channel-attack which really is not the case in terms of theuser1. Our detection algorithm can successfully show that the execution tracesof the side-channel-attack does not correlate with the key of the user1, which isanalyzed in the results and discussion section.
The outcome of the third module can help us to re-train the classifier for im-proving its classification accuracy and also to accommodate new types of attacksin the classifier. As training a classifier is an expensive operation, this step cancause a significant performance overhead in a real-time implementation. Thistrade-off between accuracy and performance overhead can become a new re-search direction in future.
Our Contribution
The main contributions of our work are -
– A generalized detection mechanism. We tried to deal with maximum possi-ble types micro-architectural side-channel-attacks including cache-based at-tacks, branch-prediction-based attacks, etc.
– Detection of an attack by correlating its execution trace with the secretencryption key. We proposed a novel approach which could be useful toremove false positives in the system and also be used to detect ‘intelligent’unknown attacks.
The organization of rest of the paper is as follows: In Section 2, we present a briefbut required background of different side-channel-attacks, hardware performancecounters, data preprocessing techniques, classification task and time-series data.In Section 3, we discuss our detection methodology in details. In Section 4, weanalyze the performance and evaluation of our proposed approach. Section 5 andSection 6 discuss the conclusion of our work and possible future research in thisdomain.

2 Preliminaries
In this section, we discuss the necessary information for better understanding ofworking of different micro-architectural side-channel-attacks and also the pro-posed detection mechanism for their efficient detection.
2.1 Side Channel Attacks
Side-Channel-Attack is an attack which works by the information gained fromthe physical implementation of a cryptosystem. These attacks can collapse anycryptosystem despite having any theoretical weaknesses. One of the special typesof these attacks is micro-architectural side-channel-attack, in which attacker tryto exploit different hardware events during the execution of the encryption algo-rithm (like, cache-miss, branch-miss, etc.) to compromise its secret encryptionkey. In this section, we brief the working of some of these well-known attacks.
Cache based Attacks In a cache-based side-channel-attack, the attacker triesto gain sensitive information from the victim by exploiting shared CPU-cache.This confidential information includes cryptographic operations, which are leakedas an attacker observable cache usage pattern. The adversary uses several tech-niques to manipulate content in this shared cache and tries to gain knowledgeabout the cache access pattern of the victim and make an inference about thesensitive operations that are responsible for this pattern.
There are different types of cache-based attacks, cache timing based, cacheaccess based and cache trace based attacks. All of these attacks fundamentallyrely on the variation of the timing of the cache hit and misses. The accesspattern of the data being secret dependent these difference in timing tends toleak a significant amount of information.
In this paper, we have first considered the classical cache timing attack onAES by Bernstein [12] and alternatively on the Cache-timing attack on Clefia [13]to understand the behavior of cache timing based attacks. Cache trace basedattacks rely on the same property of the non-uniformity in the access pattern ofcache in a much special setting of spy and the victim process.
Without loss of generality, we consider that if our detection methodology candetect cache timing attack, it can do so for all genre of timing attacks.
Branch Prediction based Attacks In branch prediction based attack, theadversary exploits the common branch predictor implemented in all modernCPUs. The extra clock cycle due to the branch mis-prediction leaks valuableinformation to the attacker.
For Public key cryptographic systems, the control flow of the execution issecret key dependent. The most popular asymmetric key algorithms such asRSA and ECC have the key-dependent conditional statements executions fortheir underlying exponentiation and multiplication primitives. Since the control-flow of these algorithms vary depending on the key, the branch mis-prediction

counts bear a dependence to the underlying secret. This relationship has beenexploited by the attackers to leak the secret of mathematically secure ciphers.
In our paper, we show that we can successfully identify these attacks fromthe benign processes.
DRAM based Attacks Rowhammer is a term coined for disturbances ob-served in recent DRAM devices where repeated row activation causes the DRAMcells to electrically interact among themselves [14–17]. Repeated access to rowsin the DRAM results in bit flips [15] in its adjacent rows due to continuouscharging and discharging of the neighboring cells in the rows. This induces anew genre of software induced fault attacks in the DRAM, and the effect is dis-astrous in some cases. One specific requirement to induce rowhammer fault is tomake persistent accesses to the DRAM, either by causing regular cache missesusing clflush or by using huge page mapping support. Thus to induce rowham-mer faults, the attacker has to make accesses to the DRAM repeatedly, and thisphenomenon intuitively results in higher number of cache misses. This event ofhigh cache misses are used in our detection system.
In this paper, we thus also consider the software driven fault attack into ourconsideration for our following analysis.
2.2 Hardware Performance Counters
Hardware Performance Counters (HPCs) are a set of special purpose registers,which are present in most of the modern microprocessor’s Performance Mon-itoring Unit (PMU). These registers can be programmed to store the numberof occurrences of different types of hardware and software events related to theexecution of a program, such as cache misses, retired instructions, retired branchinstructions, and so on. HPCs were primarily designed to debug the performanceof complex software systems, but currently, they are widely used for collecting therun-time behavioral information of software execution. HPCs work along withthe event selectors, which specify the hardware events to be monitored and adigital logic which increments a counter based on the occurrence of the specifiedhardware events. These performance counters can be accessed very fast withoutaffecting or slowing down any software execution. Moreover, to get access tothese registers no source code modification is required. Hardware Performancecounters has been used in many recent literatures [18–21] for dynamic profilingof a system.
The most useful mode of operation of PMUs is the interrupt-based mode. Thecentral working principle behind this mode of operation is, a system interruptis generated when a specified event occurs more than or equal to a predefinedthreshold value or a preset amount of time has elapsed. This mode of operationmakes both event-based and time-based sampling possible.
High-level libraries like PAPI [22], OProfile [23] provide interfaces to HPCs.Linux perf [24] among them is a widely used new implementation of performancecounters support for all Linux 2.6+ based systems, which we can access from

user-space. This tool is capable of providing per-process, per-CPU, and system-wide statistical profile. We used this tool for our experimentation purpose. Perftool is based on Linux perf event open() system call, which can be used to profilesystem in very low granularity.
Almost every popular operating systems have HPC-based profilers, thoughthe type and number of hardware events may vary across different InstructionSet Architectures (ISA) [25]. Most of the modern processors may offer thousandsof hardware and software events to monitor, however, only a selected few of themcan be monitored in parallel due to the limitation in the number of built-in HPCregisters. Intel 64 and IA-32 architectures [25] provide facilities for monitoringperformance via a Performance Monitoring Unit (PMU). There are more than100 performance events which can be monitored to measure the performance of aprogram. Since we target micro-architectural attack in our study, we consideredthe hardware events which are more likely to be affected by these attacks.
Micro-architectural attacks like branch prediction based attack work in sucha way that we can observe its influence in hardware events such as BranchInstruction Retired and Branch Misses Retired. The cache-based attacks willaffect the hardware events such as LLC References, and LLC Misses more thanthe other events. Some other attacks may influence some other hardware countersalso.
Case Study: I In the form of a case study, we try to emphasize on the factthat the detection of different side-channel-attacks depends on the selection ofappropriate hardware events. In our experimentation system, we were able tomonitor eight events in parallel, which we discuss in brief -
1. Branch Instruction Retired : This event counts the number of branch in-structions at retirement.
2. Branch Misses Retired : This event counts the number of mis-predictedbranch instructions at retirement.
3. Last Level Cache References : This event counts the number of requestsoriginating from the core that references a cache line in the last level cache.
4. Last Level Cache Misses : This event counts the number of cache miss con-ditions for references to the last level cache.
5. Instruction Retired : This event counts the total number of instructions atretirement.
6. UnHalted Core Cycles : This event counts the number of core clock cycleswhen the clock signal on a particular core is running.
7. UnHalted Reference Cycles : This event counts the number of reference clockcycles at a fixed frequency while the clock signal on the core is running.
8. Bus Cycles : This event counts the number of bus cycles required with thesystem clock signal on the core running.
We collected a system-wide profile for different state-of-the-art branch-predictionattacks and cache-based attacks to form a dataset of benign and malicious be-havior on the system. After preprocessing the dataset, which we will discuss
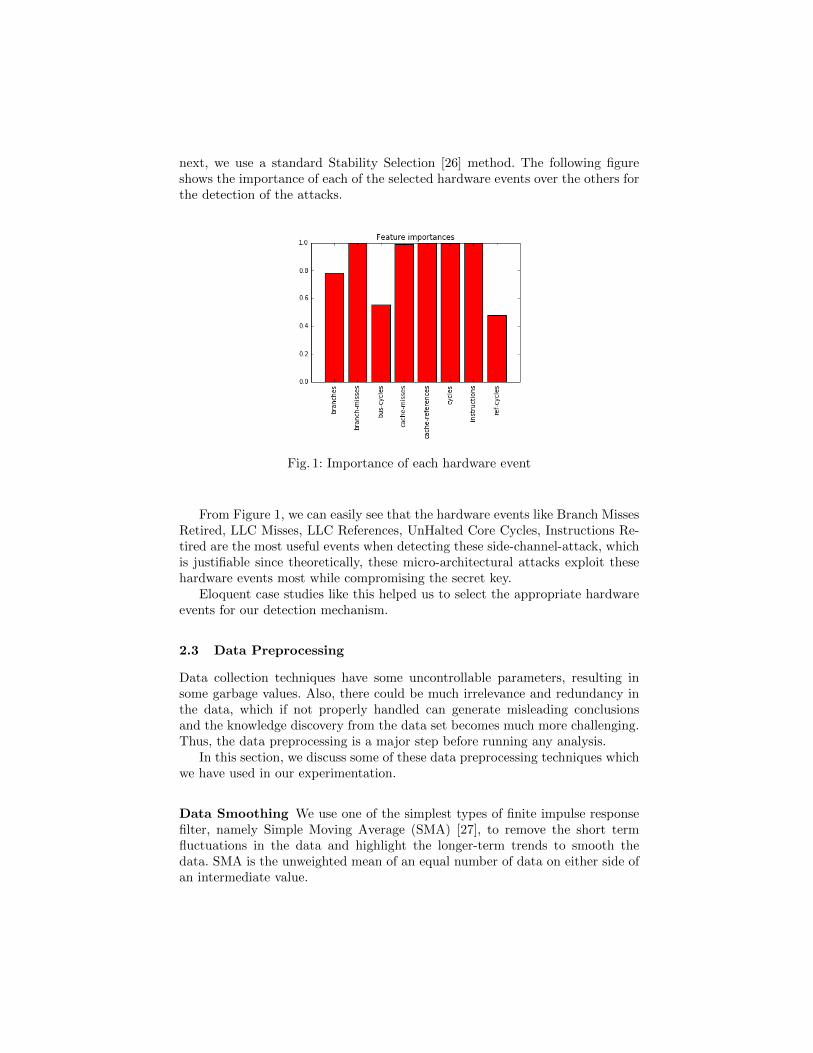
next, we use a standard Stability Selection [26] method. The following figureshows the importance of each of the selected hardware events over the others forthe detection of the attacks.
Fig. 1: Importance of each hardware event
From Figure 1, we can easily see that the hardware events like Branch MissesRetired, LLC Misses, LLC References, UnHalted Core Cycles, Instructions Re-tired are the most useful events when detecting these side-channel-attack, whichis justifiable since theoretically, these micro-architectural attacks exploit thesehardware events most while compromising the secret key.
Eloquent case studies like this helped us to select the appropriate hardwareevents for our detection mechanism.
2.3 Data Preprocessing
Data collection techniques have some uncontrollable parameters, resulting insome garbage values. Also, there could be much irrelevance and redundancy inthe data, which if not properly handled can generate misleading conclusionsand the knowledge discovery from the data set becomes much more challenging.Thus, the data preprocessing is a major step before running any analysis.
In this section, we discuss some of these data preprocessing techniques whichwe have used in our experimentation.
Data Smoothing We use one of the simplest types of finite impulse responsefilter, namely Simple Moving Average (SMA) [27], to remove the short termfluctuations in the data and highlight the longer-term trends to smooth thedata. SMA is the unweighted mean of an equal number of data on either side ofan intermediate value.

(a) Raw values in sampling-mode (b) Sampling mode values after smoothing
Fig. 2: Data Smoothing
Figure 2 explains the importance of data smoothing technique in the prepro-cessing of data. Figure 2a is the sampling mode values of hardware event branchinstructions for two possible processes in a system. We can easily see that thedata is full of short term fluctuations and many redundancies. Discrimination ofthe two processes seems difficult in this case. There is a need of preprocessing inthe dataset. The transformed data of the hardware event after the application ofSMA (with a window size equal to 100) is shown in Figure 2b. From this figure,one can discriminate between two processes easily.
Feature Scaling The ranges of values for each feature may vary widely. Manymachine learning algorithms find difficulties to optimize the prediction functionas they use Euclidean distance as the distance between two points. In that case,if the range of one feature is considerably larger than all other features in thedataset, the distance will be dominated by this particular feature. Thus, all thefeatures need to be normalized so that each of them contributes to the finaldistance proportionally.
We use one of such feature scaling technique, Standardization [28], to scalethe values of the hardware events. Standardization converts the values of eachfeature to the data of zero mean and unit variance. Standardization sometimeshelps machine learning algorithm to converge quickly.
2.4 Anomaly Detection
Anomalies in data are those data that do not satisfy a well-defined notion ofnormal behavior [29]. Anomalies might be induced in data for different reasons -one of which is the execution of malicious activities. Typically, to get a labeled setof an anomalous dataset which covers all possible types of anomalies is consideredto be harder than to get a labeled dataset of normal observations. Moreover,anomalies are often dynamic in nature, which can create a new behavior forwhich there is no labeled data.
There are different techniques to deal with these anomalies - among whichwe choose to use a semi-supervised method for anomaly detection. This method
assumes that the training dataset contains the labeled instances of only thenormal class. Since we can provide ample training examples of normal systembehavior and the label of anomalous behavior is not required, this method worksbetter in our situation.
We used one of the widely used semi-supervised anomaly detection techniqueOne-Class Support Vector Machine (OC-SVM) [30] with non-linear “RBF” ker-nel in our detection mechanism. One-Class SVM treat the origin as the onlymember of the second class after transforming the feature via the kernel. Thenusing “relaxation parameters”, it separates the image of the one class from theorigin. Then the standard two-class SVM (which we discuss later) techniquesare employed.
2.5 Classification
Classification is a type of supervised learning process. The primary purpose of aclassification process is to build up a model which can predict a new unlabeleddata based on the experience obtained from the previously collected labeled data.Classification consists of two steps - Training and Testing.
In the training phase, a classier is fed with a broad cross-section of data fromthe original dataset, known as training data, containing a set of features andcorresponding label. Here, the label is a function of features, which the classierintends to learn. After the completion of each training phase, the classier is fedwith another set of data, known as test data, containing the data not present intraining set to estimate the accuracy or effectiveness of the model, referred toas the testing phase of the classier. Once the overall training is complete for theclassier, i.e., the mapping function from the feature to label is learned, we canfeed a new data with an unknown label to predict the class of the data.
The primary challenge in the classification process is to find the featuresthat distinguish each class very well. Every supervised learning comprises of acommon problem known as over-fitting. The model may fit the training dataaccurately but performs unsatisfactorily on the new unlabeled data. This issuecan be prevented partially by applying some regularization techniques.
A major theme in supervised machine learning problems has been havingalgorithms generalize from the training data rather than simply memorizingit. But there is a subtle issue that plagues all machine learning algorithms,summarized as the ”no free lunch theorem.” [31]. This theorem states that thereis no model which works best for all types of datasets. A good performance ofone classifier for a particular dataset could not ensure its good performance forother datasets also.
In this section, we discuss the basic working of some of the widely acceptedclassifiers, which we have considered to select a best one for our problem via acomparative study.
Random Forest Random Forest [32] is an ensemble learning method thatworks by constructing multiple decision trees at training time. An ensemble

learning is a process in which multiple classifiers are grouped together, and thedecisions of each classifier are combined to get a decision about the class of theinput data. In a random forest, the mode of the classes of each decision tree fora particular input decides the class of the data. We briefly discuss the growingof each tree in a random forest as follows -
1. Each tree is trained with approximately 2/3rd of the total training data,which are taken at random but with replacement from the original data.
2. A set of features, with predefined, constant size, is selected at random fromthe total feature set, and the best split on these is used to split a node. TheGini impurity determines the best split.
3. Each tree is grown to the maximum extent without any pruning. New datais predicted from the trained random forest by taking majority votes fromall the trees.
Adaboost The AdaBoost [33] algorithm is used in combination with many othertypes of weak learning algorithms to improve their performances. The outputof the boosted classier is determined by taking a weighted sum of the output ofthe weak learners. The parameters of each weak learner in AdaBoost is modifiedfor those instances which were misclassified by the previous parameter settings.The AdaBoost algorithm has the benefit that during the training process onlythose features are selected which contribute more to the predictive power of themodel, thereby, reduces the dimensionality and improves the execution time.
Multi-Layer Perceptron A commonly used Multilayer Perceptron (MLP) is afeed-forward artificial neural network model. An MLP contains multiple layers ofneurons with an activation function, and each layer fully connects the next layerwith numerical values called weights. This activation function maps weightedsum inputs to the output of the neuron. The objective of the MLP is to learnthese weights for matching the inputs to the outputs as efficiently as possible.
The input layer of an MLP contains neurons equal to the number of features,and the output layer contains neurons equal to the number of classes. The data isfed to the input layer of the network, and after the feed-forward propagation, theoutput layer of the network contains a vector of values. The neuron containingmaximum value determines the class of the data.
The training process of the perceptron network involves multiple steps ofback-propagation [34]. The error in prediction is calculated and using this errorthe weights of the network is modified by gradient descent algorithm.
Naıve Bayes Naıve Bayes Classier is one of the simple probabilistic classierbased on Bayes theorem. This classier has a strong assumption that the featuresare independent among themselves. From the training data, a likelihood prob-ability is calculated for each feature. For an unknown input data, the posteriorprobability for each class is calculated using Bayes’ theorem. The class havingmaximum posterior probability value becomes the predicted level for the inputdata.

Support Vector Machine Support Vector Machine (SVM) [35] is a non-probabilistic linear binary classier, which assigns unknown examples to one classor the other. In SVM the training examples are represented as data points inthe feature space and are separated by choosing an optimal hyperplane. Thehyperplane is selected in such a way that the distance from the nearest pointson the either side of the plane, known as support vectors, to it is maximum.
SVM can be used to classify non-linearly separable data by converting it tolinear separable one using some kernel transformation. SVM can solve multi-class classification problem by reducing it to multiple binary class classificationproblems using one-vs-one or one-vs-rest strategy. In one-vs-one strategy, theclass with the maximum number of votes is predicted as the actual class whereasin one-vs-rest strategy the classier with the highest value of output functionassigns the class.
2.6 Time-Series Analysis
Time series is a sequence of data points taken successively over equally spacedpoints time. Hence, it is a sequence of discrete-time data. The analysis of time-series data comprises of extracting meaningful data and other characteristics ofthe data.
Two time-series data may vary in speed and to measure the similarity be-tween them a sequence alignment approach namely Dynamic Time Warping(DTW) is widely used. In general, DTW calculates an optimal match betweentwo given sequences with certain restrictions. The sequences are “warped” non-linearly in the time dimension to determine a measure of similarity, which isindependent of some non-linear variations in the time dimension.
There are many variations of DTW among them we chose to use Fast Dy-namic Time Warping (fastDTW) [36] for our experimentation purpose.
3 Proposed Methodology
In this section we introduce the basic operations of our detection mechanismalong with a detailed description of different steps.
3.1 Overview
The basic overview of the proposed approach is graphically presented in Figure 3.Our detection technique consists of three major steps. These three phases arebriefly discussed as follows -
1. Anomaly Detection: In this step, we generate significant volumes of low-level data at a chosen frequency by granular profiling the performance coun-ters with perf tool. Then this data are processed through some data prepro-cessing steps and passed to the anomaly detector module, which is nothingbut a One-Class Support Vector Machine (OC-SVM). This module outputswhether the input data is an anomaly or a normal, benign process.

2. Classification: If there is any abnormality, the abnormal process is thenpassed to the pre-trained classifier, in this step, to know the category ofabnormality. This step outputs the possible type (like cache-based or branch-prediction based) of side-channel-attack for the abnormal process.
3. Correlation Module: This step profiles the appropriate hardware or soft-ware event, determined from the classification step, for the anomaly processand tries to find the similarity with this to the profile of the same eventfor the encryption algorithm. The similarity between these two temporal se-quences with different spreads is determined through the Fast Dynamic TimeWarping (fast-DTW) algorithm. If the similarity is more than a predefinedthreshold value, then we can term the anomalous process as a side-channel-attack.
Fig. 3: Basic overview of the detection mechanism
These steps are explained below with a lot more details in the followingsubsections.
3.2 First Phase: Anomaly Detection
We used One Class Support Vector Model to deal with the anomalies in thisstep. This module is particularly helpful in scenarios where a lot of “normal”data are available but not many cases of anomalies that we try to detect. Thisanomaly detection model needs to be trained with a dataset that contains all ormost normal data.
The data collection for the normal behavior of a system can be achievedby profiling some frequently used standard Linux commands like cd, mv, cp,
apt-get, bzip2, gzip, echo, grep, passwd, pwd, ls, and so on. We col-lect the data using user level Linux perf tool in sampling mode of operation with

a chosen time interval. We used most significant hardware events to monitorwhich are responsible for differentiating between a benign and an attack processas described in Case Study: I.
This collection of data then works as a training dataset for the OC-SVM. TheOC-SVM then infers the properties of normal cases and from these propertiescan predict which examples are unlike the normal examples, i.e., an anomalousexample using the learned decision boundary.
The hyper-parameters of the learning algorithm like fraction of outliers (η),stopping tolerance (ε) are tuned by iterating over the training process, and thebest setting is selected based on the optimal result.
Case Study: II We try to explain the decision boundary learned by theanomaly detection module with the form of a case study. We implemented theanomaly detection model on both the experimental setup and trained it with thesimilar approach as mentioned above. We considered only two events to monitorin parallel, namely branches and branch-misses, for the sake of 2-D representa-tion and a better understanding of the decision boundary. The learned decisionboundary is shown in Figure 4a for the first experimental setup an in Figure 4bthe for second experimental setup with a thick red line with the training exam-ples which are shown in the figure as green dots.
(a) Anomaly detection in first experimentalsetup
(b) Anomaly detection in second experi-mental setup
Fig. 4: Anomaly Detection
After the training when the anomaly detection module works in real time,the classification of the new set of real-time data are also shown in the Figure 4.The blue dots in the figures indicate the new set of normal execution data, allof which are correctly detected within the decision boundary. Then we tried tomount a branch-prediction based side-channel-attack code on the system, andrightfully most of the examples of execution traces of this attack lay outside thedecision boundary and acted as anomalies in the system, which are represented

as red dots in the figures. Because of the branch prediction based attack thehardware events like branches and branch-misses will be enough to determinethe anomalous behavior of the process, which is quite clear from the Figure 4.
We can also see from Figure 4b that OC-SVM is very powerful against train-ing set errors. The training set, in this case, contains a noisy sample which ithad handled successfully and considered only the most usual training examples.
3.3 Second Phase: Classification
In the second step of our proposed approach, we build a classifier to modelthe behaviors of different side-channel-attacks. For this purpose, we collect theexecution traces of various hardware events of different state-of-the-art side-channel-attacks and learn their behaviors with a classification task. For example,all the cache-based attacks will affect the hardware events such as LLC Access,LLC Miss, etc. So, abnormalities in the cache access pattern from the normalbehavior can term a process as a potential cache based attack. Similarly, forbranch prediction based attacks abnormalities can be seen in branch instructions,branch-misses, etc. The Same approach is followed for different side-channel-attacks to learn their behaviors.
As mentioned previously, because of the “No Free Lunch” theorem, there isno one supervised machine learning model that works best for every problem.The assumptions of a great model for one problem may not hold for anotherproblem. We train various widely used classifiers, as mentioned previously, forthe same dataset and find the one which works best for our problem.
Case Study: III We try to give focus on the idea of comparing the differentclassifiers and selecting the best one for this phase with a simple case study.Here we considered three different types of attacks for our demonstration:
1. Two Cache-timing based attack on AES and Clefia respectively.2. Branch-prediction based attack on RSA.
In this scenario, we considered only two hardware events, namely branchmisses and instruction count, for the sake of representation of the decisionboundaries in a 2-D plane and for a clear understanding. In Figure 5 the de-cision boundaries are represented for four different classifiers, namely Adaboost,Random Forest, Naıve Bayes and SVM.
The horizontal axis represents the number of branch-misses (in thousands)whereas the vertical axis represents the number of instructions (in millions).The red squares represent the training set of cache-based attacks in the figure,and blue triangles represent the training set of Branch-prediction based Attack.Accordingly, the decision boundaries are shown in the figures.
We can rightly observe from Figure 5 that for cache-based attack, numberof instruction counts are high because of cache misses and for branch predictionbased attack branch-misses are high.

Fig. 5: Decision Boundary of different Classifiers on some of the side-channel-attacks
As we can see, based on selecting the classifier, for a new point the decisionmay change. We could get a clear picture of the behaviors of different typesattacks once we consider the best classifier after comparing their accuracies.
The accuracies for different classifiers used in this step is mentioned in detailsin Results and Discussion section.
3.4 Third Phase: Correlation
The final and most important step of our proposed architecture is the correlationmodule. In this step, we try to correlate the appropriate hardware performancecounter values to the secret key of the encryption algorithm. The appropriatehardware event can be obtained by observing the result of the classification step.If the behavior of the anomalous process is classified as a cache-based attack,then the execution trace of the hardware events responsible for those types ofattacks needs to be correlated with the secret key for a successful attack.
First, we generate the execution trace of the encryption algorithm for a par-ticular hardware event (say T1). Next, we observe the execution trace of theanomalous process for the same hardware event (say T2). These two traces are

nothing but two different temporal sequences. Since the side-channels-attackwork by continuously monitoring the encryption algorithm, in this case, it canbe said that T1 is contained in T2, but with some added noise of executionbecause of the attacker’s own code.
We apply a widely used temporal sequence alignment problem, known asFast Dynamic Time Warp (fast-DTW), as mentioned previously, to find thealignment cost between T1 and T2. A low value of alignment cost signifies the highamount of matching between these two sequences which in turn means a highcorrelation between secret key and the execution trace of the anomalous process.High correlation with the secret key helps to identify the true positiveness ofthe side-channel-attack process. A process having a low correlation value canbe treated as a benign process, thereby reducing the false positives. Extensiveexperimentation determines the threshold of the alignment cost.
Case Study: IV We present here a simple case study of a side-channel-attackon Clefia [13], a Block Cipher developed by Sony. In this case study, we considerthe following three situations -
– A side-channel-attack is executing in the system to compromise the secretkey of Clefia, which is previously detected as an anomaly and one of thehardware events causing the anomaly is instruction counts.
– Same situation as above but in a multi-user environment, i.e., user1 is exe-cuting Clefia with a secret key k1, but the side-channel-attack is executingto compromise the secret key k2 of user2.
– A Firefox application detected as an anomaly in the first step, and the hard-ware event causing the abnormality is instruction count.
In all the three cases, we applied our correlation module by observing theinstruction execution traces (this event was among one of the anomalies as re-ported by the classifier since the classifier was already trained with behaviors ofpossible attacks on Clefia) with a fixed time interval. The results of minimumcost alignments, with window size = 1, are presented in Figure 6.
The alignment cost for Figure 6a is the lowest, which is 2734.785 preciselyconsidering the Manhattan Distance as a distance measure. The alignment costfor Figure 6b and Figure6c are 4159.338 and 16771.428 respectively. This align-ment cost perfectly reflects the correlation of the process traces with the secretkey. For a predefined threshold value, the first scenario will be correctly treatedas a case of side-channel-attack by our detection system.
For an unknown “intelligent” attack belonging to the category of cache-basedattack, or branch prediction based attack, or a DRAM based attack, though itsbehavior is not trained to the classifier, it will be successfully detected basedon its abnormal hardware event accesses (since the classifier is already trainedwith attacks of the same category though not the same). Once the categoryis determined, the correlation module can be used to measure the amount ofcorrelation with its hardware event trace with the secret key of encryption, andthus can be successfully detected as an attack process.

(a) Correlation for first situation (b) Correlation for second situation
(c) Correlation for third situation
Fig. 6: Correlation with key for different situations
4 Results and Discussion
In this section, we focus on the performance and qualitative evaluation of ourdetection mechanism.
4.1 Experimental Setup
We perform all the experiments in two different environments to get a generalizedperformance measure of the detection scheme.
1. Setup 1: Optiplex 9020 Desktop equipped with Intel Core i5-4570 CPU with3.20GHz clock frequency, 4GB RAM running Ubuntu 16.04.1 having KernelLinux 4.8.0-49-generic.
2. Setup 2: GPU Server powered by Intel Xeon E5-2630 v3 CPU with the2.40GHz clock frequency and 256GB RAM.
4.2 Accuracy of different phases
Here we discuss the detection accuracies of each of the phase individually.

Anomaly Detection Phase In this phase to model the normal behavior ofthe anomaly detection module, we select most common Linux commands andutilities [37]. We measure the True Positive (TP) (an anomaly is correctly iden-tified), False Positive (FP) (a regular process is identified as an anomaly), TrueNegative (TN) (a regular process doesn’t get identified as an anomaly) and FalseNegative (FN) (an anomaly detected as regular process) from our anomaly de-tection module. In ideal scenario TP, TN should be 100% and FP, FN should be0%. We also calculated the accuracy of the system as:
Accuracy =TP + TN
TP + FP + FN + TN(1)
We consider all the attacks mentioned in the preliminaries along with somemicro-architecture intensive sample programs which are not attacks (having highcache access or high branch-misses) but a simple benign process to test whetherour detection module can capture any anomalies in the system.
We considered two profiling granularity of 1ms and 10ms, and for each fre-quency, we executed the detection module 100 times with randomly checking thenormal process, attack process and sample micro-architecture intensive programsin each run and report the accuracy of the system on both the experimental setupin Table 1 and Table 2 respectively.
Table 1: Sampling granularity of 1msSetup 1 Setup 2
Positive Negative Positive NegativeTrue 35 65 True 47 48False 0 0 False 5 0
Table 2: Sampling granularity of 10msSetup 1 Setup 2
Positive Negative Positive NegativeTrue 51 46 True 35 57False 3 0 False 7 1
Accuracies in Table 1 are 100% and 97% and in Table 2 are 97% and 92%respectively.
The corresponding ROC Curves for all the above four cases are shown inFigure 7.
From the above tables and figures, we can easily say that the anomaly de-tection module performs well in real-time for both the setups. We verified ourdetection technique with different sampling granularities, and also observed thatanomaly detection method works better for 1ms profiling frequency.

(a) Setup 1 with 1ms time period (b) Setup 2 with 1ms time period
(c) Setup 1 with 10ms time period (d) Setup 2 with 10ms time period
Fig. 7: Receiver Operating Characteristic Curves
Classification Phase We have considered three different categories of attacksin the previous sections - cache-based, branch-based and DRAM based. We traineach classifier, as mentioned previously, with the behavior of these attacks to cor-rectly model the generalized exploitation of hardware events. Like the previousphase, in this phase also we consider some micro-architecture intensive samplecode to check whether the classifier correctly classifies the abnormality in thehardware events.
The classification algorithms were tested by cross-validation method on thedataset of behaviors of the side-channel-attacks mentioned in the preliminariessection. The accuracies of different classifiers for both the setups and for twodifferent sampling frequencies are mentioned in Table 3 and Table 4.
Table 3: Classification Accuracy for Setup 1Naıve Bayes MLP SVM Adaboost Random Forest
1ms 81.01% 82.1% 91.0% 99.1% 99.2%
10ms 78.3% 81.4% 89.57% 99.0% 98.7%

Fig. 8: Learning Curves for the classifiers in Setup 1 with 1ms granular sampling
The learning curves for the classifiers in Setup 1 with 1ms of granular profilingare shown in Figure 8. The red line indicates the training score for the classifier,whereas, the green line signifies the cross-validation score. We can easily see thatRandom Forest and Adaboost outperform the other classifiers for our problem.Also, we can observe that, with lower profiling granularity, accuracies of theclassifiers increase, it is because the more granular the data, the more distinctivebehavior can be seen in the attacks.
The learning curves for the classifiers in Setup 2 with 1ms of granular profilingare shown in Figure 9. The red line indicates the training score for the classifier,whereas, the green line signifies the cross-validation score. Here also we can easilysee that Random Forest and Adaboost outperform the other classifiers. Also, wecan observe that, with lower profiling granularity, accuracies of the classifiersincrease.
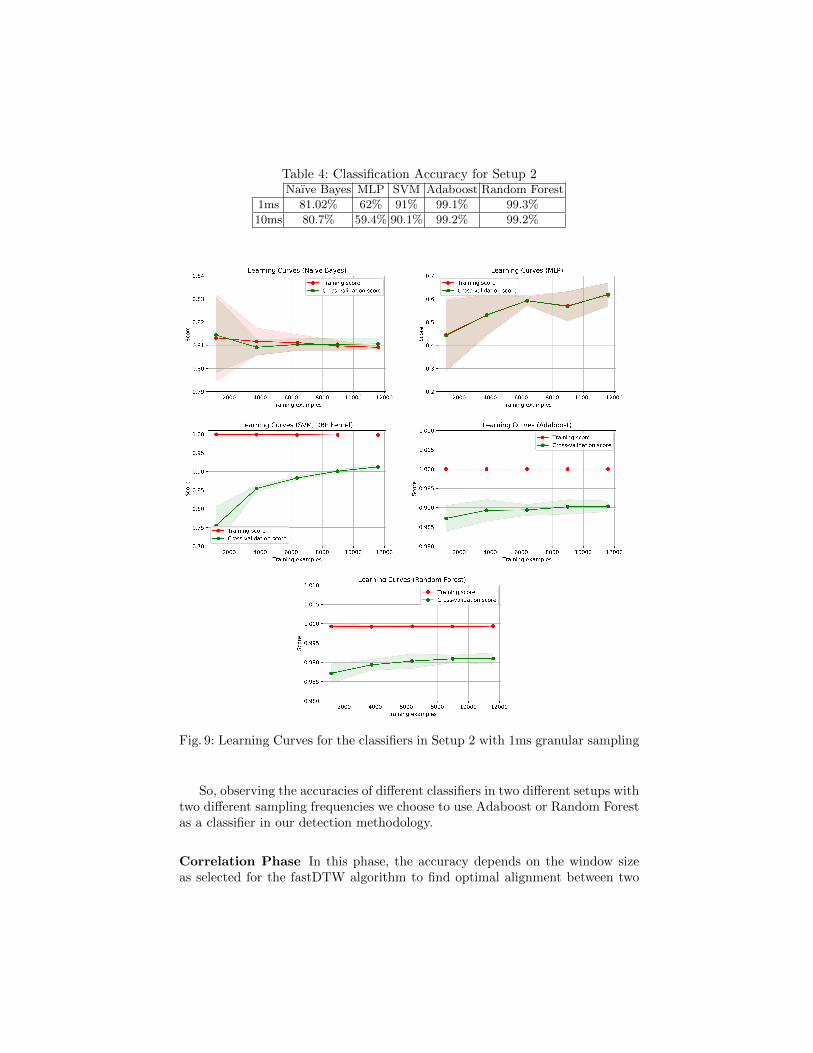
Table 4: Classification Accuracy for Setup 2Naıve Bayes MLP SVM Adaboost Random Forest
1ms 81.02% 62% 91% 99.1% 99.3%
10ms 80.7% 59.4% 90.1% 99.2% 99.2%
Fig. 9: Learning Curves for the classifiers in Setup 2 with 1ms granular sampling
So, observing the accuracies of different classifiers in two different setups withtwo different sampling frequencies we choose to use Adaboost or Random Forestas a classifier in our detection methodology.
Correlation Phase In this phase, the accuracy depends on the window sizeas selected for the fastDTW algorithm to find optimal alignment between two

time-series sequences of hardware events. Here we run the experiment as men-tioned in Case Study: IV for the two experimental setups and with two samplingfrequencies along with some micro-architecture intensive random benign sampleprograms which behave similarly as that of the attack. For a predefined thresh-old value, we conduct the experiment for different window length and reportthe accuracy of the module in Table 5. The accuracy is calculated according toequation (1).
Table 5: Accuracy of Correlation Module for different window sizeSetup 1 Setup 2
w=1 w=3 w=5 w=1 w=3 w=51ms 76% 79% 83% 1ms 57% 67% 74%10ms 63% 75% 82% 10ms 62% 63% 69%
We can observe from Table 5 that accuracy of the correlation module is bestin Setup 1 when profiling at 1ms time interval for window size = 5 and with thesame granularity and window size it is also best in Setup 2. The low accuracy inthe second setup is because of the presence of background noise in the system.
5 Future Work
The possible future work in this direction would be to retrain the classifier aftereach successful attack detection to increase the accuracy and accommodate newtypes of attack. The accuracy of detection against the training overhead wouldbe our next research work.
Future work on this needs to focus on improving the accuracy of the corre-lation based module in the presence of large background noise, to make it morefeasible to real-time implementation.
Another future direction could be to implement the proposed detection methodin Cloud environment where the possibility of existence of side channel attacksis very high.
6 Conclusion
This paper proposed a Machine Learning based three phase approach to de-tect different micro-architectural side-channel-attacks. The main working of thismethod is to profile hardware events at lower granularity and process it with ma-chine learning algorithms. This approach can also deal with false positives andunknown attack with a novel technique which correlates its execution trace withthe secret encryption key, using a time-series approach. The results establishedthe fact with superiority.

References
1. Bonneau, J., Mironov, I.: Cache-collision timing attacks against AES. In: Crypto-graphic Hardware and Embedded Systems - CHES 2006, 8th International Work-shop, Yokohama, Japan, October 10-13, 2006, Proceedings. (2006) 201–215
2. Aciicmez, O., Koc, C.K., Seifert, J.: Predicting secret keys via branch prediction.In: Topics in Cryptology - CT-RSA 2007, The Cryptographers’ Track at the RSAConference 2007, San Francisco, CA, USA, February 5-9, 2007, Proceedings. (2007)225–242
3. Uhsadel, L., Georges, A., Verbauwhede, I.: Exploiting hardware performance coun-ters. In: Fifth International Workshop on Fault Diagnosis and Tolerance in Cryp-tography, 2008, FDTC 2008, Washington, DC, USA, 10 August 2008. (2008) 59–67
4. Bhattacharya, S., Mukhopadhyay, D.: Who watches the watchmen?: Utilizing per-formance monitors for compromising keys of RSA on intel platforms. In: Cryp-tographic Hardware and Embedded Systems - CHES 2015 - 17th InternationalWorkshop, Saint-Malo, France, September 13-16, 2015, Proceedings. (2015) 248–266
5. Qian Ge, Yuval Yarom, F.L., Heiser, G.: Contemporary processors are leaky - andthere’s nothing you can do about it (feb 2017)
6. Liu, F., Lee, R.B.: Random fill cache architecture. In: 47th Annual IEEE/ACMInternational Symposium on Microarchitecture, MICRO 2014, Cambridge, UnitedKingdom, December 13-17, 2014. (2014) 203–215
7. Domnitser, L., Jaleel, A., Loew, J., Abu-Ghazaleh, N.B., Ponomarev, D.: Non-monopolizable caches: Low-complexity mitigation of cache side channel attacks.TACO 8(4) (2012) 35:1–35:21
8. Martin, R., Demme, J., Sethumadhavan, S.: Timewarp: Rethinking timekeepingand performance monitoring mechanisms to mitigate side-channel attacks. In: Pro-ceedings of the 39th Annual International Symposium on Computer Architecture.ISCA ’12, Washington, DC, USA, IEEE Computer Society (2012) 118–129
9. Chiappetta, M., Savas, E., Yilmaz, C.: Real time detection of cache-based side-channel attacks using hardware performance counters. Applied Soft Computing49 (2016) 1162 – 1174
10. Demme, J., Maycock, M., Schmitz, J., Tang, A., Waksman, A., Sethumadhavan, S.,Stolfo, S.: On the feasibility of online malware detection with performance coun-ters. In: Proceedings of the 40th Annual International Symposium on ComputerArchitecture. ISCA ’13, New York, NY, USA, ACM (2013) 559–570
11. Zhang, T., Zhang, Y., Lee, R.B.: Cloudradar: A real-time side-channel attackdetection system in clouds. In: Research in Attacks, Intrusions, and Defenses -19th International Symposium, RAID 2016, Paris, France, September 19-21, 2016,Proceedings. (2016) 118–140
12. Bernstein, D.J.: Cache-timing attacks on aes. Technical report (2005)13. Rebeiro, C., Mukhopadhyay, D., Takahashi, J., Fukunaga, T. In: Cache Timing
Attacks on Clefia. Springer Berlin Heidelberg, Berlin, Heidelberg (2009) 104–11814. Wikipedia: Rowhammer wikipedia page, https://en.wikipedia.org/wiki/Row-
hammer (2016)15. Kim, Y., Daly, R., Kim, J., Fallin, C., Lee, J., Lee, D., Wilkerson, C., Lai, K.,
Mutlu, O.: Flipping bits in memory without accessing them: An experimentalstudy of DRAM disturbance errors. In: ACM/IEEE 41st International Symposiumon Computer Architecture, ISCA 2014, Minneapolis, MN, USA, June 14-18, 2014.(2014) 361–372

16. Huang, R., Yang, H., Chao, M.C., Lin, S.: Alternate hammering test forapplication-specific drams and an industrial case study. In: The 49th Annual De-sign Automation Conference 2012, DAC ’12, San Francisco, CA, USA, June 3-7,2012. (2012) 1012–1017
17. Kim, D., Nair, P.J., Qureshi, M.K.: Architectural support for mitigating rowhammering in DRAM memories. Computer Architecture Letters 14(1) (2015)9–12
18. Wang, X., Karri, R.: Numchecker: detecting kernel control-flow modifying rootkitsby using hardware performance counters. In: The 50th Annual Design AutomationConference 2013, DAC ’13, Austin, TX, USA, May 29 - June 07, 2013. (2013) 79:1–79:7
19. Wang, X., Konstantinou, C., Maniatakos, M., Karri, R.: Confirm: Detectingfirmware modifications in embedded systems using hardware performance counters.In: Proceedings of the IEEE/ACM International Conference on Computer-AidedDesign, ICCAD 2015, Austin, TX, USA, November 2-6, 2015. (2015) 544–551
20. Wang, X., Karri, R.: Reusing hardware performance counters to detect and identifykernel control-flow modifying rootkits. IEEE Trans. on CAD of Integrated Circuitsand Systems 35(3) (2016) 485–498
21. Malone, C., Zahran, M., Karri, R.: Are hardware performance counters a costeffective way for integrity checking of programs. In: Proceedings of the sixth ACMworkshop on Scalable trusted computing, STC@CCS 2011, Chicago, Illinois, USA,October 17, 2011. (2011) 71–76
22. Performance Application Programming Interface: (2016)23. OProfile: (2015)24. perf: Linux profiling with performance counters: (2015)25. Intel 64 & IA-32 Architectures Software Developer’s Manual Volume 3 (3A, 3B,
3C & 3D): System Programming Guide: (2010)26. Meinshausen, N., Bhlmann, P.: Stability selection. Journal of the Royal Statistical
Society: Series B (Statistical Methodology) 72(4) (2010) 417–47327. Chou, Y.L.: Statistical Analysis. Holt International (1975)28. Theodoridis, S., Koutroumbas, K.: Pattern Recognition. Elsevier Academic Press
(2009)29. Chandola, V., Banerjee, A., Kumar, V.: Anomaly detection: A survey. ACM
Comput. Surv. 41(3) (July 2009) 15:1–15:5830. Scholkopf, B., Platt, J.C., Shawe-Taylor, J.C., Smola, A.J., Williamson, R.C.: Es-
timating the support of a high-dimensional distribution. Neural Comput. 13(7)(July 2001) 1443–1471
31. Wolpert, D.H.: The lack of a priori distinctions between learning algorithms. NeuralComputation 8(7) (Oct 1996) 1341–1390
32. Ho, T.K.: Random decision forests. In: Proceedings of the Third InternationalConference on Document Analysis and Recognition (Volume 1) - Volume 1. ICDAR’95, Washington, DC, USA, IEEE Computer Society (1995) 278–
33. Freund, Y., Schapire, R.E.: A decision-theoretic generalization of on-line learningand an application to boosting. J. Comput. Syst. Sci. 55(1) (August 1997) 119–139
34. Rumelhart, D.E., Hinton, G.E., Williams, R.J.: Neurocomputing: Foundations ofresearch. MIT Press, Cambridge, MA, USA (1988) 696–699
35. Cortes, C., Vapnik, V.: Support-vector networks. Mach. Learn. 20(3) (September1995) 273–297
36. Salvador, S., Chan, P.: Toward accurate dynamic time warping in linear time andspace. Intell. Data Anal. 11(5) (October 2007) 561–580

37. Natarajan, R.: 50 most frequently used unix / linux commands (with examples)(nov 2010)