performance comparison of speaker identification using circular dft and wht sectors
TRANSCRIPT

8/7/2019 Performance Comparison of Speaker Identification using circular DFT and WHT Sectors
http://slidepdf.com/reader/full/performance-comparison-of-speaker-identification-using-circular-dft-and-wht 1/5
(IJCSIS) International Journal of Computer Science and Information Security,
Vol. 9, No. 3, 2011
Performance Comparison of Speaker Identification
using circular DFT and WHT SectorsDr. H B Kekre1, Vaishali Kulkarni2,
Indraneal Balasubramanian3, Abhimanyu Gehlot4, Rasik Srinath5
1Senior Professor, Computer Dept., MPSTME, NMIMS University.
[email protected] 2Associate Professor, EXTC Dept., MPSTME, NMIMS University.
[email protected] 3, 4, 5
students, B-Tech EXTC, MPSTME, NMIMS University.
[email protected], [email protected], [email protected]
Abstract— In this paper we aim to provide a unique approach to
text dependent speaker identification using transform techniques
such as DFT (Discrete Fourier Transform) and WHT (Walsh
Hadamard Transform). In the first method, the feature vectors
are extracted by dividing the complex DFT spectrum into
circular sectors and then taking the weighted density count of the
number of points in each of these sectors. In the second method,
the feature vectors are extracted by dividing the WHT spectrum
into circular sectors and then again taking the weighted density
count of the number of points in each of these sectors. Further,
comparison of the two transforms shows that the accuracy
obtained for DFT is more (80%) than that obtained for WHT
(66%).
Keywords - Speaker identification; Circular Sectors; weighted
density; Euclidean distance
I. INTRODUCTION
Human speech conveys an abundance of information, fromthe language and gender to the identity of the person speaking.The purpose of a speaker recognition system is thus to extractthe unique characteristics of a speech signal that identify aparticular speaker [1 - 4]. Speaker recognition systems areusually classified into two subdivisions, speaker identificationand speaker verification [2 – 5]. Speaker identification (alsoknown as closed set identification) is a 1: N matching processwhere the identity of a person must be determined from a set of known speakers [7]. Speaker verification (also known as openset identification) serves to establish whether the speaker iswho he claims to be [8]. Speaker identification can be furtherclassified into text-dependent and text-independent systems. Ina text dependent system, the system knows what utterances to
expect from the speaker. However, in a text-independentsystem, no assumptions about the text can be made, and thesystem must be more flexible than a text dependent system [4,5, and 8].
Speaker recognition systems find use in a multitude of applications today including automated call processing intelephone networks as well as query systems such as stock information, weather reports etc. However, difficulties in widedeployment of such systems are a practical limitation that is yetto be overcome [2, 6, 7, 9, and 10]. We have proposed speaker
identification using power distribution in the frequency domain[11], [12]. We have also proposed speaker recognition usingvector quantization in time domain by using LBG (Linde BuzoGray), KFCG (Kekre’s Fast Codebook Generation) and KMCG
(Kekre’s Median Codebook Generation) algorithms [13 – 15]and in transform domain using DFT (Discrete FourierTransform), DCT (Discrete Cosine Transform) and DST(Discrete Sine Transform) [16].
The concept of sectorization has been used for (CBIR)content based image retrieval. [17] – [21]. We have proposedspeaker identification using circular DFT sectors [22]. In thispaper, we propose speaker identification using WHT (WalshHadamard Transform), and also compare the results with DFTsectors. In Fig. 1, we can see how a basic speaker identificationsystem operates. A number of speech samples are collectedfrom a variety of speakers, and then their features are extractedand stored as reference models in a database. When a speaker isto be identified, the features of his speech are extracted and
compared with all of the reference speaker models. Thereference model which gives the minimum Euclidean distancewith the feature vector of the person to be identified is themaximum likelihood model and is declared as the personidentified.
II. III. IV. V. VI.
VII. EASE OF USE
A. Selecting a Template (Heading 2)
FF
Figure 1. Speaker Identification System
139 http://sites.google.com/site/ijcsis/ISSN 1947-5500

8/7/2019 Performance Comparison of Speaker Identification using circular DFT and WHT Sectors
http://slidepdf.com/reader/full/performance-comparison-of-speaker-identification-using-circular-dft-and-wht 2/5
(IJCSIS) International Journal of Computer Science and Information Security,
Vol. 9, No. 3, 2011
A. Discrete Fourier Transform(DFT)
The DFT transforms time or space based data into
frequency-based data. The DFT allows you to efficiently
estimate component frequencies in data from a discrete set of
values sampled at a fixed rate [23, 24]. If the speech signal is
represented by y (t), then the DFT of the time series or
samples y0, y1,y2, …..yN-1 is defined as given by (1):
Yk = ne-2jπkn/N
(1)
Where yn=ys (nΔt); k= 0, 1, 2…, N-1.Δt is the sampling interval.
B. Walsh Hadamard Transform
The Walsh transform or Walsh– Hadamard transform is a
non-sinusoidal, orthogonal transformation technique that
decomposes a signal into a set of basis functions. These basis
functions are Walsh functions, which are rectangular or square
waves with values of +1 or – 1. The Walsh– Hadamardtransform returns sequency values. Sequency is a more
generalized notion of frequency and is defined as one half of
the average number of zero-crossings per unit time interval.
Each Walsh function has a unique sequency value. You can
use the returned sequency values to estimate the signal
frequencies in the original signal. The Walsh– Hadamard
transform is used in a number of applications, such as image
processing, speech processing, filtering, and power spectrum
analysis. It is very useful for reducing bandwidth storage
requirements and spread-spectrum analysis [25]. Like the FFT,
the Walsh– Hadamard transform has a fast version, the fast
Walsh– Hadamard transform (fwht). Compared to the FFT,
the FWHT requires less storage space and is faster to calculatebecause it uses only real additions and subtractions, while the
FFT requires complex values. The FWHT is able to represent
signals with sharp discontinuities more accurately using fewer
coefficients than the FFT. FWHTh is a divide and conquer
algorithm that recursively breaks down a WHT of size N into
two smaller WHTs of size N / 2. This implementation follows
the recursive definition of the Hadamard matrix H N
given by (2):
(2)
The normalization factors for each stage may be
grouped together or even omitted. The Sequency ordered, alsoknown as Walsh ordered, fast Walsh– Hadamard transform,FWHTw, is obtained by computing the FWHTh as above, andthen rearranging the outputs.
The rest of the paper is organized as follows: Section IIexplains the sectorization process, Section III explains thefeature extraction using the density of the samples in each of the sectors, Section IV deals with Feature Matching, and resultsare explained in Section V and the conclusion in section VI.
II. SECTORIZATION OF THE COMPLEX TRANSFORM PLANES
The speech signal has amplitude range from -1 to +1. It isfirst converted into positive values by adding +1 to all thesample values. Thus the amplitude range of the speech signal isnow from 0 to 2. For sectorization two methods are used,which are described below:
A. DFT Sectorization
The algorithm for DFT sectorization is given below:
1. The DFT of the speech signal is computed. Since the DFT
is symmetrical, only half of the number of points in the
DFT is considered while drawing the complex DFT plane
(i.e. Yreal vs. Yimag).
2. Also the first point in DFT is a real number, so it is
considered separately while taking feature vectors. So the
complex plane is only from (2, N/2), where N is the
number of points in DFT. Fig. 2 shows the original speech
signal and its complex DFT plane for one of the samples
in the database.
3. For dividing the complex plane into sectors, themagnitude of the DFT is considered as the radius of the
circular sector as in (3):
Radius (R) = abs (sqrt ((Yreal)2+(Yimag)
2)) (3)
4. Table I shows the range of the radius taken for dividing
the DFT plane into circular sectors.
Figure 2. Speech signal and its complex DFT plane
5. The maximum range of the radius for forming the sectors
was found by experimenting on the different samples in
Identify applicable sponsor/s here. (sponsors)
0 0.5 1 1.5 2 2.5 3 3.5 4 4.5 5
x 104
-1
-0.5
0
0.5
1
No. of samples
A
mplitude
-400 -300 -200 -100 0 100 200 300 400-400
-300
-200
-100
0
100
200
300
400
Xreal
Ximag
140 http://sites.google.com/site/ijcsis/
ISSN 1947-5500
8/7/2019 Performance Comparison of Speaker Identification using circular DFT and WHT Sectors
http://slidepdf.com/reader/full/performance-comparison-of-speaker-identification-using-circular-dft-and-wht 3/5
(IJCSIS) International Journal of Computer Science and Information Security,
Vol. 9, No. 3, 2011
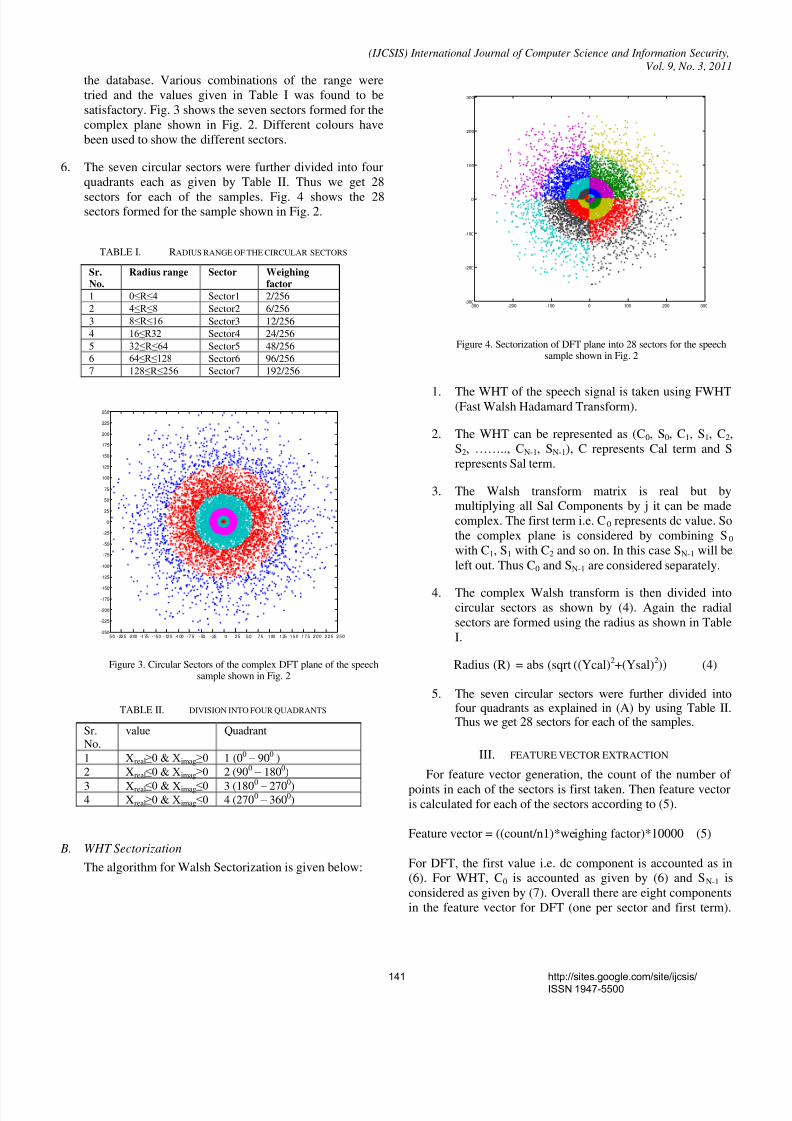
the database. Various combinations of the range were
tried and the values given in Table I was found to be
satisfactory. Fig. 3 shows the seven sectors formed for the
complex plane shown in Fig. 2. Different colours have
been used to show the different sectors.
6. The seven circular sectors were further divided into four
quadrants each as given by Table II. Thus we get 28
sectors for each of the samples. Fig. 4 shows the 28sectors formed for the sample shown in Fig. 2.
TABLE I. RADIUS RANGE OF THE CIRCULAR SECTORS
Sr.No.
Radius range Sector Weighingfactor
1 0≤R≤4 Sector1 2/256
2 4≤R≤8 Sector2 6/256
3 8≤R≤16 Sector3 12/256
4 16≤R32 Sector4 24/256
5 32≤R≤64 Sector5 48/256
6 64≤R≤128 Sector6 96/256
7 128≤R≤256 Sector7 192/256
Figure 3. Circular Sectors of the complex DFT plane of the speechsample shown in Fig. 2
TABLE II. DIVISION INTO FOUR QUADRANTS
Sr.No.
value Quadrant
1 Xreal≥0 & Ximag≥0 1 (00 – 900 )
2 Xreal≤0 & Ximag≥0 2 (900 – 1800)
3 Xreal≤0 & Ximag≤0 3 (1800 – 2700)4 Xreal≥0 & Ximag≤0 4 (2700 – 3600)
B. WHT Sectorization
The algorithm for Walsh Sectorization is given below:
Figure 4. Sectorization of DFT plane into 28 sectors for the speechsample shown in Fig. 2
1. The WHT of the speech signal is taken using FWHT(Fast Walsh Hadamard Transform).
2. The WHT can be represented as (C0, S0, C1, S1, C2,
S2, …….., CN-1, SN-1), C represents Cal term and S
represents Sal term.
3. The Walsh transform matrix is real but by
multiplying all Sal Components by j it can be made
complex. The first term i.e. C0 represents dc value. So
the complex plane is considered by combining S0
with C1, S1 with C2 and so on. In this case SN-1 will be
left out. Thus C0 and SN-1 are considered separately.
4. The complex Walsh transform is then divided intocircular sectors as shown by (4). Again the radial
sectors are formed using the radius as shown in Table
I.
Radius (R) = abs (sqrt ((Ycal)2+(Ysal)
2)) (4)
5. The seven circular sectors were further divided intofour quadrants as explained in (A) by using Table II.Thus we get 28 sectors for each of the samples.
III. FEATURE VECTOR EXTRACTION
For feature vector generation, the count of the number of
points in each of the sectors is first taken. Then feature vectoris calculated for each of the sectors according to (5).
Feature vector = ((count/n1)*weighing factor)*10000 (5)
For DFT, the first value i.e. dc component is accounted as in
(6). For WHT, C0 is accounted as given by (6) and SN-1 is
considered as given by (7). Overall there are eight components
in the feature vector for DFT (one per sector and first term).
-25 0 - 22 5 -2 00 -1 75 - 15 0 - 12 5 -1 00 - 7 5 - 50 - 25 0 2 5 5 0 7 5 1 00 1 25 1 5 0 1 7 5 2 0 0 2 2 5 2 5 0-250
-225
-200
-175
-150
-125
-100
-75
-50
-25
0
25
50
75
100
125
150
175
200
225
250
-300 -200 -100 0 100 200 300-300
-200
-100
0
100
200
300
141 http://sites.google.com/site/ijcsis/
ISSN 1947-5500

8/7/2019 Performance Comparison of Speaker Identification using circular DFT and WHT Sectors
http://slidepdf.com/reader/full/performance-comparison-of-speaker-identification-using-circular-dft-and-wht 4/5
(IJCSIS) International Journal of Computer Science and Information Security,
Vol. 9, No. 3, 2011
Similarly, there are nine components in the feature vector for
WHT (one per sector, first term and last term), when the seven
circular sectors are considered. When 28 sectors are
considered there are 29 components in the feature vector (one
per sector and first term) for DFT and 30 components in the
feature vector (one per sector, first term and last term) for
WHT.
First term = sqrt (abs (first value of DFT/WHT)) (6)
Last term = sqrt (abs (Last value of FWHT)) (7)
IV. RESULTS
A. Database description
The speech samples used in this work are recorded usingSound Forge 4.5. The sampling frequency is 8000 Hz (8 bit,mono PCM samples). Table II shows the database description.The samples are collected from different speakers. Samples aretaken from each speaker in two sessions so that training modeland testing data can be created. Twelve samples per speaker aretaken. The samples recorded in one session are kept in databaseand the samples recorded in second session are used for testing.
TABLE III. DATABASE DESCRIPTION
Parameter Sample characteristics
Language English
No. of Speakers 30
Speech type Read speech
Recording conditions Normal. (A silent room)
Sampling frequency 8000 Hz
Resolution 8 bps
B. Experimentation
This algorithm was tested for text dependent speakeridentification. Feature vectors for both the methods describedin section II were calculated as shown in section III. Fortesting, the test sample is similarly processed and feature vectoris calculated. For recognition, the Euclidean distance betweenthe features of the test sample and the features of all thesamples stored in the database is computed. The sample in thedatabase for which the Euclidean distance is minimum, isdeclared as the speaker recognized.
C. Accuracy of Identification
The accuracy of the identification system is calculated as
given by equation 5.
(5)
Fig. 5 shows the results obtained for DFT sectorization. Asseen from the results, when the complex DFT plane is dividedinto seven sectors, the maximum accuracy is around 80% anddecreases as the number of samples in the database is increased(64% for 30 samples). It can be seen that accuracy increaseswhen the number of sectors into which the complex DFT planeis divided, is increased from 7 to 28. With 28 sectors, themaximum accuracy is 80% up to 20 samples after which it
decreases. When the complex plane is further divided into 56sectors, there is a improvement in accuracy for less number of samples, but as the number of samples is increasedperformance is similar as that with 28 sectors. Fig. 6 shows the
Figure 5. Accuracy for DFT Sectorization
Figure 6. Accuracy for WHT Sectorization
results obtained for WHT sectorization. Here also we see that
accuracy improves as the number of sectors is increased from
7 to 28. But further division into 56 sectors does not give any
advantage. Overall the results obtained for DFT are better than
those obtained for WHT.
142 http://sites.google.com/site/ijcsis/
ISSN 1947-5500

8/7/2019 Performance Comparison of Speaker Identification using circular DFT and WHT Sectors
http://slidepdf.com/reader/full/performance-comparison-of-speaker-identification-using-circular-dft-and-wht 5/5
(IJCSIS) International Journal of Computer Science and Information Security,
Vol. 9, No. 3, 2011
V. CONCLUSION
Speaker Identification using the concept of Sectorization has
been proposed in this paper. The complex DFT and WHT
plane has been divided into circular sectors and feature vectors
have been calculated using weighted density. Accuracy
increases when the 7 circular sectors are divided into 28
sectors for both the transform techniques. But there is no
significant improvement when the complex plane is further
divided. The results also show that the performance of DFT is
better than WHT.
REFERENCES
[1] Lawrence Rabiner, Biing-Hwang Juang and B.Yegnanarayana,“Fundamental of Speech Recognition”, Prentice-Hall, Englewood Cliffs,2009.
[2] S Furui, “50 years of progress in speech and speaker recognitionresearch”, ECTI Transactions on Computer andInformation Technology,Vol. 1, No.2, November 2005.
[3] D. A. Reynolds, “An overview of automatic speaker recognitiontechnology,” Proc. IEEE Int. Conf. Acoust., Speech,S on Speech and
Audio Processing, Vol. 7, No. 1, January 1999. IEEE, New York, NY,U.S.A
[4] S. Furui. Recent advances in speaker recognition. AVBPA97, pp 237--251, 1997
[5] J. P. Campbell, ``Speaker recognition: A tutorial,'' Proceedings of theIEEE, vol. 85, pp. 1437--1462, September 1997.
[6] D. A. Reynolds, “Exper imental evaluation of features for robust speakeridentification,” IEEE Trans. Speech Audio Process., vol. 2, no. 4, pp.639– 643, Oct. 1994.
[7] Tomi Kinnunen, Evgeny Karpov, and Pasi Fr¨anti, “Realtime Speaker Identification”, ICSLP2004.
[8] F. Bimbot, J.-F. Bonastre, C. Fredouille, G. Gravier, I. Magrin-Chagnolleau, S. Meignier, T. Merlin, J. Ortega-García, D.Petrovska-Delacrétaz, and D. A. Reynolds, “A tutorial on text-independent speakerverification,” EURASIP J. Appl. Signal Process., vol. 2004, no. 1, pp.430– 451, 2004.
[9] Marco Grimaldi and Fred Cummins, “Speaker Identification usingInstantaneous Frequencies”, IEEE Transactions on Audio, Speech, andLanguage Processing, vol., 16, no. 6, August 2008.
[10] Zhong-Xuan, Yuan & Bo-Ling, Xu & Chong-Zhi, Yu. (1999). “BinaryQuantization of Feature Vectors for Robust Text-Independent SpeakerIdentification” in IEEE Transactions.
[11] Dr. H B Kekre, Vaishali Kulkarni,”Speaker Identification using Power Distribution in Frequency Spectrum”, Technopath, Journal of Science,Engineering & Technology Management, Vol. 02, No.1, January 2010.
[12] Dr. H B Kekre, Vaishali Kulkarni, “Speaker Identification by usingPower Distribution in Frequency Spectrum”, ThinkQuest - 2010International Conference on Contours of Computing Technology”,BGIT, Mumbai,13th -14th March 2010.
[13] H B Kekre, Vaishali Kulkarni, “Speaker Identification by using Vector Quantization”, International Journal of Engineering Science and
Technology, May 2010.[14] H B Kekre, Vaishali Kulkarni, “Performance Comparison of Speaker
Recognition using Vector Quantization by LBG and KFCG ” ,International Journal of Computer Applications, vol. 3, July 2010.
[15] H B Kekre, Vaishali Kulkarni, “ Performance Comparison of Automatic Speaker Recognition using Vector Quantization by LBGKFCG and KMCG”, International Journal of Computer Science andSecurity, Vol: 4 Issue: 5, 2010.
[16] H B Kekre, Vaishali Kulkarni, “Comparative Analysis of AutomaticSpeaker Recognition using Kekre’s Fast Codebook GenerationAlgorithm in Time Domain and Transform Domain” , InternationalJournal of Computer Applications, Volume 7 No.1. September 2010.
[17] H B Kekre, Dhirendra Mishra, “Performance Comparison of DensityDistribution and Sector mean of sal and cal functions in WalshTransform Sectors as Feature Vectors for Image Retrieval ” ,International Journal of Image Processing ,Volume :4, Issue:3, 2010.
[18] H B Kekre, Dhirendra Mishra,“CBIR using Upper Six FFT Sectors of Color Images for Feature Vector Generationl”, International Journal of Engineering and Technology,Volume :2(2)”, 2010.
[19] H B Kekre, Dhirendra Mishra, “Performance Comparison of Four,Eight & Twelve Walsh Transform Sectors Feature Vectors for ImageRetrieval from Image Databases”, International Journal of EngineeringScience and Technology”, Volume :2(5) , 2010.
[20] H B Kekre, Dhirendra Mishra, “ Four Walsh Transform SectorsFeature Vectors for Image Retrieval from Image Databases ” ,International Journal of Computer Science and InformationTechnologies”, Volume :1(2) , 2010.
[21] H B Kekre, Dhirendra Mishra, “Digital Image Search & Retrievalusing FFT Sectors of Color Images”, International Journal of ComputerScience and Engineering”, Volume :2 , No.2, 2010.
[22] H B Kekre, Vaishali Kulkarni, “Automatic Speaker Recognition usingcircular DFT Sector”, Interanational Conference and Workshop onEmerging Trends in Technology (ICWET 2011), 25-26 February, 2011.
[23] Bergland, G. D. "A Guided Tour of the Fast Fourier Transform." IEEESpectrum 6, 41-52, July 1969
[24] Walker, J. S. Fast Fourier Transform, 2nd ed. Boca Raton, FL: CRCPress, 1996.
[25] Terry Ritter, Walsh-Hadamard Transforms: A Literature Survey, Aug.1996.
AUTHORS PROFILE
Dr. H. B. Kekre has received B.E. (Hons.) in Telecomm. Engg. from Jabalpur
University in 1958, M.Tech (Industrial Electronics) from IIT Bombay in 1960,
M.S.Engg. (Electrical Engg.) from University of Ottawa in 1965 and Ph.D.
(System Identification) from IIT Bombay in 1970. He
has worked Over 35 years as Faculty of Electrical
Engineering and then HOD Computer Science and Engg.at IIT Bombay. For last 13 years worked as a Professor in
Department of Computer Engg. at Thadomal Shahani
Engineering College, Mumbai. He is currently Senior
Professor working with Mukesh Patel School of Technology Management andEngineering, SVKM’s NMIMS University, Vile Parle(w), Mumbai, INDIA.
He ha guided 17 Ph.D.s, 150 M.E./M.Tech Projects and several B.E./B.TechProjects. His areas of interest are Digital Signal processing, Image Processing
and Computer Networks. He has more than 300 papers in National /
International Conferences / Journals to his credit. Recently twelve studentsworking under his guidance have received best paper awards. Recently two
research scholars have received Ph. D. degree from NMIMS University
Currently he is guiding ten Ph.D. students. He is member of ISTE and IETE.
Vaishali Kulkarni has received B.E in Electronics
Engg. from Mumbai University in 1997, M.E (Electronicsand Telecom) from Mumbai University in 2006. Presently
she is pursuing Ph. D from NMIMS University. She has a
teaching experience of more than 8 years. She is Associate
Professor in telecom Department in MPSTME, NMIMS
University. Her areas of interest include Speech
processing: Speech and Speaker Recognition. She has 10 papers in National / International Conferences / Journals to her credit.
143 http://sites.google.com/site/ijcsis/
ISSN 1947-5500