performance charts – implementation and usage - ca technologies
TRANSCRIPT

Performance Charts – Implementation and Usage An extension of CA NetMaster product with CA SYSVIEW integration October 2013 CA Technologies

CA Technologies Engineering Research and Development Lab, Sydney, Australia.
Thank you for your interest in our products.
© Copyright CA 2013. All rights reserved. All trademarks, trade names, service marks and logos referenced herein belong to their respective companies. No unauthorized use, copying or distribution permitted.
THIS DOCUMENT IS FOR YOUR INFORMATIONAL PURPOSES ONLY. CA assumes no responsibility for the accuracy or completeness of the information. TO THE EXTENT PERMITTED BY APPLICABLE LAW, CA PROVIDES THIS DOCUMENT "AS IS" WITHOUT WARRANTY OF ANY KIND, INCLUDING, WITHOUT LIMITATION, ANY IMPLIED WARRANTIES OF MERCHANTABILITY, FITNESS FOR A PARTICULAR PURPOSE, OR NONINFRINGEMENT. In no event will CA be liable for any loss or damage, direct or indirect, in connection with this presentation, including, without limitation, lost profits, lost investment, business interruption, goodwill, or lost data, even if CA is expressly advised of the possibility of such damages.
Certain information in this document may outline CA's general product direction. This presentation shall not serve to (i) affect the rights and/or obligations of CA or its licensees under any existing or future written license agreement or services agreement relating to any CA software product; or (ii) amend any product documentation or specifications for any CA software product. The development, release and timing of any features or functionality described in this presentation remain at CA's sole discretion.
Notwithstanding anything in this document to the contrary, upon the general availability of any future CA product release referenced in this presentation, CA may make such release available (i) for sale to new licensees of such product; and (ii) in the
form of a regularly scheduled major product release. Such releases may be made available to current licensees of such product who are current subscribers to CA maintenance and support on a when and if-available basis.
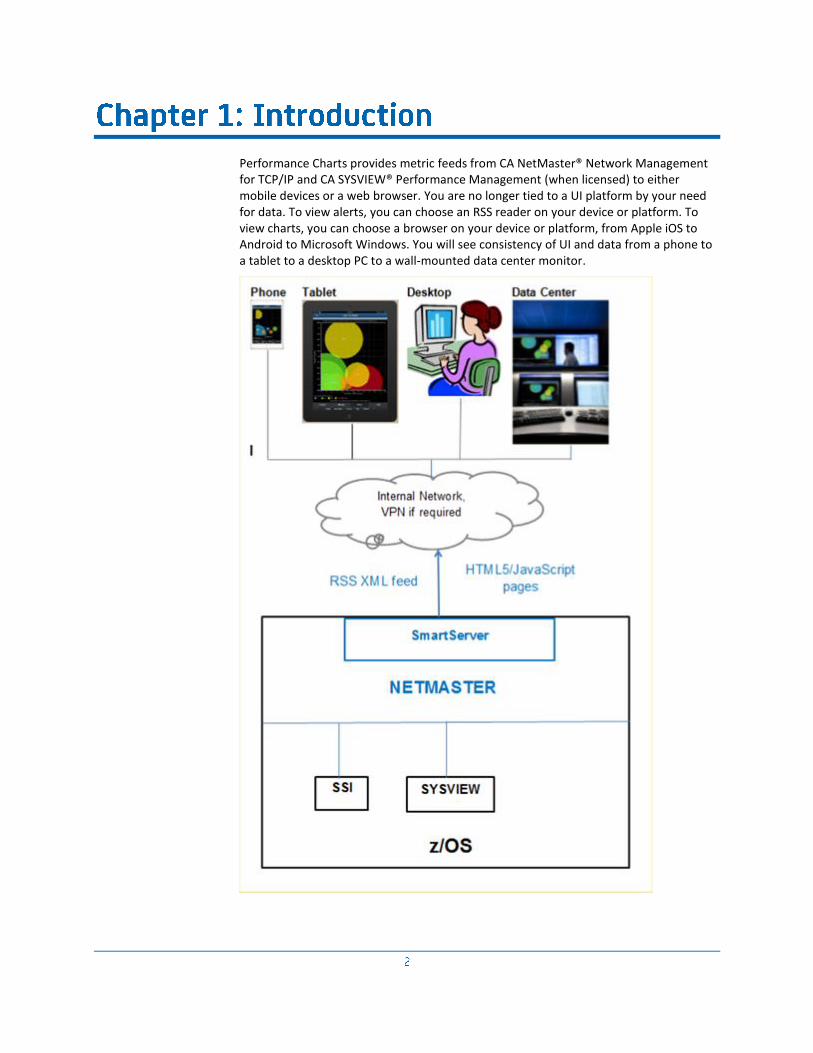
Performance Charts provides metric feeds from CA NetMaster® Network Management for TCP/IP and CA SYSVIEW® Performance Management (when licensed) to either mobile devices or a web browser. You are no longer tied to a UI platform by your need for data. To view alerts, you can choose an RSS reader on your device or platform. To view charts, you can choose a browser on your device or platform, from Apple iOS to Android to Microsoft Windows. You will see consistency of UI and data from a phone to a tablet to a desktop PC to a wall-mounted data center monitor.

This guide uses the following abbreviations:
NetMaster
CA NetMaster Network Management for TCP/IP 12.1
SYSVIEW
CA SYSVIEW Performance Management (currently supported releases)
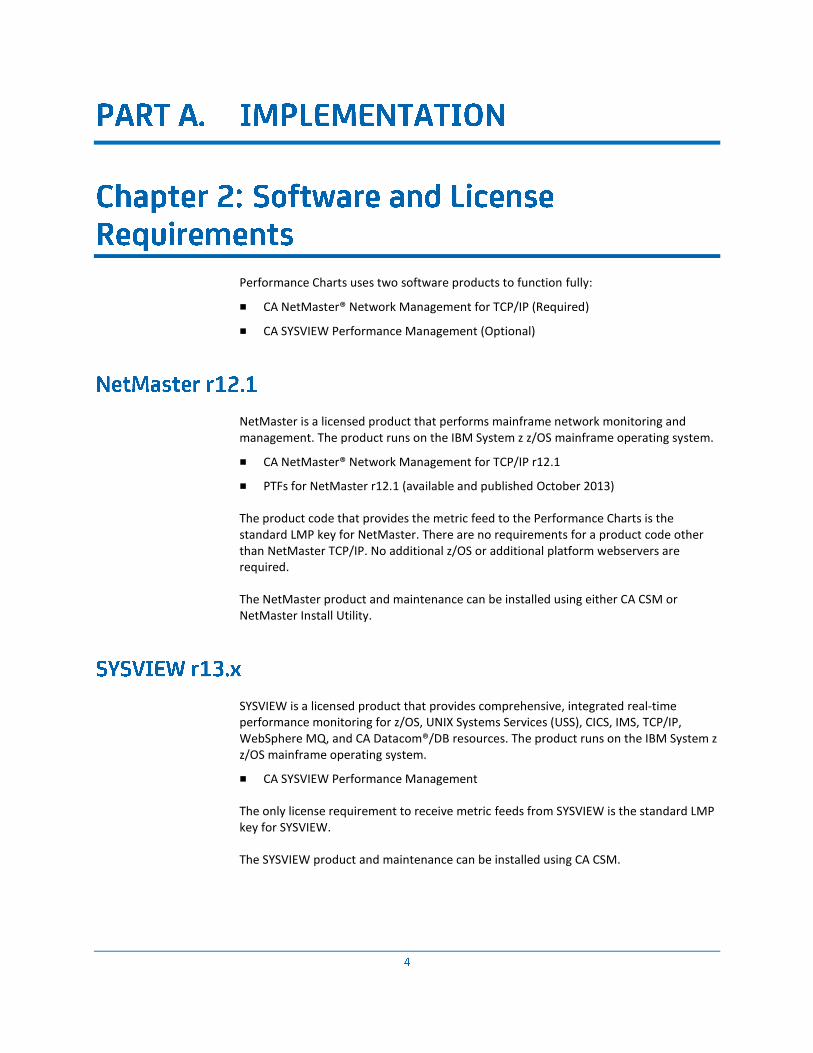
Performance Charts uses two software products to function fully:
■ CA NetMaster® Network Management for TCP/IP (Required)
■ CA SYSVIEW Performance Management (Optional)
NetMaster is a licensed product that performs mainframe network monitoring and management. The product runs on the IBM System z z/OS mainframe operating system.
■ CA NetMaster® Network Management for TCP/IP r12.1
■ PTFs for NetMaster r12.1 (available and published October 2013)
The product code that provides the metric feed to the Performance Charts is the standard LMP key for NetMaster. There are no requirements for a product code other than NetMaster TCP/IP. No additional z/OS or additional platform webservers are required.
The NetMaster product and maintenance can be installed using either CA CSM or NetMaster Install Utility.
SYSVIEW is a licensed product that provides comprehensive, integrated real-time performance monitoring for z/OS, UNIX Systems Services (USS), CICS, IMS, TCP/IP, WebSphere MQ, and CA Datacom®/DB resources. The product runs on the IBM System z z/OS mainframe operating system.
■ CA SYSVIEW Performance Management
The only license requirement to receive metric feeds from SYSVIEW is the standard LMP key for SYSVIEW.
The SYSVIEW product and maintenance can be installed using CA CSM.

All product components and deliverables are 100 percent z/OS-mainframe-hosted in the existing CA NetMaster product environment. The environment consists of two z/OS started tasks: a region task and an SSI task. The HTTP and Application Server functions are embedded in this NetMaster environment. No UNIX System Services, HFS, Apache, or Tomcat components are needed. There are no CA software client components.
For the mobile charts, no Windows, Apple iOS, or Android client-side components are needed.
This enhancement contains the following features:
■ Performance Charts
■ SmartServer RSS Feeds
Performance Charts has the following requirements:
■ The following list shows the minimum release of the supported operating systems:
– Apple iOS 6
– Google Android 4.0
– Microsoft Windows 7
■ The following list shows the minimum release of the supported web browsers:
– Apple Safari 5
– Google Chrome 27
– Microsoft Internet Explorer 10
– Mozilla Firefox 21
SmartServer RSS Feeds is supported on the Microsoft Internet Explorer and Mozilla Firefox browsers. RSS Feeds on mobile devices can use any of a number of available RSS readers.
All features of this project require a mobile device user to be within their corporate firewall, to access their mainframe.
■ In many cases if a mobile device is used in a corporate office, it automatically connects to and it authenticates with an internal corporate WiFi network. From there, it usually has direct access to these features.
■ If a mobile device is used outside a corporate office, it must have access to a third-party WiFi network and must use a VPN client to access the internal corporate network.

For maximum accessibility, this initial version of Performance Charts delivers only ‘read only’ functions to mobile devices, and requires no login from the mobile device. Any mobile device once it is correctly authenticated to the corporate intranet may access the Performance Charts functions.
The network traffic statistics displayed on the mobile charts are already displayed on ‘public’ (no login) NetMaster WebCenter pages.
If you want to suppress viewing of the Alert RSS feed and/or the mobile charts for internal security reasons, configure NetMaster to suppress these features at a system level. This suppression applies to all users.
If requested, login processing and user-specific granular security may be added in a later version.
As an application administrator, you want to configure the feature to provide mobile access by the end users to network and system performance data.
Follow these steps:
1. Add the following statement to your TESTEXEC(RUNSYSIN) member.
PPREF=’PROD=RSS’
2. Review the WEBCENTER parameter group:
a. Ensure that WebCenter is ENABLED.
b. Note the WebCenter URL in the Access URL field.
c. Customize the Performance Charts and SmartServer RSS Feeds Alerts parameters, ensuring both features are ENABLED.
3. Communicate the following URLs to the end users:
Note: webc_url is your WebCenter URL.
■ Performance Charts:
webc_url/m/common/perfcharts.esp
■ SmartServer RSS Feeds:
webc_url/public/nmdata.rss
Note: An end user can change the Filter and Limit parameters dynamically. For example, the following URL filters the alerts using a defined SEV2 Alert Monitor filter and limits the number of listed alerts to 10: webc_url/public/nmdata.rss?channel=alerts&filter=sev2&limit=10

New features are implemented with this service in the area of new charts and the ability to drive alerts to any device that can consume RSS feeds. This release introduces new “Bubble Charts” that are multidimensional in the data presentation (patent pending).
Key Features in Charts and RSS feeds
■ NetMaster Mobile Charts
Network performance charts, which are delivered by a mobile web application
■ Performance Mobile Charts (SYSVIEW)
System and application performance charts, which are delivered by a mobile web application
■ RSS Alert Feed
Network and operations automation alerts, which are delivered by an RSS news feed
Gauge Charts—fuel gauge visualizations of key metrics.
Bubble Charts—new innovative multidimensional visualizations.
Summary Tables—system level key metrics.
Growth Charts—show the trends over time of the total mainframe IP network
traffic use.
Pie Charts—key metrics in numerical proportions of network traffic.

Bubble Charts are new and innovative visualization charts that provide a user with multiple ways to look at key metrics. The following description uses the Top 10 Jobs by CPU% display as an example:
■ The bubble size and color indicate the current CPU% and I/Os per second rate for each job.
– If you want to compare current CPU% between jobs, look at the size. A bigger bubble indicates a higher current CPU%.
– If you want to compare the current rate of I/Os per second between jobs, look at the color.
■ The bubble position indicates the past activity for each job instance.
– If you want to compare the total CPU time between the jobs, look at the position along the y-axis. A higher bubble indicates higher total CPU time. CPU time (in CPU seconds) includes the accounted task time, job-step time, SRB time, and preemptable-class SRB time.
– If you want to compare the total number of I/O operations between the jobs, look at the position along the x-axis. A bubble further to the right indicates more I/O operations. The I/O operation count is reset when the job changes steps.

A series of charts that help you understand what is happening with key network metrics. These metrics are gathered in real time and presented in various styles.
Mainframe server retrieves mainframe network performance data from NetMaster, and then generates graphical mobile web pages to display it.
IP Stack Dashboard for lpar—Current metrics measured for the primary monitored z/OS IP stack on this LPAR
Top 10 Network Tasks on lpar—Top 10 Tasks by volume of TCP/IP network traffic.
Top 10 TCP Ports on lpar—Top 10 Ports by volume of recent TCP/IP network traffic.
Top 10 Network Interfaces on lpar—Top 10 Interfaces by volume of recent TCP/IP network traffic.
Top 10 Remote Addresses on lpar—Top 10 Addresses by volume of recent TCP/IP network traffic.
Top 10 Business Applications on lpar—Top 10 Business Applications by volume of recent TCP/IP network traffic.
Top 10 DB2 DDF Tasks on lpar—Top 10 DD2 DDF Tasks by volume of recent TCP/IP network traffic.

Show the trends over time in your total mainframe IP network traffic usage. You can see recent and long-term network activity growth from the last 14 days to the last 12 months and beyond.
Growth of IP Byte Traffic on lpar, by Protocol
Growth of IP Packet Traffic on lpar
Growth of TCP Byte Traffic on lpar, by Server
Growth of TCP Connections on lpar
Growth of TCP Connections on lpar, by Duration
Distribution of TCP Connections on, by Duration
Growth of UDP Byte Traffic on lpar

CPU Dashboard for lpar
CEC CPU% Dashboard
Storage Dashboard for lpar
Paging Dashboard for lpar
Top 10 Jobs by CPU% on lpar
CICS Region Summary on lpar
Health Check Summary on lpar
Systems Summary on lpar
For an at-a-glance view of recent metric history, click the History icon. The resulting Worm Chart shows you a trend picture of the most recent metric values. Typically these values were measured at intervals over the last 60 minutes.
CPU - CP% The percentage of busy CPU from a z/OS point of view. This includes only CP (general use) processors.
CPU - IIP% The percentage of busy CPU from a z/OS point of view. This includes only IIP (zIIP) processors.
CPU - IFA% The percentage of busy CPU from a z/OS point of view. This includes only IFA (zAAP) processors.
LCPU - CP% The percentage of busy CPU from an LPAR point of view. This includes only CP (general use) processors.

LCPU - IIP% The percentage of busy CPU from an LPAR point of view. This includes only IIP (zIIP) processors.
LCPU - IFA% The percentage of busy CPU from an LPAR point of view. This includes only IFA (zAAP) processors.
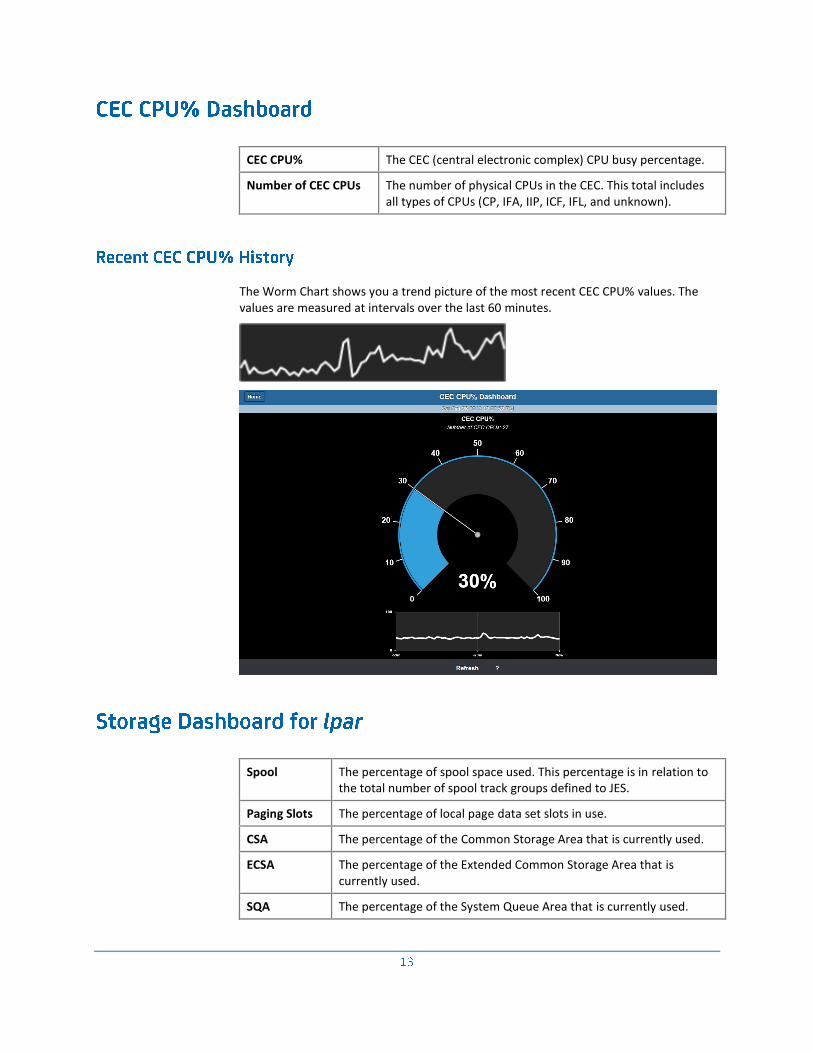
CEC CPU% The CEC (central electronic complex) CPU busy percentage.
Number of CEC CPUs The number of physical CPUs in the CEC. This total includes all types of CPUs (CP, IFA, IIP, ICF, IFL, and unknown).
The Worm Chart shows you a trend picture of the most recent CEC CPU% values. The values are measured at intervals over the last 60 minutes.
Spool The percentage of spool space used. This percentage is in relation to the total number of spool track groups defined to JES.
Paging Slots The percentage of local page data set slots in use.
CSA The percentage of the Common Storage Area that is currently used.
ECSA The percentage of the Extended Common Storage Area that is currently used.
SQA The percentage of the System Queue Area that is currently used.

ESQA The percentage of the Extended System Queue Area that is currently used.
For an at-a-glance view of recent metric history, click the History icon. The resulting Worm Chart shows you a trend picture of the most recent metric values. Typically these values were measured at intervals over the last 60 minutes.

Paging Slots The percentage of local page data set slots in use.
I/O Rate The overall start I/O rate for the system, expressed as the number of start I/Os per second.
Paging Rate The overall paging rate for the system, expressed as the number of pages per second.
Ready ASIDs The number of address spaces that have one or more tasks ready to be dispatched.
Paging AFQA The available frame queue average.
Ready Tasks The number of tasks ready to be dispatched.
For an at-a-glance view of recent metric history, click the History icon. The resulting Worm Chart shows you a trend picture of the most recent metric values. Typically these values were measured at intervals over the last 60 minutes.

This summary displays information about CICS address spaces that are currently being monitored or have been monitored since the last IPL.
To sort the table, click a column heading.
The following table describes the column headings:
Name The name of the job.
ExecStage The execution stage of the CICS region.
Status The current monitoring status.
RowStat The overall or highest conditional status field displayed on the row.
Trans The total transaction count since monitor initialization. The count includes those transactions that were excluded from statistical averaging due to excessive life time values.
TranRate The transaction rate per second.
CPUTime The average CPU used (in CPU seconds) by each transaction.
Lifetime The average lifetime (in seconds) for each transaction.
SuspTime The average suspend time (in seconds) for each transaction.
WTRTime The average Waiting To Run time (in seconds) for each transaction.
FileTime The average time, in seconds, spent processing file requests for each transaction.
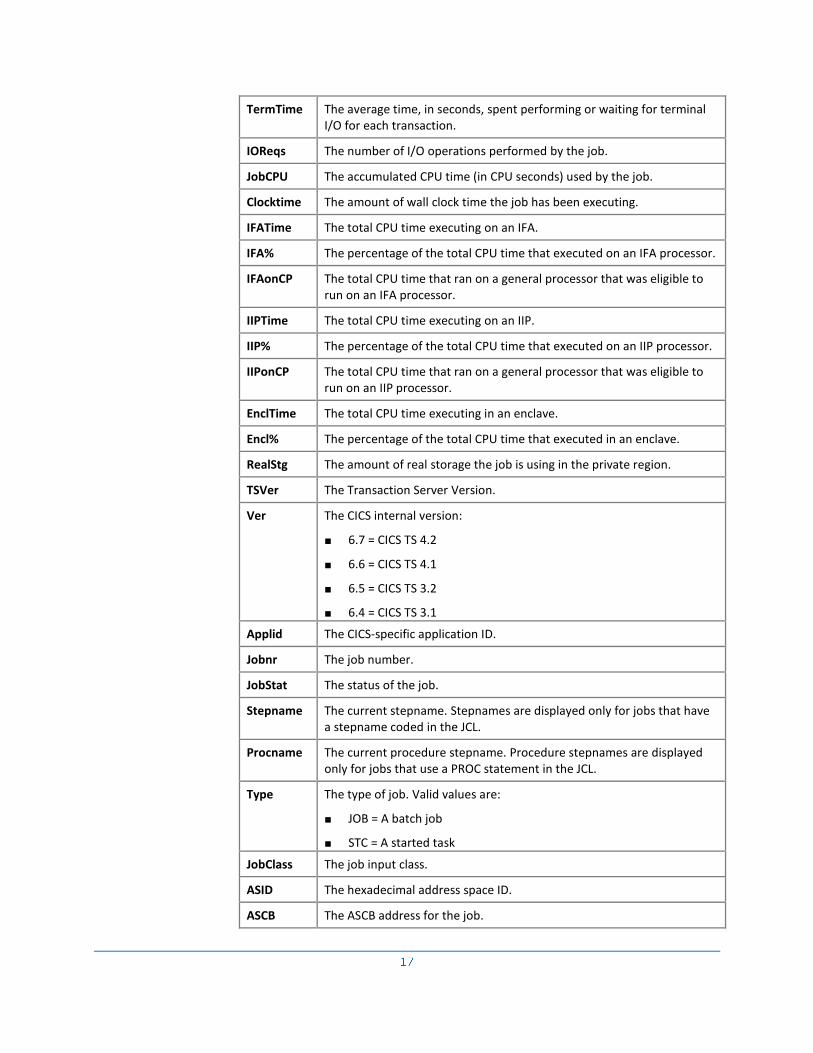
TermTime The average time, in seconds, spent performing or waiting for terminal I/O for each transaction.
IOReqs The number of I/O operations performed by the job.
JobCPU The accumulated CPU time (in CPU seconds) used by the job.
Clocktime The amount of wall clock time the job has been executing.
IFATime The total CPU time executing on an IFA.
IFA% The percentage of the total CPU time that executed on an IFA processor.
IFAonCP The total CPU time that ran on a general processor that was eligible to run on an IFA processor.
IIPTime The total CPU time executing on an IIP.
IIP% The percentage of the total CPU time that executed on an IIP processor.
IIPonCP The total CPU time that ran on a general processor that was eligible to run on an IIP processor.
EnclTime The total CPU time executing in an enclave.
Encl% The percentage of the total CPU time that executed in an enclave.
RealStg The amount of real storage the job is using in the private region.
TSVer The Transaction Server Version.
Ver The CICS internal version:
■ 6.7 = CICS TS 4.2
■ 6.6 = CICS TS 4.1
■ 6.5 = CICS TS 3.2
■ 6.4 = CICS TS 3.1
Applid The CICS-specific application ID.
Jobnr The job number.
JobStat The status of the job.
Stepname The current stepname. Stepnames are displayed only for jobs that have a stepname coded in the JCL.
Procname The current procedure stepname. Procedure stepnames are displayed only for jobs that use a PROC statement in the JCL.
Type The type of job. Valid values are:
■ JOB = A batch job
■ STC = A started task
JobClass The job input class.
ASID The hexadecimal address space ID.
ASCB The ASCB address for the job.

CLOGJOBN The CICS data logger jobname.
CICSLOGR The CICS data logger task ID.
GSVI The CICS transaction ID for the long running product request task.
GSVS The CICS transaction ID used to initialize the product.
GSVT The CICS transaction ID used to terminate the product.
JobReq Indicates if the job has been defined as a job that is required to be active. Possible values are:
■ blank = job is not required to be active.
■ JOBREQ = job is required to be active.
Description A description of the CICS region based on the jobname. The description for a CICS jobname is defined in the parmlib member JOBNAMES.
DSASize The current size of the DSA.
DSAAllo The current amount of storage allocated in the DSA.
DSAFree The amount of free storage available in the DSA.
DSALim The storage size limit for the DSA.
DSA% The percentage of the limit that is allocated.
EDSASize The current size of the EDSA.
EDSAAllo The current amount of storage allocated in the EDSA.
EDSAFree The amount of free storage available in the EDSA.
EDSALim The storage size limit for the EDSA.
EDSA% The percentage of the limit that is allocated.
GDSASize The current size of the GDSA.
GDSAAllo The current amount of storage allocated in the GDSA.
GDSAFree The amount of free storage available in the GDSA.
GDSALim The storage size limit for the GDSA.
GDSA% The percentage of the limit that is allocated.
PVTUser Private storage user allocated.
PVTSys Private storage system allocated.
PVTAlloc Private storage allocated (User + Sys).
PVTFree Private storage unallocated or free (Limit - User).
PVTS% The percentage of private size allocated.
PVTSize The private storage size.
PVTL% The percentage of storage limit allocated.
PVTLim The private storage limit.

EPVTUser E-Private storage user allocated.
EPVTSys E-Private storage system allocated.
EPVTAllo E-Private storage allocated (User + Sys).
EPVTFree E-Private storage unallocated or free (Limit - User).
EPVTS% The percentage of E-Private size allocated.
EPVTSize The E-Private storage size.
EPVTL% The percentage of storage limit allocated.
EPVTLim The E-Private storage limit.
Tasks The current number of active tasks.
MxtTask The current max task limit.
MxtTask% The max task percentage.
MaxTask CICS max task status.
VTAM VTAM connection status.
TCPIP TCP/IP connection status.
WEB WEB connection status.
DB2 DB2 connection status.
WebMQ WebSphere MQ connection status.
DBCTL DB Control connection status.
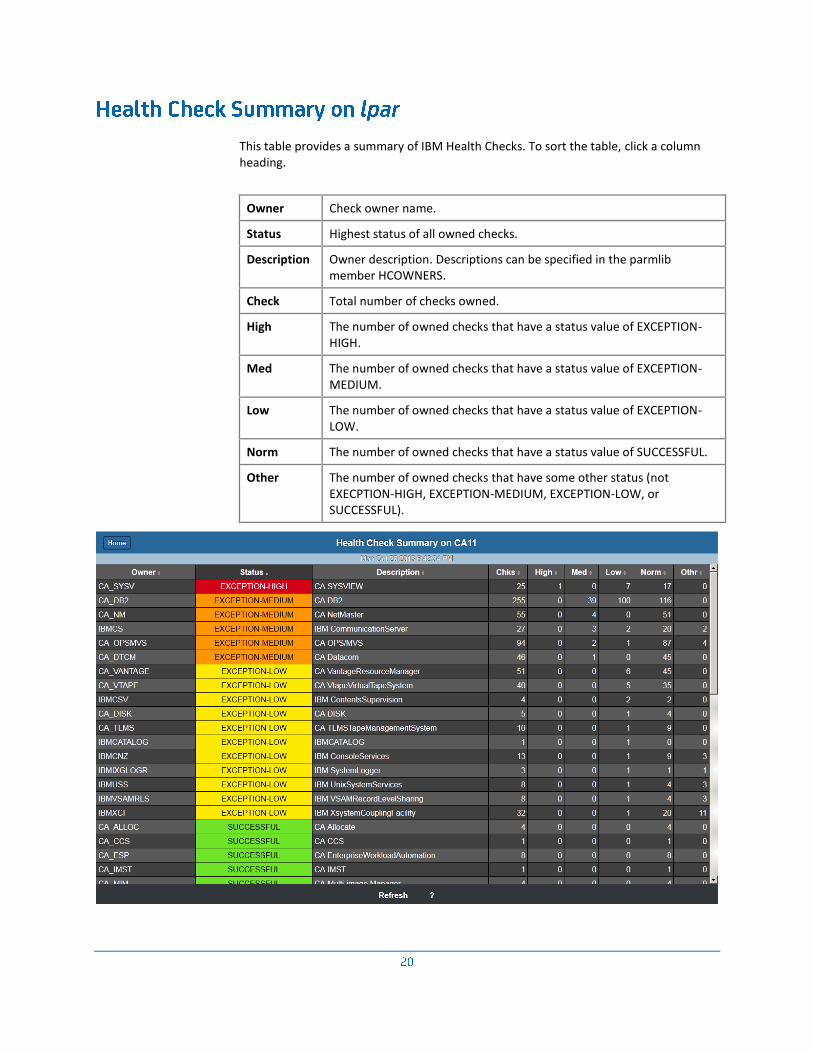
This table provides a summary of IBM Health Checks. To sort the table, click a column heading.
Owner Check owner name.
Status Highest status of all owned checks.
Description Owner description. Descriptions can be specified in the parmlib member HCOWNERS.
Check Total number of checks owned.
High The number of owned checks that have a status value of EXCEPTION-HIGH.
Med The number of owned checks that have a status value of EXCEPTION-MEDIUM.
Low The number of owned checks that have a status value of EXCEPTION-LOW.
Norm The number of owned checks that have a status value of SUCCESSFUL.
Other The number of owned checks that have some other status (not EXECPTION-HIGH, EXCEPTION-MEDIUM, EXCEPTION-LOW, or SUCCESSFUL).

This summary displays information from any system reachable through the CAICCI communication network that is running at least one SYSVIEW XSSS (XSystem Session Server) task.
To sort the table, click a column heading.
The following table describes the column headings:
System The name of the system.
CPU Specifies the processor busy percentage from the operating system point of view. Processor types: ALL
LCPU Specifies the processor busy percentage from the LPAR point of view. Processor types: ALL
CP Specifies the processor busy percentage from the operating system point of view. Processor type: CP only
LCP Specifies the processor busy percentage from the LPAR point of view. Processor type: CP only
IFA Specifies the processor busy percentage from the operating system point of view. Processor type: IFA only
LIFA Specifies the processor busy percentage from the LPAR point of view. Processor type: IFA only
IIP Specifies the processor busy percentage from the operating system point of view. Processor type: IIP only
LIIP Specifies the processor busy percentage from the LPAR point of view. Processor type: IIP only
CPs The number of CP processors online.
IFAs The number of IFA processors online.
IIPs The number of IIP processors online.
Ready Specifies the number of tasks ready to be dispatched.
IORate Specifies the overall start I/O rate for the system, expressed as the number of start I/Os per second.
Paging Specifies the overall paging rate for the system, expressed as the number of pages per second.
Spool Indicates the percentage of spool space used. This percentage is in relation to the total number of spool track groups defined to JES2.
CSA The percentage of the Common Storage Area that is currently used.
ECSA The percentage of the Extended Common Storage Area that is currently used.
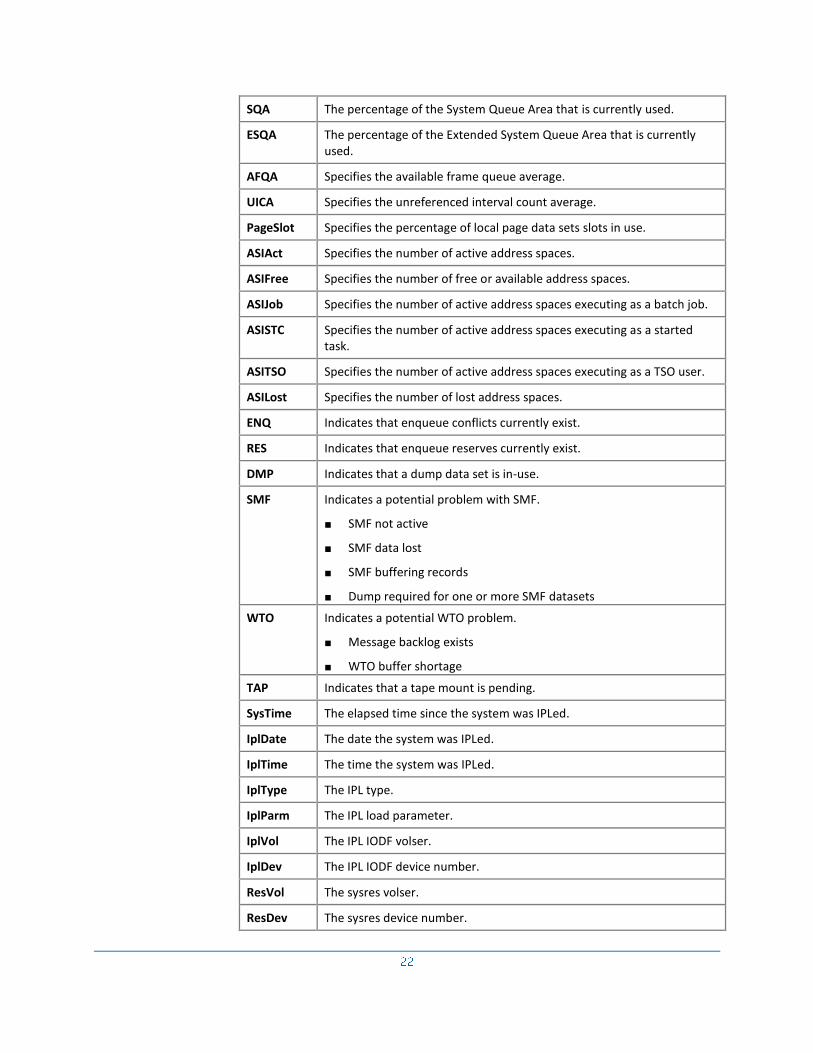
SQA The percentage of the System Queue Area that is currently used.
ESQA The percentage of the Extended System Queue Area that is currently used.
AFQA Specifies the available frame queue average.
UICA Specifies the unreferenced interval count average.
PageSlot Specifies the percentage of local page data sets slots in use.
ASIAct Specifies the number of active address spaces.
ASIFree Specifies the number of free or available address spaces.
ASIJob Specifies the number of active address spaces executing as a batch job.
ASISTC Specifies the number of active address spaces executing as a started task.
ASITSO Specifies the number of active address spaces executing as a TSO user.
ASILost Specifies the number of lost address spaces.
ENQ Indicates that enqueue conflicts currently exist.
RES Indicates that enqueue reserves currently exist.
DMP Indicates that a dump data set is in-use.
SMF Indicates a potential problem with SMF.
■ SMF not active
■ SMF data lost
■ SMF buffering records
■ Dump required for one or more SMF datasets
WTO Indicates a potential WTO problem.
■ Message backlog exists
■ WTO buffer shortage
TAP Indicates that a tape mount is pending.
SysTime The elapsed time since the system was IPLed.
IplDate The date the system was IPLed.
IplTime The time the system was IPLed.
IplType The IPL type.
IplParm The IPL load parameter.
IplVol The IPL IODF volser.
IplDev The IPL IODF device number.
ResVol The sysres volser.
ResDev The sysres device number.

RealStg The amount of real storage.
OsName The operating system name of the system.
OsLevel The operating system level of the system.
SpLevel The SP level of the operating system.
FMID The product FMID identifier.
NodeName The JES node name of the system.
PlexName The sysplex name if the system is a member of a sysplex.
LparName The LPAR name of the processor configuration. This field is blank if the processor is not in LPAR mode.
HdwrName The hardware name of the processor configuration.
VmUserId The VM user ID of the virtual machine of which this MVS image is a guest. This field is blank if the processor is not a guest under VM.
Description A description of the system. This text is taken from the SYSNAMES PARMLIB member.
Aliases A list of aliases for the system name. These aliases are taken from the SYSNAMES parmlib member.
Message A possible message describing a communication error that occurred while attempting to gather information from the system.
RowStat The overall or highest conditional status field displayed on the row.

Specify the RSS feature in the initialization parameters:
PPREF='PROD=RSS'
Enabling of the Alert RSS Feed is performed in the Interfaces - WebCenter Parameter Group. The WebCenter URL and port must be configured on the first page – this configuration is required for any WebCenter access, including RSS feed requests. The second page is SSL – this page may or may not exist depending on the configuration. The third page is the Smart Server RSS Feeds page:
By default, RSS Feeds is enabled automatically if WebCenter is enabled. Customize the RSS Feeds if different options are required. The SmartServer RSS Feeds panel is shown only if the RSS feature is supplied in the initialization parameters.
RSS Feeds can be globally enabled or disabled for all RSS Feeds (there is only one documented RSS Feed currently). After you globally enable the feeds, you can enable or disable individual RSS Feeds.
Parameters for the RSS Feed are FILTER and LIMIT. FILTER names the alert filter to be used, default SEV1. The alert filters are defined through the /ALFILT command.
LIMIT imposes an upper limit of alerts that are returned for an RSS Feed request, default 100.
The first page of the WebCenter parameter group specifies the URL of the Web Server. To retrieve alerts, append ‘/public/nmdata.rss?channel=ALERTS’. For example, the following URL returns ALERTS RSS Feed from your region:
http://199.999.99.99:38644/public/nmdata.rss?channel=alerts
As there is only one documented alert feed (channel=ALERTS), then this feed will default. A shorter URL suffices:
http://199.999.99.99:38644/public/nmdata.rss
Parameters FILTER and LIMIT can be overridden on the URL. For example, the following URL returns SEV2 alerts up to a limit of 200 entries:
http://199.999.99.11:38644/public/nmdata.rss?channel=alerts&filter=SEV2&limit=200
Either filter or limit or both can be overridden in this manner. If they are not specified, then the defaults as specified in the parameter group are used.
The channel can also be overridden.
The development was tested on Internet Explorer, Firefox, and Outlook Exchange – all these being Windows-based platforms. Displays have also been done on an IPAD xfeed app. All agents present differently.