performance characteristics of the high ... - chem-agilent… · sds-page and silver staining for...
TRANSCRIPT

Performance characteristics of the High Sensitivity Protein 250 assay for the Agilent 2100 bioanalyzer
Abstract
SDS-polyacrylamide gel electrophoresis (SDS-PAGE) separates proteins
according to their molecular weights. For highest sensitivity, gels are
commonly silver stained using a laborious procedure with low repro-
ducibility, which yields low reproducibility and insufficient quantification
capabilities. In this publication we demonstrate the performance of a
newly developed Agilent 2100 bioanalyzer method for protein detection
based on fluorescent labeling:
• High-sensitivity equivalent to or better than silver staining
• Linear dynamic range up to four orders of magnitude
• Impurity detection, including reliable quantification
• Fast, reproducible results
Technical Note
Monoclonal antibody Impurity detection
2.7 pg/µL 5.4 pg/µL 0.09 % 0.18 %
53kDa 59kDa
IgG
2886 pg/µL93.5 %
150 kDa
Agilent Equipment
• 2100 bioanalyzer • High Sensitivity Protein 250 kit
Application Area
• Protein electrophoresis

IntroductionThis publication describes the per-formance of a recently introducedassay for high sensitivity on-chipprotein sizing and quantification –the Agilent High SensitivityProtein 250 assay. It is a superioralternative to silver staining proto-cols. The new assay analyzes pro-teins from 10 to 250 kDa and isbased on the detection of fluores-cently labeled proteins that areseparated electrophoretically onmicrofluidic chips. It overcomesthe critical limitations of tradition-al silver staining of SDS-PAGEgels by providing a linear dynamicrange of four orders of magnitudecombined with excellent repro-ducibility. It extends the existingAgilent 2100 bioanalyzer proteinassay portfolio. The existingProtein 80 and Protein 230 assayscover different specific sizeranges, providing sensitivity com-parable to Coomassie stain and adifferent protocol.
ExperimentalMaterials and equipmentBovine Serum Albumin (BSA)Standard (Pierce, Rockford, IL,USA), 10 kDa ladder (Gibco-BRL),BenchMark ladder and NuPAGENOVEX 4-12 % Bis-Tris Mini Gels(Invitrogen, Carlsbad, CA, USA),Protein LoBind tubes (EppendorfGmbH, Hamburg, Germany),Dulbecco's Phosphate BufferedSaline (1X PBS) (LifeTechnologies GmbH, Karlsruhe,Germany), 2-D Clean-Up kit andPlusOne Silver Staining Kit (GEHealthcare, Freiburg, Germany),the monoclonal IgG was donatedby a biopharmaceutical company,
Agilent 2100 bioanalyzer, AgilentHigh Sensitivity Protein 250 kitand Agilent Protein 230 kit.
High Sensitivity Protein 250 assayThe chip-based separations wereperformed on the Agilent 2100 bio-analyzer in combination with theAgilent High Sensitivity Protein250 kit. A dedicated assay is avail-able within the Agilent 2100expert software (revision B.02.06or higher). If not stated otherwise,the labeling and on-chip elec-trophoresis was performedaccording to the kit guide1. The kitincludes 10 chips for 100 samples,labeling reagents (standard label-ing buffer, ethanolamine, DMSOand labeling dye), ladder andreagents for separation (gelmatrix, destaining solution andsample buffer) and user documen-tation (Quick Start Guide andLabeling Protocol).
Labeling reactionThe bovine serum albumin stock(2 mg/mL) was diluted to 0.1, 1.0,10, 100, and 1000 ng/µL in 1X standard labeling buffer in PBS.Multiple labeling reactions wereperformed for each BSA concen-tration. The 10 kDa ladder and theBenchMark ladder were purifiedwith the 2-D Clean-Up kit andresuspended in urea/thioureabuffer (30 mM Tris/HCl, 7 M urea,2 M thiourea, pH 8.5). Total pro-tein concentrations in the labelingreaction were 60 ng/µL for the 10 kDa ladder and 260 ng/µL forthe BenchMark ladder, accordingto the High Sensitivity Protein 250assay readout.
The labeling protocol encom-passed adding 0.5 µL fluorescentlabeling dye (lyophilisate, recon-stituted in DMSO) to 5 µL proteinsample or High Sensitivity Protein250 ladder and incubation on icefor 30 minutes. Any excess dyewas quenched by the addition of0.5 µL ethanolamine and 10 min-utes incubation on ice (see kitguide1 for further details.)
High sensitivity protein analysis withthe Agilent 2100 bioanalyzerThe labeled protein samples andthe ladder were analyzed using theAgilent 2100 bioanalyzer and theHigh Sensitivity Protein 250 assay.BSA samples labeled at a concen-tration of 1000 ng/µL were dilutedadditionally with distilled water(1:10, 1:100, 1:1000, 1:10000) andthese dilutions were then treatedin the same way as the otherlabeled samples (control series).Samples were diluted prior to on-chip analysis 1:200 with distilledwater as described in the protocol.To prepare labeled samples or ladder for on-chip analysis 2 µLsample buffer (in the absence orpresence of DTT as reducingagent) were added to a 4 µLaliquot. The mix was incubated at 95-100 °C for 5 minutes andapplied completely to the primedchip.
The labeling reaction and the dilu-tion step in water (5:6 for labelingand 1:200 for dilution) implicateda change in the concentration ofthe sample. The concentrationreported by the software refers tothe actual on-chip concentration,which is that prior to samplebuffer addition.
2

SDS-PAGE and silver stainingFor comparison, the HighSensitivity Protein 250 ladder wasanalyzed by SDS-PAGE/silverstaining and on the Agilent 2100bioanalyzer. SDS-PAGE was doneon precast NuPAGE NOVEX 4-12% Bis-Tris Mini gels according tothe supplier’s instructions. Gelswere stained using the PlusOneSilver Staining Kit.
Results and discussionDevelopment of this new assaysuccessfully implemented thestrategy of covalent labeling witha fluorescent dye and subsequenton-chip detection of labeled pro-teins as an application for theAgilent 2100 bioanalyzer. Theassay provides a linear dynamicrange of four orders of magnitudecombined with excellent repro-ducibility applicable for proteinsfrom 10 to 250 kDa and besidesthe detection of high concentra-tion proteins it is ideally suited fortwo general application areas:detection of minor impurities anddetection of lowest protein con-centrations. The Agilent HighSensitivity Protein 250 assay mea-sures protein size and relative con-centration. The results are avail-able in a digital format, such asgel-like images, a result table andelectropherograms.
The figure on the front page ofthis publication represents typicalresults for analysis of monoclonalantibodies (IgG) under non-reduc-ing conditions. Labeling was per-formed at 1 µg/µL. The major bandrepresents the intact antibody at150 kDa with a purity of 93 %.
Various smaller and larger impuri-ties could be quantified such as a53 kDa peak that might representa heavy chain fragment at a levelof 0.09 % of total protein.
The following sections show dif-ferent protein samples that wereanalyzed to verify the perfor-mance of the Agilent HighSensitivity Protein 250 assay withregard to sensitivity, linear dynam-ic range, sizing and quantification.
Linear Dynamic RangeTo determine the linear dynamicrange of the Agilent HighSensitivity Protein 250 assay, pro-tein samples containing 0.1, 1.0,10, 100, and 1000 ng/µL bovineserum albumin (BSA) were fluo-rescently labeled according to thestandard protocol. Multiple inde-pendent experiments were per-formed for each BSA concentra-tion to demonstrate the repro-ducibility of the labeling reaction.
For comparison, a control experi-ment was performed that exclud-ed any potential influence of thesample protein concentration inthe labeling step. For this controlseries the labeling reactions con-taining 1000 ng/µL BSA were dilut-ed with distilled water to therespective concentrations. Alllabeling and dilution series sam-ples, as well as the Agilent HighSensitivity Protein 250 ladderwere diluted 1:200 with distilledwater (corresponding to on-chipBSA concentrations of 0.4 pg/µL to4.2 ng/µL) and heat denaturedunder reducing conditions asdescribed in the standard protocolof the assay. The samples wereanalyzed on different chips, onfour different instruments and bytwo different users. Results fromthis experiment are shown inFigures 1 and 2 and Table 1.
Figure 1 demonstrates the lineari-ty of the Agilent High Sensitivity
R² = 0.995
R² = 0.999
0.1
1
10
100
1000
10000
0.1 1 10 100 1000 10000
Individual labelingControl series
Target concentration [pg/µL]
Rel
ativ
e co
ncen
trat
ion
[pg/
µL]
Figure 1Linear dynamic range of the High Sensitivity Protein 250 assay. Results from individual labelingreactions at various concentrations (filled circles) were compared to serial dilutions (empty cir-cles) starting at the highest concentration (n= 8-12 per concentration). The average relative BSAconcentration as determined by the Agilent High Sensitivity Protein 250 assay was plottedagainst the expected concentration. Standard deviations are indicated.
3
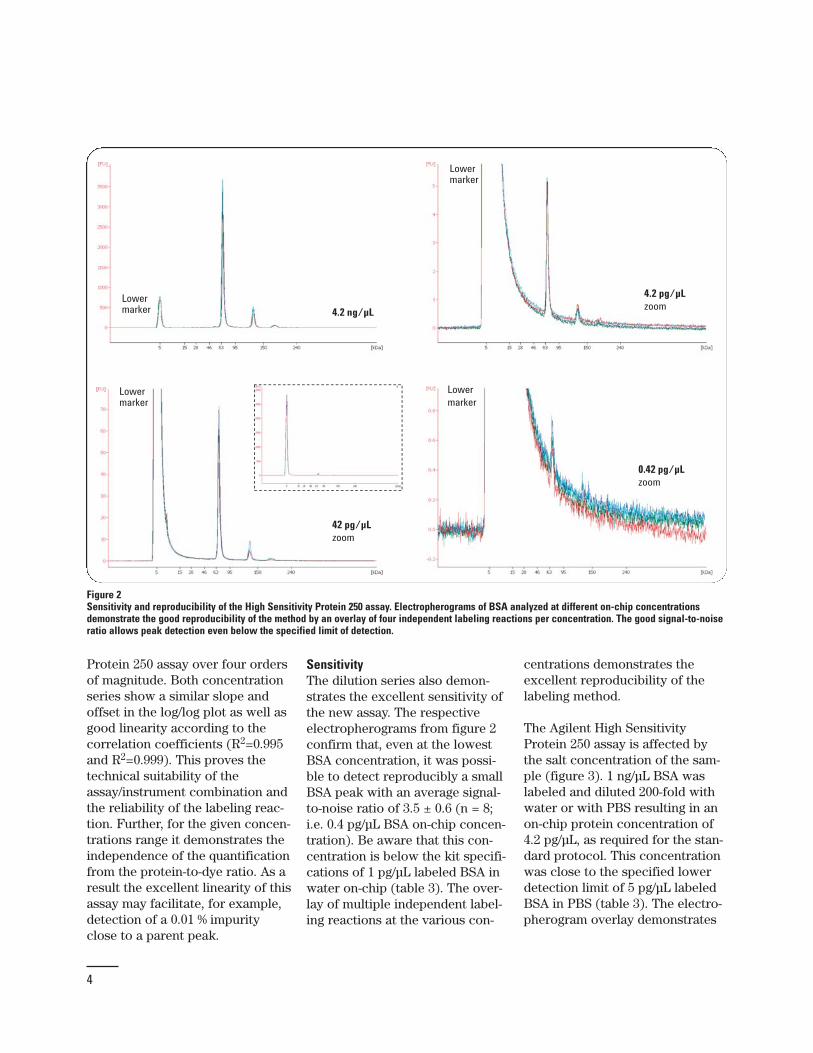
Protein 250 assay over four ordersof magnitude. Both concentrationseries show a similar slope andoffset in the log/log plot as well asgood linearity according to thecorrelation coefficients (R2=0.995and R2=0.999). This proves thetechnical suitability of theassay/instrument combination andthe reliability of the labeling reac-tion. Further, for the given concen-trations range it demonstrates theindependence of the quantificationfrom the protein-to-dye ratio. As aresult the excellent linearity of thisassay may facilitate, for example,detection of a 0.01 % impurityclose to a parent peak.
SensitivityThe dilution series also demon-strates the excellent sensitivity ofthe new assay. The respectiveelectropherograms from figure 2confirm that, even at the lowestBSA concentration, it was possi-ble to detect reproducibly a smallBSA peak with an average signal-to-noise ratio of 3.5 ± 0.6 (n = 8;i.e. 0.4 pg/µL BSA on-chip concen-tration). Be aware that this con-centration is below the kit specifi-cations of 1 pg/µL labeled BSA inwater on-chip (table 3). The over-lay of multiple independent label-ing reactions at the various con-
centrations demonstrates theexcellent reproducibility of thelabeling method.
The Agilent High SensitivityProtein 250 assay is affected bythe salt concentration of the sam-ple (figure 3). 1 ng/µL BSA waslabeled and diluted 200-fold withwater or with PBS resulting in anon-chip protein concentration of4.2 pg/µL, as required for the stan-dard protocol. This concentrationwas close to the specified lowerdetection limit of 5 pg/µL labeledBSA in PBS (table 3). The electro-pherogram overlay demonstrates
4.2 ng/µL
42 pg/µLzoom
0.42 pg/µLzoom
zoom
Lowermarker
Lowermarker
Lowermarker
Lowermarker
4.2 pg/µLzoom
4
Figure 2Sensitivity and reproducibility of the High Sensitivity Protein 250 assay. Electropherograms of BSA analyzed at different on-chip concentrationsdemonstrate the good reproducibility of the method by an overlay of four independent labeling reactions per concentration. The good signal-to-noiseratio allows peak detection even below the specified limit of detection.

the significantly decreased sensi-tivity for sample dilution in PBS,which contains salt, compared toa dilution with water. For condi-tions with PBS the amount ofinjected lower marker wasdecreased as well and a reducedbackground due to lower markertailing was found.
Since on-chip analysis uses elec-trokinetic injection, a competitionfor injection into the separationchannel exists between the nega-tively charged protein/SDSmicelles and salt ions. High saltconcentrations reduce the injec-tion efficiency of the protein/SDSmicelles and lower the assay sen-sitivity. The lower detection limitof the assay was therefore speci-fied to be 1 pg/µL labeled BSA inwater and 5 pg/µL labeled BSA inPBS with a signal-to-noise ratioabove 3 (table 3). As 4 µL proteinsample is required for proteindenaturation, this corresponds toa total protein amount of 4 pg BSAin water and 20 pg BSA in PBS.
Silver staining was introduced in1979 and since then has been con-tinually improved. It is a techniquethat provides a sensitive tool forprotein visualization with reporteddetection levels down to the 0.2-10 ng level2. The sensitivity ofprotein analysis using the AgilentHigh Sensitivity Protein 250 assaywas compared to the sensitivityobtained with SDS-PAGE followedby conventional silver staining(figure 4). The Agilent HighSensitivity Protein 250 ladder withseven different proteins ranging insize from 15 to 250 kDa was fluo-rescently labeled to allow on-chipanalysis with the Agilent 2100 bio-
Figure 3Analysis of labeled BSA in water or PBS. The on-chip BSA concentration was 4.2 pg/µL. Shownis an overlay of three electropherograms for each condition.
Lower marker
in PBS
in water
Lowermarker
zoom
Figure 4Comparison of the Agilent High Sensitivity Protein 250 assay and SDS-PAGE/silver stain. Analysisof the ladder provided with the kit with 4-12 % SDS-PAGE followed by silver stain and with theAgilent 2100 bioanalyzer at identical concentrations. The figure shows a scanned image of anSDS-PAGE gel and the gel-like image from the Agilent 2100 expert software.
Size[kDa]
250
150
100
70
50
30
15
98 49 24 12 6.0 3.0 1.5 0.7 59 29 15 7.3 3.7 1.8 0.9 0.5
250
150
100
70
50
3015
Size[kDa]
ng total protein loaded ng total protein loaded
5SDS-PAGE/silver stain 2100 bioanalyzer
5

analyzer. For a direct comparison,the labeled sample was run on 4-12% SDS-PAGE followed by sil-ver staining. Silver staining is notaffected by the applied label sinceless than 10 % of the proteinscarry the modification.
Two-fold serial dilutions of thelabeled ladder were prepared toobtain samples with 8 differentprotein concentrations (0.1 up to15 ng/µL) and 6.5 µL with a totalprotein amount of 0.7 to 98 ng pro-tein were loaded per well on theSDS-PAGE gel (figure 4). For com-parison, the protein analysis withthe 2100 bioanalyzer was per-formed with the same dilutions,but using 4 µL sample represent-ing 0.5 to 59 ng total protein.Using SDS-PAGE and silver stain-ing it was possible to detect allladder proteins down to the totalprotein amount of 6 ng (about 0.9 ng/µL). This corresponds toapproximately 0.9 ng protein perband. At this dilution the 250 kDaband is already very faint. At 3 ngtotal protein (about 0.5 ng/µL),none of the expected bandsappeared. In contrast, the Agilent2100 bioanalyzer facilitates detec-tion of the individual proteinbands with a signal-to-noise ratio above 20 down to a total protein amount of 0.5 ng (about0.13 ng/µL), which corresponds toapproximately 0.07 ng per proteinband. For this tested sample, theAgilent High Sensitivity Protein250 assay demonstrated an about 50-fold higher sensitivity com-pared to SDS-PAGE and silverstaining.
quantification reproducibility ofthe Agilent High SensitivityProtein 250 assay is specified tobe typically below 20 % CV for on-chip concentrations above 1 pg/µL (table 3).
Sizing range and resolutionThe 10 kDa and the BenchMarkladder were analyzed underreducing conditions with twoAgilent 2100 bioanalyzer assays,the Agilent High SensitivityProtein 250 and the AgilentProtein 230 assay4 (figure 5). The BenchMark ladder comprised15 recombinant proteins rangingin molecular weight from 10 to220 kDa. The 20 and 50 kDa pro-teins were more prominent foreasy orientation and to ensureproper identification of each pro-tein. The 10 kDa ladder contained13 recombinant proteins rangingin size from 10 to 200 kDa. The 50 kDa band was more prominentfor easier identification.
The sizing range of the AgilentHigh Sensitivity Protein 250 assayis extended compared to theAgilent Protein 230 assay. TheAgilent Protein 230 assay covers a size range from 14 to 230 kDa,whereas the Agilent High Sensi-tivity Protein 250 assay covers asize range from 10 to 250 kDa.The upper limit is 250 kDa, which
Quantification reproducibilityRelative concentrations are calcu-lated automatically by the Agilent2100 expert software. This calcu-lation is based on the total timecorrected area of the Agilent HighSensitivity Protein 250 ladder andthe area integrated under the sam-ple peak. Assuming equal labelingand injection efficiencies, the ruleof three can be applied on samplepeak areas to calculate concentra-tions. The known concentration ofthe ladder (4167 pg/µL on-chipconcentration, a customizable set-point) is taken into account asexternal quantification standardfrom the ladder lane. The Agilent2100 expert software also facili-tates absolute quantification basedon calibration with known sam-ples and other quantificationstrategies3.
Quantification results for relativequantification from figure 1 aresummarized in table 1. The quan-tification reproducibility for BSAfor on-chip concentrations largerthan 1 pg/µL was in average 17 %.Lowest concentrations such as0.42 pg/µL were below the speci-fied detection limit and yielded aCV above 20 %. This data includeday-to-day, instrument-to-instru-ment and user-to-user variabilityfor the labeling reaction and theon-chip analysis. For BSA the
6
Target Concentration [pg/µL]4200 420 42 4.2 0.42
CV (individual labeling) 11% 16% 14% 20% 26%CV (control series) 15% 16% 23% 17% 46%
Table 1The quantitation reproducibility was determined for the analysis of BSA samples that werelabeled at different concentrations (individual labeling) or from the control series.
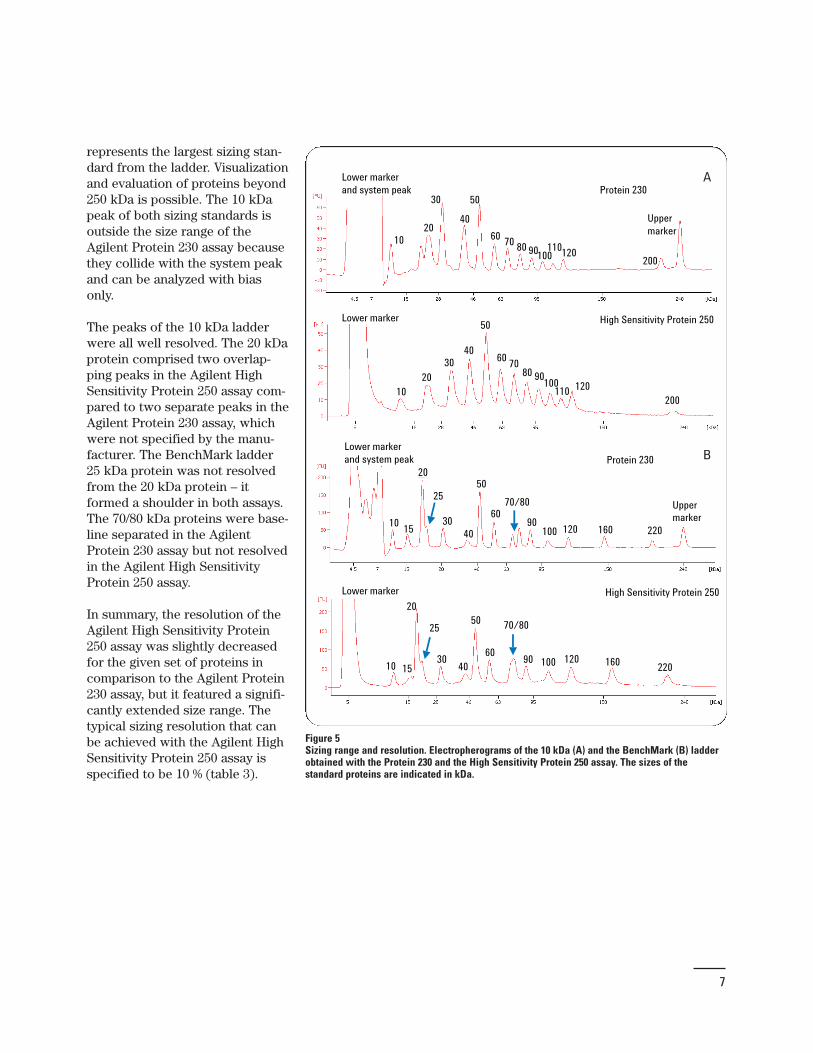
represents the largest sizing stan-dard from the ladder. Visualizationand evaluation of proteins beyond250 kDa is possible. The 10 kDapeak of both sizing standards isoutside the size range of theAgilent Protein 230 assay becausethey collide with the system peakand can be analyzed with biasonly.
The peaks of the 10 kDa ladderwere all well resolved. The 20 kDaprotein comprised two overlap-ping peaks in the Agilent HighSensitivity Protein 250 assay com-pared to two separate peaks in theAgilent Protein 230 assay, whichwere not specified by the manu-facturer. The BenchMark ladder 25 kDa protein was not resolvedfrom the 20 kDa protein – itformed a shoulder in both assays.The 70/80 kDa proteins were base-line separated in the AgilentProtein 230 assay but not resolvedin the Agilent High SensitivityProtein 250 assay.
In summary, the resolution of theAgilent High Sensitivity Protein250 assay was slightly decreasedfor the given set of proteins incomparison to the Agilent Protein230 assay, but it featured a signifi-cantly extended size range. Thetypical sizing resolution that canbe achieved with the Agilent HighSensitivity Protein 250 assay isspecified to be 10 % (table 3).
Figure 5Sizing range and resolution. Electropherograms of the 10 kDa (A) and the BenchMark (B) ladderobtained with the Protein 230 and the High Sensitivity Protein 250 assay. The sizes of the standard proteins are indicated in kDa.
1020
3040
50
6070
80 90100 120
200110
1020
30
40
50
60 70 80 90100 120200
110
Uppermarker
Lower marker and system peak
Lower marker
Lower marker
Protein 230
High Sensitivity Protein 250
1530
40
50
60
70/80
90 100 160 220120
20
25
1015
3040
50
6090
100 160 220120
20
25Uppermarker
High Sensitivity Protein 250
70/80
10
A
BProtein 230Lower marker and system peak
7

Sizing accuracy and reproducibilityThe Agilent High SensitivityProtein 250 ladder is run on eachchip from a designated ladderwell. Following the analysis of theladder the 2100 expert softwaregenerates a calibration curve ofthe migration time versus the mol-ecular weight of each protein con-tained in the ladder. This calibra-tion curve is then used to deter-mine the size of each protein inthe 10 samples. The lower markeris run with each of the samples foralignment in migration time andensures accurate sizing. It com-prises dye present in the samplebuffer and left over dye from thelabeling reaction. The 10 kDa andthe BenchMark ladder were ana-lyzed under reducing conditions.The sizing accuracy and repro-ducibility for both sizing standardswere determined under two condi-tions, dilution after labeling inwater or in PBS.
Table 2 summarizes the resultsfrom figure 6. It shows sizingaccuracy (% deviation from thetarget size) and the average sizingreproducibility (% CV), which ison average 1 % or below indepen-dently if water or PBS was usedfor dilution. The assay is specifiedto have a typical sizing repro-ducibility of 3 % CV or betterbased on BSA as sample. Theaverage sizing accuracy for the 10 kDa and the BenchMark ladderproteins was determined to bebelow 10 % deviation from theexpected size. The typical sizingaccuracy of the High SensitivityProtein 250 assay is specified with
8
Sample Diluent Sizing reproducibility Sizing accuracy% CV % Dev. from target
10 kDa ladder water 1.0 8.6PBS 1.1 8.8
BenchMark ladder water 0.6 5.5PBS 0.6 5.7
Table 2Average sizing reproducibility (% CV) and accuracy (% deviation from the target size) of theAgilent High Sensitivity Protein 250 assay with the 10 kDa and BenchMark ladder in water or inPBS.
Figure 6Sizing accuracy and reproducibility of the High Sensitivity Protein 250 assay. The 10 kDa (circles)and the BenchMark ladder (triangle) were analyzed in water (filled) or in PBS (empty). Deviationfrom target (A) refers to the manufacturers’ size statement. The % CV calculation (B) is from n = 4measurements. Assay specifications are based on BSA and represented by dashed lines.
0
5
10
15
20
25
30
0 50 100 150 200 250Target size [kDa]
% D
evia
tion
from
targ
et
0 .0
0 .5
1 .0
1 .5
2 .0
2 .5
3 .0
3 .5
4 .0
0 50 100 150 200 250Target size [kDa]
% C
V
A
B

sitivity equivalent or better thansilver staining. Further, it offersoutstanding quantification perfor-mance with a linear dynamicrange spanning four orders ofmagnitude enabling the analysis oflow level impurities, for example,for QA/QC applications.Automation of separation and dataanalysis makes the Agilent 2100bioanalyzer versatile and easy touse. In addition to protein analy-sis, the Agilent 2100 bioanalyzercan be used in combination with avariety of other kits for the analy-sis of cells, DNA and RNA sam-ples.
10 % CV for BSA as test sample. Ingeneral, the sizing accuracy of theon-chip electrophoresis or SDS-PAGE depends on the individualprotein characteristics and maytherefore vary for particular pro-teins, for example, glycosylatedproteins5. Some proteins may not migrate according to theirmolecular weight, depending oncharge or structure, for example.Nevertheless, for nearly all of the27 protein peaks analyzed the analytical specifications based onBSA apply as well.
ConclusionThe Agilent High SensitivityProtein 250 assay complementsthe existing Agilent 2100 bioana-lyzer protein assays. It is suitablefor detection, sizing and quantifi-cation of a broad range of samplesfrom protein expression, purifica-tion, or quality control applica-tions. The existing Agilent Protein80 and 230 assays are quick andeasy-to-use tools for analysis ofsmall and medium sized to largeproteins with a sensitivity equiva-lent to Coomassie staining. TheAgilent High Sensitivity Protein250 assay deploys an extra label-ing step prior to on-chip analysisand facilitates the analysis ofminute protein amounts with sen-
9
Labeling specific
Sample type Lysates, extracts, column fractions, purified proteins, lyophilized proteinsConcentration 1 ng/µL to 3 µg/µL total proteinVolume 5 µL per labeling reactionpH Value adjustment to pH 8.0 - 9.0Optimal matrix Standard labeling buffer, supplied with kitInterferences All components with primary amino or thiol groups
Separation and detection specific
Sizing range 10-250 kDaTypical sizing resolution 10 %, based on ladderTypical sizing accuracy 10 % CV (BSA)Sizing reproducibility 3 % CV (BSA)Quantitative range up to 4 orders of magnitude (0.3 to 3000 ng/µL BSA)Sensitivity 1 pg/µL labeled BSA in water on chip with labeling reaction performed
at 1 ng/µL total Protein; 5 pg/µL for labeled BSA in PBSQuantification reproducibility 20% CV BSA, for sample concentration greater 1 ng/µL labeled protein
Table 3Prerequisites for the labeling procedure and specifications for the analysis of labeled proteinswith the Agilent High Sensitivity Protein 250 assay
References1.“Agilent High Sensitivity Protein250 Kit Guide”, Agilent
Technologies Manual, reference
number G2938-90310.
2. Switzer, R.C., Merril, C.R., Shifrin,S., “A highly sensitive silver stainfor detecting proteins and pep-tides in polyacrylamide gels”, Anal
Biochem., 98(1), 231-7, 1979.
3.“Quantification Strategies with theHigh Sensitivity Protein 250Assay”, Agilent Technologies
Technical Note, publication num-
ber 5989-8941EN, 2008.
4.“Agilent Protein 230 Kit Guide”,Agilent Technologies Manual, ref-
erence number G2938-90052
5. “Glycoprotein sizing on theAgilent 2100 bioanalyzer”, Agilent Technologies Application
Note, publication number 5989-
0332EN
10

11

© 2008 Agilent Technologies, Inc.
Published July 1, 2008Publication Number 5989-8940EN
www.agilent.com/chem/labonachip