performance-based finance for drinking water security … · performance-based finance for drinking...
TRANSCRIPT

Performance-based finance for drinking water security in Africa
Financing water infrastructure for sustainable growth World Water Week, 30th August 2015
Rob Hope & colleagues, Oxford University
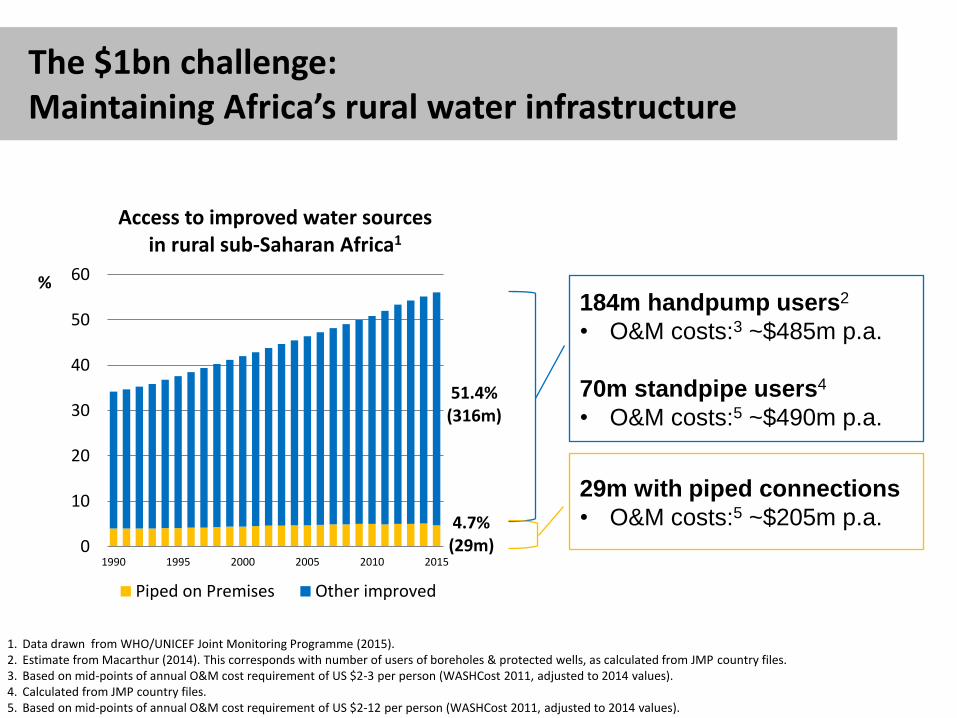
4.7% (29m)
51.4% (316m)
0
10
20
30
40
50
60
1990 1995 2000 2005 2010 2015
%
Access to improved water sources in rural sub-Saharan Africa1
Piped on Premises Other improved
The $1bn challenge: Maintaining Africa’s rural water infrastructure
1. Data drawn from WHO/UNICEF Joint Monitoring Programme (2015). 2. Estimate from Macarthur (2014). This corresponds with number of users of boreholes & protected wells, as calculated from JMP country files. 3. Based on mid-points of annual O&M cost requirement of US $2-3 per person (WASHCost 2011, adjusted to 2014 values). 4. Calculated from JMP country files. 5. Based on mid-points of annual O&M cost requirement of US $2-12 per person (WASHCost 2011, adjusted to 2014 values).
184m handpump users2
• O&M costs:3 ~$485m p.a.
70m standpipe users4
• O&M costs:5 ~$490m p.a.
29m with piped connections
• O&M costs:5 ~$205m p.a.

Community-based financing of O&M widely promoted in policies & assumed in finance plans
= country with rural water cost recovery policy or financing plan assuming O&M costs covered by household contributions
Uganda: “Various methods can be adopted for collection of funds
depending on the nature of the community”
Ghana: “The method of tariff collection… [is] the pay-as-you-fetch method at standpipes or pumps”
Malawi: “Collecting maintenance funds from
each user household”
Sierra Leone: “Tariffs… may take the form of levies, monthly payments per household or periodic
harvests”
Tanzania: “Communities will establish a mechanism to pay the
full costs of O&M and for higher service levels”
Zambia: “Contributions could be monthly, bi-annually or annually”
1. Based on information presented in Banerjee & Morella (2011) and GLAAS (2014). Banerjee & Morella (2011) listed countries with a rural water cost recovery strategy. GLAAS (2014) listed countries with a “financing plan [which] defines if operating and basic maintenance is to be covered by tariffs or household contributions“. Quotes taken from the following sources: Malawi Ministry of Irrigation and Water Development (2010), Tanzania Ministry of Water and Livestock Development (2002), Zambia Ministry of Local Government and Housing (2007), Uganda Ministry of Water and Environment (2011), Sierra Leone Ministry of Water Resources (2013), Ghana Community Water & Sanitation Agency (2011),
Some policies promote cost sharing for major repairs and rehabilitation

Mismatch between policy and reality Majority of waterpoints lack revenue collection
0 10 20 30 40 50 60 70 80 90
LiberiaZimbabwe
LesothoMalawiZambia
MaliSouth AfricaMadagascar
TanzaniaNigeria
Weighted averageKenya
Burkina FasoUganda
MozambiqueGhana
BotswanaSenegal
BeninNamibia
Cape Verde
Rural households paying for water (2008-09)1
1. n=17,515 (Afrobarometer, 2014). Available at: http://afrobarometer.org/data. 2. Piped scheme data obtained from Uganda Ministry of Water and Environment (2014), WASREB (2014), EWURA (2014). Analysis excludes waterpoints located in urban areas. Analysis based on publicly available waterpoint datasets (Virtual Kenya, 2015; National Water Sanitation and Hygiene Promotion Committee, 2014; Sierra Leone, STATWASH Portal; Government of Tanzania, 2014; Government of Uganda, 2012). For additional data see Waterpoint Data Exchange http://www.waterpointdata.org
0
10
20
30
40
50
60
70
80
90
100
Tanzania Kenya Uganda Liberia SierraLeone
Revenue collection rates2
Rural utility collection rate (piped schemes)
Standpipes/kiosks with revenue collection
Handpumps with revenue collection

Inadequate finance has major operational implications Non-functionality rate twice as high when no revenue collected
8%
22%
13%
24%
10%
16%
34%
25%
43%
26%
0%5%
10%15%20%25%30%35%40%45%
Kenya Liberia Sierra Leone Tanzania Uganda
Rural waterpoint non-functionality rates (n=183,149)1
With revenue collection Without revenue collection
1. Waterpoints analysed include standpipes, kiosks, handpumps and protected springs. Analysis excludes waterpoints located in urban areas. Data drawn from publicly available waterpoint datasets (Virtual Kenya, 2015; National Water Sanitation and Hygiene Promotion Committee, 2014; Sierra Leone, STATWASH Portal 2014; Government of Tanzania, 2014; Government of Uganda, 2012). For additional data see Waterpoint Data Exchange http://www.waterpointdata.org/
If SDG is to be achieved in rural Sub-Saharan Africa then financial sustainability must be addressed

Kitui County (2012-2022)
Kwale County (2013-2019)
Evidence from Kenya

Rainfall predicts improved water infrastructure demand - Kitui County (2013-15)
0
25
50
75
100
125
150 -
500
1,000
1,500
2,000
2,500
3,000
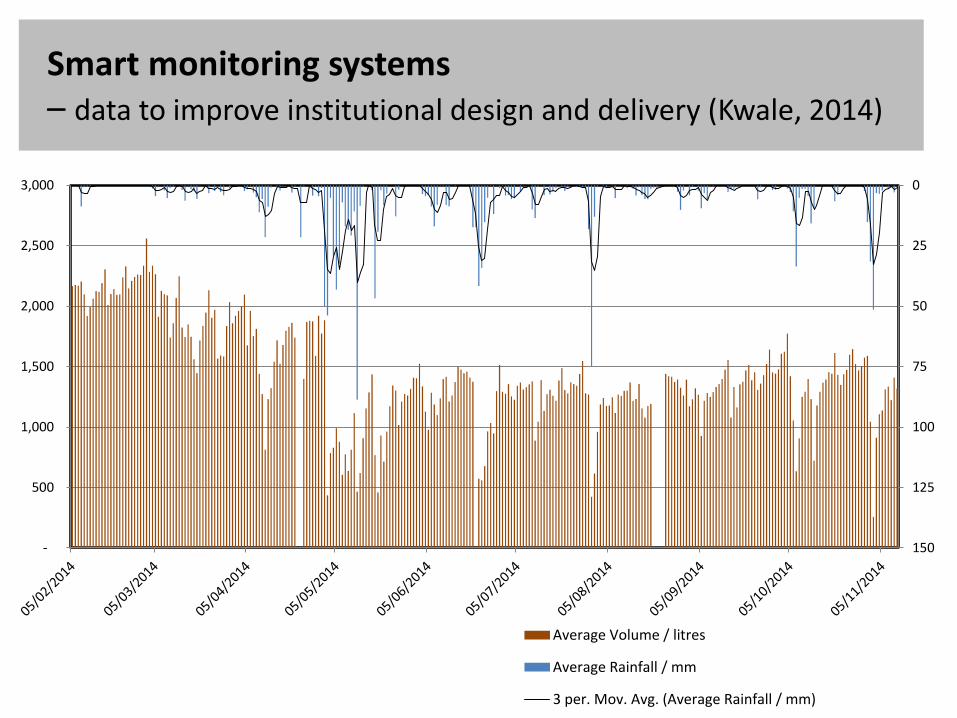
Average Volume / litres
Average Rainfall / mm
3 per. Mov. Avg. (Average Rainfall / mm)
Smart monitoring systems – data to improve institutional design and delivery (Kwale, 2014)

0
100
200
300
400
5000.0
0.5
1.0
1.5
2.0
2.5
Jan Feb Mar Apr May Jun Jul Aug Sep Oct Nov Dec
Rai
nfa
ll (m
m)
USD
pe
r d
ay
Revenue and expenditure by month
Average rainfall 2007-13 PAYF income
Fixed fee income Maintenance expenditure
All O&M expenditure
Pay-as-you-fetch: higher income and lower downtime Cash flows heavily influenced by rainfall (Kwale County)
13
35
36
Pay-as-you-fetch
Fixed fees
Ad hoc
Downtime by payment approach (days)

Foster & Hope, 2016
Data - 229 years of financial records from 100 handpumps with >50,000 payment records Predictors of payment: • Distance to waterpoint • Water quality (pH, taste) • Productive use • Seasonality
Late payment and non-
payment are prevalent
Payment behaviour a ‘socio-ecological’ response
PAYF – higher income, higher unimproved use
Multi-decadal analysis of payment records - Kwale County
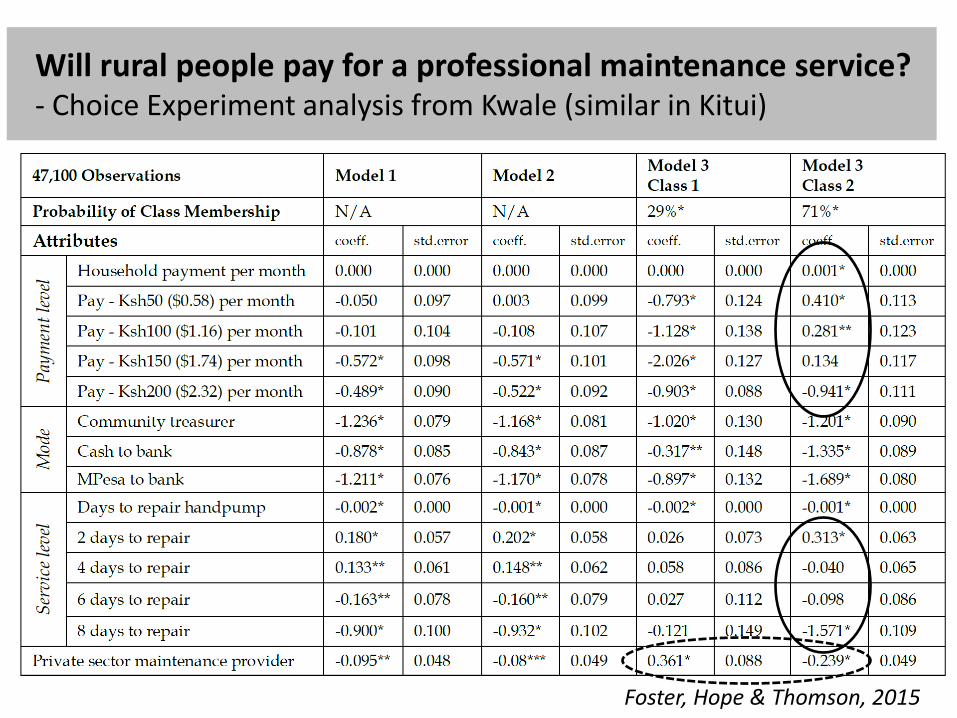
Will rural people pay for a professional maintenance service? - Choice Experiment analysis from Kwale (similar in Kitui)
Foster, Hope & Thomson, 2015

FundiFix Ltd. (Kwale) – a local enterprise to promote sustainability
Phase 1 – Maintenance system (14/15) • One year ‘free’ trial – control/treat. • 369 repairs for 213 treated pumps
over 12 months. • Ave. 1.7 repairs per pump per year. • Mean days to repair <3 days from >30
days • Hourly data on pump usage Phase 2 – Institutional design (16/17) • Community monthly fees to register
with FundiFix • Design of Water Services
Maintenance Fund blending user fees, county government and donors

Promising but sustainable? Communities pre-pay by MPESA with a guaranteed service or money back

Water Services Maintenance Trust Fund - Results-based finance (RBF) from users, government and investors
- Coordination at scale to reduce risks for communities, schools, clinics and local enterprise
Local bank Account #1 – Company cashflow Account #2 – Trust contributions
FundiFix Ltd.
Handpumps
Boreholes with kiosks
Piped systems
Regulator (WASREB)
Government (national, local)
Water Services Maintenance Trust Fund
User Payments $$
RBF $$
RBF $$ Performance
Metrics

• Sustainable finance critical to achieve universal drinking water security - Annual maintenance expenditure exceeds $1bn/pa
• Mismatch between policy and reality – Community-based financing but systematic revenue deficits
• Evidence from Kenya – Users pre-paying for professional service delivery (FundiFix Ltd.)
– Smart monitoring and data informs better design and delivery
– Legacy of past investment decisions limits future options
– Tension between universal delivery and financial sustainability
– Performance-based models: Water Services Maintenance Trust Fund
Summary

Papers, videos, blogs and more at: http://www.smithschool.ox.ac.uk/research-programmes/water-programme/ http://www.reachwater.org.uk/ http://www.oxwater.uk/ https://upgro.org/consortium/gro-for-good/ Join us at RWSN7 in Abidjan on Tuesday 29th November: https://rwsn7.net/