performance and management - office of personnel
TRANSCRIPT

83
PERFORMANCE AND MANAGEMENT


85
7. DELIVERING A HIGH-PERFORMANCE GOVERNMENT
The work of the Federal Government has a real effect on people’s lives – on small business-owners who need loans, on young people who want to go to college, on the men and women in our Armed Forces who need the best resources when in uniform and who, after they have served, deserve the benefits they earned. Whether protecting individuals and communities, modernizing infrastructure, investing in our children, or taking care of the most vulnerable, the American people deserve a highly effective government.
The Nation’s current fiscal situation makes it more im-portant than ever for government agencies to use taxpay-er money wisely to achieve more mission for the money. Building a government that works smarter, better, and more efficiently to deliver results for the American people is a cornerstone of this Administration. This chapter dis-cusses the Administration’s approach to improving the performance of the Federal Government, progress of this effort, challenges remaining, and the path forward.
Driving Federal Performance
We must use taxpayer dollars in the most effective and efficient ways we can, continually searching for smarter ways to serve the American people, businesses, and communities. A critical part of our effort is creating a culture of continual performance improvement where Federal agencies constantly strive to improve the quality of Americans’ lives and find lower-cost ways to achieve positive outcomes.
The Administration’s approach to delivering more ef-fective and efficient government is straightforward, and builds on a careful examination of best management prac-tices in the Federal Government, State and local govern-ments, other countries, and businesses (described in the President’s 2011 and 2012 Budgets). The Administration has built on these lessons learned, and the groundwork established by Congress and previous Administrations. This approach rests on three mutually reinforcing prac-tices. 1. Choose Areas of Focus and Clear Goals. Leaders
at all levels of the organization choose a limited number of areas of focus that have high potential to advance the well-being of the American people, cut the costs of delivery, or both. Where goals are likely to accelerate progress, leaders set clear, ambitious goals for outcome-focused and management priori-ties. For each area of focus, senior officials respon-sible for leading change are clearly identified and goals are clearly communicated to employees, deliv-ery partners, and the public.
2. Measure and Analyze Performance. Agencies measure, analyze, and discuss performance infor-
mation to reinforce priorities, motivate action, and illuminate a path to improvement. They analyze data to find problems to fix, successful practices to spread, and the root causes of both. Armed with this understanding, they take actions to achieve better outcomes and cut the costs of delivery. Agencies also communicate goals, measurements, progress, and strategies to enlist external ideas, expertise, and as-sistance to improve performance and boost account-ability.
3. Deliver Better Results with Frequent, Data-Driven Reviews. Leaders conduct frequent, in-depth performance reviews to drive progress on pri-orities. They review progress with those involved in implementation and adjust agency action quickly, as needed, to improve outcomes and reduce costs.
Progress on Agency Priorities
The Administration’s performance management ap-proach is fueling progress on performance and produc-tivity. Federal agencies are widely adopting these per-formance improvement practices and beginning to see changes on the ground. Leadership engagement, not just in goal-setting but in running frequent progress reviews to identify actions an agency can take to improve results, is on the rise across the Federal government. At the same time, agencies are learning how outcome-focused goals can help them break down organizational barriers, leading to better results than one agency can achieve on its own. As described in “Reducing Crime on Indian Reservations” on the following page, efforts at the Department of Interior to reduce crime on Indian reservations exemplify how these practices can coalesce to produce breakthrough per-formance.
Performance results like this are not limited to Interior; other agencies are also making great progress on their mission-focused priorities, some of which they identified as two-year Agency Priority Goals (introduced as High Priority Performance Goals) in the 2011 Budget.
Streamlining Student Loans and Strengthening Teacher Evaluation Systems
The Department of Education (Education) set a goal that all participating higher education institutions and loan servicers will be operationally ready to originate and service Federal Direct Student Loans through an efficient and effective student aid delivery system with simplified applications and minimal disruption to students. Within six months of the enactment of the Student Aid and Fiscal Responsibility Act (SAFRA), Education successfully moved to making students loans directly instead of hav-

86 ANALYTICAL PERSPECTIVES
ing third party lenders make them. This lending approach serves students better and, according to Congressional Budget Office estimates, will save taxpayers more than $60 billion over ten years. Education is also supporting and encouraging states to strengthen teacher evaluation systems given the evidence that teacher effectiveness con-tributes more to improving student academic outcomes
than any other school characteristic. Education has made considerable progress – forty-one states adopted such sys-tems over the last two years.
Improving Health and Well-Being
To improve not just the education of students but other aspects of their well-being, the Department of Agriculture
REDUCING CRIME ON INDIAN RESERVATIONS
High crime rates on some Indian reservations have long been a public concern, especially to the Native American community at large. The Department of the Interior’s (Interior) pilot program to reduce crime on Indian reservations demonstrates how transformative it can be when an agency adopts a goal that matters to a community, takes actions to address the problem, regularly measures and reviews relevant data to see if change is happening, and engages the local community in every as-pect of the effort. To seek solutions to this long-standing issue – but given tough constrains on its budget – Interior started a pilot program to test and identify effective crime reduction strategies on Indian lands. In the 2011 Budget, Interior set an agency High Priority Performance Goal to reduce crime by at least 5 percent on four reservations with some of the highest crime rates.
When this goal was set, most considered it ambitious; Interior had never before adopted a crime reduction goal and does not control many of the factors that affect the crime rate. Nevertheless, by the end of 2011, the initiative far exceeded its goal, reducing violent crime, on average, by a remarkable 35 percent across all four reservations, with crime going down on three of the four.
The importance and resonance of the goal won the cooperation of law enforcement partners and the enthusiasm of the local communities. This enabled a comprehensive strategy that involved community policing, tactical deployment, and inter-agency and intergovernmental partnerships between the Federal Bureau of Investigations (FBI), Department of Justice (DOJ), and the tribal police departments. The number of Indian country and DOJ officers on the ground was doubled and the number of law enforcement officers who received basic training increased ten-fold. Interior also supported officer-initiated programs to help victims and their families along with programs to strengthen community relationships with law enforce-ment. Community-launched innovations also played a role, such as an initiative on Rocky Boy’s Reservation in Montana to reduce juvenile delinquency and criminal behavior.
Recognizing the importance of fresh and actionable data, Interior has now established a computer-aided system to help analyze crime data, identify crime trends, and report criminal offenses. These data and trend analyses were used to allocate resources and to evaluate law enforcement and community policing strategies.
The results strongly affirm the value of a data-based, goal-oriented approach that empowers local officials to drive change. In the next two years, Interior is seeking to spread this success, starting with a replication demonstration at two new reserva-tions, while continuing efforts on the original four reservations.
448
400
290
2007-2009 Annual Average 2010 20110
100
200
300
400
500
Chart 7-1. Safe Indian Communities Priority GoalNumber of Violent Crimes
Incidents in Rocky Boy, Mescalero, Standing Rock,
and Wind RiverIndian Reservations
Down 11%
Down 35%
Beginning of 2010 Priority Goal Initiative -- October 2009

7. DELIVERING HIGH-PERFORMANCE GOVERNMENT 87
(USDA) set a goal to partner with local schools, propose national standards, and take other actions that will re-sult in improved quality of food sold in schools through-out the school day. Since 2009, USDA has signed up over 1600 more schools for its Healthier US School Challenge, a program that certifies schools as meeting rigorous qual-ity standards for the food they offer. In addition, toward its goal of improving the availability and accessibility of health insurance coverage by increasing enrollment of eligible children in Children’s Health Insurance Program (CHIP) by 9 percent over the 2008 baseline and increas-ing enrollment of eligible children in Medicaid by 11 per-cent over the 2008 baseline by the end of FY 2011, the Department of Health and Human Services (HHS) en-rolled an additional 4.8 million children in the CHIP and Medicaid from 2008 to 2010, thus providing greater ac-cess to health care.
Agencies are working to improve the well-being of adults, as well. To save lives and tens of billions of dol-lars in Medicare and Medicaid costs, HHS launched the Partnership for Patients and set a new Priority Goal to reduce the rate of hospital acquired conditions and hospi-tal readmissions. More than 3,100 hospitals and nearly 3,500 other partners, such as physician, nurses groups, and employers, have already joined this initiative. HHS has adopted a 2012-2013 Priority Goal focusing on reduc-ing hospital associated infections reflecting this effort. Working in conjunction with the Interagency Council on Homelessness, the Departments of Veterans Affairs (VA) and Housing and Urban Development (HUD) set a goal to reduce the population of homeless veterans to 59,000 by June 2012, and have reduced the population of home-less veterans from 75,609 in January 2009 to 67,495 in January 2011. Building upon this progress, VA and HUD set a Priority Goal to house another 24,400 Veterans by the end of 2013 on the way to eliminating veteran home-lessness by 2015.
Energy Savings for Low-Income Families and Clean Energy Production
The Department of Energy (Energy) and the Department of Housing and Urban Development (HUD) set a joint goal to enable the cost-effective energy retrofits of 1.2 million housing units by the end of 2013. By sup-porting energy conservation in over 750,000 homes of low-er income and middle class families, Energy has already helped reduce energy costs, on average, by over $400 per home each year. These changes have reduced the over-all annual energy consumption by 20 percent for these homes, but also cut annual greenhouse gas emissions nearly 2.0 million metric tons. HUD similarly reduced energy consumption at 120,000 HUD-assisted housing units. Energy, in the same period, has invested in reduc-ing the cost of batteries for electric drive vehicles to help increase the market for Plug-In Hybrids and All-Electric Vehicles.
Not surprisingly, because agencies were asked to set stretch targets to reach higher levels of performance, agencies did not attain every Priority Goal. In fact, if ev-ery target had been met it would indicate that the goals
were insufficiently ambitious - not bold enough to spur the sort of innovation and focus associated with challenging but realistic targets. The experience of Interior on its en-ergy goal illustrates not just the performance-improving power of a stretch target but also of the Administration’s emphasis on performance progress, rather than goal at-tainment for its own sake, to create a healthy perfor-mance-improving dynamic across the Federal govern-ment. Interior set a goal to authorize 9000 megawatts of solar, wind, and geothermal energy projects by the end of 2011. It did not reach its target, but did approve more than 6,000 megawatts of new renewable energy capacity on Interior land – enough to power, when fully developed, more than 1 million homes. Prior to setting this goal in October 2009, Interior had approved only a small number of projects like this. It had a slower than expected start-up because it had to move along a learning curve, yet by setting a stretch goal in this area Interior was highly successful - permitting more than 6,000 megawatts in 2 years. To continue progress in this area, Interior set a new Priority Goal to increase the approved capacity for production of renewable energy resources to 11,000 mega-watts by the end of 2013.
Strengthening Small and Medium-Sized Businesses
The Small Business Administration (SBA) increased small business access to capital by growing the number of active lending partners and bringing 1,200 new or re-turning lenders into the 7(a) loan program. Loans ap-proved by active lenders reached nearly $20 million in 2011, up from $12 million in 2010 and $9 million in 2009. The Department of Commerce (Commerce) increased the number of small and medium-sized enterprises that en-tered a 2nd or additional market, not quite reaching its 2011 target but nonetheless up 20% between 2009 to 2011 (over 3000 businesses in 2011) despite staffing decreas-es and modest global economic growth in that period. Commerce has adopted a new 2012-2013 Priority Goal to expand its export activity, one of many strategies outlined in the National Export Initiative (NEI) report that con-tribute to the President’s directive to double U.S. exports by 2014, a new Cross-Agency Priority Goal.
Improving Water Quality and Aquatic Health
Commerce has also worked closely with Regional Fishery Management Councils (RFMCs) to end and pre-vent overfishing. The agency set a goal to reduce the number of stocks subject to overfishing to zero by the end of 2011; improve the Fish Stock Sustainability Index (FSSI) to 586 by the end of 2011; and ensure that all 46 Federal fishery management plans have required catch limits to end overfishing in place by the end of 2011. By the end of December 2011, all stocks subject to over-fishing had annual catch limits in place, and the Fish Stock Sustainability Index rose from 565.5 (in 2009) to 598.5. At the same time, the effort to ensure all Fishery Management Plans have annual catch limits is moving forward at a steady pace. Forty Fishery Management Plans have been completed as of December 31, 2011 and

88 ANALYTICAL PERSPECTIVES
six will be completed in time to be effective for the respec-tive 2012 fishing years.
In other agency efforts related to aquatic health, the Corps of Engineers completed 27 projects restoring over 12,000 acres of aquatic habitat, most of it to improve the Upper Mississippi River, surpassing its goal of 10,300 acres. In a separate effort to improve the health of the Nation’s waters, the Environmental Protection Agency (EPA) focused approximately 60% of its water quality en-forcement actions on facilities discharging to waters that do not meet water quality standards, up from 32 percent in 2009 and well above the agency’s goal of at least 37 per-cent. This resulted in reductions in harmful discharges from 195 facilities into these waters.
National Security
One of the Department of State’s goals is to improve global controls to prevent the spread of nuclear weapons and enable the secure, peaceful use of nuclear energy. The 2010 Nuclear Security Summit moved the U.S. closer to this goal by strengthening international cooperation to control weapons-usable nuclear materials and prevent nuclear terrorism - actions critical to our own national security. Attending states pledged specific national ac-tions to prevent terrorists, criminals, and proliferators from acquiring nuclear materials, ranging from ratifica-tion of a convention to extremely complicated steps con-verting reactors from the use of highly-enriched to low-enriched uranium. The number of countries ratifying the Amendment to the Convention on Physical Protection of Nuclear Materials (CPPNM) is now at 52, up from 20 at the end of 2008.
Improving Customer Service and Saving Taxpayer Dollars
Both the Department of the Treasury (Treasury) and the Social Security Administration (SSA) are making it easier for their customers, while saving taxpayer dollars. Treasury has saved over $63.9 million by encouraging taxpayers to file electronically - increasing the electronic filing rate for individual tax returns to 76.9 percent in the 2011 season, up from 66 percent in 2009. SSA increased online retirement benefit applications from single digits in most prior years to the highest usage ever - 41 percent in FY 2011. These online services reduce the time em-ployees spend handling applications, which frees them to handle other work. SSA has achieved this success while maintaining high customer satisfaction. The online claim application is one of three SSA electronic services that consistently tops the American Customer Satisfaction Index survey, rating higher than popular private sector electronic services.
Despite this progress, some agencies did not meet their goals because of fiscal pressures. While the Priority Goals were intended to be budget neutral, they were not budget independent. For example, in the President’s 2011 Budget the Social Security Administration had a target for com-pleting 3.409 million initial disability claims. However, Congress appropriated $1 billion less than the President requested and the agency could not complete all of the
work related to their disability programs. To compensate for this, SSA decreased its target for the number of initial disability claims completed to 3.273 million. The agen-cy was able to leverage technology to identify and fast-track the most severe disability claims. From October 2010 through June 2011, the agency fast-tracked over 108,000 initial disability cases, or 4.6 percent of all dis-ability claims filed through the two fast-track processes. Learning from this experience, SSA continues to refine the predictive model and selection software to maximize capacity and accurately identify these cases.
More complete performance updates on the 2010-2011 Agency Priority Goals and other agency performance goals for the 15 Cabinet agencies and nine other large departments can be found at each agency’s Performance.gov home page (click on the annual performance plans and reports button or access all 24 agency plans and re-ports at http://my-goals.performance.gov/agency/plans). Updates on government-wide management priorities es-tablished under the Accountable Government Initiative can also be found at Performance.gov under the Area of Focus tabs.
Building a Culture of Continual Performance Improvement
Agency heads have charged their leadership teams with transforming the way their agencies use goals, mea-surement, analysis, and data-driven discussions to drive performance improvements. This transformation is in-creasingly evident. As discussed above, agencies are using goals not just as words on the pages of reports required by Congress or OMB, but instead as simple, powerful tools for communicating priorities and focusing agency action. Complementing progress on the Agency Priority Goals, this budget continues efforts to integrate performance more directly into the use of traditional government tools such as grants. Race to the Top grants, for example, are being used to enlist state and local education leaders willing to commit to rigorous standards and high-quality assessments, build better data systems to inform deci-sions and improve instruction, attract and retain great teachers, and adopt the most promising evidence-based practices to turn-around the lowest performing schools. Similarly, HHS has established stronger performance ex-pectations for its early childhood grants, requiring Head Start grantees that fail to meet rigorous benchmarks to re-compete for continued Federal funding to help children from low-income families achieve their full potential.
As discussed in AP Chapter 8: Program Evaluation and Data Analytics, a number of agencies have begun to use tiered grant-funding to encourage state, local, and not-for-profit delivery partners to improve performance in three complementary ways: scale, validate, and develop. Scale-up grants promote adoption of effective practices identified through objectives searches of the evidence and experience. Validation grants support replication demonstrations before scale-up to test if practices effec-tive in one location or situation can be replicated in oth-ers. Smaller grants support development and testing of

7. DELIVERING HIGH-PERFORMANCE GOVERNMENT 89
new high-potential practices. In addition, the President’s Budget proposes Pay for Success pilots.
Looking Forward
Over the next year, the Administration will continue to build upon these efforts to deliver more value for the tax-payer’s dollar. It will continue to strengthen its approach of using goals to communicate priorities, focus agency ac-tions on innovative solutions, support cross-agency col-laboration, and enlist external ideas and assistance. The Administration will continue to measure and analyze to find lower cost ways to deliver more mission for the mon-ey. It will set ambitious goals to stimulate innovation and motivate effort, and communicate progress and strategies to boost accountability to the public. Increasingly, it will reach out to field employees, other offices, other agencies, and delivery partners to engage them in regular data-driven reviews to find smarter ways to accomplish prior-ity objectives. And, it will strengthen networks, within and beyond government, to tackle common problems and pursue shared areas of opportunity.
Agency Priority Goals
Major Federal agencies have set near-term Agency Priority Goals for 2012-2013, which are a subset of agen-cies’ broader goals and objectives. Over half of the agency goals, such as Interior’s goal to permit renewable energy on Interior land, continue Agency Priority Goals set with the 2011 Budget, but update the targets. Other goals ad-dress a problem tackled with a 2010-2011 goal, but frame the goals in ways more likely to accelerate progress. For example, an HHS goal expands from tracking the per-centage of Recovery Act funded communities that adopt smoke-free policies to a goal to reduce nation-wide ciga-rette consumption per capita. Still other goals expand into areas previously untouched by previous Agency Priority Goals, such as the Commerce Department’s weather-fore-casting goal.
The full list of Agency Priority Goals can be found at www.Goals.Performance.gov and are sortable by agency and by theme. Agency Priority Goals are presented this year in the context of agency strategic goals and objec-tives to show how Agency Priority Goals fit within the context of agencies’ longer term strategic goals, and each agency’s full set of performance objectives. In addition, to make the goals more understandable to the public, each goal includes an “Impact Statement” that describes gen-erally what the goal is trying to accomplish, paired with a time-specific target to guide agency action.
Cross-Agency Priority Goals
In addition, the Administration has adopted interim Cross-Agency Priority (CAP) Goals. This Administration, Congress, the U.S. Government Accountability Office (GAO), and others have long recognized that government often tackles problems in stove-piped or fragmented ways that can prevent problems from being effectively ad-dressed. To enhance progress in areas needing more cross-government collaboration, the GPRA Modernization Act
requires OMB to establish a limited number of CAP Goals for both crosscutting policy and government-wide man-agement areas. The goals are to be revised or updated at least every four years, starting with the 2015 Budget. At the same time, the law instructs the Administration to set interim CAP goals concurrent with the 2013 Budget.
To develop the interim CAP Goals, OMB and the Performance Improvement Council worked with se-nior policy officials and agencies, and consulted with Congress. GAO studies were also considered in selecting CAP Goals. Emphasis was placed on choosing goals that reflect Presidential priorities and where increased cross-agency coordination and regular review are expected to speed progress. The limited number of interim CAP Goals therefore reflect a subset of Presidential priorities and op-portunities for increased cross-agency collaboration. CAP Goals are complemented by other cross-agency coordina-tion and goal-setting efforts, such as those of the Federal Food Safety Working Group and the Office of National Drug Control Policy (ONDCP). ONDCP has established government-wide goals and measurements to combat the public health and safety consequences of drug use, and coordinates inter-agency efforts to cut drug use among youth by 15 percent, drug-induced deaths and drug-re-lated morbidity by 15 percent, and drugged driving by 10 percent in five years. The National Drug Control Strategy is available at http://www.whitehouse.gov/ondcp/2011-national-drug-control-strategy. The Federal Food Safety Working Group issued an update on its progress since its March 2009 formation at http://www.whitehouse.gov/sites/default/files/fswg_report_final.pdf.
The Administration set interim CAP Goals in the fol-lowing areas:
• Science, Technology, Engineering, and Math (STEM) Education
• Veterans Career Readiness • Broadband • Entrepreneurship and Small Businesses • Energy Efficiency• Exports• Job Training • Cybersecurity • Sustainability • Financial Management • Human Capital Management • Information Technology Management• Procurement and Acquisition Management• Real Property ManagementThe interim CAP Goals can be found at www.Goals.
Performance.gov. The website, which comprises the Federal performance plan, is the beginning of a broader transition to providing the public more dynamic, useful, and current performance information. Progress on each Priority Goal will be published through a central website starting in the fall of 2012.
Frequent Data-Driven Reviews
For each Agency Priority Goal, the agency head or Chief Operating Officer (COO), often the Deputy Secretary, will continue running data-driven performance reviews

90 ANALYTICAL PERSPECTIVES
on their Priority Goals at least once a quarter. Some COOs also run quarterly performance reviews with their Departmental components - agencies, bureaus, or pro-grams. At the same time, leaders of individual compo-nents, such as the heads of the FBI, Customs and Border Patrol, Federal Emergency Management Agency, and the Food and Drug Administration, are running their own fre-quent data-driven reviews. OMB, with support from the Performance Improvement Council, will initiate progress reviews on CAP Goals later this year.
Producing Results for the American People
In the coming year, the Administration will continue to develop tools and offer services to strengthen agency performance improvement capacity and to foster inter-agency networks to facilitate expertise and data shar-ing, co-investment, and learning. It will strengthen a working group begun in 2011 to help agencies improve and benchmark their data-driven progress reviews. The Administration will continue to foster inter-agency net-works, such as the Benefits Processing Working Group,
launched in 2010, and will also work to launch additional networks to develop measures for other common govern-ment functions, such as reducing the number of undesir-able incidents and their associated costs. Additionally, the Administration will develop training opportunities and career pathways to strengthen performance improve-ment skills and capacity across the Federal government.
The Administration is strongly committed to respond-ing to the President’s charge to deliver a government that works, a government that is smarter, leaner, and more ef-fective, one that produces tangible results all around us – in a small business opening its doors, more homes becom-ing energy-efficient, new wind turbines generating clean renewable energy, healthier children, better served vet-erans, and falling crime rates. Leadership engagement, clear goals, measurement, analysis of progress, and fre-quent progress reviews to find and promote what works and fix or eliminate what does not are keys to fulfilling that commitment to improve the lives of the American people.

91
8. PROGRAM EVALUATION AND DATA ANALYTICS
The Administration is committed to using taxpayer dollars efficiently and effectively. Central to that com-mitment is a culture where agencies constantly ask, and try to answer, questions that help them find, implement, spread, and sustain effective programs and practices; find and fix or eliminate ineffective ones; test promising pro-grams and practices to see if they are effective and can be replicated; and find lower-cost ways to achieve posi-tive impacts. The Federal fiscal situation necessitates doing more with less, not only to reduce budget deficits, but also to build confidence that Americans are receiving maximum value for their hard-earned tax dollars. It is therefore critical to apply an evidence-based approach to government management that utilizes rigorous methods appropriate to the situation, learns from experience, and is open to experimentation. This application requires se-lecting and implementing promising policies, programs, and strategies, monitoring of their implementation, eval-uating their effectiveness, and adapting them over time to meet emerging challenges informed by ongoing measures of the well-being of Americans and the Nation.
One of the challenges to evidence-based policy-making is that it is sometimes hard to say whether a program is working well or not. Historically, evaluations have been an afterthought when programs are designed, and once a program has been in place for a while, building a constitu-ency for rigorous evaluation is hard. Further, the use of data and evaluation on an ongoing basis to manage and improve programs is rare. The Administration is commit-ted to addressing this problem.
This Administration is strongly encouraging appropri-ately rigorous evaluations and data analytics to deter-mine the impact of programs and practices on outcomes, complementing the performance measurement and man-agement practices described in chapter 7, “Delivering a High-Performance Government”, in this volume. In many policy debates, stakeholders come to the table with deep disagreements about the effectiveness or ineffectiveness of particular interventions. Evaluations that are suffi-ciently rigorous, relatively straightforward, and free from political interference are especially valuable in such cir-cumstances.
Evaluations do what performance measurement, alone, cannot. Evaluations determine whether programs pro-duce outcomes superior to alternative policy choices, or not putting into place a policy at all. This is in contrast with performance measurement, which tracks implemen-tation and progress toward intended program outcomes, but typically does not compare outcomes to alternative programs or the status quo. If a particular job training approach has a high job placement rate, is it because it is effective or because it attracts those easiest to place in jobs? An evaluation would compare the employment of
participants in the job training program to comparable individuals who did not participate in the program in or-der to isolate the effects of the training from other fac-tors. Evaluations can answer a wide-range of germane questions such as whether workers are safer in facilities that are inspected more frequently, whether one option for turning around a low-performing school is more ef-fective than another, whether outcomes for families are substantially improved in neighborhoods that receive in-tensive services, whether no-fee debit cards increase sav-ings among the unbanked, and whether re-employment services are cost-effective.
Evaluation is one component of the evidence infra-structure that plays a role in a wide range of decision-making. The best government programs embrace a cul-ture where broad statistical data series, performance and other measurement, evaluation, and other data analytics are regularly used and complement one another. Agencies use broad statistical data series to understand social and economic conditions of the populations to be served, and to inform the design of new or revised policies. They use performance measurement to monitor the implementa-tion of their policies, to detect promising practices for improving performance and to identify challenges. They use descriptive evidence about program recipients, pro-gram stakeholders, and community conditions to target their resources more precisely to areas of high need and opportunity. Regression analyses of administrative data can, for example, shed light on how to better match re-cipients with appropriate services. Rigorous evaluations using experimental or quasi-experimental methods iden-tify the effects of programs in situations where doing so is difficult using other methods; and rigorous qualitative evidence complements what can be learned from quanti-tative evidence and provides greater insight into how pro-grams and practices can be implemented more and less successfully.
Developing and supporting the use of data and evalua-tion in decision-making requires a coordinated effort be-tween those charged with managing the operations of a program and those responsible for using data and evalua-tion to understand a program’s effectiveness. It requires consistent messages from multiple leaders in an agency to ensure that evidence is valued, collected or built, ana-lyzed, understood, and appropriately acted upon. No one individual in an agency has the knowledge and skills nec-essary to develop research designs that address action-able questions, understand different types of evidence, interpret evidence, and develop and implement effective, evidence-based practices. Rather, it takes a leadership team, at the agency level, to oversee these efforts and to build and sustain a culture of learning. Complementing this team with a team of “implementers” at the program

92 ANALYTICAL PERSPECTIVES
level encourages the use of evidence and data so that it will filter down into program management.
Who is on these teams and how their work is divided depends upon the specific needs, personnel, and struc-ture of a given agency. Success of these teams depends on including leadership at the agency and bureau level capable of supporting and requiring programs’ use of data and evaluation in program operations. This leadership team, working together with OMB and Congress, can make sure that the right questions are being asked about the program’s effectiveness and its operations. Program managers are responsible for creating a culture where all operational decisions and internal and external commu-nications of progress are based on evidence and data. In order to do so, the program managers need a team of both data analysts and evaluators. These individuals can pro-vide the data and analysis packaged in a way that helps inform the program’s operational and policy decisions, including understanding the different types of evidence available and its implications for decisions, as well as identifying the need for new descriptive data and evalu-ation studies.
The Administration and Congress have made consid-erable progress in making Federal decision-making more based in data and evidence. Chapter 7, “Delivering a High-Performance Government”, in this volume discusses how Administration efforts are helping focus agencies on setting high-priority goals and measuring their progress on those goals.
In the area of evaluation, the Administration has moved to adopt a multi-tiered approach to evidence-based funding for new grant-based initiatives targeted towards education interventions, teenage pregnancy prevention, social innovations, home visitations for new parents, work-force interventions, and science, technology, engineering, and math programs. The initiatives offer the most fund-ing to programs and practices supported by the strongest evidence. Programs with some, but not as much, support-ive evidence also receive significant funding, the condi-tion that the programs will be rigorously evaluated going forward. Over time, the Administration anticipates that some second-tier programs will move to the first tier as they prove more promising and cost-effective than other programs. Finally, agencies are encouraged to innovate and test ideas with strong potential—ideas supported by preliminary research findings or reasonable hypotheses. At all levels, it is important to build implementation evi-dence into this multi-tiered approach so that we under-stand how best to scale successful programs and to create more and better program options.
A good example of this approach—in which new or expanded programs have evaluation “baked into their DNA”—is the Department of Education’s Invest in Innovation Fund (i3). The i3 fund invests in high-impact, potentially transformative education interventions—ranging from new ideas with huge potential to those that have proven their effectiveness and are ready to be scaled up. Whether applicants to i3 are eligible for funding to develop, validate, or scale up their program, and therefore how much funding they are eligible to receive, depends
on the strength of the existing evidence of the program’s effectiveness, the magnitude of the impact the evidence demonstrates the program is likely to have, and the pro-gram’s readiness for scaling up.
This multi-tiered structure provides objective crite-ria to inform decisions about programs and practices in which to invest and create the right incentives for the fu-ture. Organizations understand that to be considered for significant funding, they must provide credible evaluation results that show promise, and, before that evidence is available, be ready to subject their models to analysis. As more models move into the top tier, this approach creates pressure on all the top-tier models to compete to improve their effectiveness to continue to receive support. The Administration is also working with agencies to adopt common evidence standards (where such common stan-dards are appropriate) and to develop more robust “what works” repositories across a wide range of programs.
The Administration has also championed the Pay for Success model. In the Pay for Success model, philanthrop-ic and other private investors provide up-front funding for services for a target population to achieve specific out-comes that are measured in terms of improved lives and reduced costs. The government pays only if agreed-upon goals are achieved. Pay for Success allows the govern-ment to better partner with and leverage the resources of philanthropic and other investors to help drive evidence-based innovation and invest in what works.
The Pay for Success model is particularly well-suited to cost-effective interventions that produce government savings, since those savings can be used to pay for results. For example, effective prisoner re-entry interventions can reduce future prison costs, and a portion of those savings can be used to pay back the investors. More effective workforce systems could increase job placement and im-prove job retention and again, some savings may be used to repay the investments. The Administration is promot-ing the Pay for Success model in several Federal grant programs and is helping several states and localities that are seeking to implement the Pay for Success model. In addition, the Administration is exploring ways in which appropriations bills can better account for programs that generate savings for other programs.
The Administration supports evaluations with rigor-ous research designs that address questions critical to program design, and supports strengthened agency ca-pacity to support such evaluations, even in tight budget times. The Recovery Act launched a number of evalua-tions across the Federal Government on such topics as the effects of different rent formulas on housing assis-tance recipients, the effects of smart grid meters on resi-dential electricity usage, and the effects of extended un-employment insurance benefit programs on employment outcomes. Even with scarce dollars, agencies continue to direct scarce dollars to evaluations to assure they are not funding programs without positive impacts, the biggest waste of all.
Research and evaluation are part of any comprehen-sive effort to use data and evidence to serve the American people in more cost-effective ways. So ideally the fund-
8. PROGRAM EVALUATION 93
ing for research and evaluation would not be viewed as optional but rather as an essential element of running ef-fective government programs. New funding for research and evaluation is only part of the Administration’s efforts to re-invigorate evaluation activities across the Federal Government. The Administration is also working to build agency capacity for a robust evaluation and data analyt-ics infrastructure, whether that is supporting an agency in standing up a central evaluation office, empowering existing evaluation offices, institutionalizing policies that lead to strong evaluations, helping spread effective pro-curement practices, or hiring evaluation and data analyt-ics experts into key administrative positions.
Part of that evaluation and data analytics infrastruc-ture is helping agencies make better use of administra-tive data. Administrative data, especially when linked across programs or to survey data, can sometimes make rigorous program evaluations much more informative and much less costly. Data from an early childhood program linked to the data from juvenile justice systems or K-16 educational systems shed light on the long-term effects of interventions in ways that would be cost-prohibitive in a long-term survey follow-up. Linking records from across programs also enables policy makers to better un-derstand how families access combinations of government assistance programs, such as food assistance and unem-ployment insurance, during times of economic challenges. This sort of analysis is not evaluation, but is an incred-ibly important aspect of agency management – looking at available information to find patterns, relationships, anomalies, and other features to inform priority-setting, program design, and hypothesis formulation.
Moreover, when skilled data analysts have access to linked administrative data with appropriate privacy pro-tections, the cost of additional policy-relevant research is extremely modest. The private sector is increasingly using such data analytics to drive decisions on how to al-locate resources and better serve their customers. There is perhaps even greater potential in the public sector to make use of such analytics, although realizing this po-tential will also take a concerted effort to hire and retain skilled data analysts, increased attention to the multiple legal and policy contexts that make data access a contin-ued challenge, and infrastructure investments that sup-port this sort of analysis by more people across the orga-nization.
In addition, an inter-agency working group is beginning to share best practices across the Federal Government and to discuss issues, such as how to do a better job dis-seminating evidence of what works, integrating cost-effec-tiveness analysis into evaluations, and making better use of administrative data for evaluation and other data ana-lytics purposes. OMB is also building tools that should make it easier for agencies to make information available online about their completed and underway evaluations.
Rigorous evaluation will be a central component of several cross-agency initiatives designed to identify more cost-effective approaches to achieving positive outcomes for disadvantaged populations. These populations are of-ten eligible for multiple services and benefits administered
by separate Federal and State agencies, which are poorly coordinated and governed by rules that stifle effective collaboration and innovation. In 2012, the Departments of Labor and Education will support joint pilots to test interventions and systemic reforms with the potential to improve education and employment outcomes at lower cost to taxpayers. The Departments of Education, Labor, and Health and Human Services and the Social Security Administration will launch a joint initiative to test in-terventions that improve outcomes for children with disabilities and their families, which may yield substan-tial savings through reduced long-term reliance on the Supplemental Security Income program and other public services. OMB’s Partnership Fund for Program Integrity Innovation is testing promising solutions developed col-laboratively by Federal agencies, States, and other stake-holders to improve payment accuracy, improve adminis-trative efficiency, and enhance service delivery in benefit programs that serve overlapping populations. Evaluation of these pilots will help determine which strategies lead to better results at lower cost, allowing Federal and State governments to identify the most promising strategies that warrant expansion.
The Administration is committed to producing more and better empirical evidence. There is, however, perhaps an even greater need to promote greater demand for data and evidence in Federal decision-making processes. The process of setting high-priority goals and measuring prog-ress towards meeting them is beginning to increase the demand for data, its analysis, and complementary evalu-ations, as leaders running frequent data-driven reviews to achieve progress on ambitious goals search for increas-ingly effective and cost-effective practices to speed prog-ress toward the goals they have set.
State, local, and tribal governments face a similar need to prioritize programs that achieve the best results. One particularly interesting model is the Washington State Institute for Public Policy. The Institute provides a good example of how a centralized evaluation and research agency can conduct reviews of existing evaluation re-search to identify policies, practices, and strategies that are most likely to give taxpayers a return on their invest-ment. It was created by the Washington state legislature to carry out practical, non-partisan research – at legisla-tive direction – of importance to Washington State. The Institute has its own set of policy analysts and economists, specialists from universities, and consultants whom it engages to conduct policy analysis. It does a systematic review of evidence and has a methodology for comparing the relative return-on-investment of alternative interven-tions and presents the results in a straightforward, user-friendly manner. The Institute provides a potential model for Federal, state, local, and tribal government as well as for not-for-profit and for-profit organizations. An example of an assessment of the evidence for options to improve statewide outcomes in a variety of areas, including child maltreatment, crime, and education can be found at the Institute’s website here: http://www.wsipp.wa.gov/rpt-files/11-07-1201.pdf.

94 ANALYTICAL PERSPECTIVES
The President has made it clear that policy decisions should be driven by evidence—evidence about what works and what does not and evidence that identifies the greatest needs and challenges. By instilling a culture of learning into Federal programs, the Administration will
build knowledge so that spending decisions are based not only on good intentions, but also on strong evidence that yield the highest social returns on carefully targeted in-vestments.
95
9. BENEFIT-COST ANALYSIS
I. INTRODUCTION
Federal Government policies and programs make use of our Nation’s limited resources to achieve important so-cial goals, including economic growth, job creation, edu-cation, national security, environmental protection, and public health. Many Federal programs require govern-mental expenditures, such as those funding early child-hood education or job training. Moreover, many policies entail social expenditures that are not reflected in budget numbers. For example, environmental, energy efficiency, and workplace safety regulations impose compliance costs on the private sector. In all cases, the American people expect the Federal Government to design programs and policies to manage and allocate scarce fiscal resources prudently, and to ensure that programs achieve the maxi-mum benefit to society and do not impose unjustified or excessive costs.
A crucial tool used by the Federal Government to achieve these objectives is benefit-cost analysis, which provides a systematic accounting of the social benefits and costs of Government policies. Executive Order 13563, issued in January 2011, makes a firm commitment to cost-benefit analysis and to ensuring that the benefits of regulations justify the costs. It states, among other things, that each agency must “use the best available techniques to quan-tify anticipated present and future benefits and costs as accurately as possible.” It also states that agencies must “propose or adopt a regulation only upon a reasoned de-termination that its benefits justify its costs (recognizing that some benefits and costs are difficult to quantify.)”
The goal of benefit-cost analysis is to promote social welfare -- to ensure that the consequences of regulations are desirable on balance. The use of monetary equivalents does of course create numerous challenges, both conceptu-al and empirical; philosophers and economists have grap-pled with those challenges. 1 The translation of regulatory
1 See Adler (2011). [Reference is to Matthew D. Adler, Well-Being and Fair Distribution: Beyond Cost-Benefit Analysis, Oxford University
consequences into monetary figures is meant to promote sensible comparisons, and should be understood as an ad-ministrable method for promoting that assessment. Other considerations, not subject to that translation, may also matter. As Executive Order 13563 also states, “each agen-cy may consider (and discuss qualitatively) values that are difficult or impossible to quantify, including equity, human dignity, fairness, and distributive impacts.”
The assessment of benefits and costs of a government policy are meant to offer a concrete description of the an-ticipated consequences of the policy. Such an accounting helps policymakers to design programs to be both efficient and effective and to avoid unnecessary or unjustified costs and burdens. That accounting also allows the American people to see the expected consequences of programs and to hold policymakers accountable for their actions.
As noted, quantification and monetization produce sig-nificant challenges, but serious efforts have been made to meet those challenges. Those efforts are continuing. Importantly, there is a close relationship between open government and benefit-cost analysis. Because analysis is often improved through transparency and public com-ments, transparency and consideration of benefits and costs are tightly connected in practice. Especially in a dif-ficult economic period, it is important to analyze both ben-efits and costs and to take steps to eliminate unnecessary burdens, which may have adverse effects on job creation and growth. Executive Order 13563 calls for such steps with its efforts to discipline the flow of new regulations and its requirement of retrospective analysis of existing significant rules. Retrospective analysis has recently be-come a central part of the regulatory process as agencies identify outdated or redundant regulations and is help-ing to eliminate billions of dollars in regulatory burdens, in areas including environmental protection, transporta-tion, labor, health care, and agriculture.
Press, 2011)]
II. BENEFIT-COST ANALYSIS OF FEDERAL REGULATIONS
Overview of Benefit-Cost Analysis of Federal Regulation
For over three decades, benefit-cost analysis has played a critical role in the evaluation and design of significant Federal regulatory actions. While there are precursors in earlier administrations, the Reagan Administration was the first to establish a broad commitment to benefit-cost analysis in regulatory decision making through its Executive Order 12291. The Clinton Administration con-tinued that commitment when it updated the principles
and processes governing regulatory review in Executive Order 12866, which continues in effect today. Executive Order 12866 requires executive agencies to catalogue and assess the benefits and costs of planned significant regulatory actions. It also requires agencies (1) to under-take regulatory action only on the basis of a “reasoned determination” that the benefits justify the costs and (2) to choose the regulatory approach that maximizes net so-cial benefits, that is, benefits minus costs (unless the law governing the agency’s action requires another approach). Executive Order 13563, issued in January 2011, reaffirms
96 ANALYTICAL PERSPECTIVES
the requirements of Executive Order 12866 and imposes a set of important additional requirements designed to promote sound analysis, to increase flexibility, to promote public participation, to harmonize conflicting and redundant requirements, and to ensure scientific integrity.
Operating under the broad framework established by Executive Orders 13563 and 12866, the Office of Management and Budget requires careful analysis of the costs and benefits of significant rules; identifica-tion of the approach that maximizes net benefits; de-tailed exploration of reasonable alternatives, alongside assessments of their costs and benefits; cost-effective-ness; and attention to unquantifiable benefits and costs as well as to distributive impacts. Central goals are to ensure that regulations will be effective in achieving their purposes and that they do not impose excessive costs. As noted, it is especially important to maximize net benefits, and to avoid unjustified burdens, in a pe-riod of economic difficulty. Notably, Executive Order 13563 specifically refers to “job creation,” and where feasible, agencies have recently devoted a great deal of attention to the anticipated job impacts (whether posi-tive or negative) of regulations.
Under Executive Order 13563, agencies are autho-rized to consider “values that are difficult or impossible to quantify, including equity, human dignity, fairness, and distributive impacts.” In analyzing the effects of rules issued under the Americans with Disabilities Act, for example, it is legitimate to consider the dignitary values 2 associated with protection against discrimina-tion, and also the equitable goals of the statute. Also, in eliminating the ban on entry into the United States of those who are HIV-positive, it is legitimate to consider dignitary and equitable factors that properly bear on the decision to eliminate that ban.
Reviewing agencies’ benefit-cost analyses and work-ing with agencies to improve them, OMB provides a centralized repository of analytical expertise in its Office of Information and Regulatory Affairs (OIRA). OMB’s guidance to agencies on how to do benefit-cost analysis for proposed regulations is contained in its Circular A-4. A-4 directs agencies to specify the goal of a planned regulatory intervention, to consider a range of regulatory approaches for achieving that goal, to select the least burdensome approach, and to estimate the benefits and costs of each alternative considered. To the extent feasible, agencies are re-
2 Dignitary value is defined as “a concern for values inherent in or in-trinsic to our common humanity-values such as autonomy, self-respect, or equality that might be nurtured or suppressed depending on the form that governmental decision making takes.” The definition is available at http://digitalcommons.law.yale.edu/.
quired to monetize benefits and costs, so that they are expressed in comparable units of value. This process enables the agency to identify (and generally to choose) the approach that maximizes the total net benefits to society generated by the rule. OIRA has recently is-sued a primer on Circular A-4 and also a response to Frequently Asked Questions.
For example, consider a regulation that sets stan-dards for how quickly a truck’s brakes must be able to bring it to a stop. 3 A shorter stopping distance gener-ates greater safety benefits, but also will impose larger compliance costs (if more effective brakes are more ex-pensive). The agency should attempt to quantify both the safety benefits of reduced stopping distance and the costs of regulatory requirements. It should consider a range of stopping distances to determine the optimal one that maximizes net benefits. At such an optimal standard, making the stopping distance even shorter would impose compliance costs greater than additional safety benefits. At the same time, making the stopping distance longer than optimal results in a loss in safety benefits that is greater than the cost savings. Careful benefit-cost analysis enables the agency to determine the optimal standard. It helps to show that some ap-proaches would be insufficient and that others would be excessive.
To be sure, quantification of the relevant variables, and monetization of those variables, can present seri-ous challenges. OIRA and relevant agencies have de-veloped a range of strategies for meeting those chal-lenges; many of them are sketched in Circular A-4, and we take up one such approach below. Efforts continue to be made to improve current analyses and to disclose and test their underlying assumptions. In some cases, identification of costs and benefits will leave significant uncertainties. In some cases, the monetized figures will not be sufficient to settle the appropriate choice. But much of the time, an understanding of costs and benefits will rule out some possible courses of action, and will show where, and why, reasonable people might differ. Such an understanding will also help to identify the most effective courses of action and to eliminate unjustified costs and burdens—in the process poten-tially helping to promote competitiveness, innovation, job creation, and economic growth. (Recall that the purpose of cost-benefit analysis is to provide an ad-ministrable method for assessing the consequences of regulation.)
3 The National Highway Traffic Safety Administration issued a new safety standard for air brake systems to improve the stopping distance performance of trucks. See 49 CFR § 571.
9. BENEFIT-COST ANALYSIS 97
Table 9–1. ESTIMATES OF THE TOTAL ANNUAL BENEFITS AND COSTS OF MAJOR RULES REVIEWED BY OMB IN 2010(In billions of 2001 dollars)
Rule Agency Benefits Costs
Energy Conservation Standards for Small Electric Motors ............................................ DOE 0.7-0.8 0.2
Energy Efficiency Standards for Commercial Clothes Washers .................................... DOE 0-0.1 <0.1Energy Efficiency Standards for Pool Heaters and Direct Heating Equipment and
Water Heaters ........................................................................................................... DOE 1.3-1.8 1.0-1.1Medical Examination of Aliens--Removal of Human Immunodeficiency Virus (HIV)
Infection from Definition of Communicable Disease of Public Health Significance ... HHS Not Estimated <0.1Regulations Restricting the Sale and Distribution of Cigarettes and Smokeless
Tobacco to Protect Children and Adolescents .......................................................... HHS Not Estimated Not EstimatedUse of Ozone-Depleting Substances; Removal of Essential Use Designations
[Flunisolide, Triamcinolone, Metaproterenol, Pirbuterol, Albuterol and Ipratropium in Combination, Cromolyn, and Nedocromil] ............................................................ HHS Not Estimated Not Estimated
Interim Final Rules under the Paul Wellstone and Pete Domenici Mental Health Parity and Addiction Equity Act of 2008 .............................................................................. HHS/DOL/TREAS Not Estimated <0.1
Interim Final Rules for Group Health Plans and Health Insurance Issuers Relating to Dependent Coverage of Children to Age 26 under the Patient Protection and Affordable Care Act .................................................................................................. HHS/DOL/TREAS Not Estimated <0.1
Interim Final Rules for Group Health Plans and Health Insurance Coverage Relating to Status as a Grandfathered Health Plan under the Patient Protection and Affordable Care Act .................................................................................................. HHS/DOL/TREAS Not Estimated <0.1
Patient Protection and Affordable Care Act: Preexisting Condition Exclusions, Lifetime and Annual Limits, Rescissions, and Patient Protections ........................... HHS/DOL/TREAS Not Estimated <0.1
Interim Final Rules for Group Health Plans and Health Insurance Issuers Relating to Internal Claims and Appeals and External Review Processes under the Patient Protection and Affordable Care Act .......................................................................... HHS/DOL/TREAS Not Estimated <0.1
Interim Final Rules for Group Health Plans and Health Insurance Issuers Relating to Coverage of Preventive Services under the Patient Protection and Affordable Care Act ............................................................................................................................ HHS/DOL/TREAS Not Estimated Not Estimated
Migratory Bird Hunting; Final Frameworks for Early-Season Migratory Bird Hunting Regulations ............................................................................................................... DOI 0.2-0.3 Not estimated
Migratory Bird Hunting; Final Frameworks for Late Season Migratory Bird Hunting Regulations ............................................................................................................... DOI 0.2-0.3 Not estimated
Nondiscrimination on the Basis of Disability in Public Accommodations and Commercial Facilities ................................................................................................ DOJ 1.0-2.1 0.5-0.7
Nondiscrimination on the Basis of Disability in State and Local Government Services DOJ 0.2-0.3 0.1-0.2
Electronic Prescriptions for Controlled Substances ....................................................... DOJ 0.3-1.3 <0.1
Cranes and Derricks in Construction ............................................................................. DOL 0.2 0.1
Improved Fee Disclosure for Pension Plans .................................................................. DOL Not Estimated <0.1Automatic Dependent Surveillance--Broadcast (ADS-B) Equipage Mandate to
Support Air Traffic Control Service ........................................................................... DOT 0.1-0.2 0.2
Electronic On-Board Recorders for Hours-of-Service Compliance ............................... DOT 0.2 0.1
Positive Train Control ..................................................................................................... DOT <0.1 0.5-1.3
Pipeline Safety: Distribution Integrity Management ....................................................... DOT 0.1 0.1Passenger Car and Light Truck Corporate Average Fuel Economy Standards MYs
2012 to 2016 ............................................................................................................. DOT and EPA 3.9-18.2 1.7-4.7
S.A.F.E. Mortgage Licensing Act ................................................................................... TREAS Not Estimated 0.1-0.2Control of Emissions from New Marine Compression-Ignition Engines at or above 30
Liters per Cylinder .................................................................................................... EPA Not Estimated Not EstimatedNational Emission Standards for Hazardous Air Pollutants for Reciprocating Internal
Combustion Engines ................................................................................................ EPA 0.7-1.9 0.3National Emission Standards for Hazardous Air Pollutants for Reciprocating Internal
Combustion Engines--Existing Stationary Spark Ignition (Gas-Fired) ...................... EPA 0.4-1.0 0.2
NESHAP: Portland Cement Notice of Reconsideration ................................................. EPA 6.1-16.3 0.8-0.9
Prevention of Significant Deterioration/Title V Greenhouse Gas Tailoring Rule ............ EPA Not Estimated Not Estimated
Renewable Fuels Standard Program ............................................................................. EPA Not Estimated Not Estimated
Review of the National Ambient Air Quality Standards for Sulphur Dioxide .................. EPA 2.8-38.6 0.3-2.0Lead; Amendment to the Opt-out and Recordkeeping Provisions in the Renovation,
Repair, and Painting Program ................................................................................... EPA 0.8-3.0 0.3
Revisions to the Spill Prevention, Control, and Countermeasure (SPCC) Rule ............ EPA 0 -0.1

98 ANALYTICAL PERSPECTIVES
The Benefits and Costs of Federal Regulation in FY 2010
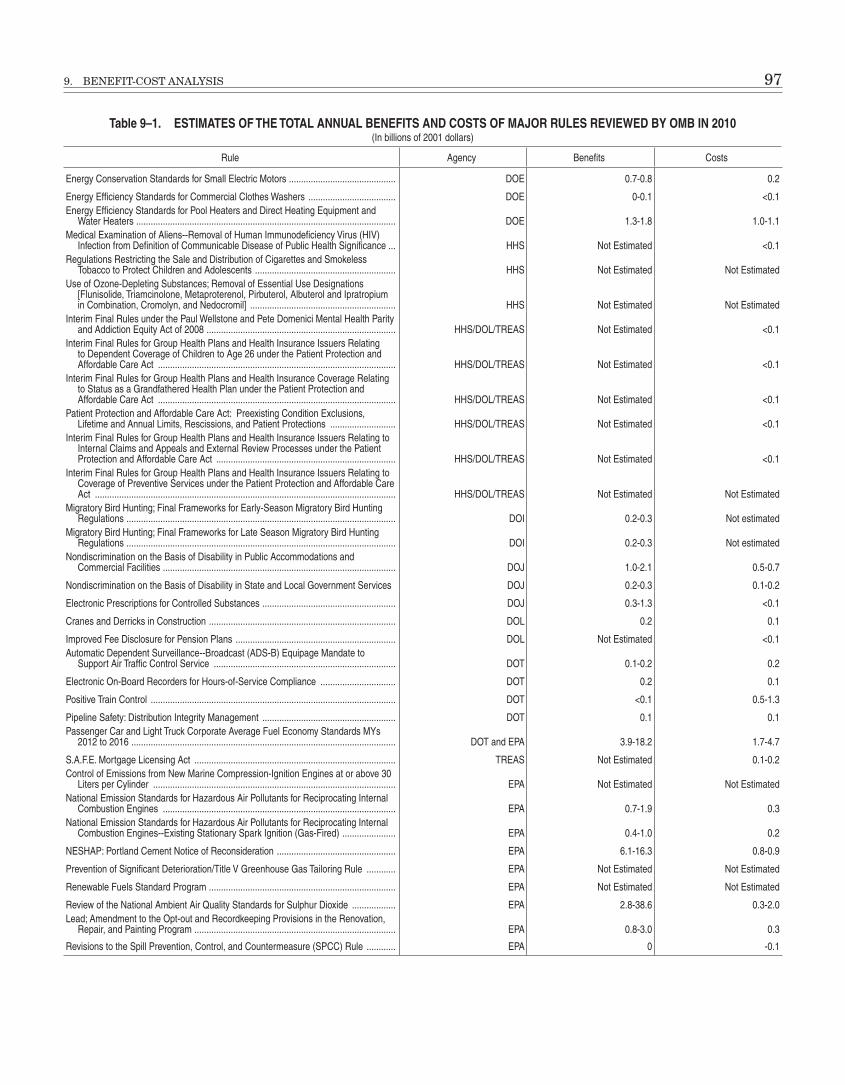
Each year, OMB reports to Congress agencies’ esti-mates of the benefits and costs of major regulations re-viewed in the prior fiscal year. Table 9–1 presents the benefit and cost estimates for the 34 non-budgetary rules reviewed by OMB in FY 2010. 4 Of those, agencies mon-etized both the benefits and costs for 18. 5
Most of the benefits and costs reported in Table 9–1 are expressed as ranges, and sometimes as wide ranges, because of uncertainty about the likely consequences of rules. Quantification and monetization raise difficult conceptual and empirical questions. Prospective benefit-cost analysis requires predictions about the future—both about what will happen if the regulatory action is taken and what will happen if it is not—and what the future holds is typically not known for certain. A standard goal of the agency’s analysis is to produce both a central “best estimate,” which reflects the expected value of the ben-efits and costs of the rule, as well as a description of the ranges of plausible values for benefits, costs, and net ben-efits. These estimates inform the decisionmakers and the public of the degree of uncertainty associated with the regulatory decision. The process of public scrutiny can sometimes reduce that uncertainty.
To illustrate some of the underlying issues, consider the EPA’s recent National Ambient Air Quality Standard (NAAQS) for Sulfur Dioxide. The benefits of the rule are estimated to be somewhere between $2.8 to $38.6 bil-lion—an expansive range. Almost all of these estimated benefits are due to co-benefits of reduced mortality re-sulting from the reduction in particulate matter emis-sions caused by the rule. However, there is substantial uncertainty with respect to (a) the relationship between exposure to particulate matter and premature death and (b) the proper monetary valuation of avoiding a prema-ture death. Hence, the agency reported a wide range of plausible values for the benefits of the NAAQS for Sulfur Dioxide. Similar uncertainties in both the science used to predict the consequences of rules and the monetary val-ues of those consequences, contribute to the uncertainty represented in the ranges of benefits and costs for other rules in Table 9–1. Despite these uncertainties, benefit-cost analysis often reduces the range of reasonable ap-proaches – and simultaneously helps to inform the deci-sion about which approach is most reasonable.
4 FY 201020 is the most recent period for which such a summary is available. These estimates were reported in OMB, 2011 Report to Con-gress on the Benefits and Costs of Federal Regulations and Unfunded Mandates on State, Local, and Tribal Entities. A detailed description of the assumptions and calculations underlying these estimates is pro-vided in that Report.
5 (1) The Department of Health and Human Services issued six rules to implement health insurance reforms. . (2) The Department of Inte-rior adopted two Migratory Bird Hunting regulations where the agency assessed benefits associated with increased consumer welfare of hunt-ing allowances. (3) The Environmental Protection Agency assessed the benefits and costs for both national and international coordinated strat-egy to control emissions from ocean-going vessels, adopted a case-study approach to examine the effects of the Renewable Fuels Program, and provided illustrative estimates for the Greenhouse Gas Tailoring Rule.
Quantification and Breakeven Analysis
In some cases, the effort to monetize certain benefits (such as protection of streams and wildlife) will run into serious obstacles; quantification may be possible but not monetization. In other cases, analysts will know the direc-tion of an effect, and perhaps be able to specify a range, but precise quantification itself will not be possible. Recognizing these points, OMB has recommended that consistent with Executive Orders 13563 and 12866, the best practice is to accompany all significant regulations with (1) a tabular presentation, placed prominently and offering a clear statement of qualitative and quantita-tive benefits and costs of the proposed or planned action, together with (2) a presentation of uncertainties and (3) similar information for reasonable alternatives to the pro-posed or planned action. An advantage of this approach is transparency. If, for example, it is possible to quantify cer-tain benefits (such as protection of water quality) but not to monetize them, then the public should be made aware of that fact. At the same time, qualitative discussion of nonquantifiable benefits should help the public, and rel-evant decisionmakers, to understand the goal of the regu-lation and how it might achieve that goal.
When quantification is not possible, many agencies have found it both useful and informative to engage in “breakeven analysis.” Under this approach, agencies spec-ify how high the unquantified or unmonetized benefits would have to be in order for the benefits to justify the costs. Suppose, for example, that regulation that protects water quality costs $105 million annually, and that it also has significant effects in reducing pollution in rivers and streams. It is clear that the regulation would be justified if and only if those effects could reasonably be valued at $105 million or more. Once the nature and extent of the water quality benefits are understood, it might well be easy to see whether or not the benefits plausibly justify the costs -- and if the question is difficult, at least it would be clear why it is difficult. Breakeven analysis is an im-portant tool, and it has analytical value when quantifica-tion is speculative or impossible.
Current Agency Practice for Values of Mortality Reduction
Since agencies often design health and safety regula-tion to reduce risks to life, evaluation of these benefits can be the key part of the analysis. When monetizing reduced mortality risks, agencies often use what is com-monly described as a “Value of a Statistical Life,” or VSL. The term is misleading because it suggests, erroneously, that the goal of monetization is to place a “value” on in-dividual lives. The goal is instead to value reductions in small risks of premature death (such as 1 in 100,000); it follows that “VSL” actually refers to the value of gaining small risk reductions. There is no effort to suggest that any individual’s life can be expressed in monetary terms.
Circular A-4 provides background on the theory and practice of calculating VSL. It states that a substantial majority of the studies of VSL indicate a value that var-ies “from roughly $1 million to $10 million per statisti-

9. BENEFIT-COST ANALYSIS 99
Table 9–2. ESTIMATES OF THE NET COSTS PER LIFE SAVED OF SELECTED HEALTH AND SAFETY RULES RECENTLY REVIEWED BY OMB
(In millions of 2001 dollars)
Rule AgencyNet Cost per Life
Saved Notes
Prevention of Salmonella Enteritidis in Shell Eggs ...................... HHS/FDA Negative Morbidity benefits exceed costs.
New Entrant Safety Assurance Process ...................................... DOT/FMCSA Negative Property damage and morbidity benefits exceed costs.
Reduced Stopping Distance Requirements for Truck Tractors ..... DOT/NHTSA Negative Property damage benefits exceed costs.
Roof Crush Resistance ................................................................ DOT/NHTSA $6.4-11.0
The agency estimates that the rule will prevent 135 fatalities and 1,065 nonfatal injuries annually. These figures translate into 156 equivalent
fatalities. The main estimates value equivalent fatalities prevented at $6.1 million. It follows that the value of nonfatal injuries prevented is $6.1
million*(156-135)=$128.1 million annually. Total costs associated with the rule range from $875 million to $1,400 million annually. If we subtract the injury benefits from costs, the range of net cost per life saved is thus $5.5
million to $9.4 million (2007 dollar). Adjusting to $2001 yields $6.4 million to $11.0 million.
cal life.” In practice, agencies have tended to use a value in the middle or upper range of this distribution. (Note that Circular A-4 was issued in 2003 and that because of income growth, the figure increases over time.) OMB believes that it is important to consult the relevant lit-erature, which contains a range of significant empirical findings and conceptual claims, in order to base analysis on the best available research. Below we provide a brief summary of the VSL values agencies have adopted in re-cent Regulatory Impact Analyses (RIAs).
Two agencies, EPA and DOT, have developed official guidance on VSL. In its 2011 update to its guidelines, DOT uses a value of $6.2 million ($2011), and requires all the components of the Department to use this value in their RIAs. EPA recently changed its VSL to $6.3 million ($2000) and adjusts this value for real income growth to later years. For example, in its final rule setting a new primary standard for Sulfur Dioxide, EPA adjusted VSL to account for a different currency year ($2006) and to account for income growth to 2020, which yields a VSL of $8.9 million. EPA stated in this RIA, however, that it is continuing their efforts to update this guidance.
Although the Department of Homeland Security has no official policy on VSL, it recently sponsored a report through its U.S. Customs and Border Protection, and has used the recommendations of this report to inform VSL values for several recent rulemakings. This report rec-ommends $6.3 million ($2008) and also recommends that DHS adjust this value upward over time for real income growth (in a manner similar to EPA’s adjustment ap-proach). Other regulatory agencies that have used a VSL in individual rulemakings include DOL’s Occupational Safety and Health Administration (OSHA) and HHS’ Food and Drug Administration (FDA). In a rulemaking revising worker safety standards when using cranes and derricks in construction, OSHA updated the previously used VSL of $7.0 million ($2003) to $8.7 million ($2010). The FDA is using a value of $7.9 million ($2010), but also often uses a monetary value of the remaining life years saved by alternative policies. This is sometimes referred to as a “Value of a Statistical Life Year” or VSLY. As noted,
OMB believes in the importance of consulting the grow-ing empirical and conceptual work in this domain.
Cost-per-life-saved of Health and Safety Regulation
For regulations intended to reduce mortality risks, an-other analytic tool that can be used to assess regulations, and to help avoid unjustified burdens, is cost-effectiveness analysis. Some agencies develop estimates of the “net cost per life saved” for regulations intended to improve public health and safety. To calculate this figure, the costs of the rule minus any monetized benefits other than mortality reduction are placed in the numerator, and the expected reduction in mortality in terms of total number of lives saved is placed in the denominator. This measure avoids any assignment of monetary values to reductions in mor-tality risk. It still reflects, however, a concern for econom-ic efficiency, insofar as choosing a regulatory option that reduces a given amount of mortality risk at a lower net cost to society would conserve scarce resources compared to choosing another regulatory option that would reduce the same amount of risk at greater net costs.
Table 9–2 presents the net cost per life saved for four recent health and safety rules for which calculation is possible. The net cost per life saved is calculated using 3 percent discount rate and using agencies’ best estimates for costs and expected mortality reduction where those were provided by the agency. There is substantial varia-tion in the net cost per life saved by these rules, ranging from negative (that is, the non-mortality-related benefits outweigh the costs), to potentially as high as $11.0 mil-lion.
This table is designed to be illustrative rather than de-finitive, and continuing work must be done to ensure that estimates of this kind are complete and not misleading. For example, some mortality-reducing rules have a range of other benefits, including reductions in morbidity, and it is important to include these benefits in cost-effectiveness analysis. Other rules have benefits that are exceedingly difficult to quantify but nonetheless essential to consider; consider rules that improve water quality or have aes-

100 ANALYTICAL PERSPECTIVES
thetic benefits. Nonetheless, it is clear that some rules are far more cost-effective than others, and it is valuable to take steps to catalogue variations and to increase the
likelihood that scarce resources will be used as effectively as possible.
III. BENEFIT-COST ANALYSIS OF BUDGETARY PROGRAMS
As noted, Executive Orders 13563 and 12866 require agencies, to the extent permitted by law, to “propose or adopt a regulation only upon a reasoned determination that the benefits of the intended regulation justify its costs.” OIRA works actively with agencies to promote compliance with this requirement.
Historically, benefit-cost analysis of Federal budgetary programs has been more limited than that of regulatory policy. Increasingly, though, the Federal Government ex-plicitly employs benefit-cost analysis to ensure that proj-ects and spending programs have benefits in excess of costs, maximize net benefits, and allocate federal dollars most efficiently across potential projects.
In the 1936 Flood Control Act, for example, Congress stated as a matter of policy that the Federal government should undertake or participate in flood control projects if the benefits exceeded the costs, where the lives and so-cial security of people are at stake. By the late 1970s, the Army Corps of Engineers had begun to use benefit-cost analysis to improve the return on investment at a given project site. The Corps did this by designing proj-ects based on increments of work whose benefits exceeded their costs. More recently, the Budget has used benefits and costs, along with other criteria, to develop an overall program for the Corps that yields the greatest net ben-efits or cost effectiveness.
Benefit-cost analysis can also be used to evaluate pro-grams retrospectively to determine whether they should be either expanded or discontinued and how they can be improved. Chapter 8, “Program Evaluation”, in this vol-ume discusses current efforts to improve program evalu-ation. Evidence that an activity can yield substantial net benefits has motivated the creation and expansion of a substantial number of programs. For example, longitu-dinal studies have shown that each dollar spent on high quality pre-school programs serving disadvantaged chil-dren yields substantially more than a dollar (in present value) in higher wages, less crime, and less use of public services, motivating an expansion of funding for quality
pre-K programs. Similar evidence has spurred the de-cision to expand funding for nurse-family partnerships, finding that each dollar spent in the program leads to more than a dollar of benefits mostly in reduced govern-ment expenditures on health care, educational and so-cial services, and criminal justice, and that the highest returns were present in serving the most disadvantaged families. Similarly, GAO has concluded that the Women, Infants, and Children (WIC) program produces monetary benefits that exceed its costs by reducing the incidence of low birth weight and iron deficiency, which are linked to children’s behavior and development.
OMB continually works with executive agencies to im-prove their benefit-cost analyses, and to increase trans-parency. In its 2011 annual report to Congress on the benefits and costs of Federal regulations, 6 OMB contin-ues to support the recommendations for improvement in agencies’ benefit-cost analysis by promoting (1) clar-ity with respect to underlying assumptions and antici-pated consequences, (2) prominent tabular presentations of costs and benefits, and (3) careful consideration of the comments offered by members of the public on proposed rules. Furthermore, OMB recommends that benefit-cost analysis should be seen and used as a central part of open government. By providing the public with information about proposed and final regulations, by revealing as-sumptions and subjecting them to public assessment, and by drawing attention to the consequences of alternative approaches, such analysis can promote publ7ic under-standing, scrutiny, and improvement of rules. OMB con-tinues to explore ways to ensure that benefit-cost analysis helps promote the commitment to open government.
6 OMB, 2011 Report to Congress on the Benefits and Costs of Federal Regulations and Unfunded Mandates on State, Local, and Tribal Enti-ties.
7 See Transparency and Open Government, Memorandum for the Heads of Executive Departments and Agencies, President Obama, Jan. 21, 2009. For discussion of this point and its relationship to retrospec-tive analysis of the effects of regulations, see Greenstone (2009).
IV. IMPROVING BENEFIT-COST ANALYSIS
In the Memorandum on Transparency and Open Government, issued on January 21, 2009, the President called for the establishment of “a system of transparency, public participation, and collaboration.”8 The memoran-dum elaborated the principles of such a system, designed to promote accountability and disclosure of information that “the public can readily find and use.” The memo-randum noted that “[k]nowledge is widely dispersed in society, and public officials benefit from having access to that dispersed knowledge.” Implementing the President’s memorandum, agencies have begun to take a series of
8 Available at: http://www.gpoaccess.gov/presdocs/2009/DCPD200900010.pdf
concrete measures described in the Open Government Directive to put into practice the commitments to trans-parency, participation, and collaboration. 9
The goals of this effort are to promote accountability, and to ensure that regulations are informed, to the extent possible, by a careful analysis of the likely consequences, and to reduce the dual risks of excessive and insufficient regulation. A particular goal, in the current period, is to avoid unjustified or excessive burdens on business, state and local government, and individuals. The recent agency checklist for Regulatory Impact Analysis is designed to promote these various goals (see Appendix).
9 Available at: http://www.openthegovernment.org/otg/OGD.pdf

9. BENEFIT-COST ANALYSIS 101
Participation and Collaboration in the Regulatory Process
Executive Order 13563 states that “regulations shall be based, to the extent feasible and consistent with law, on the open exchange of information and perspectives . . . . “ To promote that open exchange, Executive Order 13563 directs agencies to provide the public with timely access to regulatory analyses and supporting documents on regulations.gov to ensure a meaningful opportunity for public comment.
The Internet provides an ideal vehicle for making in-formation public and, under Executive Order 13563, the Administration has committed to publish as much as pos-sible online in a format that can be retrieved, downloaded, indexed, and searched by commonly-used web search ap-plications. Importantly, this commitment promotes public accessibility of the analysis of benefits and costs, together with the supporting materials, in order to ensure that the analysis is subject to public scrutiny. That process of scru-tiny can help to increase benefits, decrease costs, or both.
Agencies now publish a great deal of information rel-evant to rulemaking and benefit-cost analysis, including underlying data, online and in downloadable, as well as traditional, formats. Executive Order 13563 directs agen-cies to use regulations.gov to make the online record as complete as possible 10 and to take all necessary steps to make relevant material available to the public for com-ment.
Executive Order 13563 requires that the public should generally receive a comment period of at least 60 days for proposed regulatory actions. Even where statutes neces-sitate shorter comment periods, agencies can seek public comment and respond in a timely fashion to suggestions about potential improvements in rules and underlying analyses.
Publicly Accessible Summaries and Tables with Key Information
In order to improve analysis of the effects of regula-tions, and simultaneously to improve accountability, OMB has called for a clear, salient, publicly accessible execu-tive summary of both benefits and costs— written in a “plain language” manner designed to be understandable to the public. For all economically significant regulations, Executive Orders 13563 and 12866 require agencies to provide a description of the need for the regulatory action and a clear summary of the analysis of costs and benefits, both qualitative and quantitative. The summary often in-cludes an accounting of benefits and costs of alternative approaches, and where relevant, an analysis of distribu-tional impacts on subpopulations (such as disabled people or those with low income).
10 Available at: http://www.whitehouse.gov/omb/assets/inforeg/edock-et_final_5-28-2010.pdf
As noted, some benefits and costs can be quantified and monetized, while some can be described only in qualita-tive terms. A useful way to communicate effects that can-not be easily quantified or monetized is to present ranges of values (as agencies frequently now do).
Simple, Straightforward Justification of Preferred Option
Executive Orders 13563 and 12866 require the ex-ecutive summary to include “an explanation of why the planned regulatory action is preferable to the identified potential alternative,” and demonstrate that the agency has selected the approach “that maximizes net benefits (including potential economic, environmental, public health and safety, and other advantages; distributive im-pacts; and equity) unless a statute requires another regu-latory approach.”
Under the Executive Orders, agencies are required to provide a “reasoned determination that the benefits of the intended regulation justify its costs,” to the extent permit-ted by law. In making those determinations, agencies should pay close attention to quantifiable and monetiz-able benefits and costs, but are permitted to consider val-ues that are hard or impossible to quantify in light of ex-isting knowledge, as well as distributional effects, human dignity, fairness, and considerations of equity (including, where relevant, considerations of environmental justice).
We have noted that where nonquantified or nonmon-etized variables are important to the agency’s deter-mination, agencies often use “breakeven analysis,” ex-plaining how high the nonquantified or nonmonetized benefits would have to be in order for the benefits to jus-tify the costs. In those situations, agencies make underly-ing assumptions transparent to the public and available through the rulemaking process. Where the agency has proceeded even though the benefits do not justify the costs, and where the agency has not selected the approach that maximizes net benefits, it should carefully explain its reasoning (as, for example, where a statute so requires).
Benefit-cost analysis is a useful and often indispens-able method for evaluating programs and options. In some cases, it reveals that apparently attractive propos-als are too expensive to be worthwhile. In other cases, it shows that costly proposals are well-justified, because the benefits are significantly higher than the costs. Often ben-efit-cost analysis helps to identify the range of reasonable options. It is true that conceptual and empirical challeng-es remain and that it is important to assess the evolving literature in order to meet those challenges. Especially in a period of serious economic difficulties, greater use and improvement of benefit-cost analysis are high priorities.

102 ANALYTICAL PERSPECTIVES
APPENDIX
AGENCY CHECKLIST: REGULATORY IMPACT ANALYSIS
With this document, the Office of Information and Regulatory Affairs is providing a checklist to assist agen-cies in producing regulatory impact analyses (RIAs), as required for economically significant rules by Executive Order 12866 and OMB Circular A-4.
Nothing herein alters, adds to, or reformulates exist-ing requirements in any way. Moreover, this checklist is limited to the requirements of Executive Order 12866 (available at: http://www.reginfo.gov/public/jsp/Utilities/EO_12866.pdf) and Circular A-4 (available at: http://www.whitehouse.gov/OMB/circulars/a004/a-4.pdf); it does not address requirements imposed by other authorities, such as the National Environmental Policy Act, the Regulatory Flexibility Act, the Unfunded Mandates Reform Act, the Paperwork Reduction Act, and various Executive Orders that require analysis. Executive Order 12866 and Circular A-4, as well as those other authorities, should be consulted for further information.
Checklist for Regulatory Impact Analysis:
Does the RIA include a reasonably detailed description of the need for the regulatory action? 11 12
Does the RIA include an explanation of how the regula-tory action will meet that need? 13
Does the RIA use an appropriate baseline (i.e., best as-sessment of how the world would look in the absence of the proposed action)? 14
Is the information in the RIA based on the best reason-ably obtainable scientific, technical, and economic infor-mation and is it presented in an accurate, clear, complete, and unbiased manner? 15
11 Required under Executive Order 12866, Section 6(a)(3)(B)(i): “The text of the draft regulatory action, together with a reasonably detailed description of the need for the regulatory action and an explanation of how the regulatory action will meet
12 Circular A-4 states: “If the regulation is designed to correct a signif-icant market failure, you should describe the failure both qualitatively and (where feasible) quantitatively.” (P. 4)
13 See note 1 above.14 Circular A-4 states: “You need to measure the benefits and costs of
a rule against a baseline. This baseline should be the best assessment of the way the world would look absent the proposed action… In some cases, substantial portions of a rule may simply restate statutory re-quirements that would be self-implementing, even in the absence of the regulatory action. In these cases, you should use a pre-statute baseline.” (P. 15-16)
15 Circular A-4 states: “Because of its influential nature and its special role in the rulemaking process, it is appropriate to set minimum qual-ity standards for regulatory analysis. You should provide documentation that the analysis is based on the best reasonably obtainable scientific, technical, and economic information available… you should assure com-pliance with the Information Quality Guidelines for your agency and OMB’s Guidelines for Ensuring and Maximizing the Quality, Objectiv-ity, Utility, and Integrity of Information Disseminated by Federal Agen-cies...” (P. 17). The IQ Guidelines (paragraph V.3.a) define objectivity to
Are the data, sources, and methods used in the RIA provided to the public on the Internet so that a qualified person can reproduce the analysis? 16
To the extent feasible, does the RIA quantify and mon-etize the anticipated benefits from the regulatory ac-tion? 17 18
To the extent feasible, does the RIA quantify and mon-etize the anticipated costs? 19
Does the RIA explain and support a reasoned determi-nation that the benefits of the intended regulation justify its costs (recognizing that some benefits and costs are dif-ficult to quantify)? 20
include “whether disseminated information is being presented in an ac-curate, clear, complete, and unbiased manner.” http://www.whitehouse.gov/omb/assets/omb/fedreg/reproducible2.pdf
16 Circular A-4 states: “A good analysis should be transparent and your results must be reproducible. You should clearly set out the basic assumptions, methods, and data underlying the analysis and discuss the uncertainties associated with the estimates. A qualified third party reading the analysis should be able to understand the basic elements of your analysis and the way in which you developed your estimates. To provide greater access to your analysis, you should generally post it, with all the supporting documents, on the internet so the public can review the findings.” (P. 17). OMB IQ Guidelines (paragraph V.3.b.ii) further states: “If an agency is responsible for disseminating influential scientific, financial, or statistical information, agency guidelines shall include a high degree of transparency about data and methods to facili-tate the reproducibility of such information by qualified third parties.”
17 Required under Executive Order 12866, Section 6(a)(3)(C)(i): “An assessment, including the underlying analysis, of benefits anticipated from the regulatory action (such as, but not limited to, the promotion of the efficient functioning of the economy and private markets, the enhancement of health and safety, the protection of the natural envi-ronment, and the elimination or reduction of discrimination or bias) together with, to the extent feasible, a quantification of those benefits.”
18 Circular A-4 states: “You should monetize quantitative estimates whenever possible. Use sound and defensible values or procedures to monetize benefits and costs, and ensure that key analytical assumptions are defensible. If monetization is impossible, explain why and present all available quantitative information.” (P. 19). Circular A-4 also offers a discussion of appropriate methods for monetizing benefits that might not easily be turned into monetary equivalents.
19 Required under Executive Order 12866, Section 6(a)(3)(C)(ii): “An assessment, including the underlying analysis, of costs anticipated from the regulatory action (such as, but not limited to, the direct cost both to the government in administering the regulation and to businesses and others in complying with the regulation, and any adverse effects on the efficient functioning of the economy, private markets (including produc-tivity, employment, and competitiveness), health, safety, and the natural environment), together with, to the extent feasible, a quantification of those costs;” See also note 6 above.
20 Executive Order 12866, Section 1(b)(6) states that to the extent permitted by law, “[e]ach agency shall assess both the costs and the ben-efits of the intended regulation and, recognizing that some costs and benefits are difficult to quantify, propose or adopt a regulation only upon a reasoned determination that the benefits of the intended regulation justify its costs.” As Executive Order 12866 recognizes, a statute may require an agency to proceed with a regulation even if the benefits do not justify the costs; in such a case, the agency’s analysis may not show any such justification.

9. BENEFIT-COST ANALYSIS 103
Does the RIA assess the potentially effective and rea-sonably feasible alternatives? 21
Does the RIA assess the benefits and costs of differ-ent regulatory provisions separately if the rule includes a number of distinct provisions? 22
Does the RIA assess at least one alternative that is less stringent and at least one alternative that is more strin-gent? 23
Does the RIA consider setting different requirements for large and small firms? 24
Does the preferred option have the highest net bene-fits (including potential economic, environmental, public health and safety, and other advantages; distributive im-pacts; and equity), unless a statute requires a different approach? 25
Does the RIA include an explanation of why the planned regulatory action is preferable to the identified potential alternatives? 26
21 Required under Executive Order 12866, Section 6(a)(3)(C)(iii): “An assessment, including the underlying analysis, of costs and benefits of potentially effective and reasonably feasible alternatives to the planned regulation, identified by the agencies or the public (including improving the current regulation and reasonably viable nonregulatory actions)...”
22 Circular A-4 states: “You should analyze the benefits and costs of different regulatory provisions separately when a rule includes a num-ber of distinct provisions.” (P. 17)
23 Circular A-4 states: “you generally should analyze at least three options: the preferred option; a more stringent option that achieves ad-ditional benefits (and presumably costs more) beyond those realized by the preferred option; and a less stringent option that costs less (and presumably generates fewer benefits) than the preferred option.” (P. 16)
24 Circular A-4 states: “You should consider setting different require-ments for large and small firms, basing the requirements on estimated differences in the expected costs of compliance or in the expected ben-efits. The balance of benefits and costs can shift depending on the size of the firms being regulated. Small firms may find it more costly to com-ply with regulation, especially if there are large fixed costs required for regulatory compliance. On the other hand, it is not efficient to place a heavier burden on one segment of a regulated industry solely because it can better afford the higher cost. This has the potential to load costs on the most productive firms, costs that are disproportionate to the dam-ages they create. You should also remember that a rule with a signifi-cant impact on a substantial number of small entities will trigger the requirements set forth in the Regulatory Flexibility Act. (5 U.S.C. 603(c), 604).” (P. 8)
25 Executive Order 12866, Section 1(a) states: “agencies should select those approaches that maximize net benefits (including potential eco-nomic, environmental, public health and safety, and other advantages; distributive impacts; and equity) unless a statute requires another regu-latory approach.”
26 Required under Executive Order 12866, Section 6(a)(3)(C)(iii): “An assessment, including the underlying analysis, of costs and benefits of potentially effective and reasonably feasible alternatives to the planned regulation, identified by the agencies or the public (including improv-ing the current regulation and reasonably viable nonregulatory actions), and an explanation why the planned regulatory action is preferable to the identified potential alternatives.”
Does the RIA use appropriate discount rates for ben-efits and costs that are expected to occur in the future? 27
Does the RIA include, if and where relevant, an appro-priate uncertainty analysis? 28
Does the RIA include, if and where relevant, a separate description of distributive impacts and equity? 29
Does the RIA provide a description/accounting of trans-fer payments? 30
27 Circular A-4 contains a detailed discussion, generally calling for discount rates of 7 percent and 3 percent for both benefits and costs. It states: “Benefits and costs do not always take place in the same time period. When they do not, it is incorrect simply to add all of the expected net benefits or costs without taking account of when they actually occur. If benefits or costs are delayed or otherwise separated in time from each other, the difference in timing should be reflected in your analysis.... For regulatory analysis, you should provide estimates of net benefits using both 3 percent and 7 percent.... If your rule will have important inter-generational benefits or costs you might consider a further sensitivity analysis using a lower but positive discount rate in addition to calculat-ing net benefits using discount rates of 3 and 7 percent.” (PP. 31, 34, 36)
28 Circular A-4 provides a detailed discussion. Among other things, it states: “Examples of quantitative analysis, broadly defined, would in-clude formal estimates of the probabilities of environmental damage to soil or water, the possible loss of habitat, or risks to endangered spe-cies as well as probabilities of harm to human health and safety. There are also uncertainties associated with estimates of economic benefits and costs, such as the cost savings associated with increased energy efficiency. Thus, your analysis should include two fundamental compo-nents: a quantitative analysis characterizing the probabilities of the rel-evant outcomes and an assignment of economic value to the projected outcomes.” (P. 40). Circular A-4 also states: “You should clearly set out the basic assumptions, methods, and data underlying the analysis and discuss the uncertainties associated with the estimates.” (P. 17)
29 Executive Order 12866, Section 1(b)(5) states; “When an agency determines that a regulation is the best available method of achiev-ing the regulatory objective, it shall design its regulations in the most cost-effective manner to achieve the regulatory objective. In doing so, each agency shall consider incentives for innovation, consistency, pre-dictability, the costs of enforcement and compliance (to the government, regulated entities, and the public), flexibility, distributive impacts, and equity” (emphasis added).
Circular A-4 states: “The term ‘distributional effect’ refers to the im-pact of a regulatory action across the population and economy, divided up in various ways (e.g., income groups, race, sex, industrial sector, geog-raphy)… Your regulatory analysis should provide a separate description of distributional effects (i.e., how both benefits and costs are distributed among sub-populations of particular concern) so that decision makers can properly consider them along with the effects on economic efficien-cy… Where distributive effects are thought to be important, the effects of various regulatory alternatives should be described quantitatively to the extent possible, including the magnitude, likelihood, and severity of impacts on particular groups.” (P. 14)
30 Circular A-4 states: “Distinguishing between real costs and trans-fer payments is an important, but sometimes difficult, problem in cost estimation. . . . Transfer payments are monetary payments from one group to another that do not affect total resources available to society. . . . You should not include transfers in the estimates of the benefits and costs of a regulation. Instead, address them in a separate discussion of the regulation’s distributional effects.” (P. 14)

104 ANALYTICAL PERSPECTIVES
Does the RIA analyze relevant effects on disadvan-taged or vulnerable populations (e.g., disabled or poor)? 31
Does the analysis include a clear, plain-language ex-ecutive summary, including an accounting statement that summarizes the benefit and cost estimates for the regula-tory action under consideration, including the qualitative and non-monetized benefits and costs? 32
31 Circular A-4 states: “Your regulatory analysis should provide a separate description of distributional effects (i.e., how both benefits and costs are distributed among sub-populations of particular concern) so that decision makers can properly consider them along with the effects on economic efficiency. Executive Order 12866 authorizes this approach. Where distributive effects are thought to be important, the effects of various regulatory alternatives should be described quantitatively to the extent possible, including the magnitude, likelihood, and severity of impacts on particular groups.” (P. 14)
32 Circular A-4 states: “Your analysis should also have an executive summary, including a standardized accounting statement.” (P. 3). OMB recommends that: “Regulatory analysis should be made as transparent as possible by a prominent and accessible executive summary—writ-ten in a “plain language” manner designed to be understandable to the public—that outlines the central judgments that support regulations, including the key findings of the analysis (such as central assumptions and uncertainties)…If an agency has analyzed the costs and benefits of regulatory alternatives to the planned action (as is required for econom-ically significant regulatory actions), the summary should include such information.” See 2010 Report to Congress on the Benefits and Costs of Federal Regulations and Unfunded Mandates on State, Local, and Tribal Entities, page 51. Available at: http://www.whitehouse.gov/sites/
Does the analysis include a clear and transparent ta-ble presenting (to the extent feasible) anticipated benefits and costs (quantitative and qualitative)? 33
default/files/omb/legislative/reports/2010_Benefit_Cost_Report.pdf33 Circular A-4 states: “You need to provide an accounting statement
with tables reporting benefit and cost estimates for each major final rule for your agency.” (P. 44). Circular A-4 includes an example of a for-mat for agency consideration. OMB recommends “that agencies should clearly and prominently present, in the preamble and in the executive summary of the regulatory impact analysis, one or more tables sum-marizing the assessment of costs and benefits required under Execu-tive Order 12866 Section 6(a)(3)(C)(i)-(iii). The tables should provide a transparent statement of both quantitative and qualitative benefits and costs of the proposed or planned action as well as of reasonable alter-natives. The tables should include all relevant information that can be quantified and monetized, along with relevant information that can be described only in qualitative terms. It will often be useful to accompany a simple, clear table of aggregated costs and benefits with a separate table offering disaggregated figures, showing the components of the ag-gregate figures. To the extent feasible in light of the nature of the is-sue and the relevant data, all benefits and costs should be quantified and monetized. To communicate any uncertainties, we recommend that the table should offer a range of values, in addition to best estimates, and it should clearly indicate impacts that cannot be quantified or mon-etized. If nonquantifiable variables are involved, they should be clearly identified. Agencies should attempt, to the extent feasible, not merely to identify such variables but also to signify their importance.” See 2010 Report to Congress on the Benefits and Costs of Federal Regulations and Unfunded Mandates on State, Local, and Tribal Entities, page 51. Available at: http://www.whitehouse.gov/sites/default/files/omb/legisla-tive/reports/2010_Benefit_Cost_Report.pdf

105
10. SOCIAL INDICATORS
The social indicators presented in this chapter illus-trate in broad terms how the Nation is faring in selected areas, including the economy, energy, the environment, health, and education, among others. The indicators shown in the tables in this chapter are only a subset drawn from the vast array of available data on conditions in the United States. In choosing indicators for these tables, priority was given to measures that were consis-tently available over an extended period. Such indicators make it easier to draw comparisons and establish trends.
The individual measures in these tables are influ-enced to varying degrees by many Government policies and programs, as well as by external factors beyond the Government’s control. They do not measure the outcomes of Government policies, because they do not show the di-rect results of Government activities, but they do provide a quantitative measure of the progress or lack of progress toward some of the ultimate ends that Government policy is intended to promote. The “Program Evaluation “and “Benefit-Cost Analysis” chapters of this volume discuss approaches toward assessing directly the impacts of par-ticular Government programs.
The President has made it clear that policy decisions should be based upon evidence—evidence about what the Nation’s greatest needs and challenges are and evidence about what strategies are working. The social indicators in this chapter provide useful information both for pri-oritizing budgetary and policymaking resources and for evaluating how well existing approaches are working.
Economic Conditions: The 2008-2009 economic down-turn produced the worst labor market in more than a gen-eration. Unemployment is higher than at any time in the past quarter century, and the employment-to-population ratio has fallen below 60 percent for the first time since 1984. Real GDP per capita has declined over the past five years.
Income and Wealth: Over the entire period from 1960 to 2011 shown in the tables the primary pattern has been one of rising living standards. Real disposable income per capita has more than tripled as technological prog-ress and the accumulation of human and physical capital have increased the Nation’s productive capacity. Average household net worth has more than doubled. But these gains have not been evenly distributed. Median house-hold income is up only 23 percent (since 1967) and was lower in 2010 than in 1997. The largest income gains have been concentrated among higher-income families and individuals. Similarly, the median wealth of house-holds in the decade before retirement has risen, but not nearly as rapidly as mean wealth. Changing household composition is partly responsible for these trends. The numbers of two-earner households and single-parent households have both increased. Stagnating wages for
low-skill workers are another reason why rising average incomes have not had more impact on the most economi-cally vulnerable Americans.
Economic Inequality: The rise in the share of national income received by those at the top of the income dis-tribution can be seen in the two inequality measures in Table 10-1. The share of income accruing to the lower 60 percent of households has fallen from 32.3 percent in 1970 to 26.4 percent in 2010. The income share of the top one percent of taxpayers has risen from around eight percent in the two decades between 1960 and 1980 to 18 percent in 2008. The poverty rate, which fell dramatically between 1960 and 1970, as the economy prospered and as Social Security and other safety-net programs expanded, is at about the same level as it was in 1966—despite the large increase in per capita income—and 15 percent of American households are food-insecure.
Setting the Stage for Future Prosperity: The Nation’s future economic prosperity depends on having a highly skilled workforce, an expanding stock of physical capital, including advanced infrastructure, and a business envi-ronment that encourages innovation. Environmental quality is also important for future well-being.
Saving: National saving is a key determinant of future prosperity because it supports capital accumulation. Table 10-1 shows that net national saving, which was already low by international standards when it averaged around 10 percent in the 1960s and 1970s, fell from 6.2 percent in 2000 to 2.0 percent in 2007 as Federal budget surpluses turned to deficits, and fell even further in the recession that followed. During the recent economic downturn, personal saving has rebounded to around 5 percent, but net national saving, which includes the Government’s dis-saving, has turned slightly negative. Despite the current low saving rate, previous saving has resulted in a large accumulation of physical capital. The stock of physical capital including consumer durable goods like cars and appliances amounted to $49 trillion in 2010, more than four times the size of the capital stock in 1960, after ac-counting for inflation.
Innovation: National Research and Development (R&D) spending has hovered between 2.5 percent and 2.8 percent of GDP for most of the past 50 years. Successful R&D can result in new innovations, which can also be en-couraged by patent protection. Patents encourage inno-vation by awarding an inventor the right to exclude oth-ers from the use of an invention unless compensated. The patent system also assures publication of patented ideas distributing knowledge that might otherwise be kept con-fidential. Patents by U.S. inventors have increased three-fold since 1960.
Environmental Quality: The Nation’s future well-be-ing and prosperity depends also on stewardship of our

106 ANALYTICAL PERSPECTIVES
natural resources, the environment, and on our ability to bring about a clean energy economy. The country has made major strides in improving air quality since the pas-sage of the Clean Air Act in 1970. Concentrations of the main criteria pollutants tracked by the Environmental Protection Agency have declined significantly since 1970. The largest decline was for lead, which was removed from gasoline, but there have also been large declines in the emissions of carbon monoxide, nitrogen oxides, and sul-fur dioxide. The air has become markedly cleaner in the United States as a result of this progress. Progress on improving water quality has also been noticeable as an increasing proportion of the population is served by im-proved water treatment facilities.
Moving forward, the greatest environmental challenge is reducing greenhouse gas emissions. In 2009, emissions were 5,618 teragrams. The President announced a target reduction of 17 percent in greenhouse gas emissions be-tween 2005 and 2020, with an ultimate reduction of 83 percent between 2005 and 2050. While technological advances and a shift in production patterns mean that Americans now use about half as much energy per real dollar of GDP as they did 50 years ago, rising income levels mean that per capita consumption has remained roughly constant. Only seven percent of U.S. energy pro-duction is from renewable sources.
Health, Education, and Civic Engagement: Table 10-2 focuses on additional national priorities: health, educa-tion, community involvement and civic engagement.
Health: The first three groups of indicators in this table show measures related to the Nation’s health. The United States devotes a large fraction of its income to health care, and that share has increased more than threefold since 1960. In the latest data, the share of GDP accounted for by health expenditures was 17.8 percent of GDP in 2009, and the share is projected to have remained near that lev-el in 2010-2011. This is the largest it has ever been and well above what other nations spend on health. Despite the large expenditures on health care, many Americans were unable to obtain health insurance. In 2010, about 50 million people, 16 percent of the U.S. population, lacked health insurance. In 2010, the President signed into law the Affordable Care Act, which is projected to reduce the number of uninsured by 32 million Americans.
The United States has seen progress over the last 50 years in some important indicators of health status. Infant mortality has fallen from 26 deaths per 1,000 live births in 1960 to less than 7 deaths since 2000. In 2009, infant mortality fell to all-time low of 6.4 per 1,000 live births. Life expectancy at birth has increased substantially, ris-ing by more than eight years since 1960, although it lags behind that in many other developed countries. Running counter to these positive trends, 21 percent of the adult population still smokes (a level below historic highs, but still troubling), and about 33 percent of the population is classified as obese according to criteria established by the Centers for Disease Control and Prevention, up from 15 percent twenty years ago.
Education: The Administration is committed to re-turning America to being number one in the world in
high school and college graduation rates and academic achievement, which is critical to long-term prosperity and growth. Between 1960 and 1980, the percentage of 18-24 year olds with a high school diploma increased from 60 percent to 81 percent, a gain of about 10 percentage points per decade. Progress has slowed since then with only a four percentage point gain over the past 30 years. College enrollment rates have continued to rise. In 1980 only a quarter of 18-24 year olds were enrolled in college. In the latest data that number was 41 percent. The most thorough measurement of education achievement is the National Assessment of Educational Progress (NAEP). These measures have been taken since the 1980s. They show only very gradual improvement in mathematics and no discernible progress in reading for American 17-year olds.
Housing: Americans are generally well housed, but some of the population faces housing problems. In 2009, about 5 percent of households with children lived in inad-equate housing as defined by the Census Bureau. These problems usually consisted of poor plumbing, inadequate heating, or other physical maintenance problems. About six percent of these households were experiencing over-crowding. Both measures were down from levels reported in the 1980s. However, many families have experienced increased housing costs relative to income. In 2009, 39 percent of families with children were spending more than 30 percent of reported income on housing and utili-ties, up from 17 percent in 1980.
Crime: Since 1980, there has been a remarkable de-cline in violent crime. The two crime measures shown in Table 10-2 are based on different types of record keep-ing. The murder rate is based on reported homicides com-piled by the Federal Bureau of Investigation from local law enforcement agencies, while the violent crime statis-tic is based on surveys of victims. The violent crime rate has declined to about 30 percent of its peak level in 1979. Meanwhile, the murder rate has been cut in half.
Families: Measures of family instability increased significantly up until around 1995. Since 1995, births to unmarried adolescents age 15 to 17 have dropped from around 30 per 1,000 women to about 19 per 1,000. After rising for more than three decades, the percentage of chil-dren living only with their mother stabilized at around 24 percent of all children from 1995 through 2009.
Charitable Giving: Americans increased their chari-table contributions at an average real rate of slightly less than two percent per year between 1960 and 2008; real GDP per capita grew by slightly more than two percent per year over that interval. Charitable giving measured in real terms dropped slightly in 2008 and again in 2009, as the recession and capital losses cut into family resourc-es, but the level of giving appears to have rebounded in 2010, and it remains above its level in 2006.
Voting: Another measure of American’s willingness to participate in civic activity, the voting rate for President, was at 64 percent in 1960, but averaged about 55 per-cent from 1972 through 2000 before rising to 60 percent in 2004 and 62 percent in 2008.

10. SOCIAL INDICATORS 107
Other Compilations of Economic and Social Indicators: There are many other sources of data on trends in American social and economic conditions, including the Statistical Abstract published annually by the Census Bureau (the Census Bureau has announced plans to cease publication of the Statistical Abstract following the 2012 volume). Some examples are described below. Cutting across a range of social and economic domains, the Interagency Forum on Child and Family Statistics annually assembles American’s Children: Key National Indicators of Well-Being (http://www.childstats.gov). The Interagency Forum on Aging-Related Statistics publishes Older Americans: Key Indicators of Well-Being every oth-er year (http://www.agingstats.gov/agingstatsdotnet/main_site/default.aspx).
There are also topic-specific indicators, which highlight performance in specific areas. Science and Engineering Indicators, published by the National Science Board, pro-vides a broad base of quantitative information on the U.S.
and international science and engineering enterprise: (http://www.nsf.gov/statistics/indicators). The Science Resources Statistics Division at the National Science Foundation is doing developmental work on measuring innovation, an important component of the scientific en-terprise not currently included in our measures. Healthy People 2020 within the Department of Health and Human Services offers a statement of national health objectives that identifies the most significant preventable threats to health and establishes national goals to reduce these threats. The National Center for Health Statistics an-nually publishes Health, United States (http://www.cdc.gov/nchs/hus.htm), a comprehensive compilation of health indicators. The National Center for Education Statistics within the Department of Education publish-es the Condition of Education (http://nces.ed.gov/pro-grams/coe). The website includes a set of indicators and also special analyses and a user’s guide.

108 ANALYTICAL PERSPECTIVES
Table 10–1. ECONOMIC AND SOCIAL INDICATORS
Calendar Years 1960 1970 1980 1990 1995 2000 2005 2009 2010 2011
Economic ConditionsLiving Standards:
1 Real GDP per person (2005 dollars) 1 ............................................................ 15,716 20,915 25,675 32,157 34,122 39,752 42,715 41,409 42,308 42,631average annual percent change (5-year trend) ........................................... 0.8 2.3 2.6 2.3 1.2 3.1 1.4 –0.2 –0.2 –0.4
2 Real disposable income per capita average (2005 dollars) 2 .............................. 10,860 15,151 18,855 23,557 24,939 28,886 31,318 32,141 32,446 32,495average annual percent change (5-year trend) ........................................... 1.2 3.2 2.0 1.8 1.1 3.0 1.6 0.6 0.7 0.1
3 Real median income: all households (2010 dollars) ....................................... N/A 43,055 44,616 48,423 48,408 53,164 51,739 50,599 49,445 N/Aaverage annual percent change (5-year trend) ........................................... N/A N/A 0.5 1.2 –0.0 1.9 –0.5 –0.2 –0.9 N/A
4 Poverty rate (%) 2 ............................................................................................ 22.2 12.6 13.0 13.5 13.8 11.3 12.6 14.3 15.1 N/A5 Food-insecure households (percent of all households) 3 ................................ N/A N/A N/A N/A 11.9 10.5 11.0 14.7 14.5 N/A
Jobs and Unemployment:6 Civilian unemployment rate (%) ...................................................................... 5.5 4.9 7.1 5.5 5.6 4.0 5.1 9.3 9.6 9.07 Unemployment plus marginally attached and underemployed (%) ........................... N/A N/A N/A N/A 10.0 7.0 8.9 16.3 16.8 15.98 Employment-population ratio % 4 .................................................................... 56.1 57.4 59.2 62.8 62.9 64.4 62.7 59.3 58.5 58.49 Payroll employment change - December to December (millions) ................... –0.4 –0.5 0.3 0.3 2.2 2.0 2.5 –5.1 0.9 1.610 Payroll employment change - 5-year annual average (millions) ..................... 0.2 1.7 2.6 2.1 1.8 2.9 0.5 –0.6 –0.9 –1.0
Economic Inequality:11 Income share of lower 60% of all households ................................................ N/A 32.3 31.2 29.3 28.0 27.3 26.6 26.6 26.4 N/A12 Income share of top 1% of all taxpayers ......................................................... 8.4 7.8 8.2 13.0 13.5 16.5 17.4 N/A N/A N/A
Wealth Creation:13 Net national saving rate (% of GDP) 5 ............................................................ 10.4 8.1 7.1 3.9 4.7 6.2 3.0 –1.9 –0.4 –0.314 Personal Saving Rate (% of Disposable Personal Income) 5 .............................. 7.2 9.4 9.8 6.5 5.2 2.9 1.5 5.1 5.3 4.515 Average household net worth (2011 dollars) 5 ................................................ 233,621 280,457 307,200 366,831 412,725 523,483 608,807 493,011 515,875 483,24916 Median wealth of households aged 55–64 (2009 dollars) 6 ............................ N/A N/A N/A 166,668 163,752 210,052 281,741 222,300 N/A N/A
Innovation:17 R&D spending (% of GDP) ............................................................................. 2.6 2.5 2.3 2.6 2.5 2.7 2.6 2.8 2.7 2.718 Patents issued to U.S. residents (thousands) ................................................. 42.3 50.6 41.7 56.1 68.2 103.6 88.5 107.0 132.5 N/A19 Multifactor productivity (average 5 year percent change) ............................... 1.0 0.9 0.8 0.7 0.5 1.3 1.8 0.2 0.6 N/A20 Nonfarm output per hour (average 5 year percent change) 1 ............................. 1.8 2.1 1.1 1.5 1.5 2.7 3.1 1.4 1.9 1.9
Capital and Infrastructure:21 Bridges that are structurally deficient or functionally obsolete (%) 7 ............... N/A N/A N/A N/A 31.8 28.6 26.3 24.8 24.3 N/A22 Real net stock of fixed assets and consumer durable goods ($2010 bils) ...... 11,257 16,430 22,639 29,946 33,316 39,209 45,155 48,872 49,324 N/A
Energy and Environment:Air Quality - Mean Pollution Concentration levels 8:
23 Carbon Monoxide (ppm) based on 104 monitoring sites ............................ N/A N/A 8.951 6.130 4.797 3.461 2.296 N/A N/A N/A24 Ground Level Ozone (ppm) based on 247 monitoring sites ............................ N/A N/A 0.101 0.089 0.090 0.082 0.080 0.070 0.073 N/A25 Lead (ug/m3) based on 31 monitoring sites ............................................... N/A N/A 1.338 0.525 0.357 0.270 0.194 0.226 0.144 N/A26 Nitrogen Dioxide (ppb) based on 81 monitoring sites ................................. N/A N/A 27.341 23.935 22.438 20.034 16.871 13.564 13.076 N/A
Particulate Matter (ug/m3):27 PM10 based on 279 monitoring sites .................................................... N/A N/A N/A 82.663 68.551 64.344 59.093 50.624 51.022 N/A28 PM 2.5 based on 646 monitoring sites .................................................. N/A N/A N/A N/A N/A 13.620 12.958 9.816 9.992 N/A29 Sulfur Dioxide (ppm) based on 141 monitoring sites .................................. N/A N/A 11.830 8.306 5.926 5.102 4.299 2.528 2.443 N/A
Water Quality:30 Population served by secondary treatment or better (millions) 6 ............... 53.4 85.9 117.9 154.4 163.3 189.1 205.2 208.0 210.2 212.5
Climate Change:31 Net greenhouse gas emissions (teragrams CO2 equivalent) 9 ................... N/A N/A N/A 5,320 5,928 6,536 6,157 5,618 N/A N/A32 Per capita greenhouse gas emissions (megagrams CO2 equivalent) ........ N/A N/A N/A 21.3 22.3 23.2 20.8 18.3 N/A N/A33 Per 2005$ of GDP greenhouse emissions (kilograms CO2 equivalent) ..... N/A N/A N/A 0.663 0.652 0.583 0.488 0.442 N/A N/A
Energy:34 Energy consumption per capita (millions of BTUs) .................................... 250 331 344 338 342 350 339 308 317 N/A35 Energy consumption per real dollar of GDP (thousands of BTUs) ............. 15.9 15.9 13.4 10.5 10.0 8.8 7.9 7.3 7.4 N/A36 Energy production from renewable sources (% of total) ............................. N/A N/A N/A N/A N/A N/A 6.4 8.2 7.5 N/A
1 Values for 2011 based on Administration projection for 2011.Q4 growth.2 The poverty rate does not reflect noncash government transfers.3 These households were unable to acquire adequate food to meet the needs of all their members at some time during the year because they had insufficient money or other resources
for food.4 Civilian employment as a percent of the civilian noninstitutional population age 16 and above.5 2011 through 2011.Q3 only.6 Data interpolated for some years.7 Bridges are structurally deficient if they have been restricted to light vehicles, require immediate rehabilitation, or are closed. They are functionally obsolete if they no longer meet the
criteria for the system of which the bridge is carrying a part.8 ppm -- parts per million; ug/m3 -- micrograms per cubic meter9 This is a net measure reflecting both sources and sinks of greenhouse gas.

10. SOCIAL INDICATORS 109
Table 10–2. ECONOMIC AND SOCIAL INDICATORS
Calendar Years 1960 1970 1980 1990 1995 2000 2005 2009 2010 2011
Access to Health Care:37 Total national health expenditures (percent of GDP) 1 .................................... 5.2 7.2 9.2 12.5 13.9 13.8 16.0 17.8 17.8 17.938 Percentage of population without health insurance ........................................ N/A N/A N/A 12.9 14.4 13.1 14.6 16.1 16.3 N/A39 % of children age 19–35 months with recommended immunizations 2 ........... N/A N/A N/A N/A N/A 72.8 80.8 71.9 N/A N/A
Health Status:40 Infant mortality (per 1000 live births) 3 ............................................................ 26.0 20.0 12.6 9.2 7.6 6.9 6.9 6.4 N/A N/A41 Low birthweight [<2,500 gms] percentage of babies ...................................... 7.7 7.9 6.8 7.0 7.3 7.6 8.2 8.2 8.1 N/A42 Life expectancy at birth (years) 3 .................................................................... 69.7 70.8 73.7 75.4 75.8 76.8 77.4 78.2 N/A N/A
Health Risks:43 Cigarette smokers (% population 18 and older) ............................................. N/A 39.2 32.7 25.3 24.6 23.1 20.8 20.6 N/A N/A44 Obesity (% of population with BMI over 30) 4 ................................................. 13.3 N/A 15.1 22.9 N/A 30.1 33.9 N/A N/A N/A45 Alcohol (% high school seniors engaged in heavy drinking) 5 ........................ N/A N/A 41.2 32.2 29.8 30.0 26.2 25.2 N/A N/A46 Physical activity: % of adults engaged in regular physical activity 6 ................ N/A N/A N/A N/A N/A 15.0 17.1 19.1 N/A N/A
Education:47 High school graduates (% of population 25 and older) ................................... 44.6 55.2 68.6 77.6 81.7 84.1 85.2 86.7 87.1 N/A48 Percentage of 18–24 year olds with a high school diploma ............................ 59.9 78.8 80.9 81.7 80.8 81.9 82.9 84.3 N/A N/A49 Percentage of 18–24 year olds enrolled in college ......................................... N/A 25.7 25.6 32.0 34.3 35.5 38.9 41.3 N/A N/A50 College graduates (% of population 25 and older) ......................................... 8.4 11.0 17.0 21.3 23.0 25.6 27.6 29.5 29.9 N/A
National Assessment of Educational Progress 7
51 Reading 17-year olds .................................................................................. N/A N/A 283 288 286 285 284 N/A N/A N/A52 Mathematics 17-year olds ........................................................................... N/A N/A 297 303 305 306 305 N/A N/A N/A
Housing:53 Percentage of families with children with inadequate housing 8 ..................... N/A N/A 9 9 7 7 5 5 N/A N/A54 Percentage of families with children with crowded housing ............................ N/A N/A 9 7 7 7 6 6 N/A N/A55 Percentage of families with children with costly housing 9 .............................. N/A N/A 17 25 28 28 34 39 N/A N/A
Crime:56 Violent crime rate (per 100,000 population 12 and older) 10 ........................... N/A N/A 4,940 4,410 4,610 2,740 2,100 1,690 1,490 N/A57 Murder rate (per 100,000 population) 11 ......................................................... 5.1 7.8 10.2 9.4 8.2 5.5 5.6 5.0 4.8 N/A
Families:58 Births to unmarried women age 15–17 (per 1,000) ........................................ N/A N/A 20.6 29.6 30.1 23.9 19.7 19.3 N/A N/A59 Children living with mother only (% of all children) ......................................... 9.2 11.6 18.6 21.6 24.0 22.3 23.4 24.4 25.2 N/A
Civic Engagement:60 Individual charitable giving per capita (2011 dollars) ..................................... 321 460 489 559 529 808 863 778 782 N/A61 Percentage of Americans volunteering 12 ....................................................... N/A N/A N/A 20.4 N/A N/A 27.0 26.8 26.3 N/A
(1960) (1968) (1972) (1976) (1980) (1984) (1988) (2004) (2008) (2012)
62 Voting for President by election year (% eligible population) 13 ..................... 63.8 61.5 56.2 54.8 54.2 55.2 52.8 60.1 61.7 N/A1 The 2010 and 2011 values are projected, the last actual data are for 2009.2 The 4:3:1:3:3 series consisting of 4 doses (or more) of diphtheria, tetanus toxoids, and pertussis (DTP) vaccines, diphtheria and tetanus toxoids (DT), or diphtheria, tetanus toxoids,
and any acellular pertussis (DTaP) vaccines; 3 doses (or more) of poliovirus vaccines; 1 dose (or more) of any measles-containing vaccine; 3 doses (or more) of Haemophilus influenzae type b (Hib) vaccines; and 3 doses (or more) of hepatitis B vaccines.
3 Data for 2009 are preliminary.4 BMI refers to body mass index. A BMI over 30 is the criterion for obesity used by the Centers for Disease Control and Prevention.5 Data are interpolated. Percentage of high school students who had five or more drinks in a row at least once within the two weeks prior to the survey. 6 Participation in leisure-time aerobic and muscle-strengthening activities that meet the 2008 Federal phyiscal activity guidelines for adults 18 years of age and over.7 Data are interpolated. Actual survey years were 1973, 1978, 1982, 1986, 1990, 1992, 1994, 1996, 1999, 2004, and 2008.8 Inadequate housing has moderate to severe physical problems, usually poor plumbing or heating or upkeep problems. Some data are interpolated.9 Expenditures for housing and utilities exceed 30 percent of reported income. Some data are interpolated.10 Includes crimes both reported and not reported to law enforcement. Offenses include homicide, rape, robbery, aggravated assault and simple assault.11 Based on reported crimes. Not all crimes are reported, and the fraction that go unreported may have varied over time, preliminary data for 2008.12 Data from 1974, 1989, and since 2005 are drawn from the Current Population Survey.13 As computed by Professor Michael McDonald, George Mason University, after adjusting the population for those not eligible to vote in Presidential elections.

110 ANALYTICAL PERSPECTIVES
Table 10–3. SOURCES FOR ECONOMIC AND SOCIAL INDICATORS
Indicator: Source:
Economic, Environmental, and Energy Indicators (Table 10–1):
Real GDP per person ....................................................................... U.S. Department of Commerce, Bureau of Economic Analysis, National Economic Accounts Data.Real disposable income per capita ................................................... U.S. Department of Commerce, Bureau of Economic Analysis, National Economic Accounts Data.Real median income: all households ................................................ U.S. Census Bureau, Housing and Household Economic Statistics DivisionPoverty rate ...................................................................................... U.S. Census Bureau, Housing and Household Economic Statistics DivisionFood-insecure households ............................................................... U.S. Census Bureau, Current Population Survey Food Security Supplement; tabulated by U.S. Department of
Agriculture, Economic Research ServiceCivilian unemployment rate .............................................................. U.S. Department of Labor, Bureau of Labor Statistics, Current Population Survey.Unemployment plus marginally attached and underemployed ......... U.S. Department of Labor, Bureau of Labor Statistics, Current Population Survey.Employment-population ratio ............................................................ U.S. Department of Labor, Bureau of Labor Statistics, Current Population Survey.Payroll employment .......................................................................... U.S. Department of Labor, Bureau of Labor Statistics, Current Employment Statistics program.Income share of lower 60% of all households .................................. U.S. Census Bureau, Housing and Household Economic Statistics DivisionIncome share of top 1% of all taxpayers ........................................... Thomas Piketty and Emanuel Saez, "Income Inequality in the United States, 1913-1998" Quarterly Journal of
Economics, 118(1), 2003, 1-39 (tables and figures updated to 2008, July 2010) Net national saving rate .................................................................... U.S. Department of Commerce, Bureau of Economic Analysis, National Economic Accounts Data.Personal Saving Rate ....................................................................... U.S. Department of Commerce, Bureau of Economic Analysis, National Economic Accounts Data.Average household net worth ........................................................... Board of Governors of the Federal Reserve System, Flow of Funds Accounts of the United States, and U.S. Census
Bureau, Housing and Economic Statistics Division.Median wealth of households aged 55-64 ........................................ Board of Governors of the Federal Reserve System, 2009 Survey of Consumer Finances Chartbook.R&D spending .................................................................................. National Science Foundation, Division of Science Resources Statistics, National Patterns of R&D ResourcesPatents issued to U.S. residents ....................................................... U.S. Patent and Trademark Office, Electronic Information Products Division, Patent Technology Monitoring Team,
submissions to the World Intellectual Property Organization.Multifactor productivity ...................................................................... U.S. Department of Labor, Bureau of Labor Statistics, Major Sector Productivity Program.Nonfarm output per hour .................................................................. U.S. Department of Labor, Bureau of Labor Statistics, Major Sector Productivity Program.Bridges that are structurally deficient or functionally obsolete .......... U.S. Federal Highway Administration, Office of Bridge Technology, "National Bridge Inventory."Real net stock of fixed assets and consumer durable goods ........... U.S. Department of Commerce, Bureau of Economic Analysis, National Economic Accounts Data.Carbon Monoxide ............................................................................. U.S. Environmental Protection Agency, Office of Air and Radiation, Air TrendsGround Level Ozone ......................................................................... U.S. Environmental Protection Agency, Office of Air and Radiation, Air TrendsLead .................................................................................................. U.S. Environmental Protection Agency, Office of Air and Radiation, Air TrendsNitrogen Dioxide ............................................................................... U.S. Environmental Protection Agency, Office of Air and Radiation, Air TrendsPM10 ................................................................................................ U.S. Environmental Protection Agency, Office of Air and Radiation, Air TrendsPM 2.5 .............................................................................................. U.S. Environmental Protection Agency, Office of Air and Radiation, Air TrendsSulfur Dioxide ................................................................................... U.S. Environmental Protection Agency, Office of Air and Radiation, Air TrendsPopulation served by secondary treatment or better ........................ U.S. Environmental Protection Agency, Clean Watersheds Needs Survey 2008 Report to Congress, June 10, 2010
(includes a projection for 2028) EPA-832-R-10-002.Net greenhouse gas emissions ........................................................ U.S. Environmental Protection Agency, 2010 Inventory of Greenhouse Gases Emissions and Sinks: 1990-2008.Energy consumption per capita ........................................................ U.S. Energy Information Administration, Annual Energy Review 2009, August 19, 2010 energy overview table 1.5.Energy consumption from renewable sources .................................. U.S. Energy Information Administration, Independent Statistics and Analysis
Health, Education, and Other Social Indicators (Table 10–2):
Total national health expenditures .................................................... Centers for Medicare and Medicaid Services, National Health Expenditures Data, January 2011.Percentage of population without health insurance .......................... U.S. Census Bureau, Housing and Household Economic Statistics Division% of children age 19-35 months with recommended immunizations ..... Childstats.gov, Forum on Child and Family StatisticsInfant mortality .................................................................................. Centers for Disease Control and Prevention, National Vital Statistics ReportLow birthweight percentage of babies .............................................. Centers for Disease Control and Prevention, National Vital Statistics ReportLife expectancy at birth ..................................................................... Centers for Disease Control and Prevention, National Vital Statistics ReportCigarette smokers (% population 18 and older) ............................... Health United States 2010, U.S. Department of Health and Human Services, Centers for Disease Control and
Prevention, National Center for Health StatisticsObesity (% of population with BMI over 30) (d) ................................ Health United States 2010, U.S. Department of Health and Human Services, Centers for Disease Control and
Prevention, National Center for Health Statistics% high school students engaged in heavy drinking .......................... Health United States 2010, U.S. Department of Health and Human Services, Centers for Disease Control and
Prevention, National Center for Health Statistics% of adults engaged in regular physical activity ............................... Health United States 2010, U.S. Department of Health and Human Services, Centers for Disease Control and
Prevention, National Center for Health StatisticsHigh school graduates (% of population 25 and older) ..................... U.S. Census Bureau, Current Population SurveyPercentage of 18-24 year olds with a high school diploma .............. U.S. Census Bureau, Current Population SurveyPercentage of 18-24 year olds enrolled in college ............................ U.S. Census Bureau, Current Population SurveyCollege graduates (% of population 25 and older) ........................... U.S. Census Bureau, Current Population SurveyNAEP: Reading 17-year olds ............................................................ National Assessment of Educational Progress, National Center for Education Statistics

10. SOCIAL INDICATORS 111
Table 10–3. SOURCES FOR ECONOMIC AND SOCIAL INDICATORS—Continued
Indicator: Source:
NAEP: Mathematics 17-year olds ..................................................... National Assessment of Educational Progress, National Center for Education StatisticsPercentage of families with children with inadequate housing ......... U.S. Census Bureau, American Housing Survey. Tabulated by U.S. Department of Housing and Urban DevelopmentPercentage of families with children with crowded housing .............. U.S. Census Bureau, American Housing Survey. Tabulated by U.S. Department of Housing and Urban DevelopmentPercentage of families with children with costly housing .................. U.S. Census Bureau, American Housing Survey. Tabulated by U.S. Department of Housing and Urban DevelopmentViolent crime rate (per 100,000 population 12 and older) ................ U.S. Department of Justice, Bureau of Justice Statistics, Violent Crime Trends Murder rate (per 100,000 population) ............................................... U.S. Department of Justice, Federal Bureau of Investigation, Criminal Justice Information Services DivisionBirths to unmarried women age 15-17 (per 1,000) ........................... Centers for Disease Control and Prevention, National Vital Statistics ReportChildren living with mother only ........................................................ Annual Social and Economic Supplement to the Current Population Survey, Detailed Poverty Tabulations various
yearsIndividual Charitable Giving .............................................................. Statistical Abstract 2012, Center on Philanthropy at Indiana University, Giving USA.Percentage of Americans volunteering ............................................. Corporation for National and Community Service, "Volunteer Growth in America: A Review of Trends since 1974"
based on the Current Population Survey.Voting for President by election year (% eligible population) ........... The United States Elections Project, Dr. Michael McDonald, George Mason University, Fairfax, Virginia.


113
11. IMPROVING THE FEDERAL WORKFORCE
The United States has overcome great challenges throughout our history because Americans of every gen-eration have stepped forward to aid their Nation through service, both in civilian government and in the Uniformed Services. Today’s Federal public servant carries forward that proud American tradition. Whether it is defending our homeland, restoring confidence in our financial sys-tem and supporting an historic economic recovery effort, providing health care to our veterans, or searching for cures to the most vexing diseases, we are fortunate to be able to rely upon a skilled workforce committed to public service.
A high-performing government depends on an engaged, well-prepared, and well-trained workforce with the right set of skills for the missions the government needs to achieve. However, tight fiscal resources, rapidly chang-ing problems, and new technologies that change the way a program can be delivered are all challenges the Federal workforce must address. This chapter discusses trends in Federal employment, composition, and compensation, and presents the Administration’s plans for achieving the talented Federal workforce needed to serve the American people effectively and efficiently.
Trends in Federal Employment
The size of the Federal civilian workforce relative to the country’s population has declined dramatically over
the last several decades, notwithstanding occasional up-ticks due, for example, to military conflicts and the enu-meration of the Census. In the 1950s and 1960s, there were on average 92 residents for every Federal worker. In the 1980s and 1990s, there were on average 106 resi-dents for every Federal worker. By 2011, the ratio had increased to 145 residents for every Federal worker. Since the 1950s and 1960s, the U.S. population increased by 76 percent, the private sector workforce surged 133 percent, while the size of the Federal workforce rose just 11 per-cent. Relative to the private sector, the Federal workforce is less than half the size it was back in the 1950s and 1960s. The picture that emerges is one of a Federal civil-ian workforce whose size has significantly shrunk com-pared to the size of the overall U.S. population, the private sector workforce, and the size of Federal expenditures.
Chart 11-1 shows Federal civilian employment (exclud-ing the U.S. Postal Service) as a share of the U.S. resident population from 1958 to 2011. The chart shows the over-all decline noted above in both security and non-security agencies.
Except for employment peaks associated with the de-cennial census, Federal employment, in absolute terms, increased slightly in the 1980s and then dropped in the 1990s. This overall downward trend began to reverse it-self in 2001, following the September 11 attack. Following that tragic event, the Federal workforce expanded to deal with national security and homeland safety issues
1958 1962 1966 1970 1974 1978 1982 1986 1990 1994 1998 2002 2006 20100.0%
0.2%
0.4%
0.6%
0.8%
1.0%
1.2%
1.4%Overall
Security Agencies
Non-Security Agencies
Chart 11-1. Federal Civilian Workforceas Share of U.S. Population
Percent
Source: Office of Personnel Management.Notes: Security agencies include the Department of Defense, the Department of Homeland Security,
the Department of State, and the Department of Veterans Affairs. Nonsecurity agencies include the remainder of the Executive Branch.

114 ANALYTICAL PERSPECTIVES
and to serve our veterans. Between 2001 and 2011, se-curity agency employment grew, while non-security em-ployment declined. For example, civilians working for the Department of the Army grew by more than 60,000, with a similar level of increase in people working for the Veterans Health Administration. Customs and Border Protection also grew more than 30,000 to keep our citi-zens safe at home.
Following this decade of growth, total Federal employ-ment levels flattened out with minimal year-to-year shifts in 2012 and 2013. Table 11-2 shows actual Federal civil-ian full-time equivalent (FTE) employment levels in the Executive Branch by agency for 2010 and 2011, with esti-mates for 2012 and 2013. Estimated employment levels for 2013 result in nearly flat levels – a 0.1 percent in-crease when compared to the prior year. Capped levels of budget authority enacted through the Budget Control Act (BCA) and in the 2013 Budget are having a direct impact on FTE levels in all agencies. Among the 34 departments and agencies presented in Table 11-2, increases exist in less than one-third. Among the 15 Cabinet agencies, in-creases of more than 1 percent exist at only four – the Departments of Veterans Affairs (VA), Commerce (DOC), Health and Human Services (HHS), and the Treasury.
In security agencies, limited increases in VA and the Department of Homeland Security correlate with in-creased demand for services in veterans’ medical care and continued emphasis on strengthening air travel safety and border protection. Even prior to the enactment of the BCA, in January 2011, the Department of Defense (DOD) initiated a policy to reduce staffing with the goal of hold-ing to 2010 levels for most of the Department. The gradu-ated reductions estimated by DOD in both 2012 and 2013 seek to achieve this goal while minimizing the impact on the workforce and the communities in which those work-ers live.
Beyond the security agencies, 2013 increases in nonse-curity agencies are narrowly focused and are frequently supported by congressionally-authorized fees, not taxpay-er dollars. Increased receipts from fees support timely commercialization of innovative technologies through faster and higher-quality patent reviews at the Patent and Trade Office of DOC, stronger food safety measures at the Food and Drug Administration of HHS, and enhance-ments to create stronger, more stable financial markets consistent with the Wall Street Reform Act. Increases in the category listed as “All other small agencies” in Table 11-2 are similarly driven by efforts to reform Wall Street and protect its customers. Commitments to activate new Federal prisons already constructed with funding appro-priated as early as 2001 and as recently as 2010, result in limited necessary personnel increases at the Department of Justice in 2012 and 2013. And stepping up Internal Revenue Service (Treasury) program integrity efforts to ensure companies and individuals are paying their fair share is an investment that more than pays for itself and will result in a five-to-one increase in tax revenues.
Beneath many of the staffing toplines are programs that pursue aggressive actions to reduce and reallocate staff from lower to higher priority programs. Some agen-
cies have imposed hiring freezes, others are using replace-ment ratios to allow fewer hires than separations, and many are offering early retirement and separation incen-tives. Across the Government, agencies are embracing a variety of workforce reduction tools to bring their person-nel levels down. These complement other aggressive cost-saving measures across all agencies such as real estate closures, consolidation of back-office functions, and stra-tegic sourcing, as well as agency-specific initiatives, such as the Department of Agriculture’s Blueprint for Stronger Service to streamline operations, launched in January 2012, which involves consolidating more than 200 offices across the country while ensuring that the most vital ser-vices the offices provide continue.
Federal Pay Trends
After more than a decade when the percentage increase in annual Federal pay raises did not keep pace with the percentage increase in private sector pay raises, Congress passed the Federal Employees Pay Comparability Act of 1990 (FEPCA) pegging Federal pay raises, as a default, to changes in the 15-month-lagged Employment Cost Index (ECI) series of wage and salaries for private industry workers, and to locality pay adjustments. The ECI mea-sures private sector pay, holding constant industry and occupation composition. The law gives the President the authority to propose alternative pay adjustments for both base and locality pay. Presidents have regularly proposed alternative pay plans. Chart 11-2 shows how the Federal pay scale has compared to the ECI since 1990.
In late 2010, as one of several steps the Administration took to put the Nation on a sustainable fiscal path, the President proposed and Congress enacted a two-year freeze on across-the-board pay adjustments for civilian Federal employees. This has created structural savings in the Budget of $60 billion over 10 years. The President also issued a memorandum directing agencies to freeze pay schedules and forgo general pay increases for civilian Federal employees in administratively determined pay systems.
For 2013, the President is proposing a 0.5 percent pay increase. While modest, the Administration’s decision to propose an increase in pay for civilian Federal employees reflects the understanding that while the continuation of a pay freeze was unsustainable, the tight fiscal environ-ment required a responsible approach that enables the investment needed to spur jobs and economic growth for decades to come. This pay increase proposal permits sav-ings of approximately $28 billion over 10 years and $2 billion in 2013 within the BCA caps, reallocated to pri-orities and services the American people depend on and that would not otherwise have been available under the spending caps. Proposing a pay increase below the level of the private sector (or ECI) was not taken lightly, given the two-year pay freeze in 2011 and 2012 -- but recognizes the real constraints of the current budget situation.
The 2013 Budget also includes a deficit reduction proposal that would dedicate an additional 1.2 percent of employee salary (phased-in at 0.4 percent over three years) for contri-

11. IMPROVING THE FEDERAL WORKFORCE 115
butions toward retirement benefits. This change in employ-ee contribution levels would not change the amount of each Federal employee’s pension benefit, but would result in $21 billion over 10 years in mandatory savings.
Composition of the Federal Workforce and Factors Affecting Federal Pay
Federal worker compensation receives a great deal of attention, in particular, in comparison to that of private sector workers. Comparisons of the pay of Federal em-ployees and private sector employees, for example, should account for factors affecting pay, such as differences in skill levels, complexity of work, scope of responsibility, size of organization, location, experience level, and expo-sure to personal danger. Some of the factors affecting pay are discussed below.
Type of occupation. The last half century has seen significant shifts in the composition of the Federal work-force, with related effects on pay. Fifty years ago, most white-collar Federal employees performed clerical tasks, such as posting Census figures in ledgers and retriev-ing taxpayer records from file rooms. Today their jobs are vastly different, requiring advanced skills to serve a knowledge-based economy. Professionals such as doctors, engineers, scientists, statisticians, and lawyers now make up a large portion of the Federal workforce. Between 1981 and 2011, the proportion of the Federal workforce in cleri-cal occupations fell from 19.4 percent to 5.1 percent of the workforce, and the proportion of blue-collar workers fell from 22.0 percent to 9.7 percent.
Today, a large number of Federal employees must man-age highly sensitive tasks that require great skill, experi-ence, and judgment. Federal employees increasingly need
sophisticated management and negotiation skills to affect change, not just across the Federal Government, but also with other levels of government, not-for-profit providers, and for-profit contractors. Using data from the Current Population Survey 2007-2011 of full-time, full-year work-ers, Table 11-1 breaks all Federal and private sector jobs into 22 occupation groups. That breakdown shows that Federal and private sector workers do very different types of work. More than half (55 percent) of Federal work-ers work in the nine highest-paying occupation groups as judges, engineers, scientists, nuclear plant inspectors, etc., compared to about a third (33 percent) of private sec-tor workers in those same nine highest paying occupation groups. In contrast, 46 percent of private sector work-ers work in the seven lowest-paying occupation groups as cooks, janitors, service workers, clerks, laborers, manufac-turing workers, etc. About 27 percent of Federal workers work in those seven lowest-paying occupation groups.
Education level. The size and complexity of much Federal work necessitates a highly educated workforce whether that work is analyzing security and financial risks, forecasting weather, planning bridges to withstand extreme weather events, conducting research to advance human health and energy efficiency, or advancing sci-ence to fuel future economic growth. Chart 11-3 presents the comparative differences in the education level of the Federal civilian and private sector workforce. About 21 percent of Federal workers have a master’s degree, pro-fessional degree, or doctorate versus only 9 percent in the private sector. Only one-in-five Federal employees has not attended college, whereas 41 percent of workers in the private sector have not attended college.
Size of organization and responsibilities. Another important difference between Federal workers and pri-
1990 1993 1996 1999 2002 2005 2008 20110.0%
1.0%
2.0%
3.0%
4.0%
5.0%
6.0%
Federal Pay Employment Cost Index (15-month lag)
Chart 11-2. Pay Raises for Federal vs.Private Workforce
Year-over-year percent change
Source: Public Laws, Executive Orders, and the Bureau of Labor Statistics.Notes: Federal pay is for civilians and includes base and locality pay. Employment Cost Index is
the wages and salaries, private industry workers series.

116 ANALYTICAL PERSPECTIVES
vate sector workers is the average size of the organiza-tions in which they work. Federal agencies are large and often face challenges of enormous scale, such as distribut-ing benefit payments to over 60 million Social Security and Supplemental Security Income beneficiaries each year, providing medical care to 8.8 million of the Nation’s veterans, and managing defense contracts costing billions of dollars. Workers from large firms (those with 1,000 or more employees) are paid about 14 percent more than workers from small firms (those with fewer than 100 em-ployees), even after accounting for occupational type, level of education, and other characteristics.
Demographic characteristics. Federal workers tend to have demographic characteristics associated with higher pay in the private sector. They are more experi-enced, older and live in higher cost metropolitan areas. For example, 22 percent of Federal workers are 55 or old-er – up from 15 percent 10 years ago and significantly
more than the 18 percent in the private sector. Chart 11-4 shows the difference in age distribution between Federal and private sector workers.
Challenges
With the backdrop of tightening fiscal constraints, the Federal Government faces specific human capital chal-lenges, including an aging and retiring workforce and a personnel system that requires further modernization. If the Government loses top talent, experience, and institu-tional memory through retirements, but cannot recruit, retain, and train highly qualified workers, Government performance suffers. While the age distribution and po-tential for a large number of retiring workers poses a challenge, it also creates an opportunity to streamline the workforce and to infuse it with new – and in some cases lower-cost – workers excited about Government service
Table 11–1. OCCUPATIONS OF FEDERAL AND PRIVATE SECTOR WORKFORCES (Grouped by Average Private Sector Salary)
Occupational Groups
Percent
Federal Workers
Private Sector Workers
Highest Paid Occupations Ranked by Private Sector SalaryLawyers and judges ........................................................................................................................... 1.7% 0.6%Engineers .......................................................................................................................................... 4.1% 1.9%Scientists and social scientists .......................................................................................................... 4.8% 0.6%Managers ........................................................................................................................................... 11.2% 13.2%Doctors, nurses, psychologists, etc. .................................................................................................. 7.4% 5.1%Miscellaneous professionals ............................................................................................................. 15.1% 8.0%Administrators, accountants, HR personnel ...................................................................................... 7.0% 2.6%Pilots, conductors, and related mechanics ........................................................................................ 2.0% 0.8%Inspectors .......................................................................................................................................... 1.2% 0.3%
Total Percentage ................................................................................................................................... 54.5% 33.1%
Medium Paid Occupations Ranked by Private Sector SalarySales including real estate, insurance agents ................................................................................... 1.0% 6.6%Other miscellaneous occupations ...................................................................................................... 3.2% 4.4%Automobile and other mechanics ...................................................................................................... 1.8% 3.0%Law enforcement and related occupations ........................................................................................ 8.5% 0.8%Office workers .................................................................................................................................... 2.5% 6.3%Social workers ................................................................................................................................... 1.5% 0.5%
Total Percentage ................................................................................................................................... 18.5% 21.5%
Lowest Paid Occupations Ranked by Private Sector SalaryDrivers of trucks and taxis ................................................................................................................. 0.7% 3.4%Laborers and construction workers ................................................................................................... 4.4% 10.4%Clerks ................................................................................................................................................ 14.2% 11.4%Manufacturing .................................................................................................................................... 2.5% 7.8%Other miscellaneous service workers ................................................................................................ 2.5% 6.3%Janitors and housekeepers ................................................................................................................ 1.6% 2.4%Cooks, bartenders, bakers, and wait staff ......................................................................................... 0.9% 4.0%
Total Percentage ................................................................................................................................... 26.8% 45.7%Source: 2007–2011 Current Population Survey.Notes: Federal workers exclude the military and Postal Service, but include all other Federal workers in the Executive, Legislative,
and Judicial Branches. However, the vast majority of these employees are civil servants in the Executive Branch. Private sector workers exclude the self-employed. Neither category includes state and local government workers. This analysis is limited to full-time, full-year workers, i.e. those with at least 1,500 annual hours of work.

11. IMPROVING THE FEDERAL WORKFORCE 117
0% 5% 10% 15% 20% 25% 30% 35%
FederalPrivate
Chart 11-3. Education Level Distribution in Federal vs. Private Workforce
Doctorate/Professional
Masters
Bachelors
Some College/Associates
High School
Less than HighSchool
Source: 2007-2011 Current Population Survey.Notes: Federal workers exclude the military and Postal Service, but include all other
Federal workers in the Executive, Legislative, and Judicial Branches. However, the vast majority of these employees are civil servants in the Executive Branch. Private sector workers exclude the self-employed. Neither category includes state and local government workers. This analysis is limited to full-time, full-year workers, i.e. those with at least 1,500 hours of work.
and equipped with strong technology skills, problem-solv-ing ability, and fresh perspectives to tackle problems that Government must address.
To address issues in the long-term, Federal manag-ers and employees need to rely on a modernized person-nel system. To that end, the Administration proposed to the Joint Select Committee on Deficit Reduction that the Congress establish a Commission on Federal Public Service Reform comprised of Members of Congress, rep-resentatives from the President’s National Council on Federal Labor-Management Relations, members of the private sector, and academic experts. The Commission would develop recommendations on reforms to modernize Federal personnel policies and practices within fiscal con-straints, including, but not limited to compensation, staff development and mobility, and personnel performance and motivation.
This section discusses two major Federal workforce challenges, and the following section describes actions this Administration is taking to address those challenges.
Aging Workforce
As discussed above, the Federal workforce of 2011 is older than Federal workforces of past decades and older than the private sector workforce. The number of Federal retirements is on a slow and steady increase, rising from 95,425 in 2009 to 96,133 in 2010 and 98,731 in 2011.
Given these demographics, the Federal Government faces two immediate challenges: preparing for retire-ments to maximize knowledge transfer from one genera-tion to the next, and hiring and developing the next gen-
eration of the Government workforce to accomplish the varied and challenging missions the Federal Government must deliver.
Developing and Engaging Personnel to Improve Performance
One well-documented challenge in any organization is managing a workforce so it is engaged, innovative, and committed to continuous improvement, while at the same time dealing with poor performers who fail to improve as needed. Federal employees are generally positive about the importance of their work and express a high readi-ness to put in extra effort to accomplish the goals of their agencies. Results from the Federal Employee Viewpoint Survey (EVS) indicate 92 percent of respondents answer positively to the statement “The work I do is important.” and nearly 97 percent of respondents answer positively to the statement “When needed I am willing to put in the ex-tra effort to get a job done.” However in contrast, Federal employees have repeatedly identified the inability to deal with poor performers as an area of weakness over the past 10 years. In 2011, only 31 percent of employees sampled in the EVS answered positively that “In my work unit, steps are taken to deal with a poor performer who cannot or will not improve.” In addition, only 41 percent agreed that “creativity and innovation are rewarded”. Over the past year, the Office of Personnel Management (OPM) and the Office of Management and Budget (OMB) have jointly met with agencies to review agency progress on their ac-tion plans to address weaknesses identified through the EVS.

118 ANALYTICAL PERSPECTIVES
Less than 35 35-54 55 or more0%
10%
20%
30%
40%
50%
60%
70%Private SectorFederal Workers
Chart 11-4. Federal vs. Private Age DistributionPercent
Source: 2011 Current Population Survey (covering calendar year 2010).Notes: Federal workers exclude the military and Postal Service, but include all other Federal
workers in the Executive Branch. Private sector workers exclude the self-employed. Neither category includes state and local government workers. This analysis is limited to full-time, full-year workers, i.e. those with at least 1,500 annual hours of work.
Progress Improving Employee Performance and Human Capital Management
The Administration has made considerable prog-ress improving employee performance and human capi-tal management through multiple efforts, including: strengthened labor-management partnerships, better alignment between employee performance and organi-zational performance objectives, increased agency use of personnel data for decision-making, better hiring practic-es, heightened attention to a diverse and inclusive work-force, and a new Senior Executive Service (SES) perfor-mance appraisal system.
Strengthening Labor-Management Relations
On December 9, 2009, the President issued Executive Order 13522 “Creating Labor-Management Forums to Improve the Delivery of Government Services”. Cooperative labor-management forums have been formed across the Federal Government to resolve workplace is-sues and improve mission performance and service deliv-ery to the American public. The Administration developed guidelines to help each forum define its objectives and measure results along three dimensions: mission accom-plishment, employee perceptions, and labor-management relations. Training opportunities have been provided to support these efforts. For example, VA and the Federal Labor Relations Authority made web-based training available at no cost across the Executive Branch.
In addition, a working group of the National Council on Federal Labor-Management Relations partnered with members of the Chief Human Capital Officers Council to recommend a new employee performance manage-
ment framework, referred to as the Goals-Engagement-Accountability-Results framework. Elements of this framework are now being tested by several pilot agencies, including VA, OPM, the Coast Guard, the Department of Housing and Urban Development, and the Department of Energy.
Developing and Using Personnel Analytics
The Administration is committed to strengthening Federal agencies’ capacity to analyze human resources data to address workplace problems, improve productiv-ity, and cut costs. The Federal Government began annual administration of the EVS in 2010 to make it more use-ful as a managerial tool to help agencies identify areas of personnel management strength and weakness. In 2011, to enhance its value, the survey was administered in a way that provided more managers with EVS informa-tion specific to their organizational unit. In 2012, OPM will survey all permanent civilian employees, rather than sampling as it did in 2011, to increase further agencies’ ability to pinpoint areas of strength and weakness. In ad-dition, Performance.gov provides agencies and the pub-lic a window on key human resources data – including Government-wide and agency-specific hiring times, ap-plicant and manager satisfaction, employee engagement and retention, diversity and disability, and veterans hir-ing and employment.
Building a Workforce with the Skills Necessary to Meet Agency Missions
The demands of the workplace necessitate new and evolving skill sets in the workforce of the Federal Government. The Government Accountability Office has

11. IMPROVING THE FEDERAL WORKFORCE 119
identified critical employee skills gaps as an area of high risk. As a result, the Administration has established a Cross-Agency Priority Goal in this area and OPM will lead the multiagency effort to close critical skills gaps across the Federal Government. OPM and the Chief Human Capital Officers Council will develop and imple-ment a Government-wide plan to achieve this goal.
This effort will build on progress already being made closing critical skills gaps in acquisition and information technology (IT). Spending on Federal contracts nearly dou-bled between 2001 and 2008, while the acquisition work-force responsible for negotiating, awarding, and managing these contracts remained essentially flat. While private sector contractors provide a wide range of services to help Federal employees carry out agency missions and oper-ations, such as scientific research, IT support, and con-struction services, the lag in building a skilled acquisition workforce that kept pace with contracting requirements contributed to ineffective and wasteful contracting prac-tices and imbalances in our relationship with contractors. Over the past three years, this Administration has worked to reverse this trend and restore accountability and fiscal responsibility. Through a focus on building the capacity and capability of the acquisition workforce and other key initiatives, the Federal Government reduced spending in Government contracting in 2010 for the first time in 13 years, reduced the use of many high-risk contracting practices, and made other significant improvements to the Federal contracting process. Continuing these and other efforts to increase efficiencies in Federal contracting -- while achieving further savings through the Campaign to Cut Waste -- depends on a strong, well-trained acquisi-tion workforce, and the Administration continues to un-dertake the human capital planning and actions needed to improve Federal contracting.
The Administration is also committed to building a more efficient and effective 21st Century Government for the American people through the strategic use of IT, and strengthening the IT workforce is a key element in its plan to reform Federal IT management. To ensure we have experienced and talented managers to oversee large, com-plex IT investments and maximize the return on taxpayer dollars at every step in the process, the Administration created a new role for IT program managers with rigorous requirements. In addition, the Presidential Technology
Fellows Program was launched to reduce the barriers to entering public service and to provide highly talented technology professionals access to unique career opportu-nities in a variety of Federal agencies. The Entrepreneur-in-Residence program was also initiated, which enables the Government to capitalize on subject matter experts across various communities to bring innovative practices and technologies into the Government.
A Diverse and Inclusive Workforce
The American people are best served by a Federal workforce that reflects the rich diversity of the populace and encourages collaboration, fairness, and innovation. Pursuant to the President’s Executive Order 13583, signed in August 2011, the first Government-wide Diversity and Inclusion Strategic Plan was issued and provides agen-cies with the shared goals of workforce diversity, work-place inclusion, and sustainability. The Strategic Plan efforts will focus on outreach, recruitment, and career de-velopment to draw from all segments of society, including those who are underrepresented, as well as on the reten-tion, inclusion, and leadership development of all Federal employees.
New Senior Executive Service Performance Appraisal System
In January 2012, OPM and OMB issued a standard Government-wide SES performance appraisal system to meet the SES performance management needs of all agencies and their SES employees. An interagency work group developed this system after examining a num-ber of current SES performance management systems at several agencies and benchmarking with the private sector through the President’s Management Advisory Board, a group of private sector leaders that advise the Government on management best practices. The new sys-tem will provide a consistent and uniform framework for agencies to communicate expectations and evaluate the performance of SES members, particularly centering on the role and responsibility of SES employees to provide executive leadership. The new system will also provide the necessary flexibility and enable appropriate custom-ization. Agencies will have the opportunity to transition to this new system over the next year or two as their cur-rent system certifications expire, or earlier if desired.

120 ANALYTICAL PERSPECTIVES
Table 11–2. FEDERAL CIVILIAN EMPLOYMENT IN THE EXECUTIVE BRANCH(Civilian employment as measured by FTEs in thousands, excluding the Postal Service)
Agency Actual EstimateChange:
2012 to 2013
2010 2011 2012 2013 FTE Percent
Cabinet agencies:Agriculture ..................................................... 96.3 95.9 93.3 92.3 –1.0 –1.1%Commerce ..................................................... 123.3 41.3 40.5 42.0 1.5 3.7%Defense ......................................................... 741.4 771.3 764.3 756.8 –7.5 –1.0%Education ....................................................... 4.1 4.4 4.3 4.3 0.0 0.0%Energy ........................................................... 16.1 16.1 16.5 16.4 –0.1 –0.6%Health and Human Services .......................... 66.1 68.8 70.1 71.5 1.4 2.0%Homeland Security ....................................... 173.0 179.5 187.5 188.9 1.4 0.7%Housing and Urban Development .................. 9.5 9.5 9.4 9.4 0.0 0.0%Interior ........................................................... 70.9 70.5 70.4 69.8 –0.6 –0.9%Justice ........................................................... 113.4 116.3 117.9 118.6 0.7 0.6%Labor ............................................................. 16.9 16.9 17.4 17.4 0.0 0.0%State .............................................................. 31.6 32.4 32.4 32.5 0.1 0.3%Transportation ................................................ 57.2 57.4 57.7 57.9 0.2 0.3%Treasury ......................................................... 111.9 110.7 108.2 111.8 3.6 3.3%Veterans Affairs ............................................. 284.8 295.7 302.3 306.6 4.3 1.4%
Other agencies—excluding Postal Service:
Broadcasting Board of Governors ................. 1.9 1.9 2.0 1.9 –0.1 –5.0%Corps of Engineers—Civil Works .................. 23.6 23.7 23.0 22.7 –0.3 –1.3%Environmental Protection Agency .................. 17.2 17.3 17.1 17.1 0.0 0.0%Equal Employment Opportunity Comm ......... 2.4 2.5 2.4 2.4 0.0 0.0%Federal Deposit Insurance Corporation ......... 7.1 8.3 8.7 8.4 –0.3 –3.4%General Services Administration ................... 12.5 12.7 13.2 13.0 –0.2 –1.5%International Assistance Programs ................ 4.9 5.2 5.4 5.4 0.0 0.0%National Aeronautics and Space Admin ........ 18.4 18.6 18.4 18.2 –0.2 –1.1%National Archives and Records Admin .......... 3.2 3.3 3.3 3.3 0.0 0.0%National Labor Relations Board ..................... 1.6 1.7 1.7 1.7 0.0 0.0%National Science Foundation ......................... 1.4 1.4 1.4 1.5 0.1 7.1%Nuclear Regulatory Commission ................... 4.0 4.0 4.0 3.9 –0.1 –2.5%Office of Personnel Management .................. 4.8 5.4 5.7 5.3 –0.4 –7.0%Railroad Retirement Board ............................ 1.0 1.0 1.0 0.9 –0.1 –10.0%Securities and Exchange Commission .......... 3.7 3.8 3.9 4.5 0.6 15.4%Small Business Administration ...................... 3.4 3.4 3.4 3.4 0.0 0.0%Smithsonian Institution .................................. 5.1 5.2 5.2 5.2 0.0 0.0%Social Security Administration ....................... 67.3 67.6 65.4 63.4 –2.0 –3.1%Tennessee Valley Authority ............................ 12.0 12.4 12.8 12.9 0.1 0.8%All other small agencies 1 ............................... 15.9 16.3 17.7 18.7 1.0 5.6%
Total, Executive Branch civilian employment 2 ... 2,127.9 2,102.4 2,107.6 2,110.0 2.4 0.1%Security FTE per P.L. 112–25 ............................ 1,241.7 1,290.1 1,297.9 1,296.3 –1.6 –0.1%Nonsecurity FTE ................................................. 886.2 812.3 809.7 813.7 4.0 0.5%
1 FTE increases in the Consumer Financial Protection Bureau and the Commodity Futures Trading Commission comprise 70% of the increase between 2012 and 2013.
2 Totals may not add due to rounding.
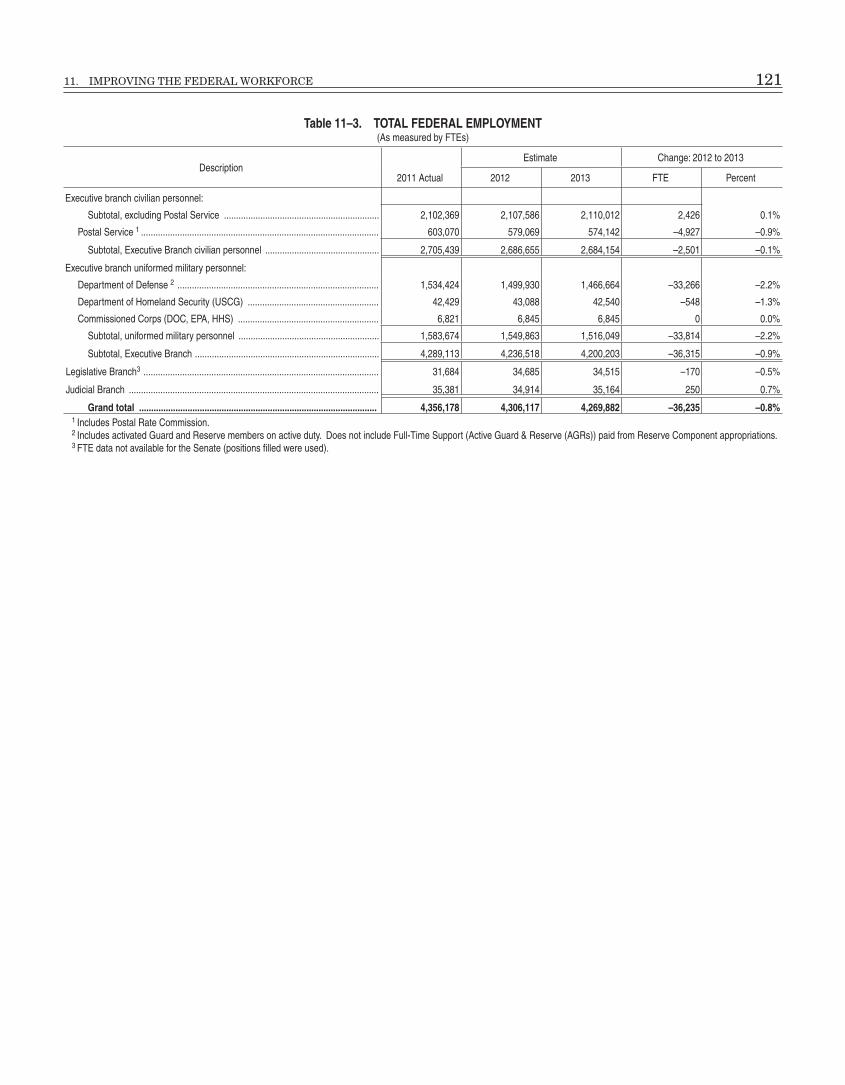
11. IMPROVING THE FEDERAL WORKFORCE 121
Table 11–3. TOTAL FEDERAL EMPLOYMENT(As measured by FTEs)
Description2011 Actual
Estimate Change: 2012 to 2013
2012 2013 FTE Percent
Executive branch civilian personnel:
Subtotal, excluding Postal Service ................................................................ 2,102,369 2,107,586 2,110,012 2,426 0.1%
Postal Service 1 .................................................................................................. 603,070 579,069 574,142 –4,927 –0.9%
Subtotal, Executive Branch civilian personnel ............................................... 2,705,439 2,686,655 2,684,154 –2,501 –0.1%
Executive branch uniformed military personnel:
Department of Defense 2 ................................................................................... 1,534,424 1,499,930 1,466,664 –33,266 –2.2%
Department of Homeland Security (USCG) ...................................................... 42,429 43,088 42,540 –548 –1.3%
Commissioned Corps (DOC, EPA, HHS) .......................................................... 6,821 6,845 6,845 0 0.0%
Subtotal, uniformed military personnel .......................................................... 1,583,674 1,549,863 1,516,049 –33,814 –2.2%
Subtotal, Executive Branch ............................................................................ 4,289,113 4,236,518 4,200,203 –36,315 –0.9%
Legislative Branch3 ................................................................................................. 31,684 34,685 34,515 –170 –0.5%
Judicial Branch ....................................................................................................... 35,381 34,914 35,164 250 0.7%
Grand total .................................................................................................. 4,356,178 4,306,117 4,269,882 –36,235 –0.8%1 Includes Postal Rate Commission.2 Includes activated Guard and Reserve members on active duty. Does not include Full-Time Support (Active Guard & Reserve (AGRs)) paid from Reserve Component appropriations. 3 FTE data not available for the Senate (positions filled were used).

122 ANALYTICAL PERSPECTIVES
Table 11–4. PERSONNEL COMPENSATION AND BENEFITS(In millions of dollars)
Description2011 Actual 2012 Estimate 2013 Request
Change: 2012 to 2013
Dollars Percent
Civilian personnel costs:
Executive Branch (excluding Postal Service):Direct compensation ............................................................... 175,931 177,035 179,942 2,907 1.6%Personnel benefits .................................................................. 63,919 64,495 65,816 1,321 2.0%
Subtotal, Executive Branch ...................................... 239,850 241,530 245,758 4,228 1.8%
Postal Service:Direct compensation ............................................................... 37,495 35,691 30,003 –5,688 –15.9%Personnel benefits .................................................................. 15,126 8,697 11,711 3,014 34.7%
Subtotal .............................................................................. 52,621 44,388 41,714 –2,674 –6.0%
Legislative Branch: 1
Direct compensation ............................................................... 2,154 2,110 2,132 22 1.0%Personnel benefits .................................................................. 653 647 663 16 2.5%
Subtotal .............................................................................. 2,807 2,757 2,795 38 1.4%
Judicial Branch:Direct compensation ............................................................... 3,226 3,206 3,249 43 1.3%Personnel benefits .................................................................. 1,067 1,081 1,105 24 2.2%
Subtotal .............................................................................. 4,293 4,287 4,354 67 1.6%Total, civilian personnel costs ............................................ 299,571 292,962 294,621 1,659 0.6%
Military personnel costs:
Department of DefenseDirect compensation ............................................................... 78,828 78,023 78,270 247 0.3%Personnel benefits .................................................................. 50,940 51,346 48,163 –3,183 –6.2%
Subtotal .............................................................................. 129,768 129,369 126,433 –2,936 –2.3%
All other executive branch, uniformed personnel:Direct compensation .................................................................... 2,455 2,506 2,721 215 8.6%Personnel benefits ....................................................................... 792 822 763 –59 –7.2%
Subtotal .................................................................................. 3,247 3,328 3,484 156 4.7%Total, military personnel costs 2 ................................................... 133,015 132,697 129,917 –2,780 –2.1%
Grand total, personnel costs ........................................................ 432,586 425,659 424,538 –1,121 –0.3%
ADDENDUM
Former Civilian Personnel:
Retired pay for former personnelGovernment payment for Annuitants: ..................................... 71,983 81,820 85,231 3,411 4.2%
Employee health benefits ................................................... 10,260 10,475 11,027 552 5.3%Employee life insurance ..................................................... 45 45 45 0 0.0%
Former military personnel:Retired pay for former personnel ................................................. 50,997 52,685 54,759 2,074 3.9%Military annuitants health benefits ............................................... 8,756 9,471 9,727 256 2.7%
1 Excludes members and officers of the Senate.2 Amounts in this table for military compensation reflect direct pay and benefits for all servicemembers, including active duty, guard, and reserve members.