performance analysis diagnostics & optimization ( pado ) · pdf fileperformance analysis,...
TRANSCRIPT

OVERVIEW
OF
Performance Analysis Diagnostics & Optimization
( PADO )
Performance Analysis, Diagnostic and Optimisation (PADO)
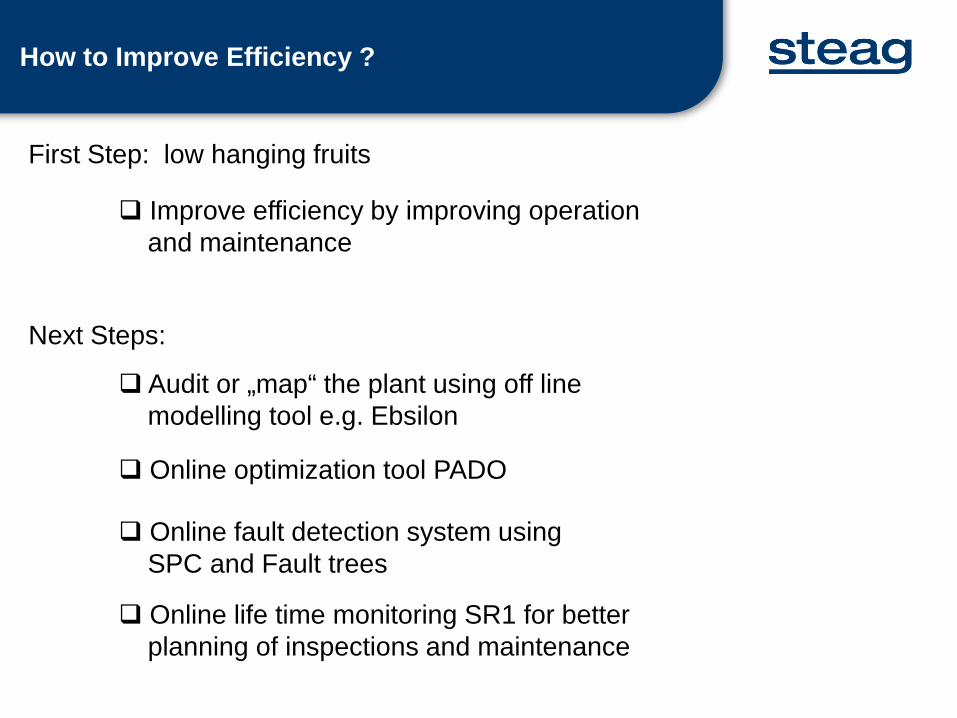
How to Improve Efficiency ?
First Step: low hanging fruits
Improve efficiency by improving operationand maintenance
Next Steps:
Audit or „map“ the plant using off line modelling tool e.g. Ebsilon
Online optimization tool PADO
Online fault detection system usingSPC and Fault trees
Online life time monitoring SR1 for betterplanning of inspections and maintenance
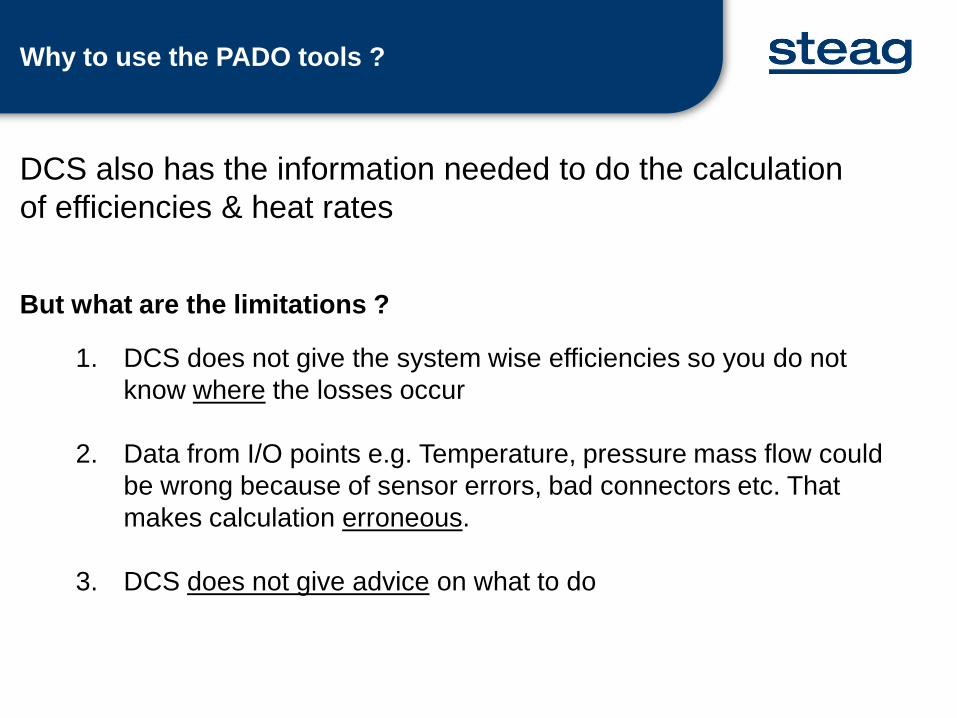
Why to use the PADO tools ?
DCS also has the information needed to do the calculation of efficiencies & heat rates
1. DCS does not give the system wise efficiencies so you do not know where the losses occur
2. Data from I/O points e.g. Temperature, pressure mass flow could be wrong because of sensor errors, bad connectors etc. That makes calculation erroneous.
3. DCS does not give advice on what to do
But what are the limitations ?
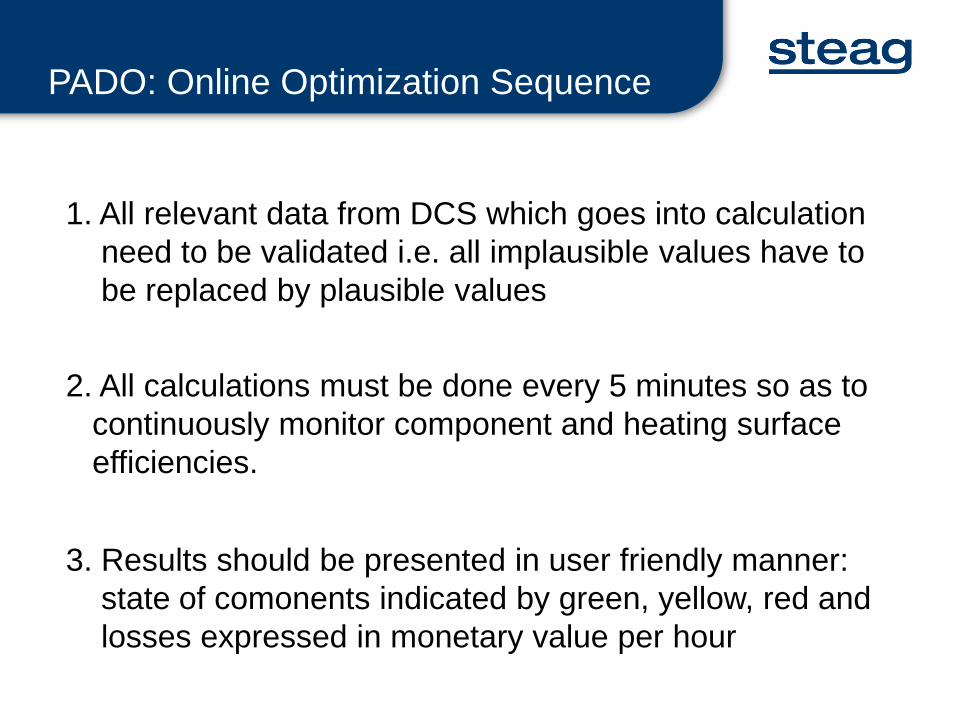
PADO: Online Optimization Sequence
1. All relevant data from DCS which goes into calculationneed to be validated i.e. all implausible values have to be replaced by plausible values
2. All calculations must be done every 5 minutes so as tocontinuously monitor component and heating surface efficiencies.
3. Results should be presented in user friendly manner:state of comonents indicated by green, yellow, red andlosses expressed in monetary value per hour

PADO Functions
SRx (Datamanagement)
SRvData Validation
SR4Diagnosis +Optimization
WhatIf
SRx
Visualisation
DCS
OFFLINE

PADO in India
80 units order for PADO have been placed on SESI27 units successfully commissioned till date
National Thermal Power Corporation (NTPC)The largest power generating major of India generating power from Coaland Gas with an installed capacity of 34,194 MW, has standardised onSteag PADO for all future units including Super-Critical Units.
Bharat Heavy Electricals Limited (BHEL)The largest supplier of power equipment with 70% of current installedmarket of Thermal Power Plants has a Framework Agreement withSESI for installation of PADO for all future unitsincluding Super-Critical Units.
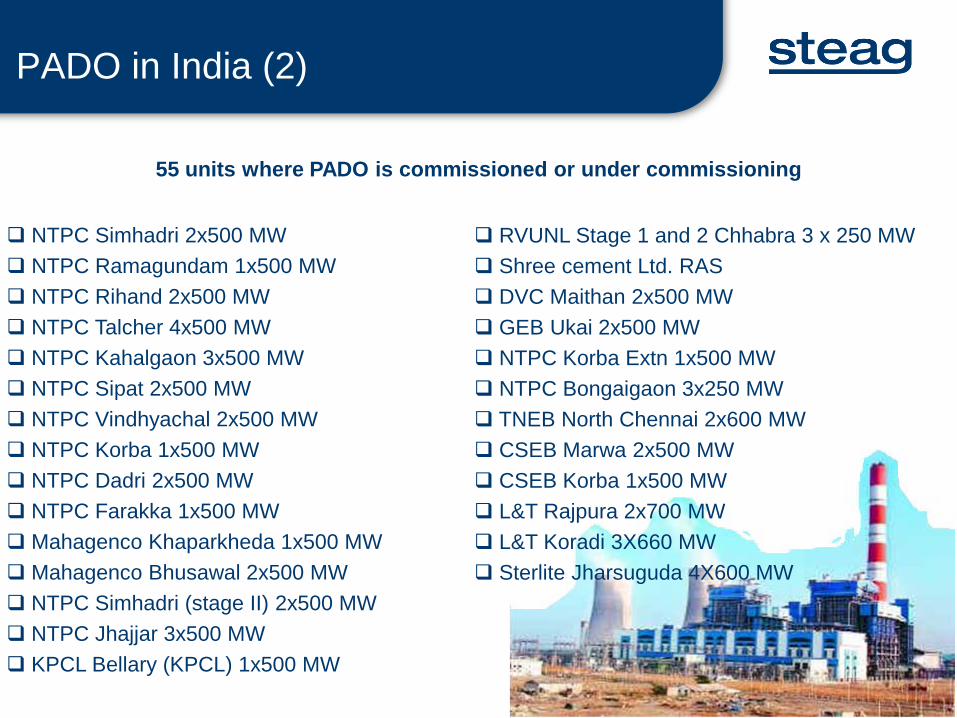
55 units where PADO is commissioned or under commissioning
NTPC Simhadri 2x500 MW NTPC Ramagundam 1x500 MW NTPC Rihand 2x500 MW NTPC Talcher 4x500 MW NTPC Kahalgaon 3x500 MW NTPC Sipat 2x500 MW NTPC Vindhyachal 2x500 MW NTPC Korba 1x500 MW NTPC Dadri 2x500 MW NTPC Farakka 1x500 MW Mahagenco Khaparkheda 1x500 MW Mahagenco Bhusawal 2x500 MW NTPC Simhadri (stage II) 2x500 MW NTPC Jhajjar 3x500 MW KPCL Bellary (KPCL) 1x500 MW
RVUNL Stage 1 and 2 Chhabra 3 x 250 MW Shree cement Ltd. RAS DVC Maithan 2x500 MW GEB Ukai 2x500 MW NTPC Korba Extn 1x500 MW NTPC Bongaigaon 3x250 MW TNEB North Chennai 2x600 MW CSEB Marwa 2x500 MW CSEB Korba 1x500 MW L&T Rajpura 2x700 MW L&T Koradi 3X660 MW Sterlite Jharsuguda 4X600 MW
PADO in India (2)

Signing of Framework Agreement

Advantages of PADO
● Improving the quality of measurements by data validation
● Evaluation of boiler, turbines, condenser and other components
● Optimization of unit operation (sootblowing, setpoints)
● Calculation of what-if scenarios
● Enhance the efficiency of the power plant !
● Generation of daily and monthly reports

Modules of PADO System
SootBlowing
Optimizer
EbsilonModel
BoilerSetpoint
OptimizerStatisticalProcessControl
PerformanceMonitoring Metal
Temperature
LifetimeMonitoring
What-IfAnalysis
DataManagement
System
DataVisualizer
DataValidation
FaultTree
Base ModulesFault Detection
Performance Analysis
OptimizationPhysical Condition
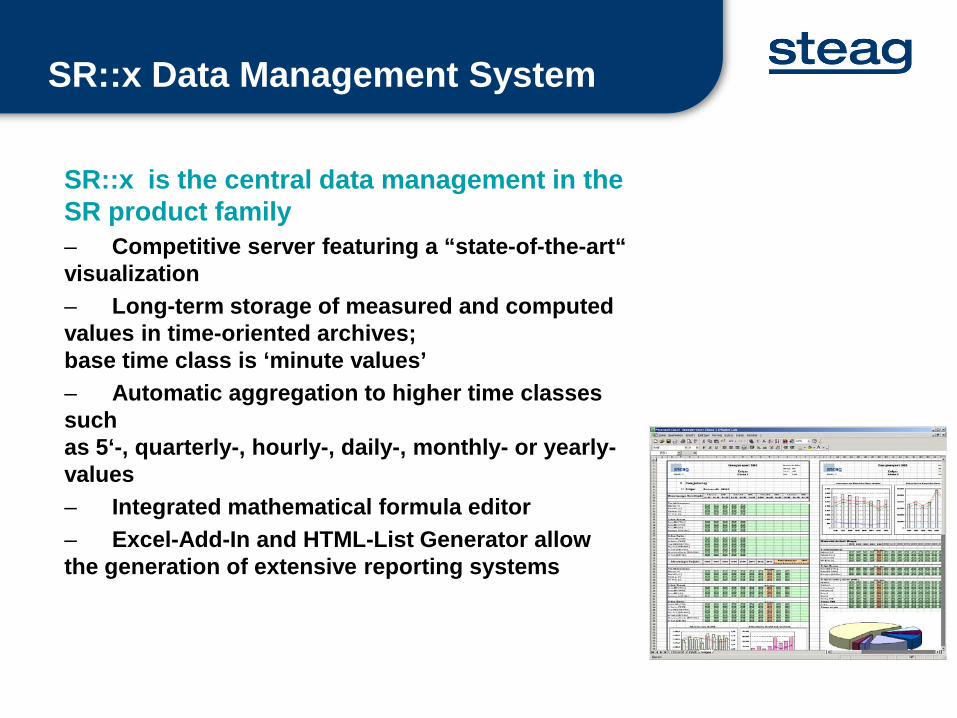
SR::x is the central data management in the SR product family– Competitive server featuring a “state-of-the-art“ visualization– Long-term storage of measured and computed values in time-oriented archives; base time class is ‘minute values’– Automatic aggregation to higher time classes such as 5‘-, quarterly-, hourly-, daily-, monthly- or yearly-values– Integrated mathematical formula editor– Excel-Add-In and HTML-List Generator allowthe generation of extensive reporting systems
SR::x Data Management System
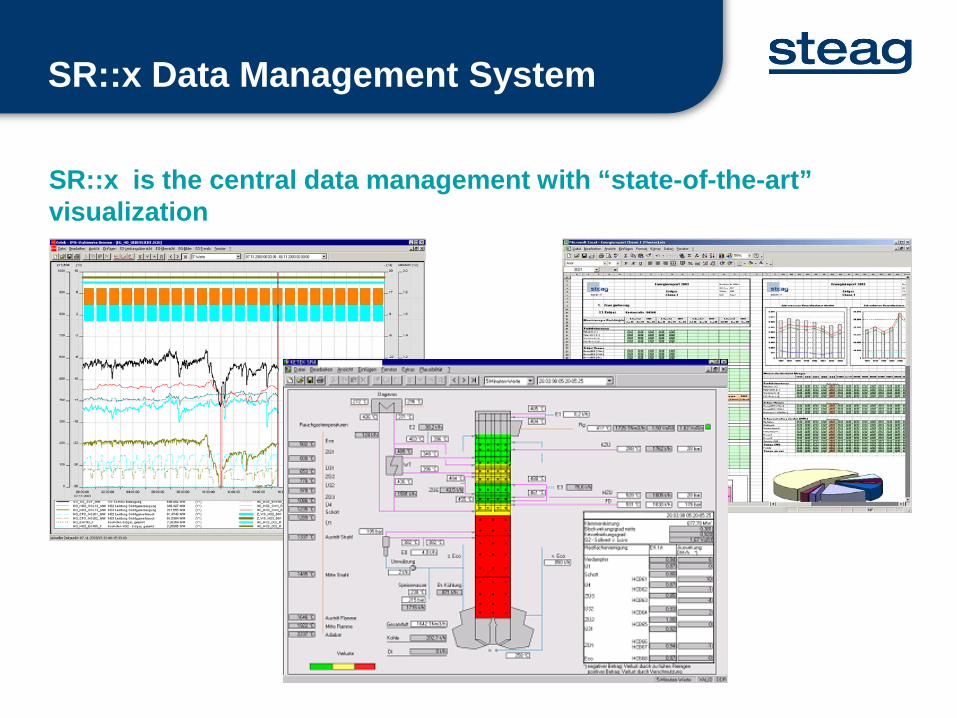
SR::x is the central data management with “state-of-the-art” visualization
SR::x Data Management System
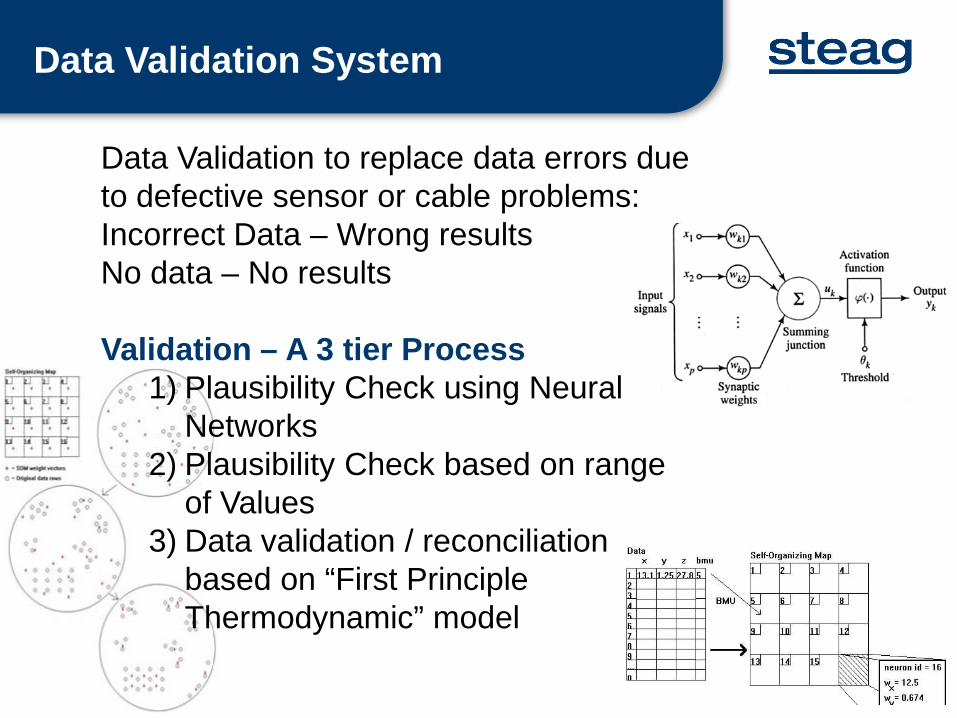
Data Validation to replace data errors due to defective sensor or cable problems:Incorrect Data – Wrong resultsNo data – No results
Validation – A 3 tier Process1) Plausibility Check using Neural
Networks 2) Plausibility Check based on range
of Values3) Data validation / reconciliation
based on “First Principle Thermodynamic” model
Data Validation System

based on Neural Network…
Data Validation System (1)
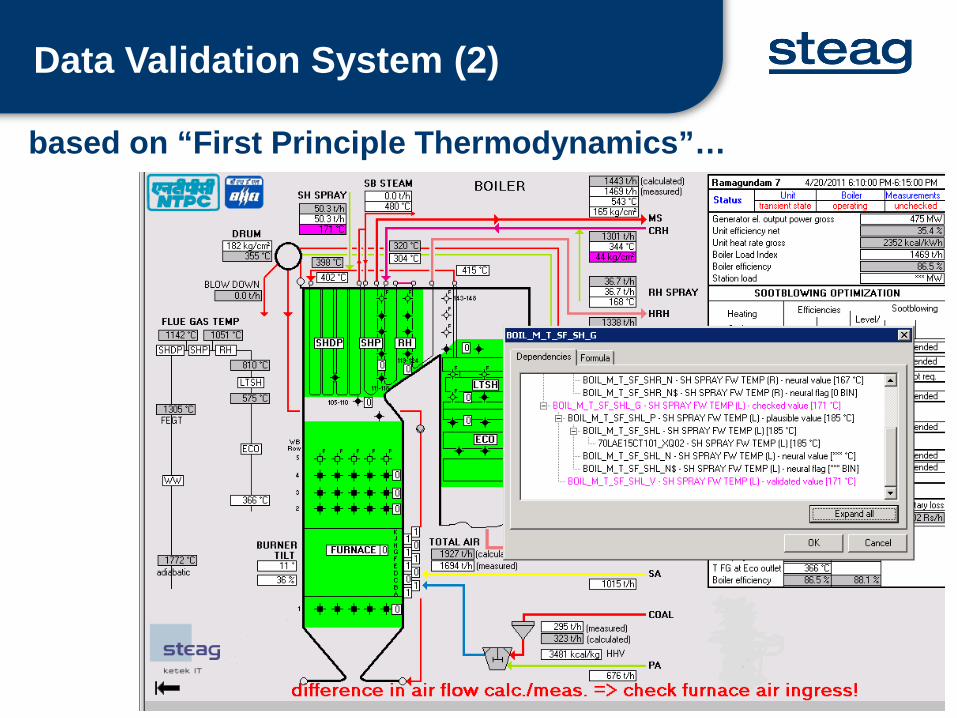
based on “First Principle Thermodynamics”…
Data Validation System (2)
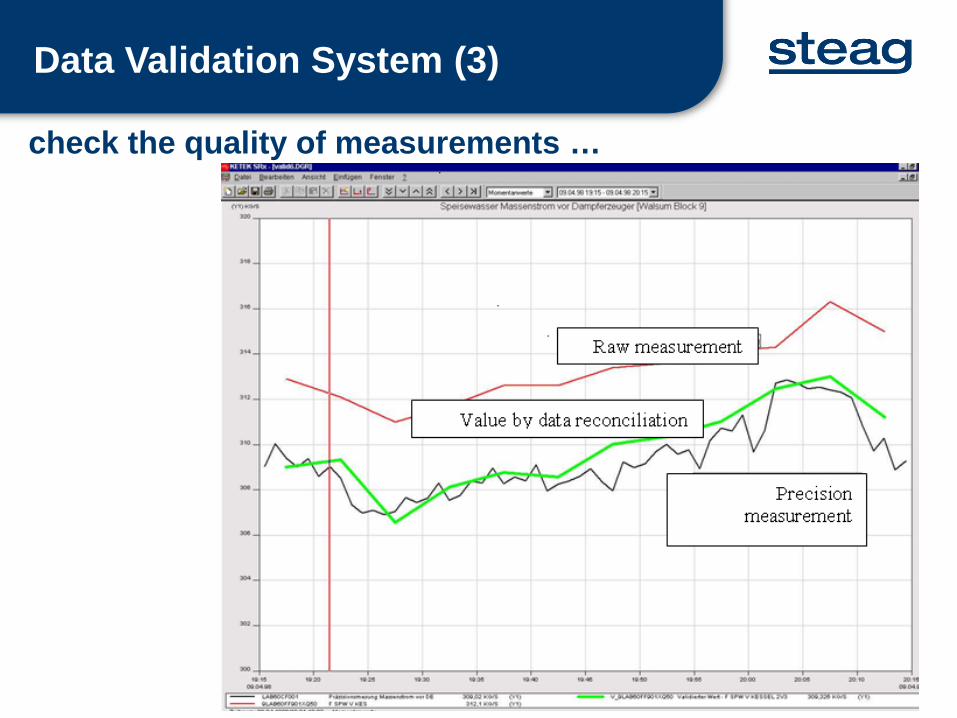
check the quality of measurements …
Data Validation System (3)
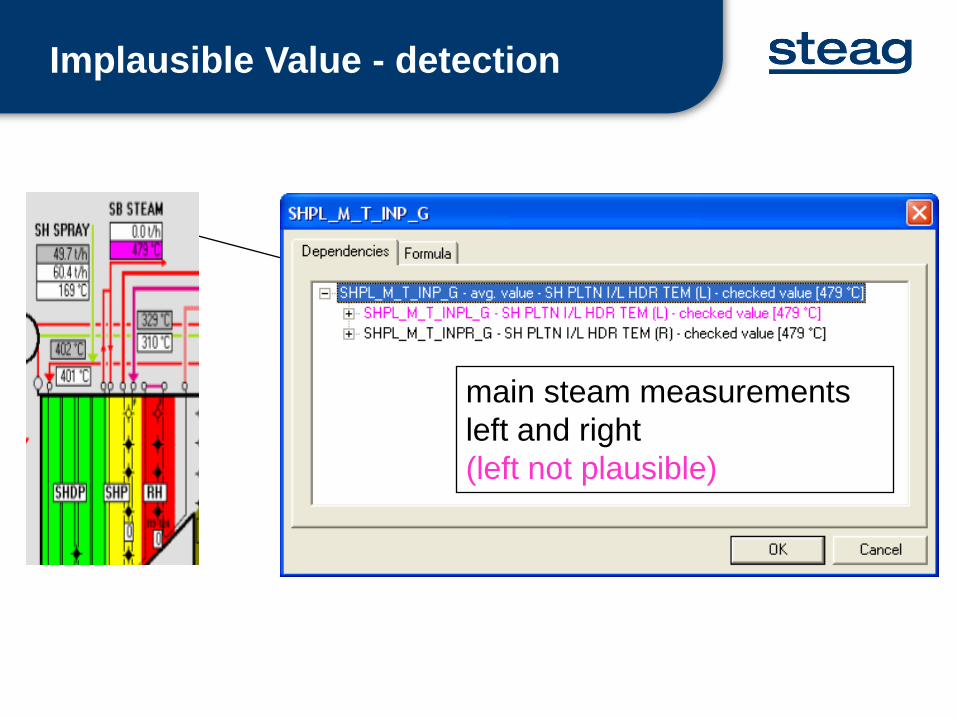
main steam measurementsleft and right(left not plausible)
Implausible Value - detection
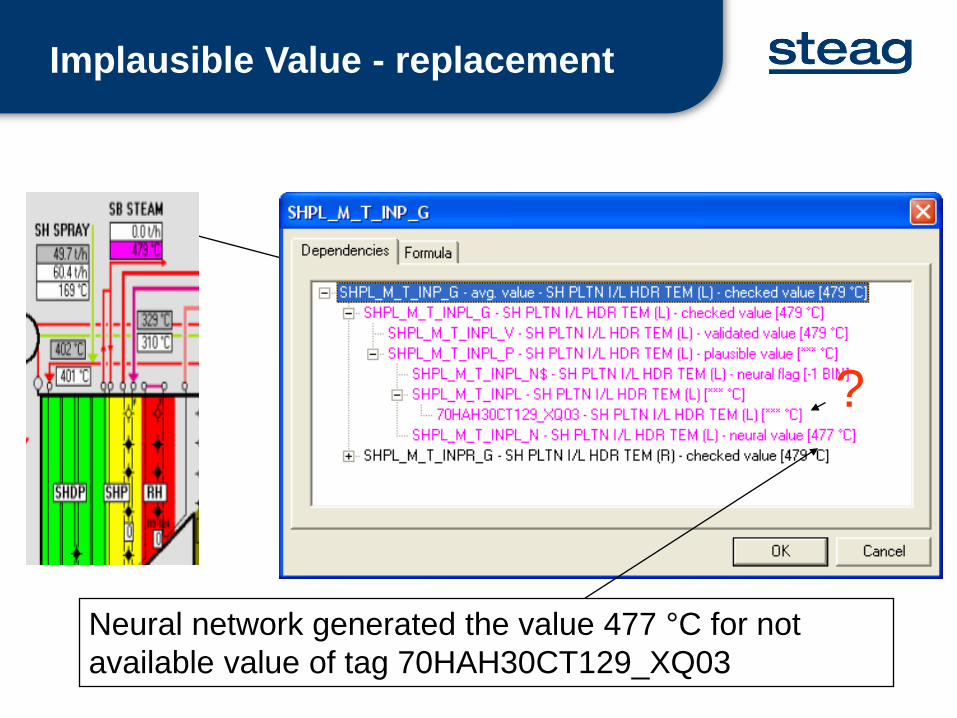
Neural network generated the value 477 °C for not available value of tag 70HAH30CT129_XQ03
?
Implausible Value - replacement
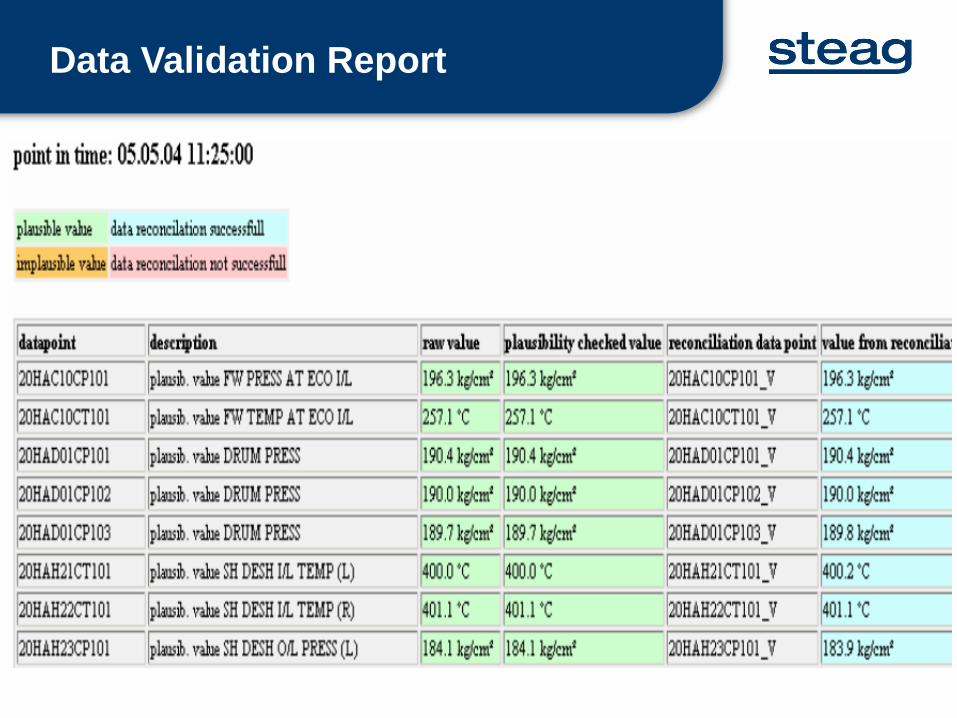
Data Validation Report
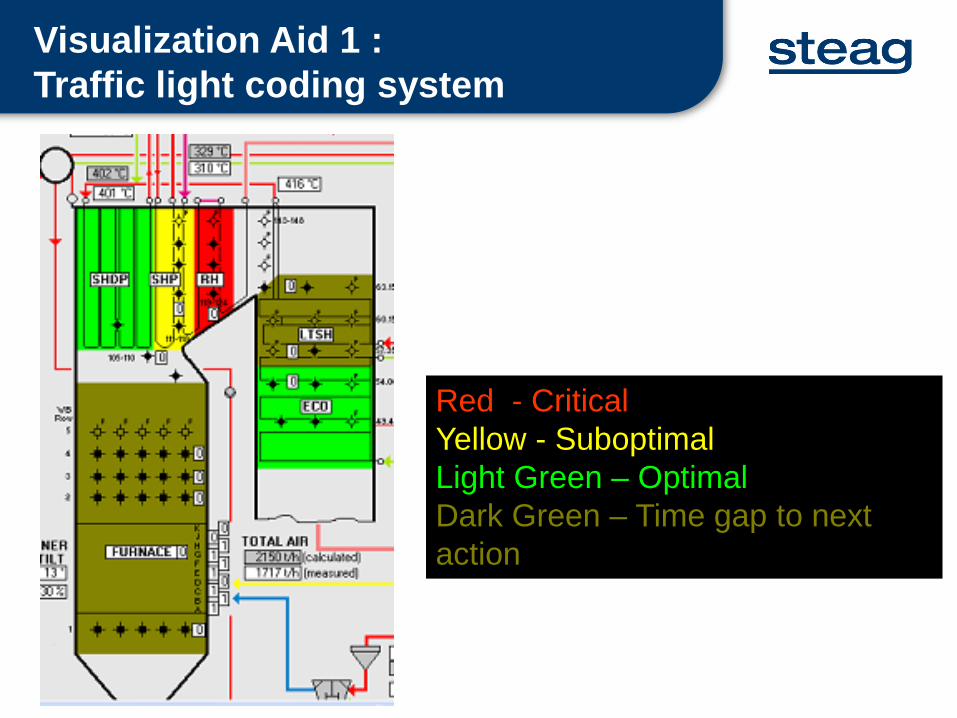
Red - CriticalYellow - SuboptimalLight Green – OptimalDark Green – Time gap to next action
Visualization Aid 1 :Traffic light coding system

Visualization Aid 2 : Data values as tags &in tables with coded Background colors
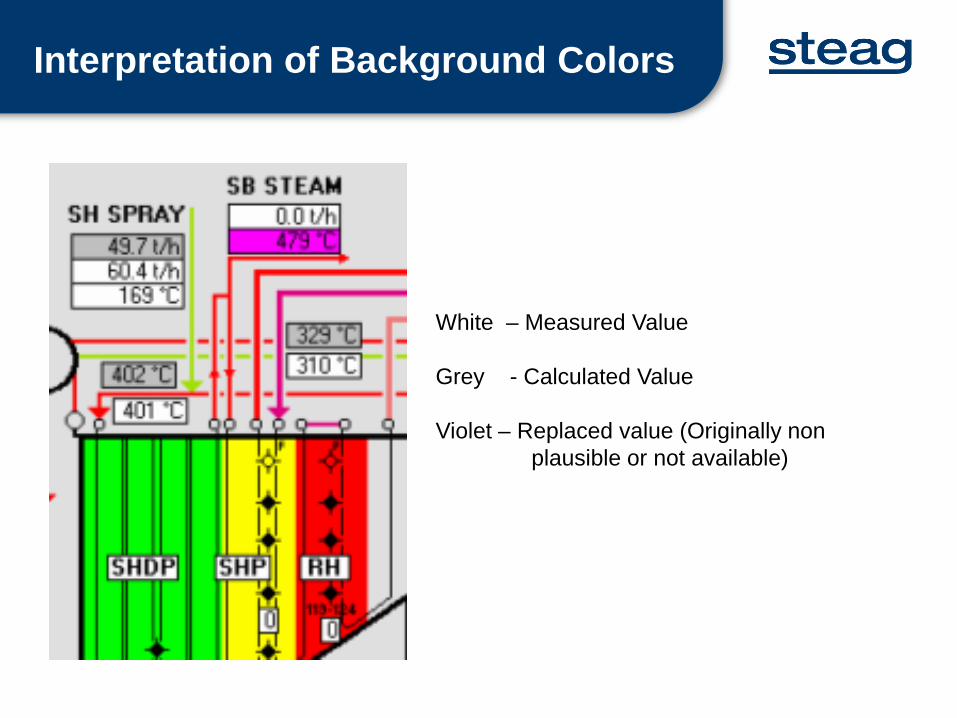
Interpretation of Background Colors
White – Measured Value
Grey - Calculated Value
Violet – Replaced value (Originally nonplausible or not available)

Compares the actual values of critical parameters with the bestachievable under current operating conditions.
Shows monetary loss against each sub optimal operatingparameter, defining the scope of improvement.
Performance Monitoring
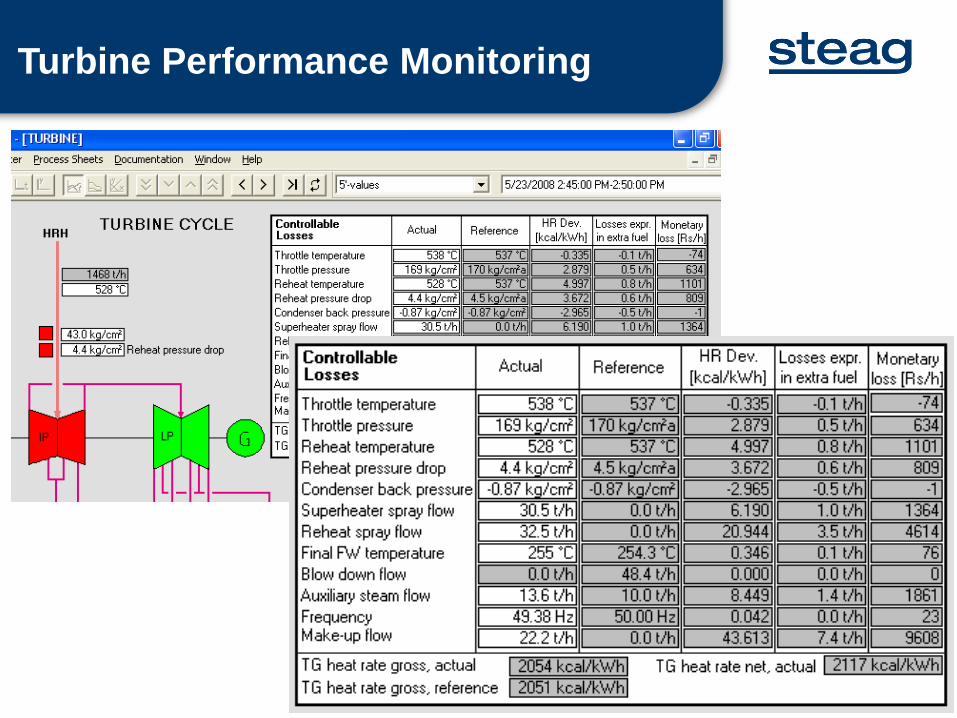
Turbine Performance Monitoring
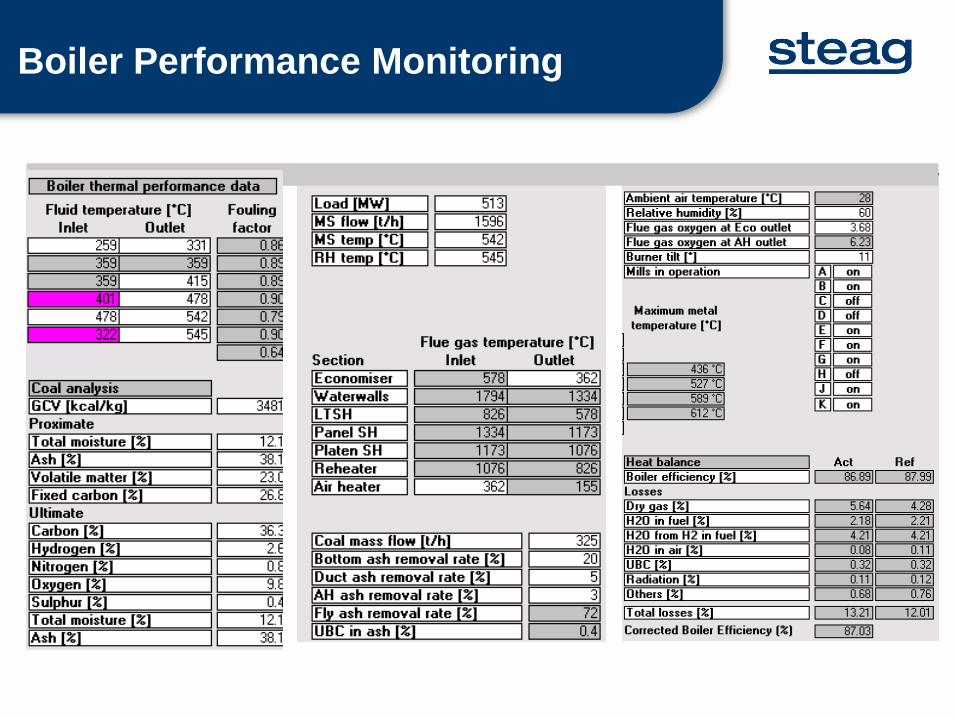
Boiler Performance Monitoring
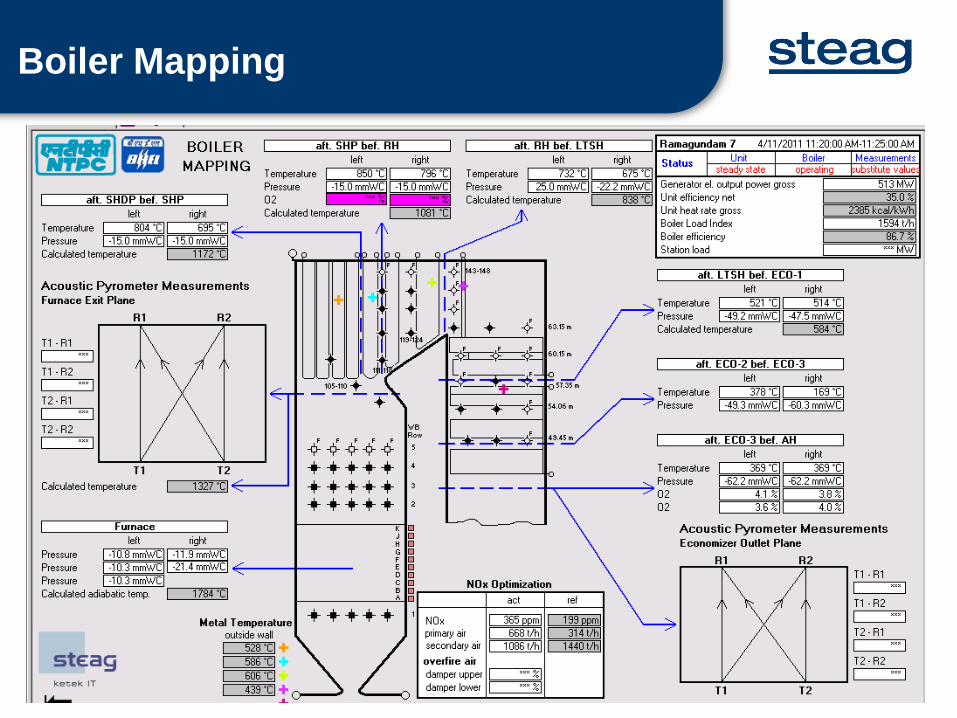
Boiler Mapping

Soot Blowing Optimization
Fouling and Slagging of boiler heating surfaces cause…- Loss of efficiency due to increased flue gas temperature.- Loss of efficiency due to increased Reheater spray flow.- Shutdowns for removing persistent slag.
Use of soot blowers…- Causes costs (blowing medium, wear-and-tear...).- Impact on control actions.- Erosion of the heating surfaces.- May be prohibited or not reasonable in some operating states.
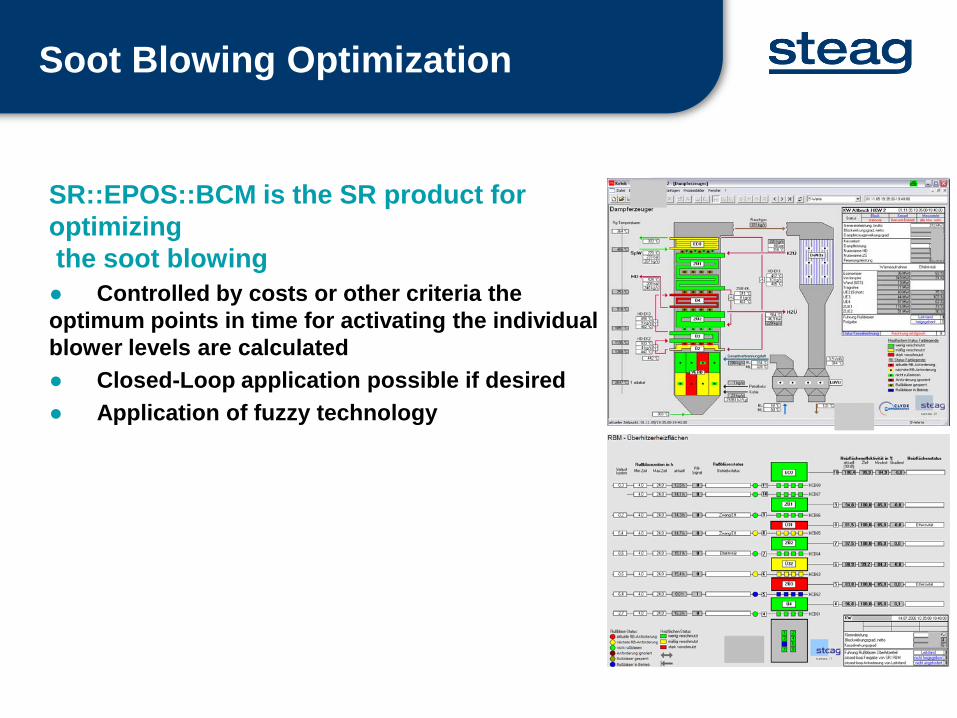
SR::EPOS::BCM is the SR product for optimizingthe soot blowing● Controlled by costs or other criteria the optimum points in time for activating the individual blower levels are calculated● Closed-Loop application possible if desired● Application of fuzzy technology
Platzhalter Bild
Soot Blowing Optimization
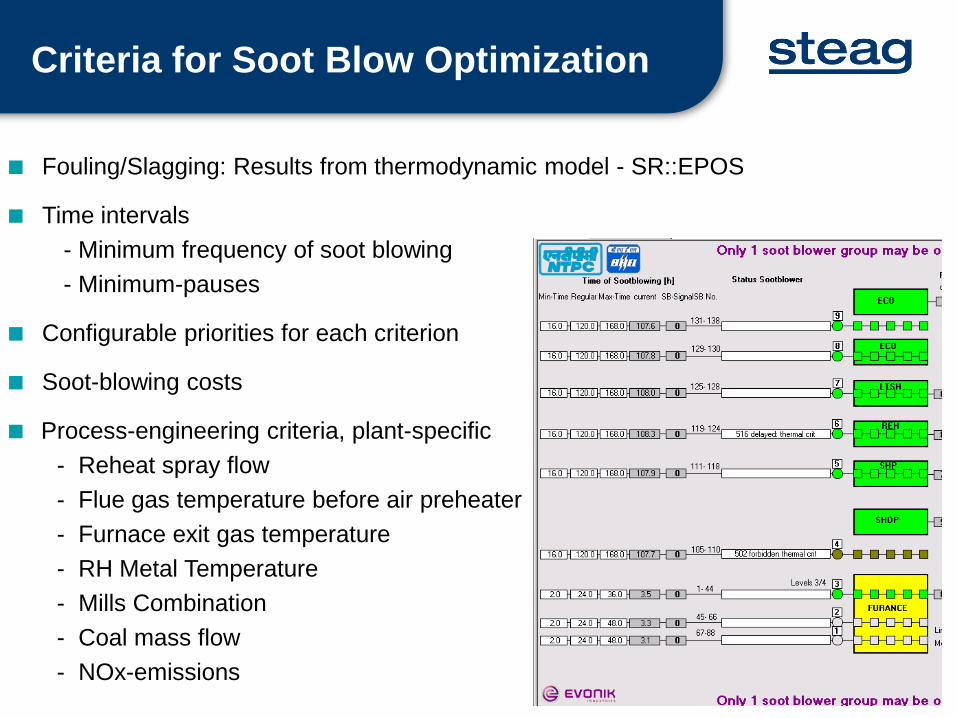
Fouling/Slagging: Results from thermodynamic model - SR::EPOS
Time intervals- Minimum frequency of soot blowing- Minimum-pauses
Configurable priorities for each criterion
Soot-blowing costs
Process-engineering criteria, plant-specific- Reheat spray flow- Flue gas temperature before air preheater- Furnace exit gas temperature - RH Metal Temperature - Mills Combination- Coal mass flow- NOx-emissions
Criteria for Soot Blow Optimization

Soot Blowing Optimization
Boiler Setpoint Optimization
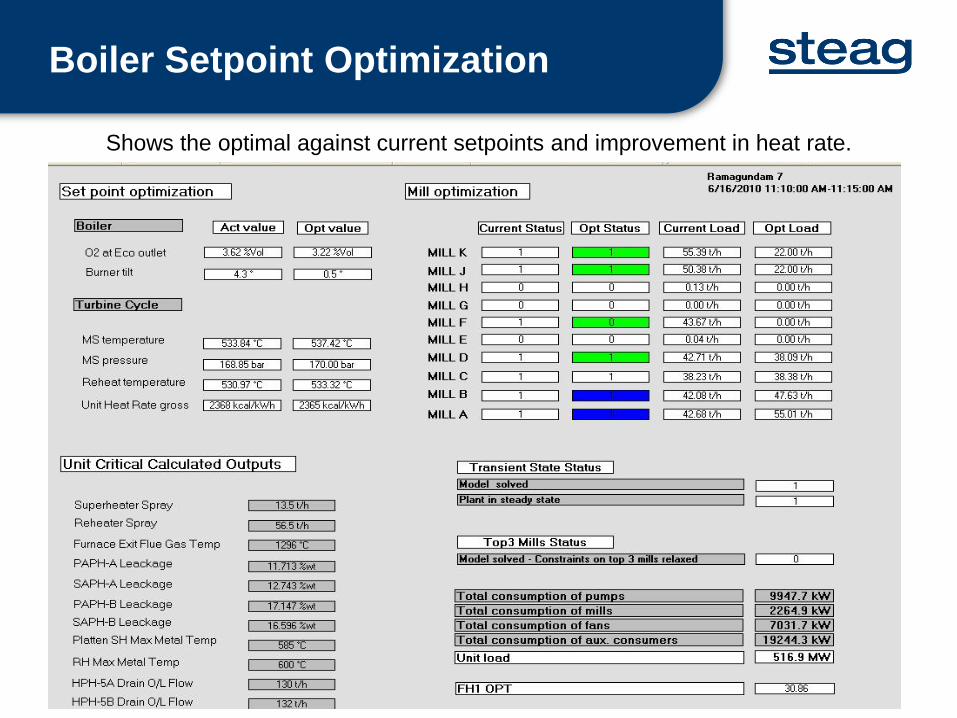
Shows the optimal against current setpoints and improvement in heat rate.

0.0250.03
0.0350.04
0.0450.05
05
1015
202290
2300
2310
2320
2330
2340
In this case the optimum means to move the burner tilt down from the current 9 degree to 4.5 degree and the excess O2 from the current 4% to 3.55%.
main steam flow = 450.33 kg/sfurnace exit temperature = 1242.7 °Cmill influence 1 = 33.38
Optimized Heat Rate
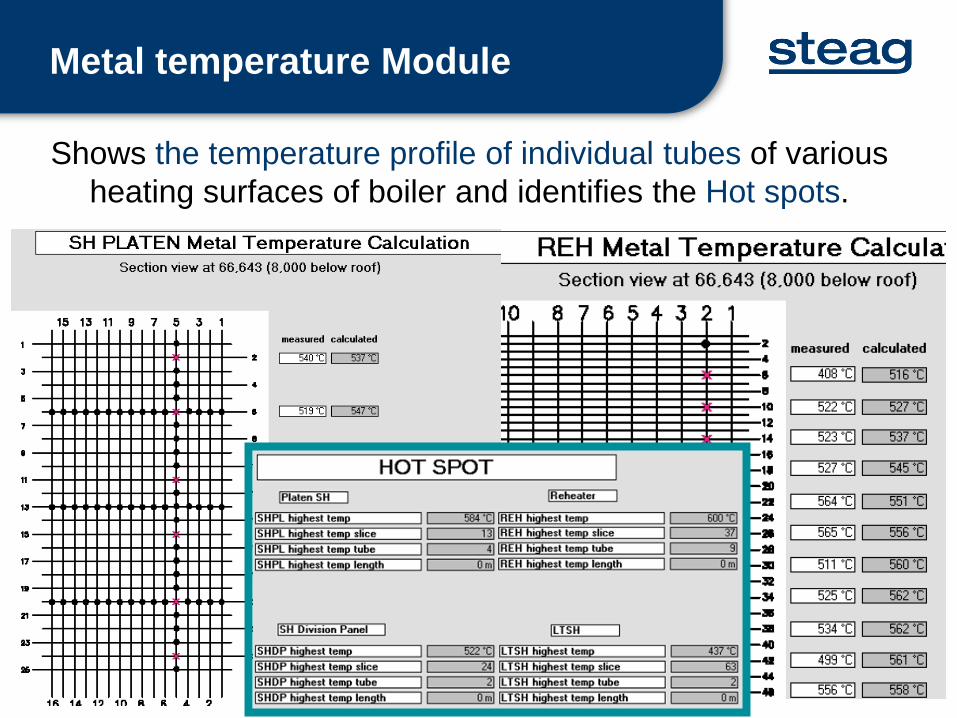
Metal temperature Module
Shows the temperature profile of individual tubes of various heating surfaces of boiler and identifies the Hot spots.

Lifetime monitoring module
module aims to calculate the remaining life of thick walled components in boiler
the consumed life of an equipment could be different from the actual age of the equipment

Temperature
Pressure
Operating Point
Free Capacity for Creep
Scheduled Plant Life
Lifetime monitoring module

Lifetime monitoring module
Monitoring Creep & Fatigue for Drum 1/top
depends upon how stressful the life of equipment has been so far in terms of temperature and pressure which effect fatigue and creep.
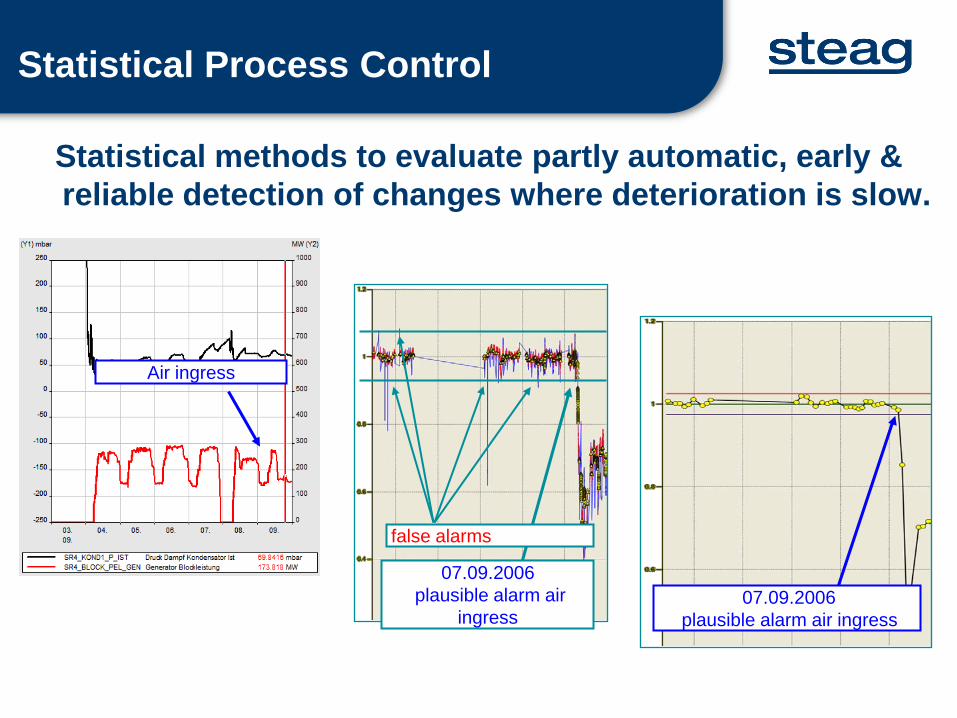
Statistical Process Control
Statistical methods to evaluate partly automatic, early & reliable detection of changes where deterioration is slow.
false alarms
07.09.2006plausible alarm air
ingress
Air ingress
07.09.2006plausible alarm air ingress

Key Performance Indicators (KPIs) can be used to detect component failures and to enable condition based maintainance. KPI should depend only on component condition but not on load, ambient conditions or operation mode
measured calculated
vibration
bearing temperature
oil temperature
power consumption
…
heatrate
Component quality factor
efficiency
…
Key Performance Indicators
protection limitKey measurements in power plants usually depend on - load,- operation mode - fuel quality - ambient conditions - etc.And are superposed by noise
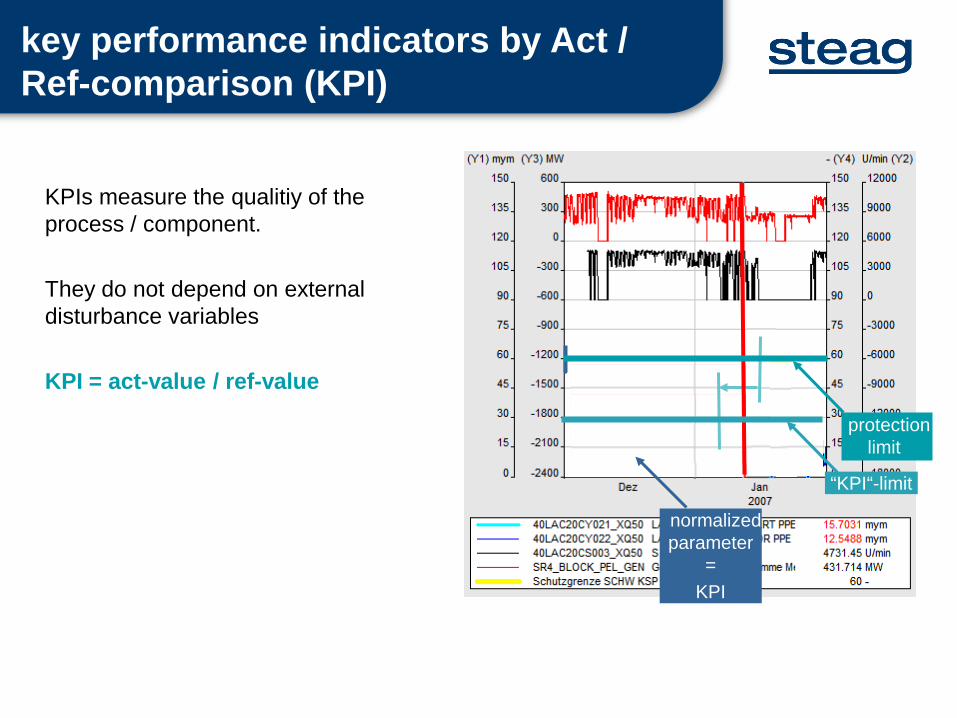
key performance indicators by Act / Ref-comparison (KPI)
normalizedparameter
=KPI
KPIs measure the qualitiy of the process / component.
They do not depend on external disturbance variables
KPI = act-value / ref-value
“KPI“-limit
protectionlimit

SPC – Alarm Control Centre

• Models and analyzes faults in the process.
• Composed of logic diagrams that display the state of the system and the states of the components
• Constructed using Drag & Droptechnique
• Does not need programmingexpertise for building suchtrees.
Fault Trees

Thank You
... Ideas & Solutions for Tomorrow