performance analysis and design improvement on a … analysis and design improvement on a test rig...
TRANSCRIPT

Performance analysis and design improvement on a test rig for
centrifugal slurry pumps at Weir Warman Ltd, Sydney
Tom Clabbers
12th December 2006

Abstract
The medium test rig in the test bay of Weir Warman in Artarmon needs refurbishing. Al-though the tests can be conducted fairly quick, the changeovers, from one test to the next,cost too much time. The base frame on which the pump and motor are mounted is basedon a frame that Warman usually supplies with a pump and motor combination. Herein liesthe problem that the current base frame has: it is not specifically designed for a test rig, butrather adapted from a base frame that is installed once, and then kept running for a longtime. The new design that is proposed in this study is in fact designed for this test bay.Pumps and motors are quickly changed in between tests and the piping at both the intakeand discharge side are much easier adapted to a new setup as well.

2

Contents
1 Introduction 5
2 Warman slurry pumps 72.1 Weir Warman . . . . . . . . . . . . . . . . . . . . . . . . . . . . . . . . . . . . 72.2 Slurry pumps . . . . . . . . . . . . . . . . . . . . . . . . . . . . . . . . . . . . 7
3 Pump testing 93.1 Test bay . . . . . . . . . . . . . . . . . . . . . . . . . . . . . . . . . . . . . . . 93.2 Tests . . . . . . . . . . . . . . . . . . . . . . . . . . . . . . . . . . . . . . . . . 10
4 Performance analysis 134.1 Changeovers . . . . . . . . . . . . . . . . . . . . . . . . . . . . . . . . . . . . . 134.2 Testing . . . . . . . . . . . . . . . . . . . . . . . . . . . . . . . . . . . . . . . 14
4.2.1 Head, power and efficiency versus flow rate . . . . . . . . . . . . . . . 144.2.2 NPSH test with constant flow rate method . . . . . . . . . . . . . . . 144.2.3 Sound level, vibration and bearing temperature rise test . . . . . . . . 15
4.3 Evaluation . . . . . . . . . . . . . . . . . . . . . . . . . . . . . . . . . . . . . . 15
5 Design of the piping configuration 175.1 Intake side . . . . . . . . . . . . . . . . . . . . . . . . . . . . . . . . . . . . . . 175.2 Discharge side . . . . . . . . . . . . . . . . . . . . . . . . . . . . . . . . . . . . 19
6 Design of the base frame 216.1 Concept . . . . . . . . . . . . . . . . . . . . . . . . . . . . . . . . . . . . . . . 216.2 Dimensions and sections . . . . . . . . . . . . . . . . . . . . . . . . . . . . . . 23
6.2.1 Pump plates . . . . . . . . . . . . . . . . . . . . . . . . . . . . . . . . 236.2.2 Columns . . . . . . . . . . . . . . . . . . . . . . . . . . . . . . . . . . . 246.2.3 Floor frame . . . . . . . . . . . . . . . . . . . . . . . . . . . . . . . . . 246.2.4 Motor plate . . . . . . . . . . . . . . . . . . . . . . . . . . . . . . . . . 246.2.5 Jockey pulley frame . . . . . . . . . . . . . . . . . . . . . . . . . . . . 25
6.3 Finite element analysis . . . . . . . . . . . . . . . . . . . . . . . . . . . . . . . 256.3.1 Static analysis . . . . . . . . . . . . . . . . . . . . . . . . . . . . . . . 266.3.2 Harmonic analysis . . . . . . . . . . . . . . . . . . . . . . . . . . . . . 27
6.4 Final design . . . . . . . . . . . . . . . . . . . . . . . . . . . . . . . . . . . . . 356.4.1 Floor frame . . . . . . . . . . . . . . . . . . . . . . . . . . . . . . . . . 356.4.2 Motor plate . . . . . . . . . . . . . . . . . . . . . . . . . . . . . . . . . 366.4.3 E-frame pump pedestal . . . . . . . . . . . . . . . . . . . . . . . . . . 37
3

6.4.4 D-frame pump pedestal . . . . . . . . . . . . . . . . . . . . . . . . . . 386.4.5 Jockey pulley frame . . . . . . . . . . . . . . . . . . . . . . . . . . . . 38
7 Conclusions 45
8 Recommendations 47
A Piping 49
B Reaction forces 51B.1 Pump reaction forces . . . . . . . . . . . . . . . . . . . . . . . . . . . . . . . . 52
B.1.1 Gravitational forces . . . . . . . . . . . . . . . . . . . . . . . . . . . . 52B.1.2 Belt tension forces . . . . . . . . . . . . . . . . . . . . . . . . . . . . . 53B.1.3 Flange loads . . . . . . . . . . . . . . . . . . . . . . . . . . . . . . . . 54B.1.4 Flange moments . . . . . . . . . . . . . . . . . . . . . . . . . . . . . . 56B.1.5 Total reaction forces . . . . . . . . . . . . . . . . . . . . . . . . . . . . 59
C Parameter values 61C.1 Motor reaction forces . . . . . . . . . . . . . . . . . . . . . . . . . . . . . . . . 63
C.1.1 Gravitational forces . . . . . . . . . . . . . . . . . . . . . . . . . . . . 64C.1.2 Belt tension forces . . . . . . . . . . . . . . . . . . . . . . . . . . . . . 64C.1.3 Motor torque . . . . . . . . . . . . . . . . . . . . . . . . . . . . . . . . 64C.1.4 Total reaction forces . . . . . . . . . . . . . . . . . . . . . . . . . . . . 65
D Dimensions and sections in detail 67D.1 Pump plates . . . . . . . . . . . . . . . . . . . . . . . . . . . . . . . . . . . . . 67D.2 Columns . . . . . . . . . . . . . . . . . . . . . . . . . . . . . . . . . . . . . . . 69
D.2.1 Bending . . . . . . . . . . . . . . . . . . . . . . . . . . . . . . . . . . . 70D.2.2 Buckling . . . . . . . . . . . . . . . . . . . . . . . . . . . . . . . . . . . 70
D.3 Floor frame . . . . . . . . . . . . . . . . . . . . . . . . . . . . . . . . . . . . . 70D.4 Motor plate . . . . . . . . . . . . . . . . . . . . . . . . . . . . . . . . . . . . . 71D.5 Jockey pulley frame . . . . . . . . . . . . . . . . . . . . . . . . . . . . . . . . 72
E Matlab programme instructions 79
F References 81
4
Chapter 1
Introduction
Weir Warman Ltd. is located in Sydney, Australia and designs, manufactures and testscentrifugal slurry pumps. The testing is done on several test rigs. This report describes theperformance analysis and design improvement of one of those test setups: the medium testrig. This test rig is somewhat dated and requires design improvements in order to save timeand money preparing and conducting the tests. The scope of this study is to improve themedium test rig, without changing the actual testing procedures.
An analysis on the test rig shows what the points of concern are in the current setupand a new design is proposed. In this design the piping configuration is changed. The mainfocus, however, is on the base frame: the frame on which pump and motor are mounted onfor testing. The new design is thoroughly checked for strength properties and a static andharmonic analysis are done using an FEA model. The design is presented by a CAD modeland the resulting drafts and drawings.
5

6

Chapter 2
Warman slurry pumps
2.1 Weir Warman
Weir Warman Ltd. is part of the Weir Minerals group, which has been created by bringingtogether the previous global operations of Envirotech and Warman International. Weir Min-erals is the world leader in the design and manufacture of slurry pumps, cyclones, slurry valvesand mill lining systems. Weir Minerals has operations across North America, South America,Africa, Europe, Australia and Asia and employs over two and a half thousand people world-wide. Weir Warman Ltd. forms the Australian and Asian arm of Weir Minerals with sistercompanies located all around the world, including Venlo, The Netherlands. Weir Minerals isa division of The Weir Group PLC, a UK-listed engineering company founded in 1871 andlisted on the London Stock exchange since 1947. Weir Mineral brands include Warman, AshPump, Galigher, Hazleton, Cavex, GEHO Pumps, Schabaver, Indupaq, Envirotech, Weiresistand IsoGate.
Headquarters for Weir Warman Ltd. are located in Artarmon, a suburb of Sydney, Aus-tralia, employing around five hundred people. Weir Warman Sydney incorporates a fullyintegrated design, testing, manufacturing and distribution facility for horizontal and vertical-submersible centrifugal slurry pumps, ranging from 11
2 inch up to 1 meter intake flange diam-eter. Warman pumps are used in various applications. Many industries use Warman slurrypumps to transport, among other things, sand, gravel, coal, phosphate, ash/dust, sugar, andvarious kinds of ore. Warman pumps are used when dealing with abrasive materials like inwet scrubber installations for flue gas desulphurization. Water treatment and public utilityplants make use of a range of Warman slurry pumps. Particular Warman pumps even suitthe specific demands of various offshore applications. [1]
2.2 Slurry pumps
A slurry can be a mixture of virtually any liquid combined with some solid particles. Theflow properties and other characteristics are determined by a great number of variables. Thecombination of the type, size, shape and quantity of the particles together with the nature ofthe transporting liquid make up the slurry behavior. Slurries can be roughly divided in twogroups: non-settling and settling slurries. Non-settling slurries contain only very fine particleswhich can form stable homogeneous mixtures exhibiting increased apparent viscosity anddensity. These slurries usually have low wearing properties but are non-Newtonian. Settling
7

slurries contain coarser particles and tend to form an unstable heterogeneous mixture. Settlingslurries have high wearing properties and form the majority of slurry applications.
All Warman slurry pumps are centrifugal pumps. The principle of a centrifugal slurrypump is the same as a clear liquid pump. However, because slurries have such differentproperties the pump has to be designed to meet the special requirements. This often resultsin the use of tougher materials. Slurry pumps also have to be able to process large particles.The biggest Warman pump can handle particles up to 53 mm in spherical size. Because ofthis, they need heavier and wider impellers. Generally slurry pumps operate at lower speedsto reduce wear. This means that they have to be larger in size than comparable clear liquidpumps. Because the pumps are only tested using water, the specific design of slurry pumpswill not be elaborated on. [2]
8

Chapter 3
Pump testing
Any variation in design or manufacturing, no matter how subtle, will influence the perfor-mance of the pump. Pump testing is necessary to ensure the pump delivers the performanceas specified in the design. However, not all pumps that are tested have new design features.Costumers can opt for an acceptance test to be carried out on their pump before it is de-livered. Whatever the purpose may be, the tests are basically the same. These tests aredescribed in section 4.2.
3.1 Test bay
The test facilities at Weir Warman in Sydney are capable of testing the entire range of Warmanpumps. The facilities consist of four test rigs: the small and medium rig, the dyna rig andthe large test rig. The frame size of the pump to be tested roughly determines which rig isto be used for the test. Every pump is fitted with a standardized frame. Pumps with an A,B or C frame are tested on the small rig. The medium rig handles the D and E frames andF frame pumps use the dyna rig. Anything bigger than an F frame is tested on the large rig.The small and medium rig can be fitted with electric motors ranging from 3.75 to 220 kW,driving the pumps via one or more v-belts. The dyna rig is fitted with a 201 kW motor andthe large rig with a 900 kW motor. The motors on both the dyna rig and the large rig aredirectly coupled via a gearbox to the pump shafts. The four test rigs are all located in thesame test bay. The large rig has its own water basin and pressure tank. The small, mediumand dyna rig share another water tank. We will now focus on the medium test rig, as this isthe subject of this study.
Figure 3.1 shows the side view of the current medium test rig. At the far left is the watertank. When the pump is running, the water leaves the water tank and flows through theintake valve (2), that can automatically (partially) open and close using an electric motor.Behind the intake valve is a flow straightener (4) that is equipped with an air vent (5) used,together with air vent (12), to vent the air from the system when filling. At the bottomof the flow straightener, the lowest point of the system, is a drain valve (3). Pipe (9) is atelescopic pipe. This pipe can slide in- and outward and is necessary to adjust the total pipelength at the intake side for each different pump. The maximum reach of the telescope is550 mm. The pipe segment indicated by (10) can be one or more pipes that connect thetelescopic pipe with the intake flange of the pump. This set of pipes has to have one or morereducers, because the telescopic pipe has an internal diameter (ID) that is bigger (312 mm)
9

Figure 3.1: The current medium test rig
than the intake diameter of the largest pump for the test rig (200 mm). A tapping point (16)is present at two times the ID from the intake flange of the pump. After the water passesthe pump, it flows past another tapping point, twice the ID from the discharge flange of thepump. Piping segment (14) should again contain one or more reducers to increase the pipeID to 200 mm. Flange (17) has slots in stead of bolt holes, so the segment from (17) to thepump can be somewhat rotated. Together with two telescopic pipes (11) and (13), it enablespiping segment (14) to be fitted on any pump that is to be tested. Before the water flowsback into the tank, it flows through pipe (8), which is equipped with an orifice plate and twotapping points (6) and (7) at either side of that plate. At the far left end is the dischargevalve (1), which has the same automatic features as the intake valve.
The pump and motor are mounted on a base frame, which is shown in figure 3.2. Thebase frame consists of a floor frame (2), a motor pedestal (A) and a pump pedestal (B). Inorder to adjust the height for the various pumps one or more add-on frames (3) are placed onthe base plate. An electric motor powers the pump via v-belts. The pre-tensioning of thesebelts is done by adjusting the height of the whole motor. The motor is mounted on the topplate of the motor pedestal. The vertical adjustment of that top plate is done by means offour bolts (1) by which the plate is held up.
3.2 Tests
Performance testing at the Artarmon test bay is only carried out using water. This is becauseall the standards with which the pumps have to comply require water testing. Besides, it wouldbe impossible to obtain all the different slurries for the numerous slurry pump applications.Standards that are used include:
10

Figure 3.2: The base frame on the current medium test rig
• Australian Standard AS 2417
• International Standards Organization ISO 2548 & 3555
• German Standard DIN 1944
• Hydraulic Institute Standards HIS
• Japanese Standard JIS B8301
• American Petroleum Institute API 610
Although details differ between standards, they all require the same tests to be carried out.These tests include testing for head and flow rate for different speeds, NPSH testing, soundpressure level, vibration and bearing temperature rise testing.
The head and flow rate for different speeds define the pump. The pumps characteristiccurve is obtained from this test. The Net Positive Suction Head or NPSH is tested to establishthe cavitation performance. Cavitation occurs when the fluid pressure is so low in the intakeof a pump that vapor bubbles (or pockets) form and effectively block off the flow into thepump. Cavitation degrades the pump performance and can even destroy pump parts. Thelast three tests straight forward and are performed at the specified duty point of the pump.A detailed description of the tests, including the operating procedures are laid out in section4.2. [3]
11

12

Chapter 4
Performance analysis
Analyzing the performance of the medium test rig involves all quantitative and qualitativeaspects. The test rig should be quick and easy to use, and the test results should be accurateand reliable.
4.1 Changeovers
The changeover time is the time it takes to set up the test rig for a test. It also includesclearing the setup as it was used for the preceding test. The operating procedure for achangeover on the current medium test rig is listed below, starting with a clear test rig. Thenumbers between the brackets refer to figure 3.1 and 3.2.
1. Adjust height of the pump pedestal by clamping one or more add-on blocks (3.2: 3) onbase plate (3.2: 2).
2. Place and fix pump on pump pedestal (3.2: B).
3. Place and fix correct motor on motor pedestal (3.2: A).
4. Determine which pulleys and belts have to be used.
5. Search for right pulleys and place pulleys on pump and motor shafts.
6. Place belts on pulleys.
7. Pre-tension the belts by adjusting motor height.
8. Search for pipe segments and reducers for intake side (3.1: 10).
9. Get matching gaskets for flanges on intake side.
10. Adjust telescopic pipe (3.1: 9).
11. Attach pipes to telescopic pipe and intake flange.
12. Search for pipe segments and reducers for discharge side (3.1: 14).
13. Adjust telescopic pipes (3.1: 11) and (3.1: 13).
13
14. Get matching gaskets for flanges on discharge side.
15. Turn discharge section using slots in flange (3.1: 17).
16. Tighten all flange bolts.
17. Attach manometer tubes to (3.1: 6) and (3.1: 7).
18. Attach pressure gauge tubes to (3.1: 15) and (3.1: 16).
19. Place optical tachometer to measure motor speed.
20. Open intake and discharge valves (3.1: 1) and (3.1: 2).
21. Open air vents (3.1: 5) and (3.1: 12).
22. Fill system with water.
23. Close all air vents once the system is full.
4.2 Testing
Before the pump can be tested, one must ensure that the pump and motor are installedcorrectly and the pump is well assembled. First the operator turns on the motor for a briefmoment and lets the pump come to stop. If no irregularities occur, he turns on the motoragain and checks if the pump is running smoothly. The testing can begin, but not before theair is bled from the instrument lines by throttling the manometer and gauge valves.
4.2.1 Head, power and efficiency versus flow rate
During this part of the test the intake valve is opened completely and the flow rate is var-ied by partially opening the discharge valve. For a short moment, the discharge valve isclosed entirely. Then, seven other readings are done, the flow rate increasing more or lessevenly spaced including the duty point and the maximum flow. Each time the intake anddischarge pressures, flow rate, pump speed and power are recorded. The pressures are mea-sured with mechanical dial gauges and the flow rate is determined by measuring the pressuredifference over the orifice plate (figure 3.1: 8). The pressure difference is measured with anair-mercury-air manometer connected at both sides of the orifice plate. The power of thepump is determined by multiplying the flow rate and pressure difference over the pump. Theefficiency is the power the pump delivers divided by the power of the motor. That motorpower is determined with the measured current the motor draws at a known voltage.
4.2.2 NPSH test with constant flow rate method
This test starts by measuring the water temperature and the atmospheric pressure. Whenthe pump is set to the duty speed, the intake valve is fully opened. The discharge valve isthen adjusted to comply with the required flow rate. By entering the data into a spreadsheet,the total discharge head (TDH) and NPSH are calculated and plotted (TDH vs NPSH). Theintake and discharge pressures, pump speed and power are now recorded. Next, the suctionhead is reduced by approximately two meters by closing the intake valve, while maintaining
14
a constant flow rate by opening the discharge valve. If necessary, the drive speed can beadjusted. The operator records the intake and discharge pressures and repeats the last stepuntil the the TDH drops below 10% of the stable non-cavitating TDH.
4.2.3 Sound level, vibration and bearing temperature rise test
These tests can vary between different standards to which the pump has to comply, butmost standards request the following procedure. When the pump is running at duty speed,the sound pressure level has to be below a maximum allowable value at a certain distancefrom the pump casing. A minimum number of microphone positions may also be required.Background noise readings are taken and the measured values are corrected. The sound levelmeter is calibrated before and after each test using an acoustic calibrator.
With the pump running at duty speed, vibration measurements are taken at several po-sitions on the pump bearing assembly to cover vibration in three mutually perpendicularplanes. The measurements are done with a portable vibration meter that is to be held ontothe vibrating part.
With the pump again running at duty speed, temperature readings are taken on theoutside of the pump bearing housing, at both the drive and pump ends. Readings shouldbe taken over time at thirty minutes intervals, with the pump operating at fixed conditions,until stabilized. The readings are taken with a hand held, digital read-out thermometer, witha thermocouple type probe. Readings of temperatures rise can be high at start up due toexcessive grease churning or bearing run-in. If temperatures rise in excess of 90◦C, the pumpshould be stopped and allowed to cool before re-starting the test. It may be necessary to stopand start several times before the final bearing temperature rise can be ascertained. [4]
4.3 Evaluation
The test rig should make testing as quick and easy as possible. Because changes to the testingprocedures are not within the scope of this study, the changeovers on the test rig are to beimproved.
The changeover procedure as described in section 4.1 leaves plenty of room for improve-ments. Starting with point 1 and 2. Because there are only two different pump frame sizesfor testing on the medium test rig, there are only two pump pedestal heights necessary, eachwith four bolt holes. That the current medium test rig has several add-on blocks with manyholes and slots in the top plate makes choosing the right set-up needlessly difficult.
Pretensioning of the of the belts takes up much time currently. The operator places abelt around the two pulleys and then jacks up the whole motor. This is done by adjustingeight nuts on four threads, one at each corner of the motor pedestal. In order to overcome allfriction forces, the operator can only adjust one corner a little bit at a time. Meanwhile hechecks the tension of the belts by pressing against it and checking the deflection. The motorpedestal is also the least stiff part of the base frame. Vibrational problems are therefore mostlikely to occur at that side.
Finding the right reducers and pipes for the intake and discharge side can take quite sometime. Every pump has its own intake and discharge diameters, bolt hole diameters in theflanges (PCD) and distance from the fixed pipes. Although an experienced operator probablyis rather fast in finding the right combination, time spent on a test should not depend on theperson conducting the test.
15

16

Chapter 5
Design of the piping configuration
5.1 Intake side
Figure 5.1: Situation sketch of the intake side
The piping at the intake side of the pump has to connect the intake flange of the pump tothe flow straightener, (4) in figure 3.1. Because the axial distance varies between pumps, atelescopic pipe is needed to prevent having to use too many different pipes. Another functionthis set of piping has is reducing the diameter of the pipes from the diameter of the flowstraightener to the intake flange. These diameters also vary from pump to pump. Besides thediameter, connecting flanges also have to match the pitch circle diameter, or P.C.D. This isthe diameter of the circle described by the bolt holes in the flange. Having to keep an eye oncosts, as many pipes as possible have to be used that are already in stock. Although there is alist of pipes present at the test bay, modifications made to these pipes are often not recordedand a complete stock taking can be recommended. For this design however, we will assumethe list is accurate.
For the sake of simplicity, all pumps with the same frame will be bolted down at the sameposition. For that reason only four holes have to be drilled in the top plates and that theshaft ends are virtually in the same spot. In order tot achieve this goal, we have to make surethat all these pumps can be connected to the telescopic pipe at the intake side. This telescope
17

can be extended up to 55 cm (maximum distance D in figure 5.1). For some pumps however,this buffer is not entirely free to use. Sometimes when a pump is tested, the impeller has tobe changed in between tests. This means that a number of pumps has a minimum clearancespecified (distance C in figure 5.1). This clearance is necessary to dismantle the cover plateand change the impellers. In such a case it is most convenient and time efficient to disconnectthe pipe from the intake flange and slide back the telescope, without having to dismantle thewhole setup.
The fixed parameter is the distance from the flow straightener to the first anchor bolt ofthe current base frame (F in figure 5.1), which is 3.78 meter. There are six bolts anchoredin the concrete floor to fix the current base frame. They will also be used to fix the newframe. The parameter that is of importance for the design of a new base frame is the distancefrom the anchor bolt to a fixed position of the respective D and E frame pumps (parameterE in 5.1). In this case the first bolt hole of the pump frame is chosen for this position.Parameters A, B and C as shown in figure 5.1 vary for the different pumps. Parameter E canbe determined using:
Emin = A + B + P + C − F
Emax = A + B + P + D − F
with P being the total length of the pipe segments connecting the telescopic pipe to the intakeflange of the pump. Emin and Emax define a range in which the first bolt hole of the pumpframe can be. The pipe segments that make up P for each different pump have to be selectedso that all the ranges overlap. In this overlapping region we can pick a point to position thebolt holes on the pump plates. As a result, not only does the operator have the simple caseof only the one position for any pump, but it is also known which pipes have to be used fora specific pump. This saves the time and trouble of solving the puzzle every time. The pipecombinations are listed in tables 5.1 and 5.2. Now that distance E is determined for bothframe sizes the first concept of the base frame can be designed. The values of parameters A,B, C, E and P are listed in appendix A.
Pump pipe 1 pipe 2 pipe 3 pipe 44/3 D-SH C10 C3 C184/3 D-AHU C10 C3 C184/3 D-AH C10 C6 C8 G64/3 D-AHW C10 C6 C86/4 D-S D16 D18 D14 G66/4 D-SW D16 D18 D146/4 D-SC D22 G66/4 D-SCW D22 G66/4 D-AH D22 G66/4 D-AHW D22 G6150 D-GP E4 E128/6 D-S E4 E128/6 D-SW E4 E12
Table 5.1: Necessary pipes for D-frame pumps
18
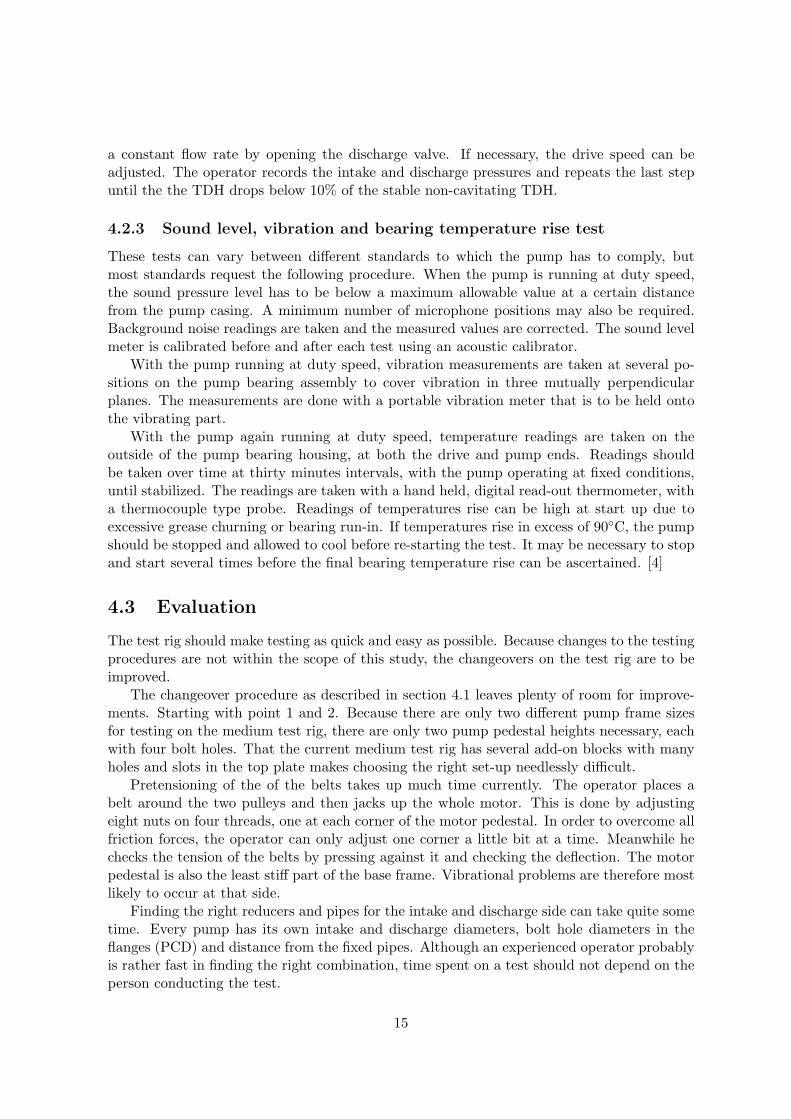
Pump pipe 1 pipe 2 pipe 34/3 E-HH C10 G106/4 E-SH E4 E6 D126/4 E-AH E4 E6 D12150 E-L E4 G108/6 E-SC E4 G108/6 E-SCW E4 G108/6 E-AH E4* G108/6 E-AHW E4* G10
Table 5.2: Necessary pipes for E-frame pumps. Pipes marked with * have to be slotted at theflange to match PCD’s
5.2 Discharge side
The position of the discharge flange is different for every pump. The only fixed parameter isthat the discharge flange is always in a horizontal plane. By making use of several ’rotationflanges’ in different orientations, all degrees of freedom can be covered. This concept isadopted from the WEIR Netherlands test facilities in Venlo, The Netherlands. Figure 5.2shows the discharge side of the test rig in Venlo, similar to the medium test rig at Warman.The green flanges in the picture are the rotation flanges, which can freely rotate along the axis.Because of the geometry of the pipes, the free pipe end can move in the horizontal plane aswell as up and down. The counterweight at the right balances the pipes. The whole systemcan be easily moved by one operator. The only pipe that has to be changed for differentpumps is the reducer. The reducer is clamped onto the pumps discharge flange rather thanbolted. This has three advantages: it is faster, the PCD’s doesn’t have to match and is savesone rotation flange on the vertical axis to line up the bolt holes. A full, detailed design of thepiping configuration is not done due to a lack of time.
19

Figure 5.2: Discharge side of a similar test rig in Venlo
20

Chapter 6
Design of the base frame
6.1 Concept
Figure 6.1: Base frame concept
The current base frame in the test rig is of a similar design to the frames that Warmansupplies with a pump and motor combination to costumers. The majority of these setups areinstalled once, the motor height adjusted in order to get the right belt tension, and then keptrunning. Occasionally, the motor pedestal can be readjusted to compensate for slacking ofthe belts. The way to tension the belts is robust and durable rather than quick and easy. Inthe test bay however, pump and motor changes are conducted regularly and getting the righttension in the belts takes up much time. For that reason the new design will have a jockeypulley rather than a adjustable motor height. As a result of the new tensioning system, themotor no longer has to be mounted on a high pedestal. By moving the motor shaft fromabove to underneath the pump shaft, the base frame becomes much more compact, which hasa good result on the vibrational properties.
Figure 6.1 shows the first base frame concept. The whole structure rests on the floorframe. It has a U shaped cross section and is attached to the concrete floor with six anchor
21

Figure 6.2: Jockey pulley system: side, top and iso view
bolts. On the left-hand side is the motor plate. This is the plate that supports the motor.Because the motor plate is placed directly on the floor frame, there is too little space toplace and tighten any nuts underneath. For this reason, a thread will be tapped in all theholes in the motor plate. This will also save time when mounting the motors, for it makesnuts obsolete. To ensure that the motor plate can be easily removed for maintenance andmodification in case of new motors, it will be bolted on the floor frame rather than welded.Underneath the motor plate a stiffener is added. This stiffener is a plate perpendicular to themotor plate and parallel to the long side of the floor frame. In order to keep the holes in themotor plate clear, the stiffener is placed on the middle line of the plate. As figure 6.1 shows,there are two pump plates. The lower one is for E frame pumps and is welded onto four squarehollow tubes which will be referred to as ’the columns’. Underneath the columns supports areadded in the floor frame to decrease the bending moment in the floor frame. The upper plateis for the D frame pumps and is welded on four columns of the same sort, though shorter.This plate and columns structure is only used when a D frame pump is tested, and can bebolted on the fixed lower pump plate when necessary. Both pump plates are strengthened bystiffeners: similar to the stiffeners underneath the motor plate, although in this case there aretwo crossed stiffeners per plate. The pulley frame in the back consists of two flange channelswith a beam between them. This beam is attached with two bolts, one through each channel.A jockey pulley should be as close to the smallest pulley as possible at the slack side of thebelt. Because any combination of pulleys is possible for use on the test rig, the position of thejockey pulley has to be adjustable in three directions. The beam can be adjusted in heightby choosing another set of holes in the channels. The beam carries a jockey pulley with itsadjusting mechanism. This is not depicted in figure 6.1, but the complete jockey pulley partof the base frame is shown in figure 6.2. The jockey mechanism consist of the main frame,two arms a push rod and an aluminium block on top to connect the rod with the main frame.The main frame is bolted through a slot in the beam between the flange channels. This givesthe jockey pulley the second degree of freedom. Now only the last degree of freedom has tobe taken into account. This is done by means of the previously mentioned pulley mechanism.The side view in figure 6.2 clearly shows four pin joints connecting the arms and the rod bothto the mainframe and the rod and the pulley both to the arms. Because the aluminium block
22

has a hole through which the rod can slide freely, the pulley can be positioned in forwarddirection. To secure the position, the rod is threaded and two nuts, one at both sides of theblock. Because two different belt types can be used, SPB and SPC belts, there have to betwo interchangeable jockey pulleys. There will be two complete mechanisms which can bebolted on the slotted beam in between the flange channels.
6.2 Dimensions and sections
In order to determine the sections and dimensions of the base frame, we have to know theforces that are acting on the base frame. Because many pump, motor, pulley and beltcombinations are possible for testing, a ’worst case scenario’ is considered in all calculations.Some assumptions have been made for the calculation of the sections and dimensions in orderto keep the calculations transparant. The main assumption is that all loads on the pump acton the base frame only at the points at which the pump is fixed to its pedestal and likewisefor the motor side. These reaction forces are calculated in appendix B.
Knowing the forces acting on the base frame, the plate and profile thicknesses can bedetermined. In order to do so, the structure is split up in smaller parts. These parts are allevaluated separately using approximations and fundamental structural mechanics. Detailedcalculations can be found in appendix D.
6.2.1 Pump plates
Although the two pump plates differ slightly, they can be checked in the same manner. Theyconsist of the plate, two stiffeners underneath and four bolt holes on which the assumed pointforces act. Due to the load, the structure will bend. The stiffeners will contribute the mostto the stiffness of the structure and because they are placed in such a way that they are veryclose to the holes, the assumption is made that the forces act directly on those members.For the sake of simplicity, the stiffeners will be checked separately. To account for the platestiffness somehow, the members will be considered as T sections. Due to the forces actingon the bolt holes, there will be reaction forces at the ends of the stiffeners, where they areattached to the columns. With these reaction forces, a maximum bending moment can bedetermined for each stiffener. According to the Australian standards handbook [5], the designbending moment is restricted as:
M∗x ≤ fyφZe. (6.1)
Where the design bending moment (M∗x) is the maximum bending moment as determined
before and fy the ultimate shear strength. φ Is the capacity factor according to Australianstandards [5] and Ze the effective section modulus, which depends on the thicknesses of theplate and stiffeners.
The pump plates have the following dimensions.
• D-frame pump plate: 16 mm
• Stiffener for D-frame pump plate: 70 × 16 mm
• E-frame pump plate: 16 mm
• Stiffener for E-frame pump plate: 60 × 12 mm
23

6.2.2 Columns
The columns of the pump pedestal are subject to compression, tension and a bending moment.They will be checked for buckling and bending, as these will be far more likely to occur thanpure compression or tension failure.
According to Australian Standards handbook [5], the elastic buckling load Nom of a mem-ber can be calculated as given below. This value should be higher than the maximum forceexerted on the columns.
Nom =π2EI
(kel)2(6.2)
Where E is the modulus of elasticity and l the length of the column. ke Is the member effectivelength factor that accounts for the way the column is fixed. The loads on the columns arethe reaction forces at the ends of the stiffeners, due to the point loads on the bolt holes, asdetermined in the previous subsection.
The bending should be calculated as in section 6.2.1. In this case M∗x is the maximum
lateral force determined in section B multiplied by the length of the column.
Fll ≤ fyφZe (6.3)
The BHP catalogue [7] contains standard square hollow tubes. For each tube size the effectivesection modulus Ze is given. This way the right tube can be selected.
The dimensions of the selected tubes for the columns are 75 × 75 × 3 mm.
6.2.3 Floor frame
The forces that act on the columns also act on the floor frame. The floor frame is made ofa U-profile channel on its side, resulting in a C-profile. Directly underneath the columns,stiffeners are added. A stiffener and a side of the C-profile form a T-section that is subjectto compression, tension and buckling. Checking for buckling is done as in section 6.2.2, withNom being the reaction forces R as determined in section 6.2.1. The maximum compressiona member with cross section area A and ultimate shear strength fy can withstand is
Fc = fyA. (6.4)
The thickness of the floor frame is 5 mm.
6.2.4 Motor plate
As explained in section 6.1, threads will be tapped in the motor plate to bolt the motordirectly onto the plate. The motor plate has to be thick enough to have an adequate threadfor even the biggest bolts. Because the plate basically substitutes the nuts, it will be as thickas the biggest nut it replaces (20 mm, see ’Ajax Fasteners’, [8]). The plate has one stiffenerunderneath in longitudinal direction, which is placed in the center. Because of symmetry, halfthe structure is considered for the strength calculations. The considered member consists ofhalf the motor plate, half the stiffener and the adjacent part of the floor frame. This part ofthe structure is checked for bending due to the motor reaction forces found in section C.1.After that, it will be checked for compression under the maximum compression force and its
24

own weight. Bending is checked in the same manner as before, using equation (6.1). In thisequation, only the effective section modulus Ze is unknown, which depends on the section ofthe structure. The geometry and the thicknesses of the motor plate and the floor frame areknown. Using those numbers, the minimum thickness of the stiffener is calculated. Compres-sion is checked by again using equation (6.4), in which Fc has to be larger than the maximumcompression force acting on the motor plate.
The thickness of the motor plate is 20 mm and the thickness of the stiffener is 5 mm.
6.2.5 Jockey pulley frame
The jockey pulley frame is made up by four parts that will be checked separately to deter-mine the sections and dimensions. The main force acting on the whole frame is the force thatthe belts exert on the jockey pulley. First this force has to be calculated using the earlierdetermined belt tension. The force acting on the jockey pulley is then directed through thearms and the push rod onto the main frame and the flange channels. The arms and the pushrod have one specific orientation in which the buckling or bending load has a maximum value.These worst case scenarios are considered when calculating the sections and dimensions ofthese parts. The main frame is subject to bending. This bending moment also depends onthe orientation of the mechanism. The flange channels finally are the last link in the chainand bear the whole load at a certain height, which make up the bending moment they aresubject to.
The resulting sections and dimensions can be found in appendix D.5.
6.3 Finite element analysis
In order to check the design of the base frame, both a static and harmonic analysis areconducted. The finite element analysis (FEA) software Strand7 was used to create a modelof the base frame. Figure 6.3 shows that model. Because the base frame consists mainlyof plates, the model is built up by plate elements, of the ’quad8’ kind. An exception is thebeam in the jockey pulley system, for which brick elements were chosen. Each element wasassigned the right structural properties and thicknesses. In figure 6.3, sections with the sameproperties have the same color. The baseplate is fixed to the ground at the positions of the sixanchor bolts, which attach the base frame to the floor. To prevent any numerical problems,an area around the bolt holes was fixed, rather than one node. The masses of the pump,motor and pulleys are represented by point masses at the respective centers of mass. Thepoint masses, forces and moments acting on the pump and motor are all directly connected tothe bolt holes on which the motor or pump is fixed using rigid links. Rigid links only transferthe forces and moments from one point to the other, without having any further physicalrepresentation. The forces are visualized in figure 6.3 as light blue arrows, the moments asgreen double pointed arrows. The rigid links have the same color as the forces and the goldcolored spheres depict the point masses.
25

Figure 6.3: Strand7 FEA model
6.3.1 Static analysis
For the calculations done for designing the base frame, many assumptions and approximationswere used. Wrong choices in these assumptions and miscalculations can not be tolerated. Thisanalysis is primarily done to check whether the calculations are indeed well conducted. Thestatic analysis calculates the stresses in the material and the displacement of every node inwhich the base frame is subdivided.
Figure 6.4 is the output of the stress calculations on the base frame. Von Mises Stresseswere chosen for the output, because that is a combination of the three main stress components.The figure shows that there are very high stress peaks, up to 1421 MPa. Comparing thatto the ultimate shear strength of steel, around 240 MPa, there is obviously a problem. Inthis case however it is a numerical problem. Because the each rigid links is connected to onlyeight nodes at the edge of a bolt hole, the loads are distributed over a very small area. Thismakes the stresses unrealistically high and these FEA results therefore unreliable. Refining
26
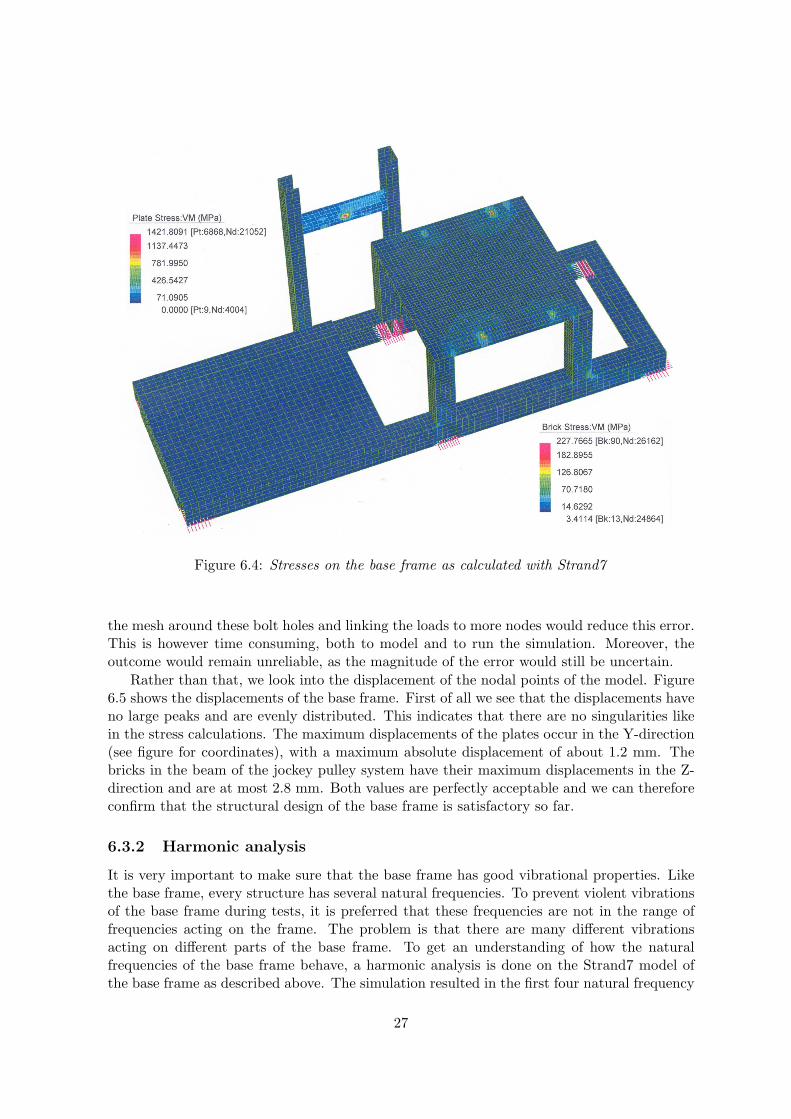
Figure 6.4: Stresses on the base frame as calculated with Strand7
the mesh around these bolt holes and linking the loads to more nodes would reduce this error.This is however time consuming, both to model and to run the simulation. Moreover, theoutcome would remain unreliable, as the magnitude of the error would still be uncertain.
Rather than that, we look into the displacement of the nodal points of the model. Figure6.5 shows the displacements of the base frame. First of all we see that the displacements haveno large peaks and are evenly distributed. This indicates that there are no singularities likein the stress calculations. The maximum displacements of the plates occur in the Y-direction(see figure for coordinates), with a maximum absolute displacement of about 1.2 mm. Thebricks in the beam of the jockey pulley system have their maximum displacements in the Z-direction and are at most 2.8 mm. Both values are perfectly acceptable and we can thereforeconfirm that the structural design of the base frame is satisfactory so far.
6.3.2 Harmonic analysis
It is very important to make sure that the base frame has good vibrational properties. Likethe base frame, every structure has several natural frequencies. To prevent violent vibrationsof the base frame during tests, it is preferred that these frequencies are not in the range offrequencies acting on the frame. The problem is that there are many different vibrationsacting on different parts of the base frame. To get an understanding of how the naturalfrequencies of the base frame behave, a harmonic analysis is done on the Strand7 model ofthe base frame as described above. The simulation resulted in the first four natural frequency
27

Figure 6.5: Displacement of the base frame as calculated with Strand7
modes:
1. 10.8 Hz, 649 rpm
2. 13.1 Hz, 785 rpm
3. 28.0 Hz, 1682 rpm
4. 55.1 Hz, 3303 rpm
Figures 6.6 to 6.9 show how the base frame behaves at the natural frequencies. The first mode(figure 6.6) is a rotating motion of the pump pedestal about an axis in the Y-direction, locatedat the center of the concentric lines of displacement. The rest of the modes are translatingmotions. The second mode (figure 6.7) is a motion in Y-direction, with a maximum deflectionat the right hand side columns. Mode three (6.8) is the pump plate vibrating in X-directionand the fourth mode concerns the entire motor plate. As can be seen in figure 6.9, the motorplate vibrates in Y-direction, having a maximum displacement at the right hand side motorbolt holes. The maximum displacements which occur at the natural frequencies are 1 to 2mm, which is most satisfying. Nonetheless, it is not desirable for any of the drive runningspeeds; motor speed, pump speed, impeller tip speed and belt speed, to interfere with anatural frequency of the base frame and set off a response. The fact that so many pump,motor, impeller, pulley and belt combinations are possible for use on the test rig makes it
28

Figure 6.6: First mode of natural frequency. Note: depicted displacements are scaled up forvisual purposes
29
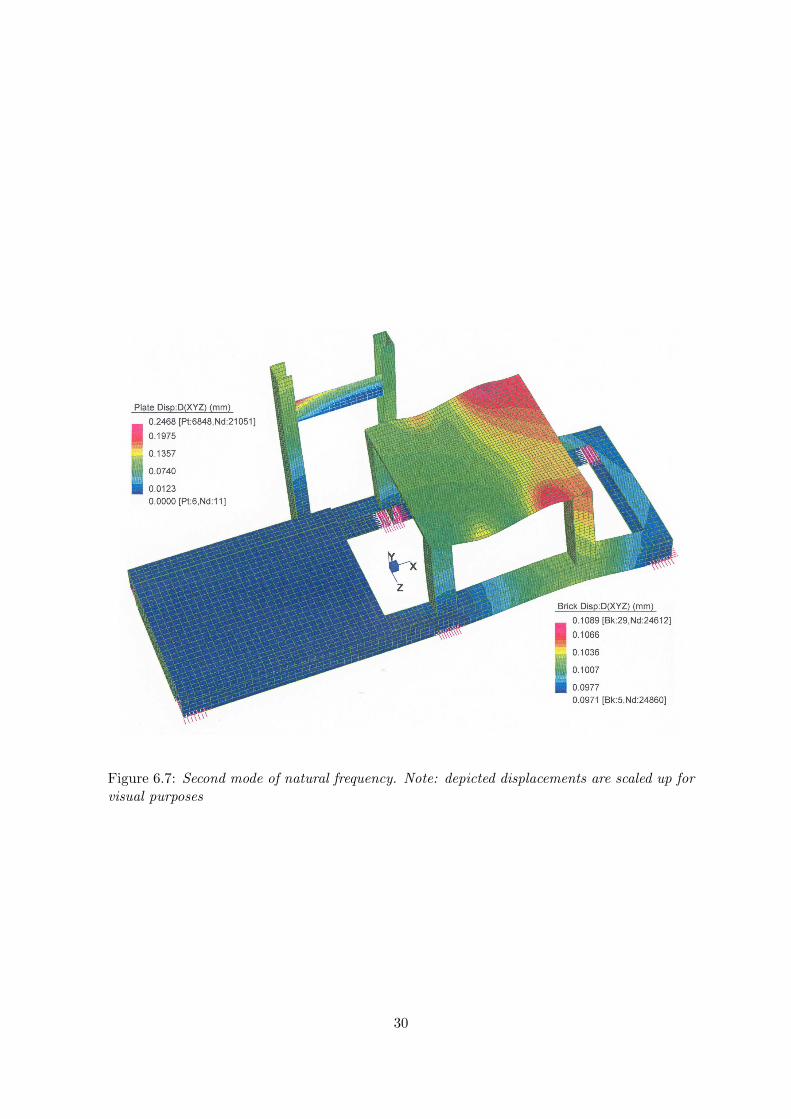
Figure 6.7: Second mode of natural frequency. Note: depicted displacements are scaled up forvisual purposes
30
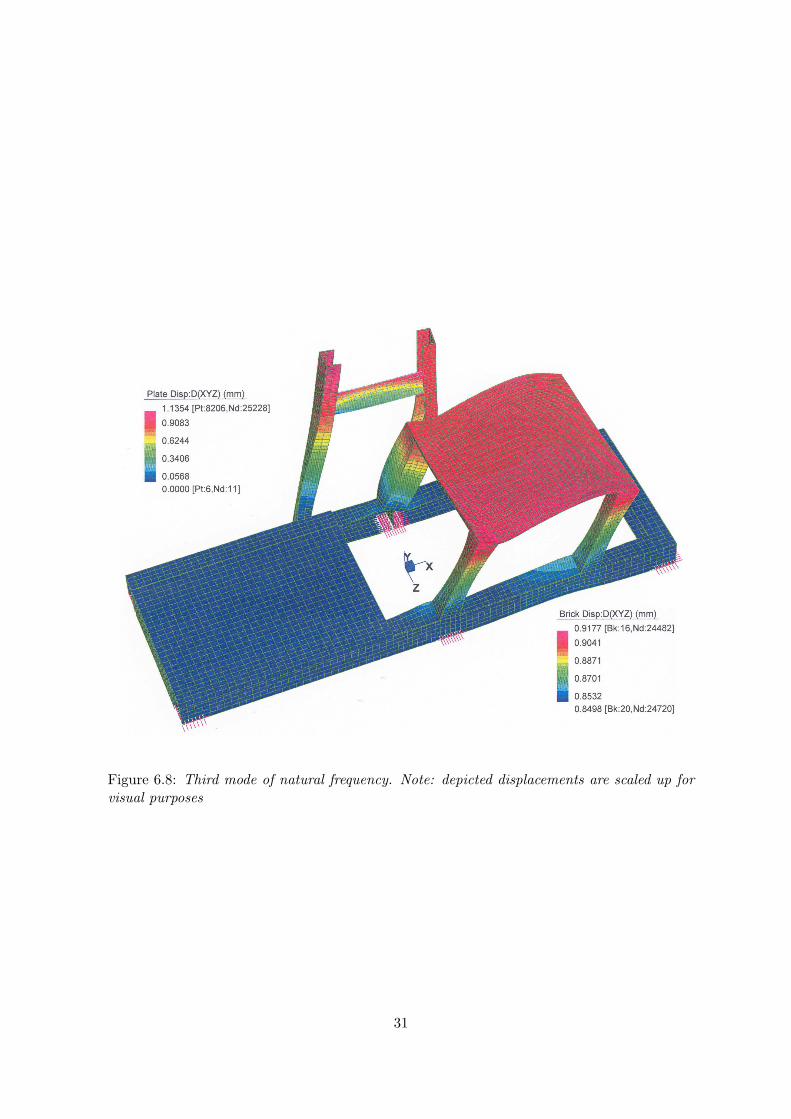
Figure 6.8: Third mode of natural frequency. Note: depicted displacements are scaled up forvisual purposes
31

Figure 6.9: Fourth mode of natural frequency. Note: depicted displacements are scaled up forvisual purposes
32

Pump Max. speed test speed ±10% of test speed6/4 S 1800 rpm 1440 rpm 1296 – 1584 rpm4/3 SH 1900 rpm 1520 rpm 1368 – 1672 rpm8/6 S 1650 rpm 1320 rpm 1188 – 1452 rpm6/4 SC, 8 vanes 1800 rpm 1440 rpm 1296 – 1584 rpm6/4 SC, 3 vanes 1800 rpm 1440 rpm 1296 – 1584 rpm4/3 AH 2750 rpm 2200 rpm 1980 – 2420 rpm150 GP 1400 rpm 1120 rpm 1008 – 1232 rpm6/4 AH 1800 rpm 1440 rpm 1296 – 1584 rpm6/4 SH 1450 rpm 1160 rpm 1044 – 1276 rpm150 L, 5 vanes 1300 rpm 1040 rpm 936 – 1144 rpm150 L, 4 vanes 1500 rpm 1200 rpm 1080 – 1320 rpm4/3 HH, 5 vanes 1400 rpm 1120 rpm 1008 – 1232 rpm4/3 HH, 4 vanes 1400 rpm 1120 rpm 1008 – 1232 rpm8/6 AH, 4, 560ø vanes 1300 rpm 1040 rpm 936 – 1144 rpm8/6 AH, 6, 545ø vanes 1300 rpm 1040 rpm 936 – 1144 rpm8/6 AH, 4, 510ø vanes 940 rpm 752 rpm 677 – 827 rpm
Table 6.1: Maximum, test and critical speeds of various pumps
seemingly impossible to rule out interference with every excitation. Therefore we use andcrystallize the information that we do have at our disposal. First, most of the motors in thetest bay are four pole motors and run at around 1400 rpm. Preferably, there is no naturalfrequency at at least ± 10% of an excited frequency. This means that the base frame shouldnot have a natural frequency in the range 1260 – 1540 rpm. Because the first three modes areall vibrations of the pump pedestal, we would like to know at which speeds the pumps arelikely to run when tested. In every Warman pump performance curve, there is a maximumrunning speed specified. Because most of these pumps (and impellers) are relatively small, soto put enough energy into the flow to maintain a decent flow rate (and achieve an acceptablelevel of efficiency) the test speeds are in the higher range of the pump operating speeds.Roughly, the running speeds can be supposed to be at 80% of the maximum running speeds.Table 6.1 shows all the pumps that have a known maximum running speed and could betested on the medium test rig.
Comparing the 10% test speed ranges, one can see that there are two odd ones in thelist, namely the 4/3 AH pump and the last listed 8/6 AH pump. The rest of the pumpshave a supposed test speed from 1040 to 1520 rpm. Therefore it should be wise to designthe base frame in such a way that there are no natural frequencies between 936 and 1672rpm. Although this condition is already satisfied, we will see wether the design can be furtheroptimized, i.e. wether the safe margin can be enlarged. We define a margin δ relative to thenatural frequencies of the base frame and we now have the following lower and upper margins(δl and δu):
δl =1040− 785
785· 100% = 32.5% and δu =
1682− 15201682
· 100% = 9.6%.
To obtain better margins, we first look at the third natural frequency of the base frame andnotice that its 1682 rpm is very close to the 1672 rpm we would like to evade. Preferably,
33
the third natural frequency mode must be increased, without raising the second mode toomuch, as we want to stay well clear from the 936 rpm lower limit. Examining the secondand third mode, we see that the second mode is mainly due to bending of the floor frame,while the third mode involves stretching and twisting of the pump pedestal columns. So bystiffening the pump pedestal and leaving the floor frame as it is, a more satisfying resultshould be achieved. First we increase the thickness of the pump pedestal columns from 3 to5 mm. After adapting the FEA model the simulation is ran again. These are the new firstfour natural frequency modes:
1. 12.1 Hz, 730 rpm
2. 13.7 Hz, 819 rpm
3. 32.0 Hz, 1921 rpm
4. 55.2 Hz, 3310 rpm
The third mode has indeed gone up more than the second and the new margins are:
δl =1040− 819
819· 100% = 27.0% and δu =
1921− 15201921
· 100% = 20.9%.
The lower margin is still well acceptable whereas the upper margin has doubled. Even theearlier discarded running speeds of the 4/3 AH and 8/6 AH pumps fit in better now.
Adding even more stiffness to the pump pedestal by adding diagonal 5 mm stiffener platesat the sides between the columns does raise the third mode of natural frequency, but raises thesecond one dramatically as well. This one now interferes with the pump and motor speeds,as the natural frequencies show:
1. 13.7 Hz, 822 rpm
2. 20.5 Hz, 1230 rpm
3. 54.6 Hz, 3276 rpm
4. 56.6 Hz, 3396 rpm
Considering all, base frame will be adapted only by increasing the thickness of the pumppedestal columns from 3 to 5 mm.
34
6.4 Final design
Figure 6.10: Base frame: front view
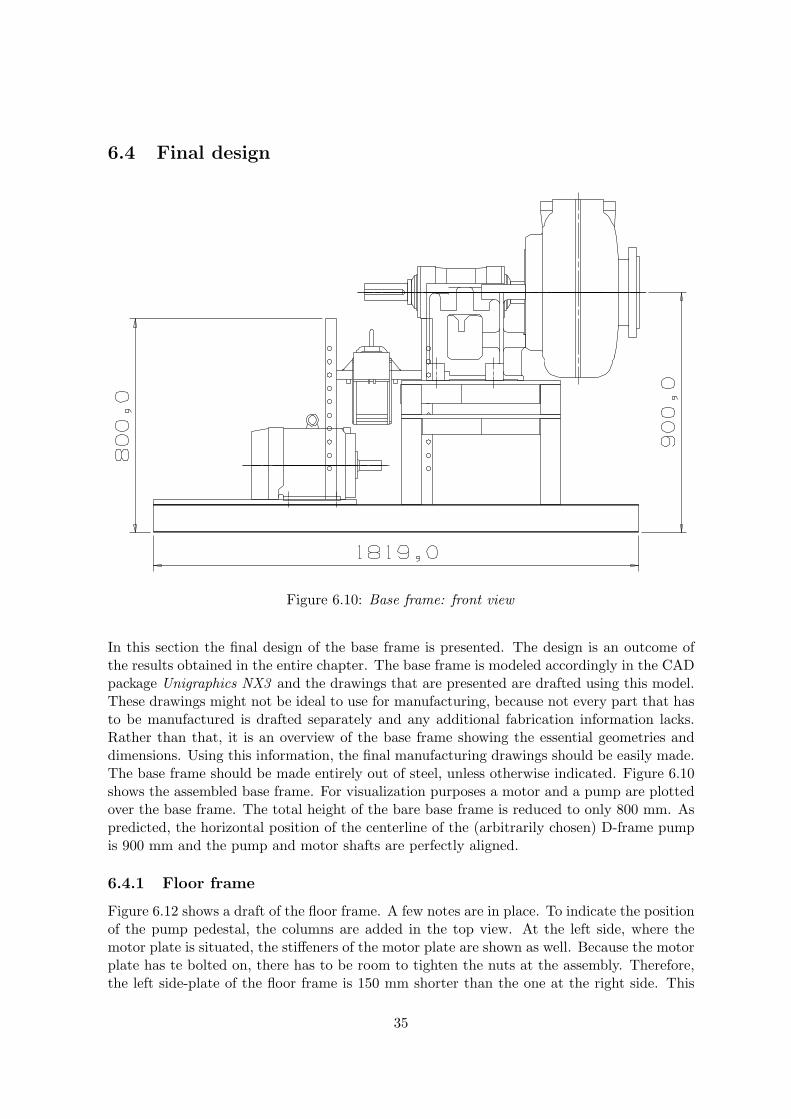
In this section the final design of the base frame is presented. The design is an outcome ofthe results obtained in the entire chapter. The base frame is modeled accordingly in the CADpackage Unigraphics NX3 and the drawings that are presented are drafted using this model.These drawings might not be ideal to use for manufacturing, because not every part that hasto be manufactured is drafted separately and any additional fabrication information lacks.Rather than that, it is an overview of the base frame showing the essential geometries anddimensions. Using this information, the final manufacturing drawings should be easily made.The base frame should be made entirely out of steel, unless otherwise indicated. Figure 6.10shows the assembled base frame. For visualization purposes a motor and a pump are plottedover the base frame. The total height of the bare base frame is reduced to only 800 mm. Aspredicted, the horizontal position of the centerline of the (arbitrarily chosen) D-frame pumpis 900 mm and the pump and motor shafts are perfectly aligned.
6.4.1 Floor frame
Figure 6.12 shows a draft of the floor frame. A few notes are in place. To indicate the positionof the pump pedestal, the columns are added in the top view. At the left side, where themotor plate is situated, the stiffeners of the motor plate are shown as well. Because the motorplate has te bolted on, there has to be room to tighten the nuts at the assembly. Therefore,the left side-plate of the floor frame is 150 mm shorter than the one at the right side. This
35

Figure 6.11: Base frame
gives assembly 75 mm space to fit his spanner at each side. A similar upright plate is locatedunderneath the right end of the motor plate. This plate is not taken into account for thestrength calculations in appendix D.4, so if it would cause practical problems, it can be leftout. The holes for the anchor bolts are measured on site and although the four outer holesare in a perfect rectangle, the two inner ones have a 5 mm offset, as shown in firgure 6.12.
6.4.2 Motor plate
The motor plate is shown in 6.13. As explained, every motor can be bolted directly ontothe threaded holes. The four outer holes are used to bolt the motor plate to the floor framewith M24 bolts and are not threaded. There are many motors available at Warman fortesting on the medium test rig and the motor plate has to be able to fit all these motors.Like pumps, motors have standardized frames with standard dimensions. A stock taking wasdone and every motor makes use of one of eight different frames. For practical reasons thedimensions of the holes necessary for each motor are not shown in the figure but are listedbelow. Parameters A, B, C and D as depicted in figure 6.13 can be found in the Toshibacatalogue [9]. Note that hole diameter D is the hole diameter in the motor frame. The threadin the plate should be that of the nearest standard metric thread. Parameter C is chosen insuch a way that the entire motor shaft is aligned directly underneath the pump shaft.
36
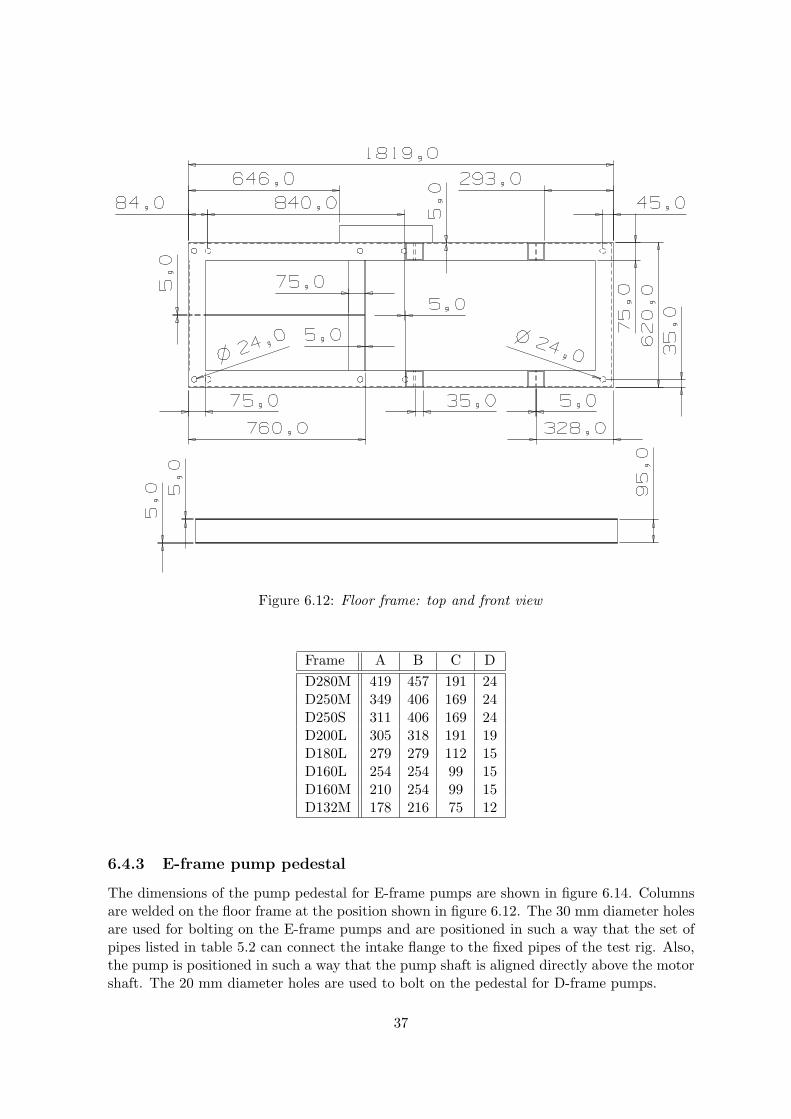
Figure 6.12: Floor frame: top and front view
Frame A B C DD280M 419 457 191 24D250M 349 406 169 24D250S 311 406 169 24D200L 305 318 191 19D180L 279 279 112 15D160L 254 254 99 15D160M 210 254 99 15D132M 178 216 75 12
6.4.3 E-frame pump pedestal
The dimensions of the pump pedestal for E-frame pumps are shown in figure 6.14. Columnsare welded on the floor frame at the position shown in figure 6.12. The 30 mm diameter holesare used for bolting on the E-frame pumps and are positioned in such a way that the set ofpipes listed in table 5.2 can connect the intake flange to the fixed pipes of the test rig. Also,the pump is positioned in such a way that the pump shaft is aligned directly above the motorshaft. The 20 mm diameter holes are used to bolt on the pedestal for D-frame pumps.
37

Figure 6.13: Motor plate: top view
6.4.4 D-frame pump pedestal
The pedestal for D-frame pumps is only used when a D-frame pump is tested. Figure 6.16shows the top and side view of the D-frame pump pedestal with its dimensions. The pedestalis bolted on the fixed pump pedestal with four bolts. The parts that are used for this con-nection are shown in figure 6.16. The reason that there are two different fasteners is simple:the stiffeners leave little room for the operator to fit the bolts.
6.4.5 Jockey pulley frame
As mentioned before, it is most recommended that the pulley and belt supplier is consultedabout the use and design of the jockey pulley and its frame. There has been some contact, inwhich the supplier indicated that it should be possible to use such a belt tensioning system,but no more information was present at that time. The actual pulley is not modeled, but it isrepresented by a simple cilinder. Obviously, the design can change depending on the jockeypulley and any additional information from the supplier. When altering the frame, one should
38

Figure 6.14: E-frame pump pedestal: top and front view
39

Figure 6.15: D-pedestal fasteners
always recalculate the structural properties as done in section 6.2.5 and appendix D.5. Thedimensions of the jockey pulley frame are given in figures 6.17 and 6.18. There should be twodifferent mechanisms. Each one consists of the mechanism shown in 6.18 without the slottedbeam and supports either an SPB or an SPC size pulley. Depending on the belt that is used,the right mechanism is simply bolted on the slotted beam. This beam could be quite heavyand less manageable when made of steel, so making it of aluminium is more practical. Thesame applies to the member through which the push rod can slide and is connected to themain frame.
40

Figure 6.16: D-frame pump pedestal: top and side view
41

Figure 6.17: Complete jockey pulley frame: top, side and front view
42
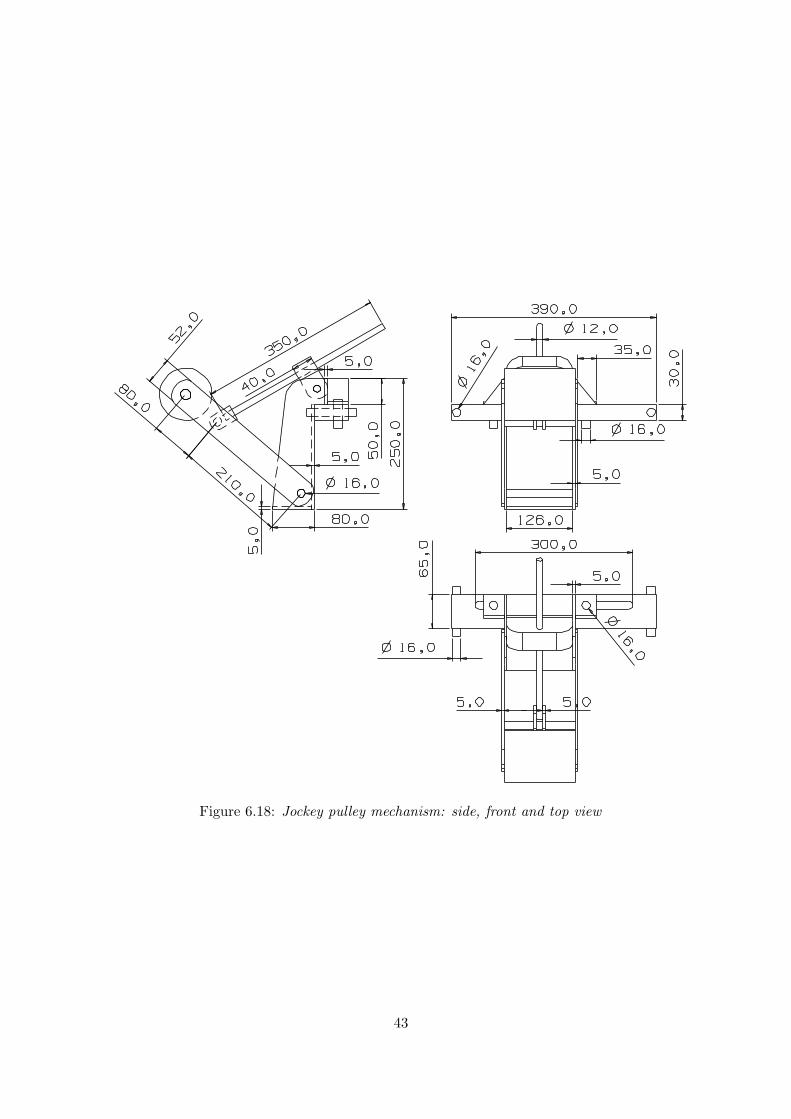
Figure 6.18: Jockey pulley mechanism: side, front and top view
43

44

Chapter 7
Conclusions
The medium test rig in its current state leaves much room for improvement. The operatorconducting a test faces the same challenges every time a new pump is set up for testing. Thebase frame is not standardized for the standard pump and motor frames. To get the righttension in the v-belts the operator has to lift the whole motor by adjusting eight nuts onfour threads, small steps at a time to overcome friction. To find the piping that is necessaryto connect the fixed piping to the intake flange of the pump requires experience because thepipes in stock are not properly documented. To fit the discharge pipes the operator has touse a scissor lift to adjust several telescopic pipes, which takes time and some safety risks.
Solutions to all these problems are presented. A new design for a base frame proposedthat makes use of a jockey pulley to pre-tension the v-belts quick and easy, adjusting onlyone thread. It also also makes use of the standardized frames of the motors and pumps.Thanks to this standardization, every combination of pipes at the intake side of the pumpis known. These combinations are documented and enable any Warman employee to quicklyfind the right pipes. A whole new ’drag ’n drop’ piping configuration at the discharge side isproposed using rotation flanges. Fitting these flanges in the correct orientation and adding acounterweight makes it very easy to fit the piping to the discharge flange of the pump.
The base frame is thoroughly checked for its structural and vibrational properties. Theapproximations for finding the reaction forces on a pumps bolt holes presented in appendixB are described in great detail and can be used for similar problems.
45

46

Chapter 8
Recommendations
In this chapter there will be some comments on the study presented in the report. First ofall, although much effort has gone in to this research, it is no guarantee that everything iswithout errors. Moreover, there is no substitute for experience, so please make sure the reportgets read carefully by an experienced Warman engineer.
For a smoothly operating test bay, it is recommended that all pipes and reducers are labeledand stored orderly. A well arranged stock combined with tables 5.1 and 5.2 make changingthe piping at the intake side of the setup light work. An idea for the piping at the dischargeside is proposed in chapter 5.2. Although it is not completely designed in this report, it isworthwhile to look into. It is recommended that the supplier is contacted about the rotationflanges. If desired, Weir Netherlands in Venlo, where this system is already implemented, canalso be contacted.
The spreadsheet that is currently used for calculating the reaction forces on Warman basefram contains some crude calculations and approximations. This is the reason why appendixB proposes a new calculation of these forces. Because some of the problems are staticallyindeterminate, approximations had to be used, resulting in errors as well. These errors, how-ever, are minimized. The calculations are documented very detailed and can easily be fedinto a spreadsheet.
As mentioned before, the jockey pulley frame and especially the adjusting mechanism isdesigned around the actual jockey pulley. The supplier of belts and pulleys will know moreconcerning the materials that are best to be used. The frame can than be carefully adjustedto the pulley, respecting the strength calculations in section 6.2.5 and appendix D.5.
In designing the base frame, standard material dimensions were not always reckoned with.The flange channels of the jockey pulley frame and the square hollow sections used for thecolumns are in fact found in supplier catalogues, but the rest of the plate material was not.If it turns out to be more practical or economical to change some dimensions of the baseframe, please make sure the essential dimensions, e.g. the pump height, remain unchanged.Obviously, the altered parts should be checked again for there structural properties.
47

48
Appendix A
Piping
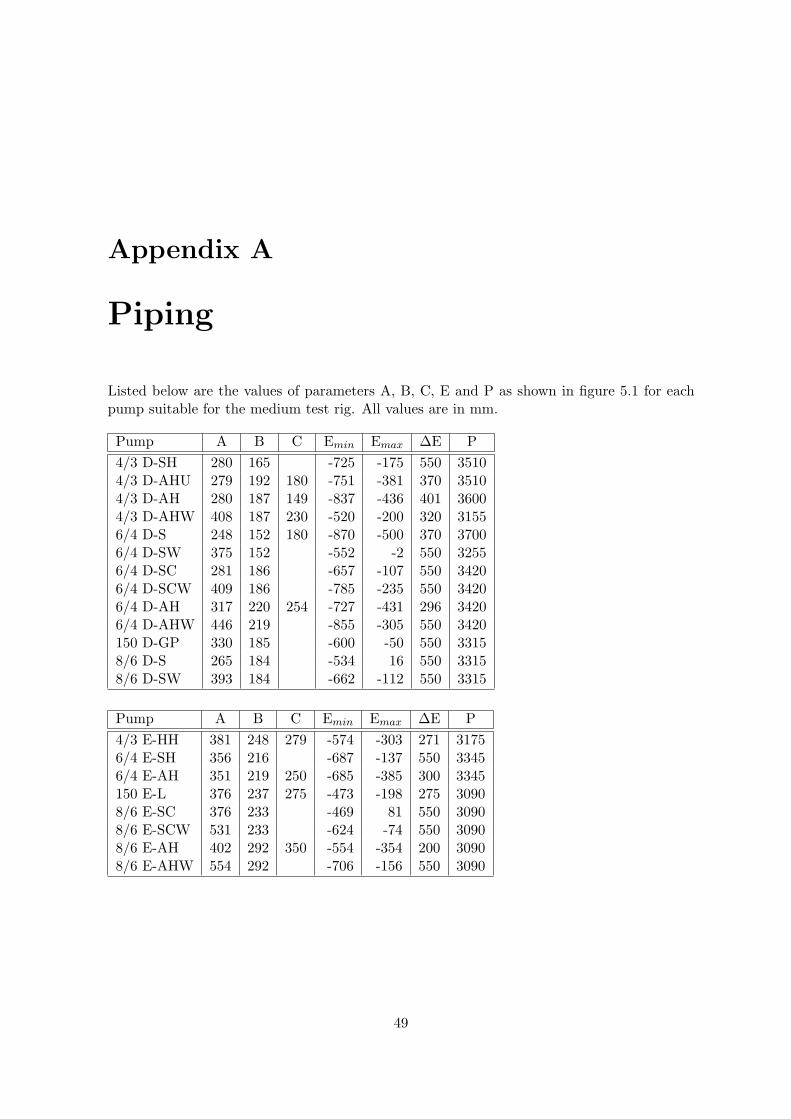
Listed below are the values of parameters A, B, C, E and P as shown in figure 5.1 for eachpump suitable for the medium test rig. All values are in mm.
Pump A B C Emin Emax ∆E P4/3 D-SH 280 165 -725 -175 550 35104/3 D-AHU 279 192 180 -751 -381 370 35104/3 D-AH 280 187 149 -837 -436 401 36004/3 D-AHW 408 187 230 -520 -200 320 31556/4 D-S 248 152 180 -870 -500 370 37006/4 D-SW 375 152 -552 -2 550 32556/4 D-SC 281 186 -657 -107 550 34206/4 D-SCW 409 186 -785 -235 550 34206/4 D-AH 317 220 254 -727 -431 296 34206/4 D-AHW 446 219 -855 -305 550 3420150 D-GP 330 185 -600 -50 550 33158/6 D-S 265 184 -534 16 550 33158/6 D-SW 393 184 -662 -112 550 3315
Pump A B C Emin Emax ∆E P4/3 E-HH 381 248 279 -574 -303 271 31756/4 E-SH 356 216 -687 -137 550 33456/4 E-AH 351 219 250 -685 -385 300 3345150 E-L 376 237 275 -473 -198 275 30908/6 E-SC 376 233 -469 81 550 30908/6 E-SCW 531 233 -624 -74 550 30908/6 E-AH 402 292 350 -554 -354 200 30908/6 E-AHW 554 292 -706 -156 550 3090
49

50

Appendix B
Reaction forces
The reaction forces on the base frame are important parameters in the new design. Theseforces are made up by several forces acting at the pump and motor. Equation (B.1) showsthe reaction forces on the pump pedestal and equation (B.2) shows the reaction forces on themotor pedestal.
pump: Σ~Fframe = Σ~Fg + Σ~Fbelt + Σ~Fflange (B.1)
motor: Σ~Fframe = Σ~Fg + Σ~Fbelt + Σ~Ftorque (B.2)
We assume that the total force on the frames only act at the four points at which the pumpor motor frame is fixed to its pedestal. This gives a good insight in the load distribution andis not to laborious to calculate. Because this base frame will be designed for a wide rangeof pumps rather than one, assumptions have to be made based on worst case scenarios. Incalculating the reaction forces of the various forces and moments acting at different points ofthe pump and motor, we will first use parameters in stead of values to be able to check theresults more easily.
Because the pump and motor are fixed to their pedestals at four points, some of theproblems are statically indeterminate. In order to make a good estimate for the reactionforces in these cases, we use two dimensional views from both the side and the front. Theside view is used in the left drawing of figure B.2, the front view is the view onto the intakeflange. Combining the results from both views gives an approximation for the reaction forcesin the bolts. Because many of the problems in this section are of similar nature: reactions ofa force at an offset, a general 2D model is introduced. This model is presented in figure B.1.Specific values and parameters will be assigned to the model for each situation.
First, the reaction forces will be determined for a force in the vertical direction, Fy. Onecan see straight away that there are no horizontal reaction forces: Pz = Qz = 0. The verticalreaction forces are determined by the balance of moments about points p and q.
ΣMp = 0 : (l1 + l2)Fy + l1Qy = 0ΣMq = 0 : l2Fy − l1Py = 0
This gives:
Py =l2l1
Fy and (B.3)
Qy = − l1 + l2l1
Fy. (B.4)
51

p q
Fy
Fz
Py Qy
Pz Qz
l1 l2
l3
Figure B.1: 2D force model
A quick check shows that all forces add up to zero: Py + Qy + Fy = 0. Now we consider ahorizontal force, Fz. This time the horizontal reaction forces are not equal to zero. Again,this problem is indeterminate, because both points p and q are fixed in horizontal direction.To avoid elaborate calculations of minimal value, we assume that the horizontal force Fz isequally distributed over points p and q:
Pz = Qz = −12Fz. (B.5)
The vertical reaction forces Py and Qy can also be determined by using the moments aboutp and q.
ΣMp = 0 : l3Fz + l1Qy = 0ΣMq = 0 : l3Fz − l1Py = 0
This gives:
Py =l3l1
Fz and (B.6)
Qy = − l3l1
Fz. (B.7)
B.1 Pump reaction forces
Figure B.2 shows the 8/6 AH slurry pump. This is the biggest and heaviest pump that can betested on the medium test rig and which has a known mass. The most important dimensionsas well as the assigned numbers to the four bolt holes are depicted. As mentioned before thedimensions that are used will be parametrical for the time being.
B.1.1 Gravitational forces
The pump mass is represented by a single point load acting at the center of mass. When apump is designed at Weir Warman, the center of mass is not entirely determined. Only thehorizontal distance from the intake flange is calculated, but it is reasonable to assume thatthe center of mass is on the centerline of the pump. We can now use the model presented in
52

Figure B.2: pump dimensions
figure B.1 and plug in the right parameters for the problem. In this case, l1 = C, l2 = D andFy = mpg, where mp is the mass of the pump and g is the gravitational acceleration. Point prepresents the line through points 1 and 4, and q the line through 2 and 3. Due to symmetryPy and Qy are equally distributed over the points on lines p and q. This results in:
F1y,1 = F4y,1 = LdD
2Cmpg and (B.8)
F2y,1 = F3y,1 = −LdC + D
2Cmpg. (B.9)
With F1y to F4y the reaction forces in vertical direction at points 1 to 4. Ld is a safety factoraccording to Australian standards [12]. The standard specifies safety factors for two types ofloads: dead loads (Ld) and live loads (Ll). Live loads are loads that are applied externallyand/or involve moving parts, the dead load is none of that and thus basically the gravitationalforce. The mass of the pulley also has to be taken into account. This is represented by a pointload at the end of the pump shaft. Similar to the method used above, now l1 = C, l2 = Kand Fy = mplg, where mpl is the mass of the pulley. Parameter p represents the line throughpoints 2 and 3, and q the line through 1 and 4. Py and Qy are again equally distributed overthe points on lines p and q. We find:
F1y,2 = F4y,2 = −LdC + K
2Cmplg and (B.10)
F2y,2 = F3y,2 = LdK
2Cmplg. (B.11)
B.1.2 Belt tension forces
Warman protocol states that the belt tension is to be calculated according to the Fenner beltdrive manual. To calculate the static tension, TS , we need to estimate the force, P , requiredto depress a belt 16 mm per meter of span. An indication of P and the formulae (B.12) to(B.14) can be found in the catalogue. With nb being the number of belts used:
TS = 32P · nb (B.12)
53

To determine the approximate total, dynamic tension, TD, imposed by a drive when running,the centrifugal tension per side, TC , must be subtracted from the static tension.
TD = 2(16P − TC)nb (B.13)
The centrifugal tension developed in a belt is a function of its weight and the square of itsvelocity.
TC = MS2, with S =πdn
60(B.14)
In (B.14), M is the mass per meter length of the belt, d the diameter of one pulley and n therotational speed of that pulley in revs/min. As well as P , M can be found in Fenner [10].Similar to the gravitational force of the pulley, the belt tension force acts at the end of thepump shaft.
F1y,3 = F4y,3 = −LlC + K
C
[16P −M
(πdn
60
)2]nb and (B.15)
F2y,3 = F3y,3 = LlK
C
[16P −M
(πdn
60
)2]nb. (B.16)
Again, safety factors are applied.
B.1.3 Flange loads
For every Warman pump there is a list of maximum allowable flange loads and moments [11].Because these are the maximum loads the pump can bare before breaking, these loads includenearly every external load on the pump. This is the reason why the shaft torque from thebelt drive and the impuls due to the fluid flow are not separately considered. A base framefor a pump has to be designed to withstand the reaction forces of those loads. In those loadsa safety factor is already included. The maximum allowable flange loads and moments areshown in figure (B.3). The forces and moments are specified as listed below.
Intake flange:
• Fz = Axial load along the z axis, into or out of the pump through A
• Fxy = Force in the xy plane in any direction through A
• Mz = Torsional moment about the z axis through A
• Mxy = Torsional moment about any axis in the xy plane through A
Discharge flange:
• Fy = Axial load along the y axis, into or out of the pump through B
• Fxz = Force in the xz plane in any direction through B
• My = Torsional moment about the y axis through B
• Mxz = Torsional moment about any axis in the xz plane through B
54

Fz
Fxz
Fxy
Fy
x
y
z
A
B
Mz
Mxy
My
MxzB
A
Figure B.3: maximum allowable f lange loads and moments
Point A is located at the center of the outside face of the intake flange and point B atthe center of the outside face of the discharge flange. Although axial and radial forces areactually acting at the bolt pitch circle diameter (PCD), they are assumed to act as pointloads at points A and B. The directions in which the forces and moments act are based on aworst case scenario adding as much as possible to the already calculated reaction forces. Thedirections are depicted in figure B.3.
First, we determine the reaction forces due to the loads acting at the intake flange. Onceagain, the model in figure B.1 and the symmetry is used. This time, l1 = C, l2 = F andl3 = G. Point p represents the line through 1 and 4, q the line through 2 and 3. Filling inthese values in equations (B.3) and (B.4) gives the reaction forces due to Fxy.
F1y,4 = F4y,4 =F
2CFxy (B.17)
F2y,4 = F3y,4 = −C + F
2CFxy. (B.18)
The reaction forces due to Fz are determined by using equations (B.5) to (B.7). Again usingthe symmetry to find the correct formulae.
F1z,1 = F2z,1 = F3z,1 = F4z,1 = −14Fz (B.19)
F1y,5 = F4y,5 =G
2CFz (B.20)
F2y,5 = F3y,5 = − G
2CFz (B.21)
Determining the reaction forces due to the loads on the discharge flange is not as straight for-ward as the previous cases. Because the discharge flange is not on the center plane (involving
55

the centerline and the y axis), we can no longer appeal to symmetry and simply divide theforces found from the side view by 2. To overcome this problem, we use the views from boththe side and the front and average the reaction forces found in these views for each point.This will give a good estimate for the actual answer to the indeterminate problem. Beginningwith the side view, we find that l1 = C, l2 = E and l3 = H. Point p represents the linethrough 1 and 4, q the line through 2 and 3. For the front view, l1 = A, l2 = B and l3 = H.Point p represents the line through 3 and 4, q the line through 1 and 2. With superscript sfor the side view reactions and f for the front view we find the reactions due to Fy:
F s1y = F s
4y =E
2CFy
F s2y = F s
3y = −C + E
2CFy
F f1y = F f
2y = −A + B
2AFy
F f3y = F f
4y =B
2AFy.
Averaging the forces found for both views gives the approximation of the reaction forces dueto Fy.
F1y,6 = −12
(A + B
2A− E
2C
)Fy (B.22)
F2y,6 = −12
(A + B
2A+
C + E
2C
)Fy (B.23)
F3y,6 =12
( B
2A− C + E
2C
)Fy (B.24)
F4y,6 =12
( B
2A+
E
2C
)Fy (B.25)
The reaction forces due to the horizontal force on the discharge flange, Fxz, are approximatedin the same manner as the reactions due to Fy. Using equations B.5 to B.7 we find:
F1z,2 = F2z,2 = F3z,2 = F4z,2 = −14Fxz (B.26)
F1y,7 = −12
( H
2A− H
2C
)Fxz (B.27)
F2y,7 = −12
( H
2A+
H
2C
)Fxz (B.28)
F3y,7 =12
( H
2A− H
2C
)Fxz (B.29)
F4y,7 =12
( H
2A+
H
2C
)Fxz. (B.30)
B.1.4 Flange moments
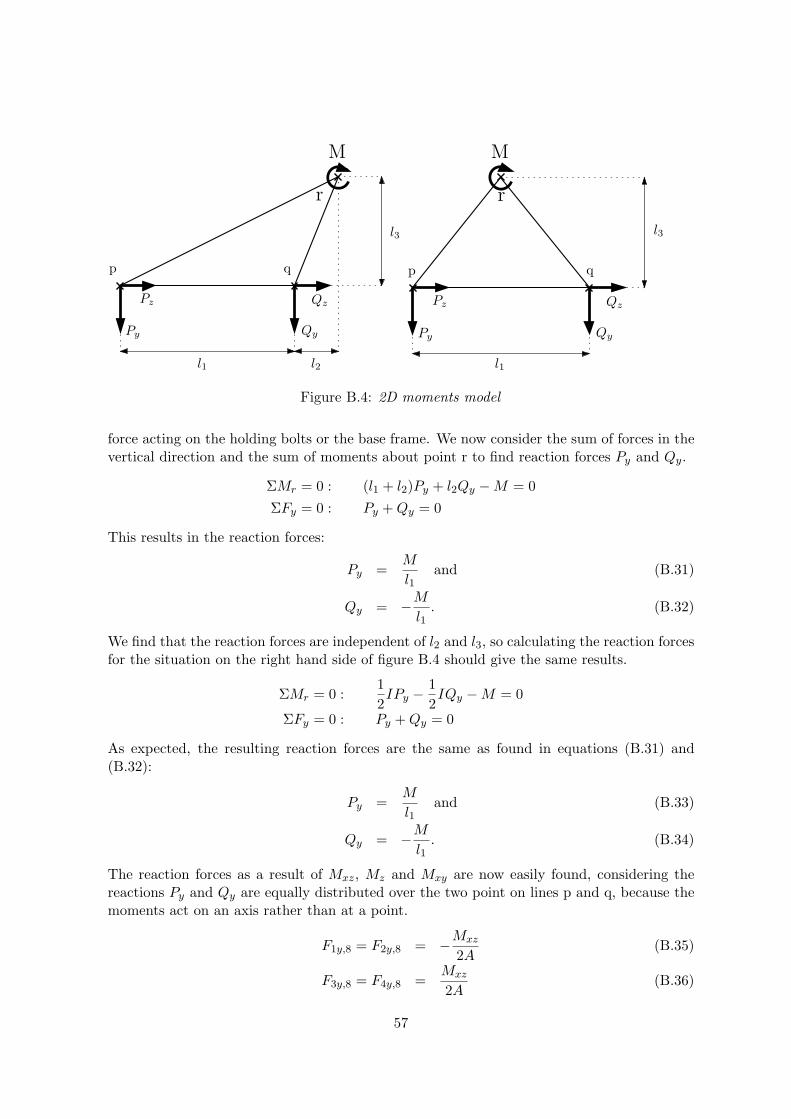
In order to calculate the reaction forces as a result of the maximum allowable flange momentsin the xz plane, the model in figure B.1 is slightly modified, as presented in figure B.4.Starting with the left model, where there is a moment M acting at two offsets, the balance offorces in the horizontal direction shows that Pz = −Qz. This means that there is no resulting
56
p q
Py Qy
Pz Qz
M
r
l1 l2
l3
p q
Py Qy
Pz Qz
M
r
l1
l3
Figure B.4: 2D moments model
force acting on the holding bolts or the base frame. We now consider the sum of forces in thevertical direction and the sum of moments about point r to find reaction forces Py and Qy.
ΣMr = 0 : (l1 + l2)Py + l2Qy −M = 0ΣFy = 0 : Py + Qy = 0
This results in the reaction forces:
Py =M
l1and (B.31)
Qy = −M
l1. (B.32)
We find that the reaction forces are independent of l2 and l3, so calculating the reaction forcesfor the situation on the right hand side of figure B.4 should give the same results.
ΣMr = 0 :12IPy − 1
2IQy −M = 0
ΣFy = 0 : Py + Qy = 0
As expected, the resulting reaction forces are the same as found in equations (B.31) and(B.32):
Py =M
l1and (B.33)
Qy = −M
l1. (B.34)
The reaction forces as a result of Mxz, Mz and Mxy are now easily found, considering thereactions Py and Qy are equally distributed over the two point on lines p and q, because themoments act on an axis rather than at a point.
F1y,8 = F2y,8 = −Mxz
2A(B.35)
F3y,8 = F4y,8 =Mxz
2A(B.36)
57

F1y,9 = F2y,9 = −Mz
2A(B.37)
F3y,9 = F4y,9 =Mz
2A(B.38)
F1y,10 = F4y,10 = −Mxy
2A(B.39)
F2y,10 = F3y,10 =Mxy
2A(B.40)
The last moment we have to find the reaction forces for is My, a torque acting on the discharge
1 2
34
My
A
B
C E
Fz
Fx FM
Figure B.5: model for My approximation
flange. Once again, this is an indeterminate problem. It is clear that the moment doesn’tinflict any vertical forces. However, there are reaction forces in the horizontal plane, thathave to be approximated. For this approximation, we replace the moment at the dischargeflange with a force, FM , acting at the center of the rectangle made up by points 1, 2, 3 and4, producing moment My. A sketch is shown in figure B.5. FM is made up by its componentsin x and z direction: Fx and Fz:
Fx = MyB + 1
2A
(B + 12A)2 + (E + 1
2C)2
Fz = MyE + 1
2C
(B + 12A)2 + (E + 1
2C)2
These forces have reaction forces at points 1, 2, 3 and 4. Because Fx and Fz act at the center,the reaction forces are evenly distributed over the four points:
F1x = F2x = F3x = F4x = −My
4B + 1
2A
(B + 12A)2 + (E + 1
2C)2(B.41)
58
F1z,3 = F2z,3 = F3z,3 = F4z,3 = −My
4E + 1
2C
(B + 12A)2 + (E + 1
2C)2(B.42)
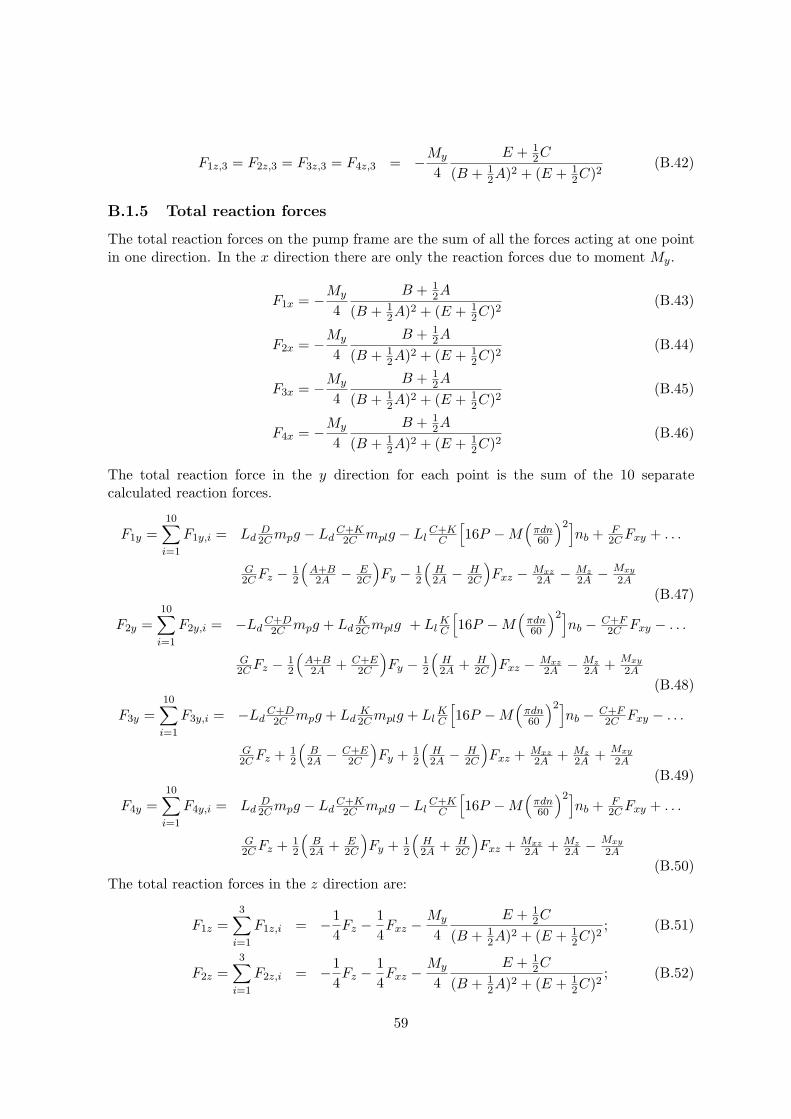
B.1.5 Total reaction forces
The total reaction forces on the pump frame are the sum of all the forces acting at one pointin one direction. In the x direction there are only the reaction forces due to moment My.
F1x = −My
4B + 1
2A
(B + 12A)2 + (E + 1
2C)2(B.43)
F2x = −My
4B + 1
2A
(B + 12A)2 + (E + 1
2C)2(B.44)
F3x = −My
4B + 1
2A
(B + 12A)2 + (E + 1
2C)2(B.45)
F4x = −My
4B + 1
2A
(B + 12A)2 + (E + 1
2C)2(B.46)
The total reaction force in the y direction for each point is the sum of the 10 separatecalculated reaction forces.
F1y =10∑
i=1
F1y,i = LdD2C mpg − Ld
C+K2C mplg − Ll
C+KC
[16P −M
(πdn60
)2]nb + F
2C Fxy + . . .
G2C Fz − 1
2
(A+B2A − E
2C
)Fy − 1
2
(H2A − H
2C
)Fxz − Mxz
2A − Mz2A − Mxy
2A
(B.47)
F2y =10∑
i=1
F2y,i = −LdC+D2C mpg + Ld
K2C mplg + Ll
KC
[16P −M
(πdn60
)2]nb − C+F
2C Fxy − . . .
G2C Fz − 1
2
(A+B2A + C+E
2C
)Fy − 1
2
(H2A + H
2C
)Fxz − Mxz
2A − Mz2A + Mxy
2A
(B.48)
F3y =10∑
i=1
F3y,i = −LdC+D2C mpg + Ld
K2C mplg + Ll
KC
[16P −M
(πdn60
)2]nb − C+F
2C Fxy − . . .
G2C Fz + 1
2
(B2A − C+E
2C
)Fy + 1
2
(H2A − H
2C
)Fxz + Mxz
2A + Mz2A + Mxy
2A
(B.49)
F4y =10∑
i=1
F4y,i = LdD2C mpg − Ld
C+K2C mplg − Ll
C+KC
[16P −M
(πdn60
)2]nb + F
2C Fxy + . . .
G2C Fz + 1
2
(B2A + E
2C
)Fy + 1
2
(H2A + H
2C
)Fxz + Mxz
2A + Mz2A − Mxy
2A
(B.50)The total reaction forces in the z direction are:
F1z =3∑
i=1
F1z,i = −14Fz − 1
4Fxz − My
4E + 1
2C
(B + 12A)2 + (E + 1
2C)2; (B.51)
F2z =3∑
i=1
F2z,i = −14Fz − 1
4Fxz − My
4E + 1
2C
(B + 12A)2 + (E + 1
2C)2; (B.52)
59
F3z =3∑
i=1
F3z,i = −14Fz − 1
4Fxz − My
4E + 1
2C
(B + 12A)2 + (E + 1
2C)2; (B.53)
F4z =3∑
i=1
F4z,i = −14Fz − 1
4Fxz − My
4E + 1
2C
(B + 12A)2 + (E + 1
2C)2. (B.54)
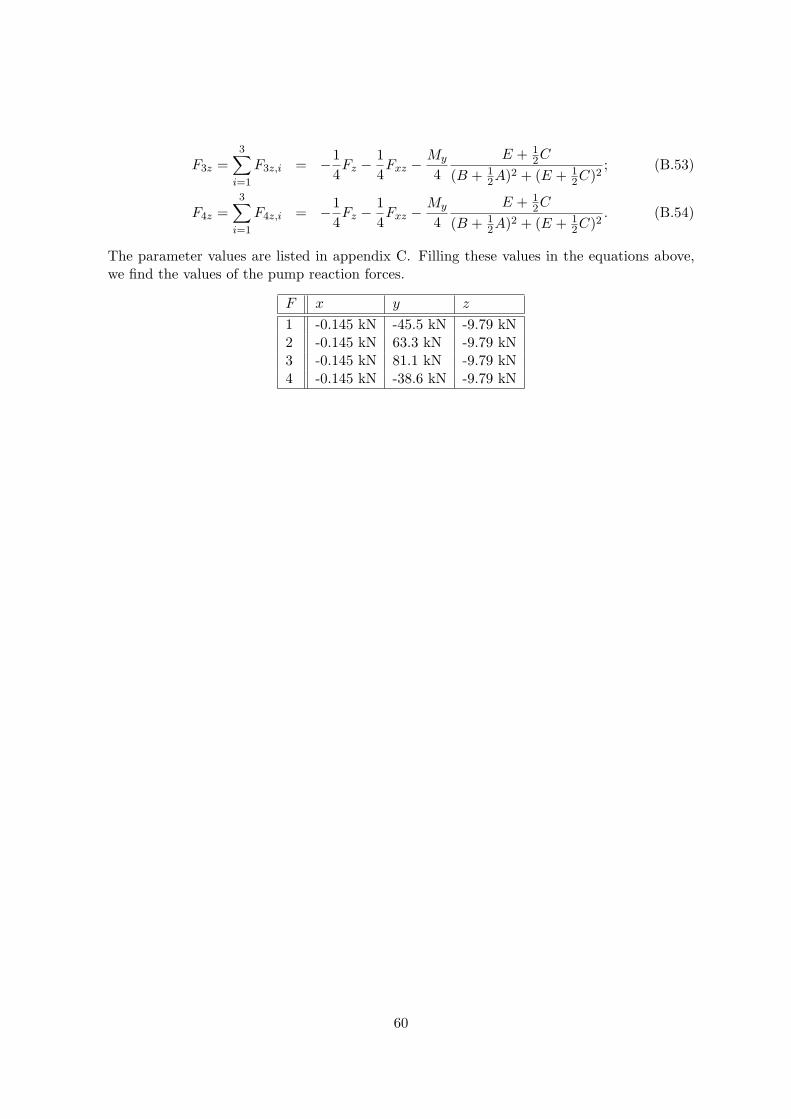
The parameter values are listed in appendix C. Filling these values in the equations above,we find the values of the pump reaction forces.
F x y z
1 -0.145 kN -45.5 kN -9.79 kN2 -0.145 kN 63.3 kN -9.79 kN3 -0.145 kN 81.1 kN -9.79 kN4 -0.145 kN -38.6 kN -9.79 kN
60

61
Appendix C
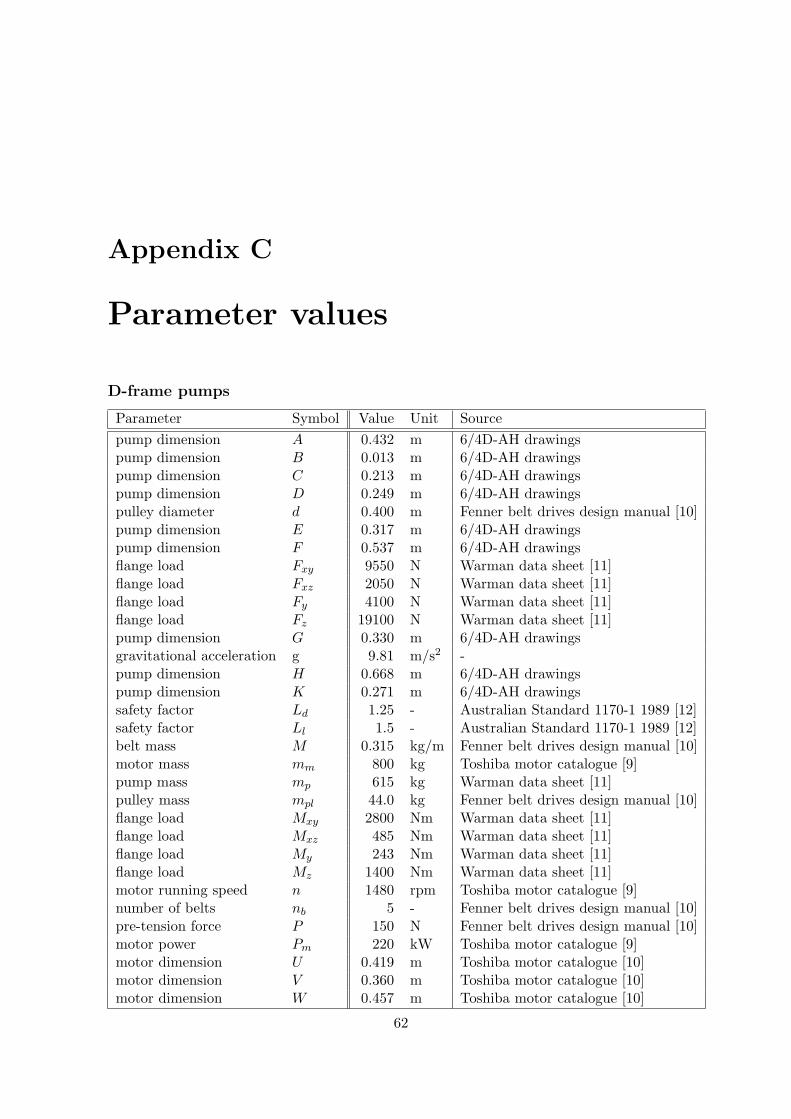
Parameter values
D-frame pumps
Parameter Symbol Value Unit Sourcepump dimension A 0.432 m 6/4D-AH drawingspump dimension B 0.013 m 6/4D-AH drawingspump dimension C 0.213 m 6/4D-AH drawingspump dimension D 0.249 m 6/4D-AH drawingspulley diameter d 0.400 m Fenner belt drives design manual [10]pump dimension E 0.317 m 6/4D-AH drawingspump dimension F 0.537 m 6/4D-AH drawingsflange load Fxy 9550 N Warman data sheet [11]flange load Fxz 2050 N Warman data sheet [11]flange load Fy 4100 N Warman data sheet [11]flange load Fz 19100 N Warman data sheet [11]pump dimension G 0.330 m 6/4D-AH drawingsgravitational acceleration g 9.81 m/s2 -pump dimension H 0.668 m 6/4D-AH drawingspump dimension K 0.271 m 6/4D-AH drawingssafety factor Ld 1.25 - Australian Standard 1170-1 1989 [12]safety factor Ll 1.5 - Australian Standard 1170-1 1989 [12]belt mass M 0.315 kg/m Fenner belt drives design manual [10]motor mass mm 800 kg Toshiba motor catalogue [9]pump mass mp 615 kg Warman data sheet [11]pulley mass mpl 44.0 kg Fenner belt drives design manual [10]flange load Mxy 2800 Nm Warman data sheet [11]flange load Mxz 485 Nm Warman data sheet [11]flange load My 243 Nm Warman data sheet [11]flange load Mz 1400 Nm Warman data sheet [11]motor running speed n 1480 rpm Toshiba motor catalogue [9]number of belts nb 5 - Fenner belt drives design manual [10]pre-tension force P 150 N Fenner belt drives design manual [10]motor power Pm 220 kW Toshiba motor catalogue [9]motor dimension U 0.419 m Toshiba motor catalogue [10]motor dimension V 0.360 m Toshiba motor catalogue [10]motor dimension W 0.457 m Toshiba motor catalogue [10]
62

E-frame pumps
Parameter Symbol Value Unit Sourcepump dimension A 0.546 m 8/6E-AH drawingspump dimension B 0.045 m 8/6E-AH drawingspump dimension C 0.257 m 8/6E-AH drawingspump dimension D 0.290 m 8/6E-AH drawingspulley diameter d 0.400 m Fenner belt drives design manual [10]pump dimension E 0.402 m 8/6E-AH drawingspump dimension F 0.694 m 8/6E-AH drawingsflange load Fxy 16900 N Warman data sheet [11]flange load Fxz 4400 N Warman data sheet [11]flange load Fy 8800 N Warman data sheet [11]flange load Fz 33800 N Warman data sheet [11]pump dimension G 0.457 m 8/6E-AH drawingsgravitational acceleration g 9.81 m/s2 -pump dimension H 0.917 m 8/6E-AH drawingspump dimension K 0.351 m 8/6E-AH drawingssafety factor Ld 1.25 - Australian Standard 1170-1 1989 [12]safety factor Ll 1.5 - Australian Standard 1170-1 1989 [12]belt mass M 0.315 kg/m Fenner belt drives design manual [10]motor mass mm 800 kg Toshiba motor catalogue [9]pump mass mp 1464 kg Warman data sheet [11]pulley mass mpl 44.0 kg Fenner belt drives design manual [10]flange load Mxy 6000 Nm Warman data sheet [11]flange load Mxz 1400 Nm Warman data sheet [11]flange load My 700 Nm Warman data sheet [11]flange load Mz 3000 Nm Warman data sheet [11]motor running speed n 1480 rpm Toshiba motor catalogue [9]number of belts nb 5 - Fenner belt drives design manual [10]pre-tension force P 150 N Fenner belt drives design manual [10]motor power Pm 220 kW Toshiba motor catalogue [9]motor dimension U 0.419 m Toshiba motor catalogue [9]motor dimension V 0.360 m Toshiba motor catalogue [9]motor dimension W 0.457 m Toshiba motor catalogue [9]
C.1 Motor reaction forces
Remembering equation (B.2), the reaction forces on the motor frame consist of the reactionsdue to the gravitational forces, the belt tension forces and reactions due to the motor torque.Figure C.1 shows an electric motor and it dimensions. The bolt holes have the same numberingas the bolt holes in the pump frame. The side view in figure C.1 shows points 1 and 4 at theleft and 2 and 3 at the right side. In the front view it’s 3 and 4 at the left side and 1 and 2at the right.
63

Figure C.1: motor dimensions
C.1.1 Gravitational forces
Similar to the calculations in section B.1, both the gravitational forces of the motor and thepulley inflict reaction forces at the holding bolts. The center of mass of the motor is unknown,but it is reasonable to assume that it is on the shaft centerline of the motor in the middle ofthe bolt holes in the motor frame. This means that the reaction forces due to the weight ofthe motor are equal on every point.
F1y,1 = F4y,1 = F2y,1 = F3y,1 = −Ld14mmg, (C.1)
with mm the mass of the motor. Modifying equations (B.10) and (B.11) for the motordimensions gives the reaction forces on the motor frame as a result of the weight of thepulley.
F1y,2 = F4y,2 = LdV
2Umplg (C.2)
F2y,2 = F3y,2 = −LdU + V
2Umplg (C.3)
C.1.2 Belt tension forces
The tension in the belts is also calculated in section B.1. Using the motor dimensions andequations (B.15) and (B.16) while keeping in mind that the tension forces now act in theopposite direction we find:
F1y,3 = F4y,3 = −LlU + V
U
[16P −M
(πdn
60
)2]nb and (C.4)
F2y,3 = F3y,3 = LlV
U
[16P −M
(πdn
60
)2]nb. (C.5)
C.1.3 Motor torque
The motor torque Tm acts on the motor as a moment on the shaft line. The 2D moment model,figure B.4, is used again. Parameter I represents the width of the motor base, dimension W
64

in figure C.1. Converting formulas (B.33) and (B.34), we find for the reaction forces:
F1y,4 = F2y,4 = −LlTm
2W(C.6)
F3y,4 = F4y,4 = LlTm
2W(C.7)
A live load factor is applied. The motor torque is not directly measured, but calculated usingthe power Pm and running speed n of the motor.
Tm =Pm
ω, with ω =
2π
60n (C.8)
The motor torque reaction forces are now available:
F1y,4 = F2y,4 = Ll15Pm
πnW(C.9)
F3y,4 = F4y,4 = −Ll15Pm
πnW. (C.10)
C.1.4 Total reaction forces
The total reaction forces on the holding bolts are the sum of the reactions calculated in thissection.
F1y =4∑
i=1
F1y,i = −Ld14mmg+Ld
V
2Umplg−Ll
U + V
U
[16P−M
(πdn
60
)2]nb+Ll
15Pm
πnW(C.11)
F2y =4∑
i=1
F2y,i = −Ld14mmg−Ld
U + V
2Umplg +Ll
V
U
[16P −M
(πdn
60
)2]nb +Ll
15Pm
πnW(C.12)
F3y =4∑
i=1
F3y,i = −Ld14mmg−Ld
U + V
2Umplg +Ll
V
U
[16P −M
(πdn
60
)2]nb−Ll
15Pm
πnW(C.13)
F4y =4∑
i=1
F4y,i = −Ld14mmg+Ld
V
2Umplg−Ll
U + V
U
[16P−M
(πdn
60
)2]nb−Ll
15Pm
πnW(C.14)
Again using the values parameter values from C we find the motor reaction forces.
Fy
1 29.4 kN2 -14.1 kN3 -18.8 kN4 24.7 kN
65

66

Appendix D
Dimensions and sections in detail
D.1 Pump plates
d1
d2
d
1 2
34
Figure D.1: Pump plate model with parameters
Although the two pump plates differ slightly, they can be checked in the same manner. FigureD.1 shows a pump plate. It consists of the plate, two stiffeners underneath and four bolt holeson which the assumed point forces act. Due to the load, the structure will bend. The stiffenerswill contribute the most to the stiffness of the structure and because they are placed in such away that they are very close to the holes, the assumption is made that the forces act directlyon those members. For the sake of simplicity, the stiffeners will be checked separately. Toaccount for the plate stiffness somehow, the members will be considered as T sections. d1, dAnd d2, as depicted in figure D.1 and D.2 are respectively the distance from the end of themember to the first hole, the distance between both holes and the distance from the secondhole to the other end of the member. In order to calculate the maximum bending moment ofa member the reaction forces at both ends of the beam (R1 and R2 in figure D.2) have to bedetermined. This is done using basic structural mechanics: the sum of all moments shouldbe equal to zero. For the sake of convenience we take the moments about R1 and R2, withl = d1 + d + d2.
ΣMR2 = 0 : R1l + F1(d + d2) + F2d2 = 0 (D.1)ΣMR1 = 0 : F1d1 + F2(d + d1) + R2l = 0 (D.2)
67
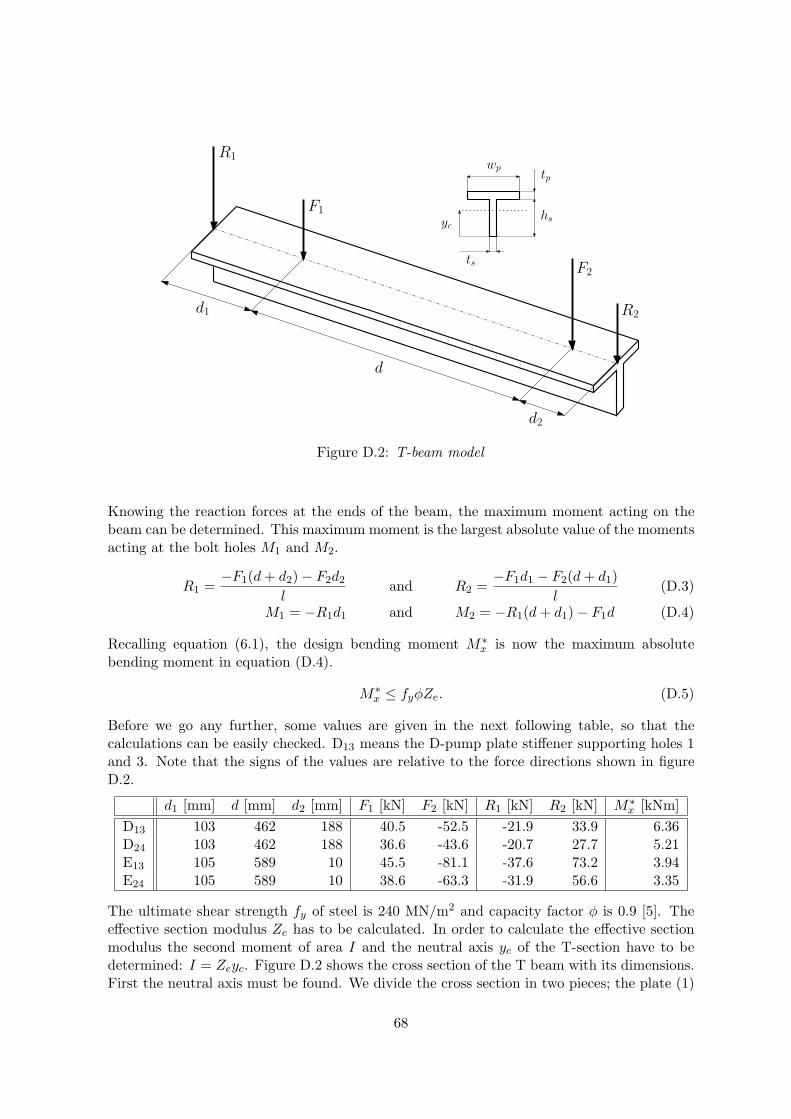
F1
F2
R1
R2d1
d2
d
wp
tp
hs
ts
yc
Figure D.2: T-beam model
Knowing the reaction forces at the ends of the beam, the maximum moment acting on thebeam can be determined. This maximum moment is the largest absolute value of the momentsacting at the bolt holes M1 and M2.
R1 =−F1(d + d2)− F2d2
land R2 =
−F1d1 − F2(d + d1)l
(D.3)
M1 = −R1d1 and M2 = −R1(d + d1)− F1d (D.4)
Recalling equation (6.1), the design bending moment M∗x is now the maximum absolute
bending moment in equation (D.4).
M∗x ≤ fyφZe. (D.5)
Before we go any further, some values are given in the next following table, so that thecalculations can be easily checked. D13 means the D-pump plate stiffener supporting holes 1and 3. Note that the signs of the values are relative to the force directions shown in figureD.2.
d1 [mm] d [mm] d2 [mm] F1 [kN] F2 [kN] R1 [kN] R2 [kN] M∗x [kNm]
D13 103 462 188 40.5 -52.5 -21.9 33.9 6.36D24 103 462 188 36.6 -43.6 -20.7 27.7 5.21E13 105 589 10 45.5 -81.1 -37.6 73.2 3.94E24 105 589 10 38.6 -63.3 -31.9 56.6 3.35
The ultimate shear strength fy of steel is 240 MN/m2 and capacity factor φ is 0.9 [5]. Theeffective section modulus Ze has to be calculated. In order to calculate the effective sectionmodulus the second moment of area I and the neutral axis yc of the T-section have to bedetermined: I = Zeyc. Figure D.2 shows the cross section of the T beam with its dimensions.First the neutral axis must be found. We divide the cross section in two pieces; the plate (1)
68

and the stiffener part (2). We determine the areas and neutral axes of the separate parts tocombine those for the neutral axis of the whole section (yc).
A1 = tpwp and A2 = tshs (D.6)
y1 = hs +12tp and y2 =
12hs (D.7)
yc =A1y1 + A2y2
A1 + A2(D.8)
The second moments of area for the separate parts can be determined again using basicmechanics. These are then summed with respect to the neutral axis to find the secondmoment of area for the entire section.
I1 =wpt
3p
12and I2 =
tsh3s
12(D.9)
Ic = I1 + A1(y1 − yc)2 + I2 + A2(yc − y2)2 (D.10)
The effective section modulus is found by:
Ze =Ic
yc. (D.11)
By varying the the thickness of the plate (tp) and the height and thickness of the stiffener(hs, ts), the effective section modulus can be adjusted. The parameter wp is of little influenceand is set to 300 mm. Recalling equation (D.5), this value has to satisfy:
Ze ≥ M∗x
fyφ.
Choosing the values is negotiating, because they all influence Ze. The thicknesses that havebeen picked are standard plate thicknesses, leaving the stiffener height as final tune parameter.The following table shows the picked dimensions and some other parameters to make checkingthe calculations easier.
tp [mm] ts [mm] hs [mm] yc [mm] Ic [106mm4] Ze [103mm3] M∗x
fyφ [103mm3]
D13 16 16 70 69.9 2.24 32.0 29.5D24 16 16 70 69.9 2.24 32.0 24.1E13 16 12 60 63.0 1.22 19.4 18.3E24 16 12 60 63.0 1.22 19.4 15.5
D.2 Columns
The columns of the pump pedestal are subjected to compression, tension and a bendingmoment. They will be checked for buckling and bending, as these will be far more likely tooccur than pure compression or tension failure.
69

D.2.1 Bending
Australian Standards handbook [5] restricts the design bending moment M∗x of a member as:
M∗x ≤ fyφZe. (D.12)
fy Being the ultimate shear strength of steel: 240 MN/m2, φ the capacity factor as prescribedby the handbook: 0.9 and Ze the effective section modulus, which is listed in the BHPcatalogue [7] for every available product. For the design bending moment we take highestlateral pump reaction force, Fz = 9.79 kN multiplied length of a column, l = 322 mm:
with Fzl ≤ fyφZe, we find Ze ≥ 14.6 · 103 mm3. (D.13)
The BHP catalogue shows that the 75 × 75 × 3 mm Tubeline square hollow section has aneffective section modulus of 22.5 · 103 mm3, which satisfies (D.13).
D.2.2 Buckling
According to the Australian Standards handbook [5], the elastic buckling load Nom of amember can be calculated as given below. This value should be higher than the maximumcompression force exerted on the columns, which is R1 = 37.6 kN found in section D.1.
Nom =π2EI
(kel)2(D.14)
Where E is the modulus of elasticity of steel as specified in the Australian standards [5], 200GN/m2 and l the length of the column, 322 mm. ke Is the member effective length factorthat accounts for the way the column is fixed. In this case ke = 1.2 [8]. Like the effectivesection modulus, the second moment of area I is also given in the BHP catalogue [7].
R1 ≤ π2EI
(kel)2gives 37.6 kN ≤ 9.47 MN (D.15)
The selected columns (75× 75× 3 mm) will therefore not buckle and are accepted.
D.3 Floor frame
The floor frame supports the columns and the motor plate. The floor frame will be designedto withstand the forces on the pump side, and further on checked for the motor side. FigureD.3 shows the simplified piece of the floor frame which is directly underneath on of the pumppedestal columns. It consists of many members, of which the T section depicted with a solidline contributes the most to the stiffness of the structure. The top and bottom plates aretherefore neglected. The floor frame is checked for buckling and compression.
Buckling is checked again according to the Australian standards [5], this time about theY and the X axes:
Nom,X =π2EIX
(kel)2and Nom,Y =
π2EIY
(kel)2(D.16)
with Nom the maximum compression force on the frame, which should be smaller then themaximum compression force on the columns (R1=37.6 kN). The material parameters fy and
70

wp
tp
hs
ts
yc
R1
X
Y
Figure D.3: Floor frame model
E remain the same as before. The parameter ke is now 0.7 [5] and l is the height of the floorframe (95 mm). We use equations (D.6) to (D.10) to determine the second moments of areaIX and IY . We take wp to be 400 mm, and set all the thicknesses to be the same, starting at5 mm, for keeping an eye on the vibrational properties.
Compression is easily checked. The material starts to fail when R1 ≥ fyA, with A thecross section area of the member. The table below shows the results of the calculations witha frame thickness of 5 mm.
tp, ts [mm] hs [mm] yc [mm] R1 [kN] Nom,X [GN] Nom,Y [GN] fyA [kN]5 70 67 37.6 0.253 11.9 564
One can see that the critical loads Nom,X , Nom,Y and fyA are well above the compressionforce R1 and thus the 5 mm frame thickness is acceptable.
D.4 Motor plate
Because of symmetry only half the plate is considered. Figure D.4 shows the motor platemodel. The base frame is bolted down to the floor approximately at the ends of the motorplate, so the plate plus its stiffener and adjacent floor frame can be modeled as simplysupported at both ends. The member consisting of the half plate, half the stiffener andthe adjacent floor frame is considered as a simply supported beam with two forces acting onit. This pair of forces on one half of the plate creates a bending moment. The problem isnow exactly the same as the pump, plate problem and we have to find the design bendingmoment first. Using equations (D.4) to (D.5), we find the design bending moments. For theside with holes 1 and 2 and the other side, 3-4.
d1 [mm] d [mm] d2 [mm] F1 [kN] F2 [kN] R1 [kN] R2 [kN] M∗x [kNm]
1-2 242 169 349 29.4 -14.1 -16.9 1.60 4.093-4 242 169 349 24.7 -18.8 -12.7 6.75 3.06
Using equations (D.6) to (D.11) we find the neutral axis yc, the second moment of area Ic
and the effective section modulus Ze. Only the stiffener thickness tm is variable, because tf
71

1
2tm
tp
tf
d1
d
d2
Figure D.4: Motor plate model
is the thickness of the floor frame and tp is as thick as the biggest nut it replaces with itsthread, which is 20 mm [5]. The height of the member is 90 mm and the width is 310 mm.
tm [mm] tp [mm] tf [mm] yc [mm] Ic [106mm4] Ze [103mm3] M∗x
fyφ [103mm3]
1-2 5 20 5 94.6 2.50 26.5 18.93-4 5 20 5 94.6 2.50 26.5 14.2
A stiffener of 5 mm thickness turns out to be sufficient to bear the loads at either side, becausethe values satisfy
Ze ≥ M∗x
fyφ.
D.5 Jockey pulley frame
The force exerted on the jockey pulley, Fjock, is directly related to the belt tension force asdetermined in section B.1.2, Fbt. Together with the contact angle of the belt on the pulley(α), the resulting force can be calculated withe the simple formula. For clarification see figureD.6.
Fjock = 2 sin(α/2)Fbt (D.17)
It is very unlikely that the contact angle exceeds 45◦, so that value will be taken as α in theworst case. Keeping the live load safety factor and implementing the angle α in the equationfor the belt tension force adopted from equation (B.15), we find:
Fjock = 2 sin(α/2)Ll
[16P −M
(πdn
60
)2]nb. (D.18)
By filling in the parameters as given in C we find for the force on the jockey pulley: Fjock =12.0 kN.
The parts of the jockey pulley frame that have to be checked and dimensioned are theflange channels, the main frame, the arms and the push rod. Reminder: The flange channels
72

Figure D.5: jockey pulley system: side, top and iso view
are the upright members carrying the slotted beam. The main frame is attached to the beamand connects to the push rod and the arms. The latter sandwich the jockey pulley. See alsofigure D.5
Flange channels
α
Fbt
Fbt
Fjock
Figure D.6: Determining Fjock
The flange channels are subject to a bending momentdue to the force on the jockey pulley. They are as-sumed to be attached to the base frame only at thevery bottom. Using the criterion for a bending mo-ment on a member (6.1) again, we have:
M∗x =
12Fjocklf ≤ fyφZe (D.19)
with lf being the distance from the floor to the beamon which the jockey pulley mechanism rests. Becausethere are two channels, each is subject to 1
2Fjock.In the worst case lf is 567 mm, the ultimate shearstrength fy of steel is 240 MPa and as in the previouscases, φ = 0.9. Filling in these values in D.20 gives:
Ze ≥ 15.8 · 103 mm3. (D.20)
From the BHP catalogue [7] the 75 PFC channel isselected which has an effective section modulus ofZe = 21.4 · 103 mm3.
Main frame
See figure D.7. The main frame is subject to a bending moment. We consider the main frameas a U-profile and take the worst case scenario for the position of the jockey pulley with respect
73
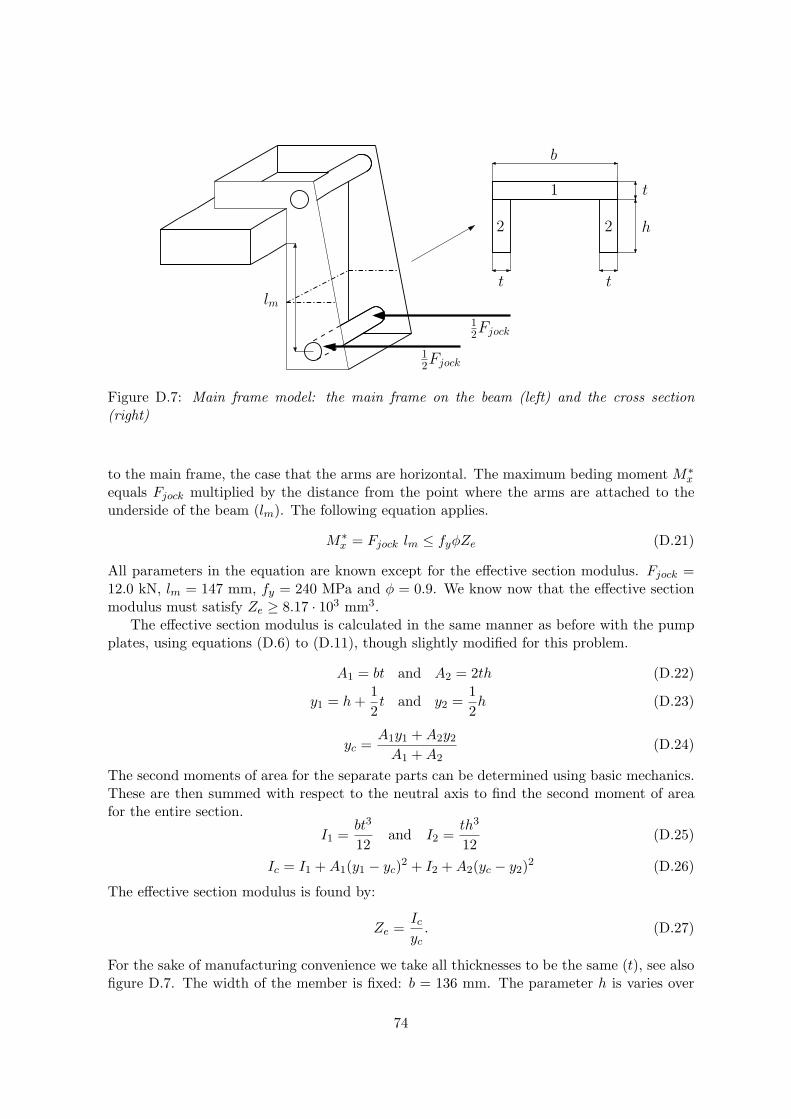
1
2Fjock
1
2Fjock
h
b
t
t t
lm
2 2
1
Figure D.7: Main frame model: the main frame on the beam (left) and the cross section(right)
to the main frame, the case that the arms are horizontal. The maximum beding moment M∗x
equals Fjock multiplied by the distance from the point where the arms are attached to theunderside of the beam (lm). The following equation applies.
M∗x = Fjock lm ≤ fyφZe (D.21)
All parameters in the equation are known except for the effective section modulus. Fjock =12.0 kN, lm = 147 mm, fy = 240 MPa and φ = 0.9. We know now that the effective sectionmodulus must satisfy Ze ≥ 8.17 · 103 mm3.
The effective section modulus is calculated in the same manner as before with the pumpplates, using equations (D.6) to (D.11), though slightly modified for this problem.
A1 = bt and A2 = 2th (D.22)
y1 = h +12t and y2 =
12h (D.23)
yc =A1y1 + A2y2
A1 + A2(D.24)
The second moments of area for the separate parts can be determined using basic mechanics.These are then summed with respect to the neutral axis to find the second moment of areafor the entire section.
I1 =bt3
12and I2 =
th3
12(D.25)
Ic = I1 + A1(y1 − yc)2 + I2 + A2(yc − y2)2 (D.26)
The effective section modulus is found by:
Ze =Ic
yc. (D.27)
For the sake of manufacturing convenience we take all thicknesses to be the same (t), see alsofigure D.7. The width of the member is fixed: b = 136 mm. The parameter h is varies over
74

the length, so a mean value is used for the calculations. Together with thickness t, h is a freeparameter. Choosing t = 5 mm and h = 57 mm results in an effective section modulus ofZe = 8.30 · 103 mm3, which satisfies the earlier posed condition that Ze ≥ 8.17 · 103 mm3.
Arms
The arms will be checked for pure buckling (in case of maximum extension) and for bending(in case of minimum extension), because the push rod connects some distance away from thepulley where Fjock acts on.
Buckling is checked with the following formula.
Nom =π2EI
(kel)2(D.28)
In which the elastic buckling load Nom should be higher than the force on each arm: 12Fjock.
E is the modulus of elasticity of steel, 200 GN/m2 [5]. ke Is the member effective length factorthat accounts for the way the member is fixed. In this case ke = 0.85. For length l we takethe longest free part of the arms, the part between the push rod and the main frame: l = 210mm. The only parameter unknown to us is the second moment of area I. For a rectangularcross section it is specified as:
I =ht3
12, (D.29)
h Being the height of the member and t the thickness. By choosing h = 40 mm and t = 4mm, the second moment of area becomes 213 mm4 and Nom = 13.2 kN, which is larger than12Fjock = 6.00 kN.
R1
R2
α
l2
l1
1
2Fjock
Figure D.8: Bending model for the arms
Next we will check if the selected values for hand t will also prevent bending of the arms whenthe jockey pulley is minimally extended. As be-fore, bending is checked with:
M∗x ≤ fyφZe (D.30)
In this case the maximum bending moment M∗x
is l1Fjock sinα. Because α is close to 90◦, M∗x will
be approximated to be l1Fjock. Again, fy = 240MN/m2 and φ = 0.9. Ze is the last unknown andcan be determined using equation (D.11): Ze =I/yc. I is now th3/12 and yc, the neutral axis ofthe cross section of the arm, is equal to h/2. Thismakes Ze = th2/6 and every parameter is known.Checking the bending criterion (D.30) gives:
M∗x = 480 Nm and fyφZe = 230 Nm,
(D.31)which does not satisfy D.30. In order to accomplish that we increase height h to 52 mm andthickness t to 5 mm. The result is that condition D.30 is now satisfied.
M∗x = 480 Nm and fyφZe = 486 Nm → M∗
x ≤ fyφZe (D.32)
75

γ
α
β
Fjock
Fn
Rn
Rr
a
b
l2
l1
Figure D.9: Model of the jockey pulley system
Push rod
See figure D.9. This is a 2D model of the jockey pulley system. Comparing the model tofigure D.5, one can see the only approximation made is length b. In reality this length canvary slightly due to the way the push rod is connected to the main frame. This small variationis neglected in order to keep the calculations transparant. The push rod is only subject tobuckling, due to force Rr. The buckling criterion is similar to the ones used earlier, see e.g.equation D.28. The length l in that equation is replaced with rod length a, Nom should belarger than Rr and ke is 0.85. E is still 200 GN/m2 and I is yet to be determined and onlydepends on the diameter of the push rod. This results in the following criterion.
Nom =π2EI
(kel)2→ Rr ≤ π2EI
(kea)2→ I ≥ Rr(kea)2
π2E(D.33)
We now have to find the reaction force Rr. It is a reaction force of the earlier determinedFjock. First, we take the component of Fjock perpendicular to the arms, because only thiscomponent causes a reaction force at the end of the rod: Fn = Fjock cosα. The reaction forceit causes is Rn, again a force normal to the arms: Rn = l1+l2
l2Fn. Buckling force Rr can now
be calculated using angle β: Rr = Rn/ sinβ. We combine these these results with the sinerule: a sinβ = b sinα and the fact that sin α
cos α = tanα.
Rr =a(l1 + l2)b l2 tan α
· Fjock (D.34)
Because the push rod is adjustable in length (consequently adjusting the whole system),length a is a function of angle α (or any other angle). Pythagoras states:
a =√
b2 + c2 − 2bc cosα (D.35)
Note that α is roughly in the range 10◦ < α < 90◦. One can see straight away that Rr
decreases with α approaching 90◦. On the other hand, the length of the rod (a) increases
76

20 30 40 50 60 70 80 900
0.2
0.4
0.6
0.8
1
angle α [°]
Compression forceLength of rodRequired second moment of area
Figure D.10: Compression force (Rr), rod length (a) and minimum required second momentof area (I) as function of angle α. Note that all values on the y-axis are normalized to 1.
when α increases. Therefore, looking at (D.33), there must be an maximum value in therequired second moment of area. This maximum value is at the angle where the elasticbuckling load is the greatest and the push rod should be designed to withstand the loads atthat angle. To determine this critical angle, the mathematic computer package Matlab7 isused to calculate and plot Rr, a and I as a function of α. The programme instructions areprinted in appendix E. The results can be found in figure D.10. At an angle of α = 62.7◦, themaximum second moment of area is required. At that angle length a is 22.6 cm and Rr = 8.63kN. The maximum required second moment of area is 162 mm4. From basic mechanics weknow that
I =πD4
64, (D.36)
which results in a minimum diameter of the push rod of 7.6 mm. Although an M8 threadwould do, in this case a more convenient M12 is chosen.
77

78

Appendix E
Matlab programme instructions
% clear workspace %clcclear allclose all
% parameters %
Fj=12e3;l1=0.08;l2=0.21;b=0.224;c=l2;ke=0.85;E=200e9;N=10000;alphamax=0.5*pi;alphamin=0.1*pi;nalpha=(alphamax-alphamin)/N;alpha = alphamin:nalpha:alphamax;
for n=1:N+1a(n)=sqrt(b^2+c^2-2*b*c*cos(alpha(n)));Rr(n)=Fj*(l1+l2)/(l2*tan(alpha(n)))*a(n)/b;I(n)=(Rr(n)*(ke*a(n))^2)/(E*pi^2);
end
alphagrad=alpha/pi*180;
% output: plots %figureplot(alphagrad,Rr/max(Rr),’--k’,’linewidth’,2);hold onplot(alphagrad,a/max(a),’:k’,’linewidth’,2);
79

plot(alphagrad,I/max(I),’-k’,’linewidth’,2);hold offlegend(’Compression force’,’Length of rod’,’Required second moment of area’,...
...’Location’,’south’)axis([min(alphagrad) max(alphagrad) 0 1.1])xlabel(’angle \alpha [\circ]’,’fontsize’,[16],’fontname’,’Times New Roman’)
% output: values at maximum I %[Imax,b]=max(I);
Imaxalphagrad_Imax=alphagrad(b)Rr_Imax=Rr(b)a_Imax=a(b)D=(64*Imax/pi)^(1/4)
80

Appendix F
References
1. Weir Warman Newsletter, September 2003, ’Introducing Weir Minerals’ p 1.
2. Slurry pump handbook, Weir Warman , ’Introduction’ pp 6-8.
3. Warman Technical Bulletin, No. 20, April 1992, ’Pump performance testing’ pp 1-4.
4. Standard operating procedure, July 2005, pp 1-28.
5. Australian Standards AS 4100-1998, ’Steel structures’.
6. BHP Catalogue, 1998, ’Hot rolled and structural steel products’ p 31.
7. BHP Technical information, april 1999, ’Structural cold formed sections and profiles’pp 26-27.
8. Ajax Fasteners, Issue 99, ’Metric Hexagon Nuts’, p 100.
9. Toshiba catalogue, Toshiba electric motors ’Dimensions for TEFC motors’
10. Fenner Belt drives, Fenner Australia
11. Warman international LTD, September 2003, ’Maximum allowable loads and momentson pump flanges’.
12. Australian Standards AS 1170-1, 1989
81