perceptual salience in the test for auditory comprehension
TRANSCRIPT

University of Montana University of Montana
ScholarWorks at University of Montana ScholarWorks at University of Montana
Graduate Student Theses, Dissertations, & Professional Papers Graduate School
1983
Perceptual salience in the Test for Auditory Comprehension of Perceptual salience in the Test for Auditory Comprehension of
Language Language
Debra L. Croghan The University of Montana
Follow this and additional works at: https://scholarworks.umt.edu/etd
Let us know how access to this document benefits you.
Recommended Citation Recommended Citation Croghan, Debra L., "Perceptual salience in the Test for Auditory Comprehension of Language" (1983). Graduate Student Theses, Dissertations, & Professional Papers. 3195. https://scholarworks.umt.edu/etd/3195
This Thesis is brought to you for free and open access by the Graduate School at ScholarWorks at University of Montana. It has been accepted for inclusion in Graduate Student Theses, Dissertations, & Professional Papers by an authorized administrator of ScholarWorks at University of Montana. For more information, please contact [email protected].

COPYRIGHT ACT OF 1976
THIS IS AN UNPUBLISHED MANUSCRIPT IN WHICH COPYRIGHT SUBSISTS, ANY FURTHER REPRINTING OF ITS CONTENTS MUST BE APPROVED BY THE AUTHOR,
MANSFIELD LIBRARY UNIVERSITY OF MONTANA DATE :


Perceptual Salience in the Test for Auditory Comprehension
of Language
Debra L. Croghan B.A. University of Montana 1978
Presented in partial fulf i l lment of the requirement for the
degree of
Master of Arts University of Montana
1983
Chairman, Board of Examiners
by
Approved by
Deaff^ Graduate ScTOfff
Date

UMI Number: EP34811
All rights reserved
INFORMATION TO ALL USERS The quality of this reproduction is dependent upon the quality of the copy submitted.
In the unlikely event that the author did not send a complete manuscript and there are missing pages, these will be noted. Also, if material had to be removed,
a note will indicate the deletion.
UMI* Dissertation Publishing
UMI EP34811
Published by ProQuest LLC (2012). Copyright in the Dissertation held by the Author.
Microform Edition © ProQuest LLC. All rights reserved. This work is protected against
unauthorized copying under Title 17, United States Code
ProQuest*
ProQuest LLC. 789 East Eisenhower Parkway
P.O. Box 1346 Ann Arbor, Ml 48106- 1346

Croghan, Debra L., M.A., December 1983 Communication Sciences & Disorders
Perceptual Salience in the Test for Auditory Comprehension of Language (54)
Director: Barbara Bain, Ph.D.
The purpose of this study was to investigate: 1) whether children responded significantly differently from chance to the three pictures on a given plate of the Test For Auditory Comprehension of Language (TACL); 2) i f the Picture Potency Formula (PPF) predicted the pictures that children "l iked best"; and 3) i f incorrect responses on the TACL correlated to those chosen by children as the ones they "l iked best". Thirty subjects, between the ages of 4-5 years, served as their own control group, each receiving two different administrations of the TACL in a counter balanced order. One administration followed the procedures outl ined in the TACL manual; the other administration consisted of the verbal instruction: "Point to the picture you l ike best". The results indicated that the subjects did respond differently to the three pictures. They chose the middle picture the majority of the time. The PPF did not prove to be an accurate predictor of the subjects' responses. The subjects' incorrect responses did not correlate to the ones chosen by the subjects as the ones they "l iked best" to a significant degree. Neither did the subjects appear to be influenced by the construction of the pictures nor the pictures they "l iked best" when presented with the l inguistic cues. This study generally supported the validity of the TACL.
i i

ACKNOWLEDGMENTS
The author expresses her thanks and appreciation to her thesis
committee Barbara Bain, Charles Parker and Wesley Shellen for their
patience and enthusiasm. The t ime and efforts of the staff, students
and parents at the Stevensvil le Preschool and Head Start are also
appreciated. Lastly, a sincere thanks to Sue Lantello and Judy Lawson
for their contributions for the reliabil i ty test.
i i i

TABLE OF CONTENTS
Abstract i i
Acknowledgement i i i
List of Tables and Figures vi
Chapter I . Introduction 1
Review of the l i terature 1
Language Assessment and Assessment Procedures 1
Standardized Tests 4
The Influence of Visual Stimuli in Assessment 5
Perceptual Salience in Pictures 8
The Test for Auditory Comprehension of Language: A Test in Measuring Language Comprehension 12
Chapter I I . Method 16
Subjects 16
Materials and Procedures 16
Perceptual Salience Analysis 17
Analysis of the Results of Perceptual Salience 19
Purpose of the Study 19
Chapter I I I. Results 20
Subjects' Picture Preferences Compared to Chance Responses. . . 20
The Revised Picture Potency Formula as a Predictor of the Subjects' Preferences 21
Correctness According to the TACL Compared to the Subjects' Picture Preference 23
iv

Prevalent Patterns in Comparing the Results 29
Chapter IV. Discussion 30
Subjects' Picture Preference Compared to Chance Responses . . . 30
The Revised Picture Potency Formula as a Predictor of the Subjects' Preference 31
Correctness According to the TACL Compared to the Subjects' Picture Preference 33
Prevalent Patterns in Comparing the Results 35
General Conclusions 36
Implications 37
References 39
Appendix A Instructions for Analyzing the Pictures of the TACL . . 42
B Definit ions of Factors for Analyzing TACL Pictures. . . 43
C Revised PPF Analysis of Pictures, Correct Pictures and Subjects' Preferences for TACL Pictures 44
D Descriptive Information about the Subjects 49
v

LIST OF TABLES AND FIGURES
Table 1 Results According to the Picture's Position on the Plate. 22
Figure 1 Revised PPF Factors of the Pictures Successfully Predicted by the Revised PPF 24
Figure 2 2X2 Matrix of Correctness According to the TACL Compared to the Subjects' Picture Preference 25
Table 2 Results of Correctness According to the TACL Compared to the Subjects' Picture Preference. . . 27
Figure 3 Prevalent Patterns in the Results 29
vi

CHAPTER I
Introduction
Speech/language pathologists uti l ize a variety of procedures to
assess and remediate cl ients who display disorders in voice, f luency,
articulation and language. As part of the diagnostic battery
speech/language pathologists may uti l ize standardized tests and con
sequently must determine i f the specific assessment tool measures what
i t purports to measure, that is, i f i t is valid. The focus of this
study is to determine, in part, the validity of a specific standardized
assessment tool currently used by speech/language pathologists to eva
luate language comprehension in preschool and young school-aged
children.
REVIEW OF THE LITERATURE
Language Assessment and Assessment Procedures
Although speech/language pathologists assess cl ients suspected of
voice, f luency, articulation or language disorders, the primary empha
sis of this study pertains to language disorders. Mil ler (1978)
defined a cl ient with a language deviation as "performing differently
within a particular stage of development" or "performing at an earl ier
stage of development" when "compared to test norms or developmental
data" (p. 282). A language deviation may be present in any or al l of
the language parameters of phonology, syntax, semantics or pragmatics
1

2
(Mil ler, 1978; Nation and Aram, 1977; and McConnell, Love and Clark,
1974) in either the comprehension or production processes (Mil ler,
1978).
One of the clinician's f irst tasks is to determine the presence of
a language deviation, usually by conducting a comprehensive language
assessment. Procedures for assessing language include: standardized
tests; nonstandardized tests; developmental scales; and behavioral
observation (Mil ler, 1978). Mil ler (1978) defined a standardized test,
the primary focus of this paper, as one that had been given to large
numbers of children, had demonstrated reliabil i ty, had validity and had
normative data. The assessment procedures were not mutually exclusive.
"The inclusion of a particular procedure in an assessment protocol
depends on many factors, including the developmental level of the
child, type of information sought, availabil i ty of the procedure and
evaluation setting" (Mil ler, 1978, p. 291).
As previously discussed, the language parameters of phonology,
syntax, semantics, and pragmatics involved two processes, production
and comprehension. Comprehension is the major concern for the present
investigation. The assessment of comprehension is less observable than
production and requires different assessment procedures. Mil ler (1978)
referred to comprehension as "an essentially private event" (p. 286),
in that comprehension may have occurred but there may be no observable
behavior present to indicate that i t had taken place. Mil ler (1978)
defined two major cl inical problems in assessing comprehension. The

3
f irst problem is defining an adequate response which indicates an une
quivocal comprehension of an utterance. Defining an adequate response
was divided into: 1) natural language responses with nonlinguistic con
text controlled but not eliminated such as compliance to commands and
answering questions; and 2) contrived behavioral responses with
nonlinguistic context eliminated such as pointing to pictures that
represent sentence utterances. The second major problem was in spe
cifying the nature of the assessment task and the requirements i t
imposed on the child. The three commonly used tasks, picture-pointing,
object-manipulation and best-fit tasks, required the child to deal with
two and three-dimensional space and recognize, reconstruct or make a
judgment about the stimuli.
Regardless of the purpose of the assessment or the procedure uti
l ized, speech/language pathologists must recognize factors which may
influence the results obtained, otherwise interpretation of these
results may be erroneous. Mil ler (1978) provided three sets of
variables that may affect any language assessment results. These were:
1) situational variables, including setting or place of evaluation, the
person doing the evaluation and the time of day; 2) task variables,
such as input mode, response mode, instructions, stimuli, context,
order of presentation and scoring; and 3) child variables, including
memory, attention, motivation, sensory and physiological integrity and
experimental history and state. Speech/language pathologists must be
able to recognize the influence of these factors in order to accurately

4
interpret the assessment results. Task variables are the concern of
this study.
Standardized Tests
Speech/language clinicians use standardized tests in conjunction
with other procedures because the tests are reportedly reliable across
examiners, measure specified aspects of language behavior, are readily
available and frequently are time efficient. At least four main pur
poses for administering a standardized test have been mentioned in the
l i terature (Salvia and Ysseldyke, 1978 and Lien, 1976). First, tests
are uti l ized to identify students who are sufficiently different from
their age-mates that they require special attention. Second, standar
dized tests are used to determine the extent of a language handicap and
i f that handicap warrants speech/language intervention. Furthermore,
most state laws have specified the criteria, in terms of test scores,
necessary for placement of a child in a special education program.
Third, tests are often administered to assist in planning a program and
outl ining therapy objectives. Fourth, tests are administered to deter
mine the child's progress over a period of t ime. Regardless of the
purpose for which a test is used there are certain criteria which a
test should meet. Lien (1976) stated "a good measuring instrument
measures what i t is supposed to measure to a high degree, consistently,
and with a minimum expediture of t ime, energy and money" (p. 79). The
f irst part of the definit ion concerns the test's validity, the second
concerns reliabil i ty and the last part concerns usabil i ty. I f any of

5
these criteria, especially validity and reliabil i ty, are not met for a
specific test, the quality of the test should be examined.
The Influence of Visual Stimuli in Assessment
Many commonly employed standardized tests use pictures as stimuli
to determine a child's comprehension of language. The Peabody Picture
Vocabulary Test - Revised, PPVT-R, (Dunn and Dunn, 1981) and the Test
for Auditory Comprehension of Language, TACL, (Carrow-Woolfolk, 1975)
are two of many examples, but the manuals of these instruments do not
address the nonlinguistic factors that may distract from the l inguistic
components being measured. The use of pictures introduces "task
variables" (Mil ler, 1978, p. 305) into the input and response modes,
which may in turn influence the child's test performance. The child is
to identify l inguistic constructs, input mode, by pointing to visual
representations of these constructs, the response mode. Further, pic
tures place additional cognitive requirements upon the child. The
child may understand the l inguistic utterance but may not be able to
identify the picture. The child must "deal with two-dimensional space
and recognize the pictures" (Mil ler, 1978 p. 300). Speech/language
pathologists then must determine i f this "contrived behavioral
response" (Mil ler, 1978, p. 299) is an adequate response indicating
the child's "unequivocal comprehension of an utterance" (Mil ler,
1978)(p. 299).
The possibil i ty also exists that visual stimuli may improve a
child's comprehension of the l inguistic stimuli being measured in a
6
standardized language comprehension test. The following studies sup
port this assumption. Moeser and Olson (1974) and Moeser and Bergman
(1972) examined the influence of object or picture referents on compre
hension of l inguistic stimuli. Moeser and Olson (1974) conducted a
study that involved thirty children between the ages of 3:6 to 4:6
years of age. The children, divided into one experimental and two
control groups, were presented visual stimuli, blocks, that correlated
to nonsense words from an artif icial miniature language. The visual
stimuli for the experimental group corresponded to semantic rules which
correlated to syntactic rules. There were no correlations betwen
visual stimuli and syntactic rules of the language for either control
groups. Moeser and Olson (1974) found a significant difference between
the experimental and two control groups in the number of correct two-
word utterances produced. They concluded that "nursery school children
can learn verbal relationships more easily i f the verbal rules reflect
the lawful relationship contained in the reference f ield" (p. 211).
Moeser and Bergman (1972) conducted a study that also used a miniature
artif icial language but with teenage students. They found that the
pairing of pictures with sentences greatly facil i tated the acquisit ion
of language syntax. Although these studies indicated that the use of
pictures improved the child's comprehension, the l ikelihood may also
exist that pictures may distract from the l inguistic stimuli being
measured.

7
When given more than one picture to choose from, as found in many
language comprehension tests, the child's attention may be drawn to one
particular picture. Several authors (Muma, 1978; Hutt, Forrest and
Newton, 1976; Wetheric and Davis, 1972; Odum and Guzman, 1972; and
Luria, 1959) have addressed perceptual salience present in visual sti
muli. Muma (1978) defined "perceptual salience" as "an inordinate
focus on a perceptual domain: color, size, shape, position and
possibly number" (p. 260). He further stated that "a child becomes
preoccupied with one of these domains" (p. 260). Odum and Guzman (1972
stated that "the differential frequency with which particular dimen
sions serve as the basis for selection may be considered a measure of
their relative salience" (p. 271) and that "the higher the salience
value of a dimension, the higher the probabil ity of i ts being cogniti-
vely evaluated, regardless of i ts appropriateness for problem solution"
(p. 272). Luria (1959) described an example, that applied to children
between 1:0 to 1:6 years of age, where perceptual salience overrode a
verbal request. The child was shown two objects, one object at some
distance form the child and another between the child and the f irst
object. The child was asked to hand the examiner an object, the one
furthest from him. The child looked at the f irst object but grabbed
the second instead and handed i t . Luria (1959) stated that "the direc
tive function of the word wil l be maintained up to the moment when i t
comes into confl ict with the conditions of the external situation"
(p.342). He further explained that the l inguistic stimuli "loses i ts

8
directive role i f the immediate orientatiorial reaction is evoked by a
more closely located, or brighter, or more interesting object" (p.342).
Although most language comprehension tests, with pictures, do not apply
to children as young as those described by Luria (1959), the effects
of perceptual salience are evident in older children. Odum and Guzman
(1972) found that salience for some perceptual attributes were develop-
mentally related. They conducted a study with 408 children in grades
kindergarten, 1, 2, 3, 4, and 6, to determine the salience of the
attributes: form, color, number and position. The found that kin
dergarten and f irst grade children chose color and form more frequently
than the other attributes; second graders chose color followed by
number; third graders chose number followed by form and the fourth and
sixth graders chose form and then color. Some visual attributes were
shown to be more perceptually salient than others and in the example of
very young children distracted from the l inguistic stimuli. Perceptual
salience as i t relates to pictures found in a language comprehension
test is the major focus of this study.
Perceptual Salience in Pictures
Standardized tests that uti l ize pictures to measure a child's
comprehension of l inguistic constructs introduce nonlinguistic factors
that may influence the child's response. First, language comprehension
tests, that use pictures, require that children identify l inguistic
constructs, input mode, by pointing to a two-dimensional picture,
response mode. I t is then assumed that the child's responses measure

9
the child's comprehension of the l inguistic constructs. Second, the
results of several studies (Moeser and Olson, 1974 and Moeser and
Bergman, 1972) indicated that visual stimuli, comparable to pictures in
tests, improved comprehension of l inguistic stimuli. Finally, some
visual attributes have been shown to be more perceptually salient and
thus chosen over other attributes. Speech/language pathologists must
be confident that they have measured the child's comprehension of
l inguistic stimuli and not the child's response to nonlinguistic fac
tors, which may be found in pictures. Most tests of language compre
hension that uti l ize pictures have not addressed the criteria for
selecting the pictures. I f the criterion has been addressed i t is
vague. Dunn and Dunn (1981), for example, stated that one of the cri
teria used in preparing the test plates for the PPVT-R was that "each
i l lustration should have approximately the same eye appeal (equal inten
sity and complexity of detail)" (p. 31). These terms were not defined
nor were data presented which would substantiate equal intensity and
complexity of detail. Perhaps the lack of pictorial criteria was
related to "no normative data on pictorial stimuli for child
populations" (Reese and Lipsitt, 1970, p. 199). There were, however,
numerous studies (Legenza and Knafle, 1978 and 1976; Manzo and Legenza,
1975; Whipple, 1953; Rudisil l , 1952; and Hildreth, 1936) which
addressed pictorial features preferred by children. These features
preferred by children wil l be viewed as they related to perceptual
salient features in pictures used in comprehension tests. Hutt et al.

10
(1975) found that young children, below 7 years of age, attended
visually to the pictures they preferred. Thus, perceptual salience,
the inordinate focus on a perceptual domain, can be related to pre
ference. I t is assumed that children attend to and talk about what
interests them or their preferences. Nelson (1973) analyzed the f irst
50 words acquired by 18 children between 1 and 2 years of age. Her
results indicated that children were selective in their choice of
words. She stated that the "child labels what interests him in his
perceptual world" (p. 115). Few of the studies on children's picture
preference are recent due to the emphasis on the audio-visual media in
current l i terature. The majority of the studies to be discussed have
been based on analysis of test book pictures. Many of the factors pre
ferred by children can be applied to pictures used in tests for the
comprehension of language in terms of the attention value of perceptual
salience.
Several authors found color, action and animals in pictures to be
preferred by children of various ages. Hildreth (1936) stated that 138
children between 3 and 6 years of age preferred color pictures over
black and white ones 66.6 percent of the time. Rudisell (1952) found
the 70-80 percent of her population, 27 kindergarten children and from
150 to 200 in each of the elementary grades 1-6, preferred color pho
tographs over black and white ones. Whipple (1953) stated that "even a
sl ight use of color attracted the student's attention more than black
and white pictures" (p. 266) with 150 fourth graders. Manzo and

11
Legenza (1975) l isted color as a factor for their Picture Potency
Formula, to be discussed below. In addition to color in pictures,
action was another factor preferred by children. Whipple (1953) deter
mined that pictures that presented storytell ing action were more effec
tive in stimulating interest than lack of action. Action was also a
factor used in the Picture Potency Formula (Manzo and Legenza, 1975).
Finally, pictures with animals were preferred by children in Hildreth's
study (1936) and animals are part of the Picture Potency Formula's fac
tor "things with potential for movement" (Manzo and Legenza, 1975, p.
1086). The studies cited examined only a few pictorial factors that
relate to language comprehension tests. The Picture Potency Formula
addressed several additional ones. The Picture Potency Formula, deve
loped by Manzo and Legenza (1975), used 10 factors that determined the
language stimulation value of pictures. The formula, validated by
Legenza (1977) with 47 kindergarten and f irst graders, categorized pic
tures into high potency pictures, those that stimulated a large amount
of language, medium potency or low potency pictures (as determined by
10 factors which were tall ied and converted into scaled scores). The
10 factors were: 1) different things, the total number of different
things in the picture were counted; 2) significant things, the chief
f igures around which other things were apparently set; 3) total things,
the total number of al l things were counted except for nondescript
things such as blades of grass; 4) number of different colors; 5)
actions, the number of actions in progress; 6) number of children

12
present; 7) total number of people present, counting children again; 8)
total number of things with potential for movement other than people,
e.g., cars, motion toys, planes, animals, etc. (the scaled score for
animals is twice that of other things in this section); 9) the size of
the plate; and 10) empathy, the compatibil i ty with the interests and
experiences of the children with whom i t was used. Basically, the more
items in a factor, the more different things, more people, etc., the
higher the language stimulation value for the picture. Legenza and
Knafle (1978) further found that three factors, number of children,
number of people, and number of actions, were consistently present in
pictures to which children responded highly. The Picture Potency
Formula provides a means for analyzing pictures in order to determine
i f a specific picture is more or less appealing than other pictures.
Some of the factors wil l be applied to pictures in a language compre
hension test.
The Test for Auditory Comprehension of Language:
A Test That Uti l izes Pictures In Measuring Language Comprehension
The Test for Auditory Comprehension of Language (TACL), developed
by Elizabeth Carrow-Woolfolk (1975), is a language assessment tool
used by speech/language clinicians. I t assess "oral language compre
hension without requiring language expression from the child" (Carrow,
1968, p. 103) and i t "allows for easy interpretation of responses by
the examiner" (Davis, 1977) for children 3:0 to 6:11 years of age.

13
Carrow-Woolfolk (1975) described the test as consisting of "101 plates
of l ine drawings". Each plate "contains three black-and-white drawings
(or in the case of colors, colored circles) which represent referential
categories that can be signaled by form classes and function words,
morphological constructions, grammatical categories and syntactic
structure" (Carrow, 1971, p. 300). The plates which are stimuli for
the l inguistic constructs "provide three pictures, one representing the
referent for the l inguistic form being tested and another representing
a contrasting l inguistic form; the third picture is included in order
to decrease the chances of guessing in a two-item choice" (Carrow,
1971, p. 300).
The TACL, because i t uti l ized pictures to measure the child's
comprehension of l inguistic constructs, may be also introducing
nonlinguistic factors, such as perceptually salient features of the
pictures, which may influence the child's responses on the test.
Several authors (Mil len and Prutting, 1979 and Hatten, 1978) have
implied that some pictures, of the TACL, were more perceptually salient
than others which may have resulted in an inaccurate measure of the
child's comprehension of the l inguistic stimuli. This issue, however,
was not tested empirically. Hatten (1978), in his review of the TACL,
stated that "in one item the three picture stimuli included a man, a
man and a woman, and a woman, the verbal cue being 'she'; since the
female in the two-person picture has more striking features and
darkened hair she has, in our experience, most often been pointed to by

14
younger children. In such an instance i t is clear that the child
understand the pronoun 'she' but fails the item for extraneous
reasons" (p. 454). Mil l en and Prutting (1979) compared the TACL, the
Northwestern Syntax Screening Test (receptive) and the Bellugi-K1ima
Comprehension Test for specific grammatical features and found percep
tual salience to be an influential variable in the children's responses
on the TACL. They stated that the "decoy picture stimuli on the TACL,
designed to measure the pronoun 'he', consisted of pictures of a monkey
r iding a bicycle, a girl riding a bicycle, and a boy riding a bicycle.
All children who responded incorrectly to the stimulus 'he' selected
the picture of the monkey r iding the bicycle" (p. 168). They further
noted that "the picture which correctly represented the stimulus, ' the
man painted the house', consisted of a picture of a house painted
bright blue. Neither of the two decoys contained the color blue. The
blue house, therefore, presented an extremely salient feature that may
have influenced some of the children's selections" (p. 168).
Speech/language pathologists need to be aware of the factors that may
distract a child's attention from the l inguistic stimuli due to the
perceptually salient features of a picture. I f a child's response is
influenced by the perceptually salient factors of a picture the vali
dity of the test must be questioned, since the test is not measuring
what is purports to measure, i .e. comprehension of l inguistic

15
constructs. Carrow-Woolfolk (1975) provided several validity studies
but did not address pictorial factors. 1
Icarrow-Woolfold stated, in a personal conversation (1982), that the main objective in designing the TACL pictures was to display the l inguistic utterance. She did, however, try to make the pictures "not very different from each other."

CHAPTER I I
METHOD
Subjects
The subjects were 30 preschool children (16 female and 14 male)
between four and f ive years of age (the mean age was four years f ive
months). The subjects were enrolled in either the Stevensvil le
Preschool or Head Start and had age appropriate language and cognitive
development according to their instructors. All subjects had passed a
pure tone screening according to the ANSI, 1969, standards; the
Peek-a-Boo series of the Keystone Vision Screening Test and a speech
and language screening administered by a state l icensed speech/language
pathologist. Hearing, vision and speech/language screenings were
completed within three months of the subjects' participation in the
experiment. All subjects were monolingual, speaking Standard American
English.
Materials and Procedures
The subjects served as their own control group, each receiving two
different administrations of the TACL in a counterbalanced order. One
administration followed the procedures outl ined in the TACL manual
(Carrow-Woolfolk, 1975). The other test administration consisted of
only the verbal instructions: "Point to the picture you l ike best".
Both administrations followed the procedures outl ined in the manual.
16

17
The test manual described the administration as in a "one-to-one
setting" (p.9) with the test booklet placed with the "i l lustrations
facing the child, in a quiet room, free from outside disturbances and
visual distractions and well l ighted" (p. 9) and at "a table or desk
which the examiner and tester can sit facing each other comfortably
with sufficient space to accommodate the test booklet and scoring
sheet" (p. 9). The sequence of the two administrations were alternated
between subjects. The specific pictures chosen by the subjects for
each test format was recorded. The administration of both formats was
given by a state l icensed speech/language pathologist.
Perceptual Salience Analysis
AN analysis of the TACL pictures was conducted by the present
investigator to determine i f one picture in a given plate was percep
tually more salient when compared to the alternate two pictures. (The
analysis followed the instructions in Appendix A) The pictures were
analyzed according to: 1) numbers and amount of actions (Manzo and
Legenza, 1975; Whipple, 1953; and Hildreth, 1936); 2) number of
children (Manzo and Legenza, 1975); 3) number of people (Manzo and
Legenza, 1975); 4) number of different things (Manzo and Legenza,
1975); 5) number of all things (Manzo and Legenza, 1975); 6) color
(Manzo and Legenza, 1975; Whipple, 1953; Rudisil l , 1952; and Hildreth,
1935); and things with potential for movement, including animals (Manzo
and Legenza, 1975 and Hildreth, 1936). (Specific definit ions of the
factors are in Appendix B.) The factors were not considered in a

18
heirarchial order, though Legenza and Knafle (1978) found action,
number of children and number of people to be consistently in pictures
that had a high potency. The aforementioned factors were labelled as
the "revised PPF" since the factors originated from the Picture Potency
Formula (Manzo and Legenza, 1975). Thus, as Mil len and Prutting (1979)
noted, plate 74 had one picture with more of the factor "color"
whereas, the other two pictures did not. Plate 74 also had more
"different things" and "all things" and therefore was considered more
perceptually salient than the other two (see Appendix C). Another
example is in plate 61, which Hatten (1978) noted as having striking
features, where one picture was determined perceptually more salient
than the alternate two pictures. Picture 2 in this plate contained the
factors "number of people" and "number of al l things" since i t was the
only one of the three that had more than one person present.
A pi lot study was conducted to determine the useabil ity of the PPF
factors for analyzing the TACL pictures. The pilot study indicated
that the factors "color" and "potential for movement" were not explicit
enough for reliable judgements to be made. The scaled scores were not
sufficiently specific and were therefore eliminated. The review defi
nit ions (SEE APPENDIX B) were then uti l ized in a reliabil i ty test of
the analysis of the TACL pictures. Two examiners agreed on 100 of the
101 plates.
19
Analysis of the Results of Perceptual Salience
The analysis of the 101 TACL plates, uti l izing the revised PPF,
indicated that 59 of the plates had one picture that was determined to
be more perceptually salient than the other two (See Appendix C). The
remaining 42 plates were analyzed as equal in terms of their perceptual
salience since no single picture contained more factors than the other
two. Further analysis of the 59 plates showed that 28 were the target
picture for the l inguistic utterance, according to the TACL. I t is
possible that due to the perceptually salient feature of the target
pictures that the child may chose the correct picture regardless of
comprehension of the l inguistic utterance.
Purpose of the Study
The possibil i ty exists that pictures of the TACL are not equal in
terms of their perceptual salience. Furthermore, the perceptual
salience may influence a child's responses on the test. The purpose of
this study is to investigate whether the TACL measures what i t purports
to measure, that of the child's comprehension of l inguistic utterances.

Chapter I I I
Results
The purpose of this study was to investigate three questions:
1) Do children respond significantly different from chance to the
three pictures on a given plate of the TACL?
2) I f the pictures differ significantly from chance, does the
revised Picture Potency Formula predict the subject's picture
preference?
3) Do the incorrect responses on the TACL correlate to those cho
sen by the subjects as the ones they "l iked best"?
The results of this study wil l be discussed as they pertain to each of
the research questions. The .05 confidence level wil l be used as the
level of significance throughout al l analyses. An additional section
wil l discuss the interaction of the results.
Subjects' Picture Preferences Compared to Chance Responses
Chi squared (X^) (Siegel, 1956) was used to determine i f the sub
jects responded significantly different from chance to the three pic
tures on any given plate of the TACL (Carrow-Woolfolk, 1975). The
results of an item by-item, one-sample X^ (Siegel, 1956) indicated that
73 of the 101 TACL plates received responses that differed signifi
cantly from chance. X^, as a statistical measure, did not indicate
which of the three pictures was different only that there was a signi
f icant difference. The responses were then analyzed as to the
20
21
subjects' selection of pictures according to the pictures' position on
the plate (See Table 1). The positions were labelled 1, 2 & 3 going
from left to right on the plate. Position 2 was most frequently
selected for 66 of the 73 plates, position 3 was selected in f ive pla
tes and f inally position 1 was selected on two plates. (The position
with the most responses was the one that had at least one more response
than the alternate two.) The chance frequency distribution for the
total number of responses, 30 subjects with 101 responses each or 3030
total responses, was 1010 for each picture position. The actual
distribution differed from chance significantly. The rank order,
according to picture position, was f irst position 2 with 1615 respon
ses, followed by position 3 with 845 and f inally position 1 with 570
total responses. The pictures in position 2 were selected more fre
quently than the pictures in positions 1 and 3.
The Revised Picture Potency Formula As a Predictor Of The Subjects' Preferences
A revised version of the Picture Potency Formula (PPF) (Manzo &
Legenza, 1975) was applied to the 73 significantly different plates to
determine i f the revised PPF predicted which picture on a plate the
subjects would choose. The revised PPF predicted that the subjects
would choose one picture over the alternate two for 45 of the 73 pla
tes. Only 15 of the 45 pictures, predicted by the revised PPF,
corresponded to the picture on the plate that the subjects chose more

TABLE 1 RESULTS ACCORDING TO THE PICTURES' POSITION ON THE PLATE
Picture Position on Plate
Position distribution of plates showing
a significant difference
Total number of t imes that the 101
pictures were chosen by the
30 subjects
Number of t imes the PPF predicted the
subjects' responses
1 picture on
the left 2 570 0
2 picture in the middle
66 1615 13
3 picture on the right
5 845 2
73* 3030** 15
* The remaining 28 plates did not show a significant difference at the .05 level.
** Significant at the .001 level

23
often as the one they "l iked best" (See Table 1). Thirteen of the 15
pictures were in position 2, followed by two in position 3 and zero in
position 1.
A further analysis was completed in order to determine i f certain
revised PPF factors were more prevalent, in the 15 pictures, than were
other factors. According to the PPF, the one picture on a plate that
was determined as more l ikely to be chosen than the other two was the
picture that contained more PPF factors. Each of the seven revised PPF
factors was present in at least one of the 15 pictures (See Figure 1).
Eleven of the 15 pictures contained a combination of factors (See
Appendix A for factor definit ions). The factors, ranked according to
the number of pictures in which they were present, were f irst "numbers
of all things" found in 11 pictures; then "number of different things"
and "action" in 8 pictures; followed by "number of people" in 5
pictures; "number of children" in 4 pictures; and f inally "color" and
"potential for movement" each was found in one picture.
Correctness According To The TACL Compared To The Subject's Picture Preference
A 2 X 2 matrix (Figure 2) was developed to determine i f the
subjects' responses that were scored by the TACL as incorrect
corresponded to the pictures that the subjects preferred or "l iked
best". The categories for the matrix were:
A. correct response according to the TACL and the picture chosen
as being preferred by the subjects;

24
FIGURE I REVISED PPF FACTORS OF THE PICTURES SUCCESSFULLY PREDICTED BY THE REVISED PPF
PICTURE POSITION WITH THE REVISED PPF FACTORS
PLATE
NUMBER
i
ACTION
2
Chi Id-
r(?n
J
Peooie
4 Nunoer
o
Di f fer-
ent
th inos
3
Number
of a l l
th ings
6
Color
7 Poten-
t io 1
for
Move-
rent
Picturr
wi th
the
TOS t
fc iCtorr PREVALENT FACTORS
t 0 0 0 2 9 n o ? 4.5,7
a .2 2 ? 0 . 0 n ? 1,2,3,4,5
35 1,3 0 0 •> ? n n ? 4,5
43 0 0 0 0 1 0 0 7 5
59 2 2 2 0 ? n 0 ? 1,2.3,5
f i1 2 0 2 p ? n n ? 1.3,4,5
fi? 2 2 o c n 9 0 i ) 9 1,2.3.5
73 2 0 0 0 n n n ? 1
74 0 0 0 3 3 n ? 4.5.6
7R 2 0 0 0 n • n n ? 1
7f i 2.3 0 0 2 0 n 0 ? 4.5
P? 0 3 3 0 n- n n ? 2.3
OR ? 0 0 7 o n n 9 1.4.5
? 0 0 9 1 -> •> n n 9 1
inn 0 0 o n n 4.5
-o indie ites t iat al 3 pi ttures wore >oua 1 "or that "actor and/o * the actor was n )t pro ent
1 pictu ~e on .ho 1 e "t nf l ie p i to
? pictu -e i n ".lie mi 1d I e
1 -p in 'ho r i •jht nf the p ate

25
FIGURE 2
2 x 2 M a t r i x o f C o r r e c t n e s s A c c o r d i n g t o t h e TACL compared to the Subjects' Picture Preference
TACL Score
Correct Incorrect A B
Preferred Correct TACL Incorrect TACL Picture picture and picture and
subjects' subjects' Subjects' preferred preferred Picture picture picture Preference
C D Correct TACL Incorrect TACL
Not the picture and not picture and not Preferred the subjects' the subjects' Picture preferred preferred
picture picture

26
B. incorrect response by the TACL and the picture preferred by
the subjects;
C. correct response according to the TACL but not the preferred
picture by the subjects;
D. incorrect response by the TACL but not the picture preferred
by the subjects.
Three different statistical measures were uti l ized to determine i f
a significant difference existed between the categories. The Fisher
Exact Probabil ity Test (Siegel, 1956) was applied to 75 items. (These
items had an expected frequency of less than 5 for any cell which made
the test for two independent samples (Siegel, 1956) inappropriate.)
The test for two independent samples was used for 13 items.
Finally, the X^ one sample test was preformed on 11 items in which
there were no responses in two of the four categories, resulting in an
analysis of only two categories.
An item-by-item analysis, uti l izing the aforementioned statistical
measures, of the 101 test items indicated that 22 items had a frequency
distribution of responses that were significantly different from chance
(See Table 2). The 22 items were then analyzed as to the category that
contained the most responses. Category C had the most responses for 7
of the 22 items; followed by categories A and B with 2 items each; and
f inally category D with 1 item. X^ for two independent samples was
applied to the cumulative responses in each category for the 101 items.
Thirty subjects gave 101 responses that yielded 3030 total responses,

27
TABLE 2
RESULTS OF CORRECTNESS ACCORDING TO THE TACL COMPARED TO THE
SUBJECTS' PICTURE PREFERENCE
Number of plates* Total Number of with the most Responses by the
responses in that 30 subjects to the Categories category 101 test plates
A Correct TACL picture and subjects' preferred picture
B Incorrect TACL picture and subjects' preferred picture
C Correct TACL picture and not the subjects' preferred picture
D Incorrect TACL picture and not the subjects' preferred picture
TOTAL
2 834
2 391
17 1307
_1 508
22 3030
* The plates with response frequencies that were significantly different from chance.
28
of these category C had 1307 responses, followed by category A with
834, then category D with 508 responses and f inally category B with 391
responses.
Prevalent Patterns In Comparing The Results
Nineteen of the 101 TACL plates were analyzed in two of the
research questions (See Figure 3). The 19 plates had results that were
significantly different from chance with regard to the subjects respon
ses to the three pictures on a given plate and when comparing the
correctness of the responses, according to the TACL, and the pictures
that the subjects preferred. Four of the 19 plates contained pictures
where the PPF successfully predicted the subjects' choice. The PPF
correctly predicted the subjects' preference as the middle picture on
al l four plates. Three of these plates corresponded to category C and
one to category B; none were in categories A or D. The PPF factors
"number of different things" and "number of al l things" were present in
all four of the pictures, although two pictures, plates 8 and 61, con
tained additional factors.

29 FIGURE 3 Preva len t Pa t te rns in the Resu l ts
PLATE
*p i c pos i
w i t rr
res::
ture t ion h the OS t
onses
Ca te wit
• mo res
gory** h the St
ponser
•Pict posit
co r rec P r ed i c Revise
ure ion t ly tod by d PPF
Dom i n Rev i se PPF Facto
ant*** j
7 3 c
1 2 c 2 1.2,3 4,5
12 2 c
13 2 c
24 2 A
27 7 c
31 ? c
35 7 c 2 a -
58 9 c
61 7 B 7 1.3.4 5
63 7 c
67 7 D
68 7 B
76 ? C 7 4.5
78 2 r
RD 2 r
OT 2 r
94 2 A
95 2 r
*2 = middli 1 p ic t i j re po • i t i on and 3 = p ic u re o i the i i qh t
r *A = co r re : t TAC! p i c t i re am 1 sub j ' l e ts ' I i re te r i ed p i i : tu re ; B = i ncor i cor re i
' ec t r,
f t TACI \CL p
p i c t c tu re j ro ani
and s no t
ib jec t he su t
, 1 pre i . i ec ts
e r red p re f i
p 1 e tu i r red i
e ; C = i c tu re ;
and D n ic tu
inco k e
- rec t rACL p c tu re and n-) t the sub je i t s ' p i e fe r red
'*1 f.inn: 2=rh i drpn: 3 = npn )1P: 4 diffe •ent tJ i nas : and 5 a l 1 t h i nas .

Chapter IV
Di scussion
The discussion is organized according to the three research
questions. In addition prevalent patterns, general conclusions and
implications of this study are presented.
Subjects' Picture Preference Compared To Change Responses
The subjects responded significantly different from chance to the
three pictures on a given plate of the TACL. Specifically, the sub
jects chose the picture in the middle of the plate as the one they
"l iked best" over the pictures in positions 1 and 3. Recall that 66 of
the 73 plates, with results that differed significantly from chance,
had the most responses in the middle picture position and that 1615 of
the 3030 total responses were in the middle position.
The age of the subjects, age 4-5 years, and therefore their
cognitive maturity may have influenced the responses to the middle pic
ture. The children in the present study may not have fully understood
the term "l ike" for the task that determined their picture preferences.
Hutt (1975), in a study that investigated the effects of picture
novelty, found that children under f ive years had diff iculty in
interpreting the term "l ike" when asked to choose their "most l iked"
picture. Furthermore, subjects of this age may not have developed
30

31
definite preferences for pictures. Aitken and Hutt (1974) reported
that children 3-4 years of age expressed picture preferences
unreliabil i ty and idiosyncratically. Further, Hutt et al. (1976)
reported that " i t is only after the age of 5 years that children mani
fest a consistent and reliable preference for certain attributes of
visual stimuli" (p. 63). Myatt and Carter (1979) found that kindergar
ten children did not have clearly distinguished picture preferences,
when shown six different picture styles. The subjects in the present
study may have chosen the middle picture due to lack of understanding
of the task and/or their immature abil i ty to determine a specific pre
ference.
Another possibil i ty for the responses to the middle picture may be
due to the position of the picture on the plate. Wood (1960) stated
that "many persons would tend to use the third position too often for
the answer in f ive-choice items" (p. 58) for multiple choice tests.
The present study indicated that although i t was not a test per se, the
subjects chose the middle position for three-choice items.
The Revised Picture Potency Formula As A Predictor of The Subjects' Preferences
The results indicated that the PPF did not predict the majority of
the subjects' picture choices. The PPF correctly predicted only 15 of
the 73 plates that had response frequencies that were different from
chance. Thirteen of the 15 pictures were in the middle picture posi
t ion. The previous discussion indicated that the subjects tended to
choose the middle pictures more often than pictures in position 1 and

32
3. Thus, the pictures in the middle position that were predicted by
the PPF had a greater probabil ity of corresponding to the subjects'
choices than pictures in positions 1 or 3. The 13 pictures in the
middle position, predicted by the PPF as the subjects' choice, could
have been chosen in part due to their position on the plate and not due
to the PPF's accuracy as a preference predictor.
The PPF by definit ion predicts that the more complex the picture
the more responsive the children wil l be. The present study did not
support this assumption. An analysis of the 73 plates, which had
responses different from chance, indicated that 41 of the pictures,
that the subjects chose, did not have any PPF factors that made them
more predominant than the other two (See Appendix D). This could be
due to the subjects' preference for the middle picture, 40 of the 41
were in the middle position, or i t could be that the subjects preferred
the simpler picture. French (1953) found that 449 young children,
kindergarten through third grade, preferred simple pictures over more
complex ones. The results of this study indicated that the children
preferred the middle picture regardless of the picture's charac
teristics.
The results of this study using the PPF did not correspond to the
original PPF f indings. Legenza and Knafle (1978), uti l izing the ori
ginal PPF, found that the factors "action", "number of children" and
"number of people" to be consistently present in pictures that children
responded to the most. This was not supported in the present study.

33
The pictures predicted by the PPF which corresponded to the subjects'
actual choices contained the factor "number of al l things", followed by
"number of different things" and "actions". This discrepancy could be
in part due to the altering of the PPF for the present study. The ori
ginal PPF (Manzo & Legenza, 1975) was found to be ambiguous and lacking
in operational definit ions in a pilot study. The original PPF uti l ized
scaled scores, the revised did not. The original "number of al l
things", for example, used a scaled score of 1 for one to three total
things in the picture. The revised PPF gave credit to each thing. The
TACL pictures frequently had only 1-3 items present and i t was thought
that a blanket score of 1 would not adequately differentiate the pic
tures. "Things with potential for movement" for example was too ambi
guous in the original definit ions of "things such as cars, motion toys,
animals. . .except people". The revised PPF further excluded plants
and trees. Another possible reason for the discrepancy between the two
studies was in the way the PPF was analyzed. The original study used
the PPF to predict a picture's language stimulation potency. The pre
sent study uti l ized the PPF to predict the visual preference value of
the pictures. A correlation between the verbalization of children this
age and their preferences for pictures may not exist.
Correctness According To The TACL Compared To The Subjects' Picture Preference
The third research question, "do the responses determined by the
TACL as incorrect correlate to those chosen by the subjects as the ones

34
they "l iked best"? is represented as category B in the 2X2 matrix
(Figure 2). Category B (the incorrect response according to the TACL
but the picture preferred by the subjects) should have received more
total responses than category D ( incorrect responses according to the
TACL and not the picture preferred by the subjects) i f the subjects had
chosen the picture they l iked best when their response was incorrect.
The results indicated that category D received more total responses
than category B, 508 and 391 responses respectively (Table 2). A
review of the data indicated that the subjects did not choose the pic
ture that they "l iked best" regardless of correctness. The total
number of responses for categories C and D, the categories that repre
sented the pictures not preferred by the subject, was 1815 responses
compared to 1225 responses for categories A and B, the categories
representing the preferred responses.
Overall the subjects responded with more correct responses,
regardless of their picture preference, than incorrect responses. The
total number of responses for the categories A and C, correct responses
regardless of preference was 2141 out of 3030 possible responses. This
indicates that the subjects chose the correct picture, for both test
administrations, more often than either of the alternative incorrect
pictures. Furthermore, the subjects responded to the l inguistic cues
for the test when i t was administered in a protocol manner. The
subjects' test scores ranged from 53 to 85 correct responses of 101
possible, with a mean of 72.03 (See Appendix D). According to the TACL

35
manual, the means were 69.375 and 69.6471 for the subjects' age groups
4-0 to 4-5 years and 4-6 to 4-11 years respectively. All of the sub
jects scored within one standard deviation of the mean, with one excep
t ion. Subject 11 (See Appendix D) received a score of 53 which is
approximately one and one-half standard deviations below the mean for
her age group. These results indicated that the subjects were not
responding to the middle picture when l inguistic cues were provided. A
comparison of the subjects preferred pictures and those scored by the
TACL as correct showed that of the 66 significantly different pictures
in the middle position only 25 were the correct response. I f the sub
jects were responding to the middle pictures and not the l inguistic
cues they would have gotten only 31 of the 101 test items correct. The
results indicated that the l inguistic cues were more salient than the
visual aspects of the pictures.
Prevalent Patterns In Comparing The Results
The subjects' preference for the middle picture was predominant
when the results of the three research questions were viewed as they
relate to each other. Recall that 19 of the 101 plates had differences
both in terms of the subjects preference compared to chance and for
correctness compared to the subjects preferences (Figure 3). The sub
jects chose the middle picture for 18 of the 19 plates. Furthermore,
the four pictures that the PPF accurately predicted were in the middle
position.
36
Two of the aforementioned nineteen plates wil l be examined more
carefully. Plate 24, "f ind the middle car", and plate 61, "she", were
significant for both the results of the subjects' preference compared
to chance and for correctness compared to the subjects' preferences.
Plate 24 had the most responses for the middle picture and category A,
the correct response and the one preferred by the subjects. This plate
had the same picture in all three picture positions, but the subjects
chose the middle picture. The middle picture was chosen due to i ts
position and obviously not due to factors found in the picture. The
results for plate 61 should be noted as this was the plate previously
noted by Hatten (1978) that . . i t is clear that the child
understands the pronoun 'she' but fails the item for extraneous reasons
(p. 454)." This plate had the most responses for the middle picture
and category B, incorrect according to the TACL but the picture pre
ferred by the subjects. (This picture was also accurately predicted by
the PPF.) The results for this plate indicated that Hatten's obser
vation may have some validity except that overall the subjects chose
the middle picture.
General Conclusions
The results of the present study indicated that the subjects
generally chose the middle picture when given the choice of the three
pictures on the majority of the test plates of the TACL. The choice of
the middle position appeared to be due to the position of the picture

37
on the plate and not due to any specific features of the pictures them
selves. The revised PPF was not an accurate predictor of the subjects
responses, unless the predictions coincided with the middle picture.
The PPF factors that were most consistent in predicting the subjects'
preferences ("number of different things" and "number of all things")
appeared to be contrary to previous evidence that young children prefer
simple pictures over complex ones. The results of this study further
indicated that the subjects were not influenced by the construction of
the TACL pictures nor the pictures they "l iked best" when presented
with the l inguistic cues. One possible exception was noted in the
l i terature and confirmed by the present study where the subjects may
have responded to the picture and not the l inguistic cue. In general
this study supports the validity of the TACL. The TACL measures what
i t purports to measure, that of children's understanding of l inguistic
concepts.
Imp!ications
The results of this study indicated that children with normal
language development, between the age 4-5 years, attended to the
l inguistic cues of the TACL and were not significantly influenced by
the perceptually salient features of the pictures. This does not
necessarily apply to children suspected of a language deviation, for
whom the TACL is used to identify, nor younger or older children.
Children who exhibit language deviations and younger children may be
more susceptible to visual distractions. Speech/language pathologists

38
need to be aware of the potentially misleading influence of the visual
stimuli and indeed only further research would empirically answer this
question.
The results further indicated that the revised PPF was not an
accurate indicator of picture preference for the subjects of this
study. This is not to say that i t may not be a valuable tool in deter
mining picture preferences of older children who have developed defi
nite preferences. Once again, further research may indicate whether
older or younger children respond in a similar manner.
Even though the present study supported the validity of the TACL,
i t does not contend that the TACL should be uti l ized as the sole
measure of a child's understanding of l inguistic concepts. As with any
diagnostic tool i t should only be used as a part of a comprehensive
diagnostic battery.

39
REFERENCES
Carrow, E. "The Development of Auditory Comprehension of Language Structure in Children". Journal of Speech and Hearing Disorders, 33, 1968, 99-111.
Carrow, E. "Comprehension of English and Spanish by Preschool Mexican-American Children". Modern Language Journal, LV, 1971, 299-306.
Carrow-Woolfolk, E. Test for Auditory Comprehension of Language, Austin, Texas: Learning Concepts, 1975.
Davis, J. "Reliabil i ty of Hearing-Impaired Children's Responses to Oral and Total Presentations of the Test of Auditory Comprehension of Language". Journal of Speech and Hearing Disorders, 11, 1977, 520-527.
Dunn, L. and Dunn, L. Peabody Picture Vocabulary Test-Revised, Circle Pines, Minn.: American Guidance Service, 1981.
French, J. "Children's Preferences for Pictures of Varied Complexity of Pictorial Pattern." Elementary School Journal, 53, Sept. 1952-May 1953, 90-95.
Hatten, J. "Tests and Reviews: Miscellaneous-Listening" (Test for Auditory Comprehension of Language), Buros, 0. (Ed.), The Eighth Mental Measurements Yearbook, Highland Park, N.J.: The Gryphon Press, 1978, 611-614.
Hildreth, G. "Color and Picture Choices of Young Children", Journal of Genetic Psychology, 1936, 427-435.
Hutt, C. "Degrees of Novelty and Their Effects on Children's Attention and Preference". Brit ish Journal of Psychology, 66, 1975, 487-492.
Hutt, C., Forrest, B., Newton, J. "The Visual Preferences of Children" Journal of Child Psychology and Psychiatry, 17, 1976, 63-68.
Legenza, A. and Knafle, J. "The Effective Components of Children's Pictures", Paper presented at the 28th Annual Meeting of the National Reading Conference, St. Petersburg Beach, Florida, Nov. 30-Dec. 2, 1878.
Legenza, A. and Knafle, J. "Assessing Pictures through Children's Responses", Paper presented at the 21st Annual Meeting of the College Reading Association, Cincinnati, Ohio, Oct. 26-29, 1977.

40
Lein, A. Measurement and Evaluation of Learning, Dubuque, Iowa: Wm. C. Brown Company Publisher, 1976.
Luria, A. "The Directive Function of Speech in Development and Dissolution", Word, 15, 1959, 341-352.
Manzo, A. and Legenza, A. "A Method for Assessing Language Stimulation Value of Pictures", Language Arts, 52, 1975, 1085-1089.
McConnell, F., Love, R., Clark, B. "Language Remediation in Children", Dickson, S. (Ed.) Communication Disorders Remedial Principles and Practices, Glenview, I l l inois: Scott, Foresman and Company, 1974.
Mil ler, J. "Assessing Children's Language Behavior", Schiefelbusch, R. (Ed.) Bases Of Language Intervention, Baltimore: University Park Press, 1978, 269-318.
Mil len, C. and Prutting, C. "Inconsistencies Across Three Language Comprehension Tests for Specific Grammatical Features", Language, Speech and Hearing Services in the Schools, 10, 1979, 162-170.
Moeser, S. and Bergman, A. "The Role of Reference in the Acquisit ion of a Miniature Artif ical Language", Journal of Verbal Learning and Verbal Behavior, 11, 1972, 759-769.
Moeser, S. and Olson, A. "The Role of Reference in Children's Acquisit ion of a Miniature Artif icial Language", Journal of Experimental Child Psychology, 17, 1974, 204-218.
Muma, J. Language Handbook: Concepts, Assessment and Intervention, Eng1ewood Cliffs: Prentice Hall, 1978.
Myatt, B. and Carter, J. "Picture Preferences of Children and young Adults", Education Communication and Technology Journal, 27(1), 1979, 45-3T:
Nation, J. and Aram, D. Diagnosis of Speech and Language Disorders, Saint Louis: The C. V. Mosby Company, 1977.
Nelson, K. "Structure and Strategy in Learning to Talk", Monographs of Society for Research in Child Development, 38 (1-2), 1973, 1-137.
Odum, R. and Guzman, R. "Development of Hieracrchies of Dimensional Salience", Developmental Psychology, 6 (2), 1972, 271-287.
Reese, H. and Lipsitt, L. Experimental Child Psychology, New York: Academic Press, 1970.

41
Rudisil l , M. "Children's Preferences for Color Versus Other Qualit ies in Il lustrations", Elementary School Journal, 52, Sept. 1951-May 1952, 444-451.
Salvia, J. and Ysseldyke, J. Assessment in Special and Remedial Education, Boston: Houghton Miff l in Co., 1978.
Wetheric, N. and Davis, P. "Inductive Thinking in Children of Primary School Age: The 'Door and Key' Test", Brit ish Journal of Psychology, 63 (4), 1972, 555-559.
Whipple, G. "Appraisal of the Interest Appeal of I l lustrations" Elementary School Journal, 53, Sept. 1952-May 1953, 262-269.
Wood, D. "Test Construction", Charles E. Merri l l Books, Inc., Columbus, Ohio, 1960.

APPENDIXES

APPENDIX A

42
Appendix A
Instruction for Analyzing the Pictures of the TACL
Analyze the three pictures on each plate of the TACL according to
the seven revised PPF factors. Definit ions of the seven factors are
found in Appendix B. Record the pictures according to their positions
on the plate. Position 1 is the picture on the left, position 2 is in
the middle and position 3 is on the right. Record the number of the
picture on the row for the corresponding plate number according to the
factors present in each picture (See Example). Some pictures may
contain more than one factor or no factors and some factors may be pre
sent in more than one picture or not in any. The picture within a
given plate with more of any factor (more people, more different
things, etc.) are to be recorded and those with less of the factor not
recorded for that specific factor. I f the three pictures contain equal
numbers of the factor mark "0" in that column. The column "picture
with the most factors" is determined by adding the number on the plate
and determining the single picture with the most factors present. I f
two or three pictures have equal number's of factors mark "0" in the
column for the "picture with the most factors present".
Example: I 2 3 4 5 6 7 Picture With Number of Number Potential The Most
Plater Number of Number of Different of All for Factors
Number Action Children People Things Things Color Movement Present
X 1,2 1,2 0 0 10 0 1
Z 1 0 0 0 2 3 0 0

APPENDIX B
43
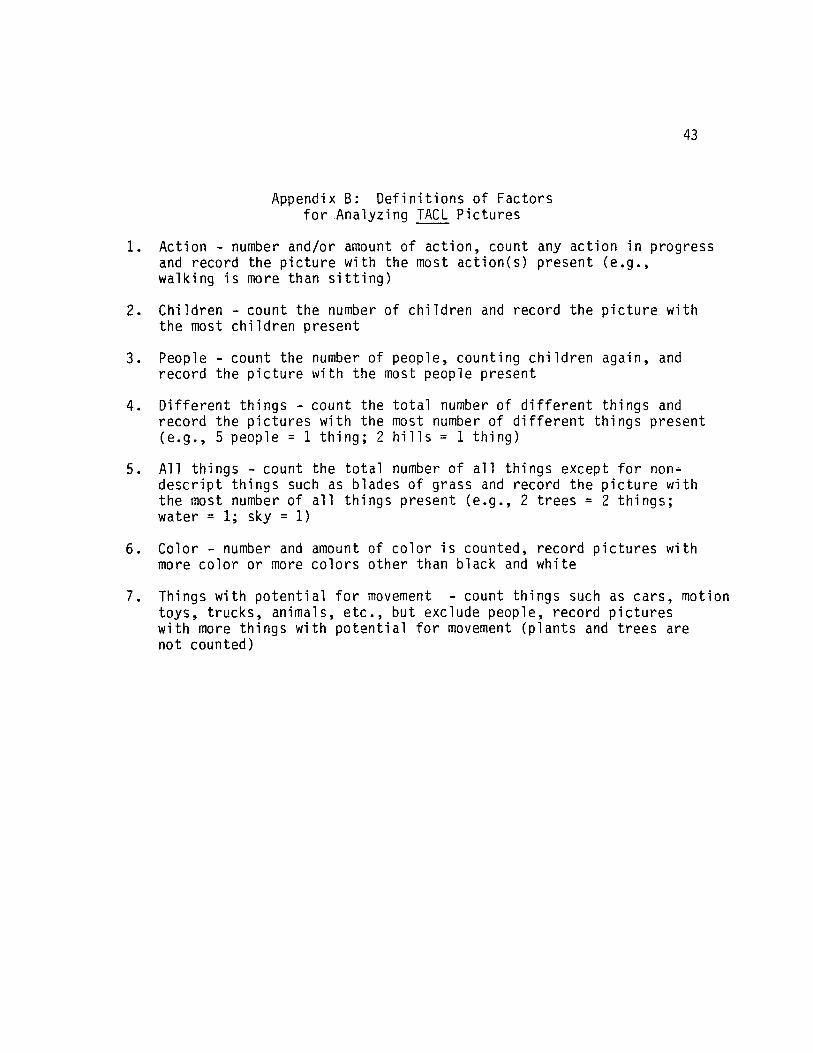
Appendix B: Definit ions of Factors for Analyzing TACL Pictures
1. Action - number and/or amount of action, count any action in progress and record the picture with the most action(s) present (e.g., walking is more than sitt ing)
2. Children - count the number of children and record the picture with the most children present
3. People - count the number of people, counting children again, and record the picture with the most people present
4. Different things - count the total number of different things and record the pictures with the most number of different things present (e.g., 5 people = 1 thing; 2 hi l ls = 1 thing)
5. All things - count the total number of al l things except for nondescript things such as blades of grass and record the picture with the most number of al l things present (e.g., 2 trees = 2 things; water = 1; sky = 1)
6. Color - number and amount of color is counted, record pictures with more color or more colors other than black and white
7. Things with potential for movement - count things such as cars, motion toys, trucks, animals, etc., but exclude people, record pictures with more things with potential for movement (plants and trees are not counted)

APPENDIX C

p L
F.
1
2
3
4
5
6
7
8
9
10
i l
1 2
il
14
15.
16
17
i l
19
20
21
22
23
24
4 4
A p p e n d i x C - R e v i s e d P P F A n a l y s i s o f P i c t u r e s , C o r r e c t P i c t u r e s
and Sub jec ts ' P re fe rences fo r TACL P ic tu res
P i c t u r c p o s i t i o n w i t h t h e m o s t o f t h e f a c t o «
1 2 3 4 5 o 7
a m o u n t o f a c t i o n
1,3
N u m b e r o f c h i i d -
1 , 2
N u m b e r o f p o o p i e
1 , 2
N u m b e r of d i f f e r e n t t h i n g s
1 , 2
N u m b e r of al l t h i n g s
P o t « ? i -t i o t t o r m o v e -nent
1,3
P L c t u r e p o s i t i o n w i t h th«5 n o s t f a c t o r s
C o r r e c
T A C L p : c
S u b j e c t p r o f e r -e n c e i n p l c r . e s with,.} " > i a n ; f -; c o n t d i f f e r e n c e
P r e f e r e n c e t h a t h a s n o d o m i n a n t f a c t o r s

5 E
25
26
27
28
29
30
31
32
33
34
35
36
37
38
39
40
41
42
43
44
45
46
47
48
R e v i s e d P P F A n a l y s i s o f P i c t u r e s , C o r r e c t P i c t u r e s
4 5
and Sub jec ts ' P re fe rences fo r TACL P ic tu res
P i c r u r o p o s i t i o n w i t h t h e m o s t o f t h
}
2.3
1.3
N u m b e f
d i f f e r e n t t h m g s
1,3
Numbcr o r . 3 1 i ; h i n q s
1,3
f a c t o r
6
P n t c n -' j I w i : n tno r n c s t f a c t o r s
Corrpc T A C L
J U ! I I ' ? C T p r i ' f • ; r -o n c o i n : > I t n s " 11 n j j i a n i r -iCi ' in t d; f f o r o n c e
P r o f e r o n c c t h a t h a s n o d o m i n a n t f a c t o r s
1 , 2
1 , 2 1 , 2 1,3
2,3
1,3 1,3
1 .2
1 , 2

E
49
50
51
Ji
_53_
54
_55
_56
57
ii
ii
60
i l
ii
ii
ii
ii
ii
il
ii
ii
Ii
2!_
72
4 5
R e v i s e d P P F A n a l y s i s o f P i c t u r e s , C o r r e c t P i c t u r e s
and Sub jec ts ' P re fe rences fo r TACL P ic tu res
p o s i t
2
ch iId-r e n
i , o n w i t h
3
i J u m b e r o t p e o p l e
2,3
2,3
1 , 2
2,3
2,3
1 , 2
2,3
t h e m o s t o f t h i
4 5
N u m b e r o f d i f f e r e n t t h i n g s
2,3
2,3
1,3
1,2
Numbe r or al l t h i n g s
f a c t o r
6 7
PQten-t ! 3 i f o r m o v o -m e n t
P i c t u r e p o s i i o n w i t h t h e moi t
C o r r e c
T A C L pic^i.ur1
p o s i t -f a c t o r s } i o n
S u b i t ? c t s p r e f e r e n c e i n p l j t e s w i t h a nrJ-d i f f -e r e n c e
P r e f e r e n c e t h a t h a s n o d o m i n a n t f a c t o r s

E
73
74
75
76
77
78
_ZI 80
81
82
83
84
85
86
87
88
89
90
91
!L
93
94
95
96
4 7
R e v i s e d P P F A n a l y s i s o f P i c t u r e s , C o r r e c t P i c t u r e s
and Sub jec ts ' P re fe rences fo r TACL P ic tu res
P i c t u r e p o s i t i o n w i t h
a m o u n t o f . a c t i o n
2,3
2,3
2,3
1,3
1 , 2
c h i l d -r e n
N u m b e r o f p e o p l e
1 . 2
t h e m o s t o f t h e f a c t o r
N u m b e r of d i f f e r e n t t h i n g s
2,3
N u m b e r o r a l l t h i n g s
2,3
C o l o r
P < ? t e n -t l a l f o r m o v e m e n t
P i c t u r e p o s i t i g n w i t h the most f a c t o r s
C o r r e c t
T A C L p iciur1
p o s i t i o n
S u b i e c t : p r e f e r e n c e ? . n p l a t e s with ,3
f issr-d i f r -e r e n c e
P r e f e r e n c e t h a t h a s n o d o m i n a n t f a c t o r s

4 8
Revised PPF Analysis of Pictures, Correct Pictures
and Subjects ' Preferences for TACL Pictures
97
98
99
100
101
P i c t u r e p o s i t i o n w i t h t h e m o s t o f t h >
1 2 3 4 5
a m o u n t o f a c t i o n
2,3
c h i l d r e n
N u m o e r o f d i f f -e r e n t t h i n g s
1,3
N u m b e r o t a i t c h i n q s
» f a c t o r
6
2,3
P p t e n -t l a i
Picture QOZ i r ion with
r o s t f a c t o r s
C o r r o c T A C L pic vurr ros i -i o n
S u b i e c t p r e f e r e n c e i n r j l o t e s w i ! : h t
i o n l t -i C . ) n t d i f f e r e n c e
P r e f e r e n c e t h a t ^ a s n o d o m i n a n t f a c t o r s
0 indicates that a l l 3 p ictures were equal for that factor and/or the factor was not present.
1 picture posi t ion on the lef t of the plate
2 p icture posi t ion in the middle of the plate
3 p icture posi t ion on the r ight of the plate

APPENDIX D

4 9 Appendix D - Descr ipt ive Informat ion About The Subjects
Su
bje
ct
G) 01 < T
AC
L
Ra
w
Sc
ore
01 0 O .2 t— ^ •4- ^ 0 c , s e o
Cj
E Ll. o' •c
Su
b je
c.
t
CT> < T
AC
L
Ra
w
Sc
ore
Ord
er
of
Te
s
Pre
se
nta
tio
r
0)
5 S
U. D"
i 4-7 85 1-2 F 21 4-8 80 1-2 F
2 4-1 75 2-1 F 22 4-3 77 2-1 M
3 4-4 76 1-2 F 23 4-6 69 1-2 M
4 4-3 76 2-1 F 24 4-5 73 2-1 M
5 4-4 71 1-2 F 25 4-4 70 1-2 M
6 4-0 71 2-1 F 26 4-8 65 2-1 F
7 4-1 70 1-2 F 27 5-0 65 1-2 M
8 4-5 83 2-1 F 28 4-1 67 2-1 M
9 4-7 69 1-2 F 29 4-2 68 1-2 M
10 4-4 58 2-1 F 30 4-6 78 2-1 M
11 4-4 53 1-2 F
12 4-11 80 2-1
13 4-51 81 1-2 F
14 4-11 72 2-1 F
15 4-3 62 1-2 M
16 4-10 80 2-1 M
17 4-7 71 1-2 M
18 4-9 76 2-1 M
19 4-4 73 1-2 F
20 4-8 69 2-1 M
* 1 = TACL Test Administrat ion
2 = Test for Picture Preference