perceptions of teachers of students with visual...
TRANSCRIPT

Perceptions of Teachers of Students withVisual Impairments on the Importance of
Physical Activity and its Effect on their Students'Academic Success and Social Interactions
Item Type text; Electronic Dissertation
Authors Zwald, Kathy Jayne
Publisher The University of Arizona.
Rights Copyright © is held by the author. Digital access to this materialis made possible by the University Libraries, University of Arizona.Further transmission, reproduction or presentation (such aspublic display or performance) of protected items is prohibitedexcept with permission of the author.
Download date 28/04/2018 02:43:33
Link to Item http://hdl.handle.net/10150/195328
PERCEPTIONS OF TEACHERS OF STUDENTS WITH VISUAL IMPAIRMENTS ON THE IMPORTANCE OF PHYSICAL ACTIVITY AND ITS EFFECT ON THEIR
STUDENTS' ACADEMIC SUCCESS AND SOCIAL INTERACTIONS
by
Kathy Jayne Zwald
_____________________
A Dissertation Submitted to the Faculty of the
DEPARTMENT OF SPECIAL EDUCATION, REHABILITATION and SCHOOL PSYCHOLOGY
In Partial Fulfillment of the Requirements For the Degree of
DOCTOR OF PHILOSOPHY WITH A MAJOR IN SPECIAL EDUCATION
In the Graduate College
THE UNIVERSITY OF ARIZONA
2008
2
THE UNIVERSITY OF ARIZONA GRADUATE COLLEGE
As members of the Dissertation Committee, we certify that we have read the dissertation prepared by Kathy Jayne Zwald entitled "PERCEPTIONS OF TEACHERS OF STUDENTS WITH VISUAL IMPAIRMENTS ON THE IMPORTANCE OF PHYSICAL ACTIVITY AND ITS EFFECT ON THEIR STUDENTS' ACADEMIC SUCCESS AND SOCIAL INTERACTIONS" and recommend that it be accepted as fulfilling the dissertation requirement for the Degree of Doctor of Philosophy
_______________________________________________________________________ Date: 4/30/2008
Dr. Jane Erin _______________________________________________________________________ Date: 4/30/2008
Dr. Irene Topor _______________________________________________________________________ Date: 4/30/2008
Dr. Marion Slack _______________________________________________________________________ Date: 4/30/2008
Dr. Charlene Kampfe Final approval and acceptance of this dissertation is contingent upon the candidate’s submission of the final copies of the dissertation to the Graduate College. I hereby certify that I have read this dissertation prepared under my direction and recommend that it be accepted as fulfilling the dissertation requirement. ________________________________________________ Date: 4/30/2008 Dissertation Director: Dr. Jane Erin

3
STATEMENT BY AUTHOR
This dissertation has been submitted in partial fulfillment of requirements
for an advanced degree at the University of Arizona and is deposited in the
University Library to be made available to borrowers under rules of the Library.
Brief quotations from this dissertation are allowable without special
permission, provided that accurate acknowledgment of source is made.
Requests for permission for extended quotation from or reproduction of this
manuscript in whole or in part may be granted by the head of the major
department or the Dean of the Graduate College when in his or her judgment the
proposed use of the material is in the interests of scholarship. In all other
instances, however, permission must be obtained by the author.
SIGNED:___KATHY JAYNE ZWALD_____

4
ACKNOWLEDGMENTS
I would like to recognize my committee members for this study; they have
been an incredible source of support and guidance as I meandered through this
dissertation process. The members include Dr. Jane Erin, Dr. Irene Topor, Dr.
Marion Slack and Dr. Charlene Kampfe; their experience and expertise have
been invaluable to me in completing the study and my dissertation.
I would also like to recognize the many friends and colleagues who have
supported me through this process and helped me to find the necessary
resources to develop this study. In particular, I would like to thank my colleague,
Megan O’Connell in reviewing my qualitative information and participating in
developing the themes for that section. Her knowledge and expertise in the area
of physical education and vision impairments were very important in analyzing
the data provided for the study.
This topic is very important, as I have always believed that physical
activity is one of the keys to success in enduring traumas and enjoying a quality
of health that can be attained through exercise. Young people in this country
are losing the sense of how important physical activity can be for a healthy
quality of life and longevity. It is important that individuals who understand the
necessity for physical activity and good nutrition give this message to
adolescents and teenagers to enable them to develop healthy decisions making
as they grow into adulthood.
5
DEDICATION
I would like to dedicate this publication to three women who have been the
most influential in helping to find my dream and finishing this dissertation. To my
mother, Lauranne Valentine Zwald, who valued my education and always made it
possible for me to pursue my professional endeavors, I’m sure she is tipping her
glass in heaven with this accomplishment
To my friend and colleague, Anne McComiskey, who has believed in me
from the very beginning and has always known that I would finish, even when I
didn’t think I could. Her faith in me has been my inspiration in finishing.
And finally, to my mentor, friend, counselor, and spiritual guide, Lynn
Lane, who has pushed me, pulled me by the scruff of my neck, been my
cheerleader and has always believed in me. She has truly helped me to find
who I am and who I want to be that goes far beyond completing this process.

6
TABLE OF CONTENTS
Page LIST OF TABLES…………………………………………………... 9
ABSTRACT…………………………………………………………. 10
1. INTRODUCTION….………………………………………… 12
Statement of problem………………………………. 17
Purpose and research questions………………….. 18
Definition of terms…………………………………… 20
2. LITERATURE REVIEW….………………………………….. 23
The prevalence of obesity…………………………… 23
Inactivity, Obesity and Visual Impairments………… 30
Strategies for change………………………………… 39
Conclusion……………………………………………. 43
3. METHODOLOGY…………………………………............... 46
The survey……………………………………………. 49
Procedures for data collection – analysis…………. 50
4. RESULTS…………………………………………………….. 53
Research questions………………………………….. 54
Teachers of students with visual impairments…….. 54
Students with visual impairments…………………… 58
Research question – 2……………………………….. 61

7
TABLE OF CONTENTS, continued
Page
Research question – 3………………………………62
Research question – 4……………………………….63
Research question – 5……………………………….64
Research question – 6……………………………….65
Research question – 7………………………………..66
Research question – 8………………………………..67
Research question - 9…………………………………68
Open ended question 1……………………….69
Open ended question 2……………………….70
Open ended question 3……………………….73
5. DISCUSSION…………………………………………………..76
Characteristics of teachers, students and
community types……………………………….77
Importance of physical activity for students…………80
Differences in level of participation in recreation
activities with visually impaired and
sighted peers…………………………………...82
Impact of Obesity on Social relationships…………..84
Importance of Physical Education……………………86

8
TABLE OF CONTENTS, continued
Relationships between physical activity
and academic success…………………….....88
Students with visual impairments participation
in physical education and activities
outside of school………………………..……..89
Relationships between a teacher’s personal
Physical activity and perceptions of
Importance…………………………………..….90
Intervention strategies used by teachers of
Students with visual impairments with
Their students…………………………….……91
Limitations of the study………………………………..98
Implications for future research……………………..100
Conclusion…………………………………………….103
APPENDIX A: SURVEY FOR TEACHERS………………………105
APPENDIX B: EMAIL REQUEST………………………………… 109
APPENDIX C: DISCLAIMER STATEMENT……………………...111
APPENDIX D: HUMAN SUBJECT RESEARCH STATEMENT..113
APPENDIX E: RESEARCH – DATA ANALYSIS………………...115
REFERENCES……………………………………………………….118

9
LIST OF TABLES
Table Page
1 Characteristics of teachers of students
with visual impairments and practice settings….....56
2 Characteristics of students in educational
programs for students with visual impairments……59
3 Ethnicity by community………………………………………61
4 Importance of physical activity for students with
visual impairments…………………………………….62
5 Differences between participation with sighted and
visually impaired peers by community………………..…….63
6 The impact of being overweight and social interactions….64
7 Importance of physical education in the general
curriculum………………………...............................65
8 Importance of physical activity and academic success…..66
9 Correlations between a teacher of students
with visual impairments’ personal activity
levels and perceptions………………………………...67
10 Themes for strategies used for weight issues………………70
11 Themes for strategies in increasing
physical activity………………………………………...72
12 Themes for physical activity and interventions………….….74
10
ABSTRACT
More than 60% of the adult population in the United States is overweight,
and obesity has reached epidemic proportions in this country. Childhood obesity
has more than doubled since 1990, and the health consequences are reflected in
the rising cost of health care. There has also been a significant drop in physical
activity across the country and physical education is no longer required in middle
schools. The lack of physical activity and issues of weight can compromise the
ability of the individual who is blind or visually impaired to maneuver through the
environment safely and efficiently. The purpose of this study was to examine the
perceptions of itinerant teachers of students with visual impairments about the
importance of physical activity for their students with visual impairments and its
effect on academic success and social relationship.
Data was gathered from 175 teachers of students with visual impairments
concerning their perceptions regarding the importance of physical activity and
obesity and their relationship with academic success and social relationships.
The teachers indicated that physical activity for their students is very important.
They described a multitude of barriers that account for a lack of involvement in
the general physical education classes in which they were enrolled.
Teachers reported on their own personal physical activity levels in
relationship to the importance they placed on their students’ need to be active.
The teachers did not indicate that being overweight was a particular issue with
their visually impaired students, but they acknowledged that being overweight

11
and a lack of physical activity create additional barriers for academic success
and appropriate social relationships.
The teachers also reported that the same barriers in physical education
classes and access to recreation activities in the community that have been listed
in past research studies were still in existence, and these barriers were also part
of their dilemma in creating positive physical activity experiences for their
students who are visually impaired. This study validated the necessity of further
research to find the effective intervention strategies and programs to increase
physical activity of students with visual impairments.

12
CHAPTER 1
INTRODUCTION
Childhood obesity has more than doubled since 1990, and the health
consequences are reflected in the rising cost of health care (National Center for
Chronic Disease Prevention and Health Promotion, Center for Disease Control,
{CDC}, 2007). An estimated 15% of U.S. children and adolescents ages 6 to 19
are overweight or obese, and the likelihood of being overweight or obese
increases as people get older; 64% of U.S. adults are either severely overweight
or obese (CDC, 2007).
The two factors that are the most predominant cause of childhood and
adolescent overweight or obesity are lack of physical activity and poor eating
habits. Information from recent studies has shown that genetic tendencies for
weight gain are not a major factor in children who are overweight or obese (CDC,
2007) and that regular physical activity has many health benefits, including
weight control.
Being overweight or obese is especially a problem for children who have
visual impairments because of sedentary behaviors and lack of access to
physical activity (Ponchillia, 1995). Recent technological advancements, the lack
of availability of healthy snacks and eating choices, and the lack of options for
physical activity have created optimum conditions for children with visual
impairments to become overweight or obese. Some health professionals have
suggested that 10% more children with visual impairments are obese than

13
sighted children of similar ages (Lederman, 2004). Given the high rate of obesity
among children with visual impairment, physical fitness and good nutrition is as
important as it is for all children.
Visual impairments and blindness are low incidence disabilities. For this
study, the term visual impairments including blindness, which is used in the
implementation of the Individuals with Disabilities Education Act of 1997 (PL 105-
17), will direct the vocabulary in the text. The terms visual impairments or
visually impaired will encompass the full range of visual acuity from legal
blindness (20/200) to total blindness (no light perception).
Physical fitness and good nutrition are essential elements for children with
visual impairments and can be overlooked. The need for fitness in children who
have visual impairments can be considered of greater importance because of the
increased energy required to complete activities of daily living (Buell, 1982).
Physical fitness will help the individual to achieve the goal of most travelers who
are visually impaired to move safely and efficiently through different
environments. Being physically fit promotes the acquisition of difficult orientation
and mobility skills that deal with recovery techniques and restoring balance that
creates safe travel in a multitude of environments (Craft, 1986).
Since the adoption of the Education of All Handicapped Students Act (P.L.
94-142) and the Individuals with Disabilities Education Act (IDEA; P.L. 105-17), a
free and appropriate public education has been guaranteed for all students with
disabilities. In the field of visual impairment, the teacher of students with visual
14
impairments is often a primary professional involved in a student’s academic and
social development in public education programs. The role that the teacher of
students with visual impairments plays in the academic and social development
is significant, and it is important to evaluate this role in addressing the nutritional
and physical activity needs of students who are visually impaired.
According to Correa-Torres and Howell (2004), over 85% of students with
visual impairments are being served in general education classrooms at least
part of the time. As more students are being served in inclusive settings, the
need for itinerant services is growing. An itinerant teacher of students with visual
impairments travels from school to school, providing individual instruction and
special materials to students and conducting consultative services with regular
classroom teachers and other school personnel (Olmstead, 1995). The role of
the itinerant teacher is very different from that of those teachers in resource
rooms, self-contained classrooms and residential schools; however, the
demands for providing the appropriate services to students who are visually
impaired through an academic and functional curriculum are the same.
The role of the teacher of students with visual impairments has expanded
because of the academic and social challenges that students who are blind or
visually impaired are facing in public schools. The increasing demands of
learning assistive technology, and the academic pressure of keeping up with their
sighted peers, along with the social pressure of being accepted by their sighted
peers increases the need for an expanded core curriculum that can be taught by
15
a teacher of students with visual impairments. In order to begin to address
competency in these areas, the National Agenda for the Education of Children
and Youths with Visual Impairment, including those with Multiple Disabilities
(Corn, Hatlen, Huebner, Ryan, and Siller, 1995), was developed in 1995. Goal 8
of the document states that the “educational and developmental goals, including
instruction, will reflect the assessed needs of each student in all areas of
academic and disability-specific core curricula” (p.5). In addition, Hatlen (1996)
pressed for the adoption of a core curriculum for students with visual
impairments. This core curriculum included compensatory and functional
academic skills, such a communication modes; orientation and mobility; social
interaction skills; independent living skills; recreational and leisure skills; career
education; technology; and visual efficiency.
In a study by Wolffe and Sacks (1997), data were collected through the
Social Network Pilot Project (SNPP) on the lifestyles and social support networks
of young adults with visual impairments aged 15-21 as compared with a matched
sample of sighted age young adults. The SNPP examined the academic
involvement and performance, daily living and personal care activities, recreation
and leisure activities, and work and vocational experiences of three groups;
individuals who were blind, low vision and sighted. The largest discrepancy
between the three groups was seen in the area of social activities, specifically
social interaction after school. Sighted students reported that they spent most of
their time with friends and occasionally with parents or siblings. As opposed to

16
the majority of students, those who were blind or visually impaired spent most of
their time after school alone (Wolffe and Sacks, 1997).
Social isolation or spending large amounts of unwanted time alone is an
important issue for individuals who are blind or visually impaired because of how
it affects independence and successful employment opportunities. In a study on
social isolation and disabilities, Tuttle (2004) states that because blindness and
visual impairment is inherently a very isolating disability, the individual who has
this disability should be exposed to a variety of skills in interactive occupations
that can prevent large amounts of time that is spent in unwanted isolation.
The purpose of this study is to examine whether teachers of students with
visual impairments believe that obesity and lack of physical activity affect their
students’ abilities to be successful in social and academic arenas. In addition,
the study will include an investigation of the barriers that are associated with
access to physical activities and whether obesity and lack of physical activity are
primary concerns of teachers of students with visual impairments in addressing
the needs of their visually impaired students. Finally, the study explores what
role teacher of students with visual impairments perceive they play in enabling
their students to be more physically active, encouraging them to adapt
appropriate nutritional habits and successful intervention strategies they may
have used.
17
Statement Of The Problem
Students who are blind or visually impaired face many obstacles in
achieving academic success and having healthy social interactions that lead to
successful, productive adulthood. Being overweight and not participating in
physical activity create additional barriers to social success. Professionals in the
field of blindness and visual impairment, specifically teachers of students with
visual impairments, are required to teach their students the fundamentals of
academic achievement and access the skills needed through the expanded core
curriculum. Although this includes physical education when it is part of the
regular curriculum, the teacher of students with visual impairments is often able
to only spend limited time in direct instruction due to extensive commitments.
However, intervention strategies in the areas of nutrition and physical activity can
be implemented by teachers of students with visual impairments because of the
individual contact through one on one instruction that they have with their
students. According to Wolffe et al. (2002), teachers of students with visual
impairments have a wide variety of responsibilities to their students because of
the needs specific to blindness or visual impairment. The perceived role of the
teacher of students with visual impairments is a very important tool in designing
the appropriate intervention strategies that enable students who are blind and
visually impaired to practice good nutritional habits and increase physical activity.
Therefore, it is important to know what values and teaching strategies are
emphasized by these teachers through their professional roles.

18
Purpose and research questions
The purpose of this study was to determine what teachers of students with
visual impairments perceived their roles to be with their students in promoting
healthy nutritional habits and physical activity. In addition the study will examine
how teachers perceive nutrition and physical activity affect social interaction and
academic success. Research questions for the study follow:
1. What are the characteristics of teachers of students with visual
impairments and their students in different community types in the
country, and are there differences and/or similarities between these
communities?
2. What are the perceptions of teachers of students with visual
impairments about the importance of physical activity for their
students?
3. Are there differences between visually impaired students’
participation in recreation activities with their visually impaired and
sighted peers? Are there differences between community types?
4. What do teacher of students with visual impairments perceive is
the importance of the impact of obesity on the social relationships
of their students who are blind or visually impaired?
5. How do teachers of students with visual impairments view the
importance of physical education in the general education
curriculum for the schools they serve?
19
6. Do teachers of students with visual impairments perceive that there
are relationships between physical activity and academic success of
their students?
7. According to teachers of students with visual impairments, what
percentage of their students participate in physical activities in
school and outside of the school environment?
8. Are there relationships between the personal physical activity of
teachers of visually impaired students and their perceptions of:
- the importance of their student’s physical activity?
- the influence of their student’s physical activity on social
interactions?
- the influence of their student’s weight in social experiences?
- the importance of physical education in the general curriculum?
- the influence of physical activity on academic success?
9. What intervention strategies do teachers of students with visual
impairments believe are successful with their students in reducing
obesity and increasing physical activity?

20
Definition of Terms
The following terms are essential to this study and are used frequently in
the document.
Teacher of Students with Visual Impairments – Professionals who
graduated from a university that has an accredited Bachelor/Master
degree program in education of students with visual impairments and who
teaches Braille, use of assistive technology, efficiency in use of low vision,
and use of school resources through advocating for the individual needs of
students who are blind or visually impaired.
Itinerant teachers of students with visual impairments – Teachers who
travel throughout a school district or region and deliver services to
students who are visually impaired in a variety of schools
Obesity - A person who weighs more than thirty percent over their ideal
body weight as measured by the body mass index. (CDC, 2007)
Body Mass Index (BMI) - A calculation of a person’s weight in kilograms
over their height in meters and squared.
Expanded Core Curriculum (ECC) – The curriculum that addresses other
needs of students who are visually impaired that are not taught through
the standard academic curriculum. Areas such as skills in daily living,
recreation and leisure, money management and vocational training are
part of the ECC.

21
Association for the Education and Rehabilitation of Individuals who are
Blind or Visually Impaired (AER) - The international organization for
professionals who work with individuals who are blind or visually impaired.
Orientation and Mobility Specialists (O&M) – Professionals who
graduated from a university with an accredited Bachelor/Masters degree
program in Orientation and Mobility. These specialists teach skills
necessary for safe and independent travel in a variety of environments
using a cane or other assistive devices according to the individual needs
of the student.
Coded Units in Qualitative Data – For the three open-ended questions,
responses from the teachers were marked as units and coded for
similarities and differences
Themes for Qualitative Data – The units for the three open-ended
questions were collated to determine similarity. Once the similarities
developed, an overall theme was identified for each group of units.
In order to develop into healthy, physically active adults, all children need
education in physical fitness, health, wellness, and lifetime sports and recreation
(Ross, Lottes, and Glenn, 1998). Students with visual impairments have the
same needs and are often limited in their opportunities to access physical
activities. Because 85% of visually impaired students attend classes in a public
school setting, inclusion in general physical education programs is part of the
22
curriculum. In order to ascertain whether these classes are effective in promoting
physical fitness for students with visual impairments, it is necessary to examine
the practices of general physical education teachers, teachers of students with
visual impairments and students in creating accessibility for these programs.
The following chapter will review foundation of research related to this study.

23
CHAPTER 2
LITERATURE REVIEW
The purposes of this literature review are to describe (a) current
perspectives on the growing percentage of children and adolescents who are
overweight and obese (b) the relationship between physical activity and being
overweight and (c) the relationships for adolescents who have a visual
impairment between the lack of physical activity and being overweight. Based on
the literature, conclusions about the increasing rate of overweight percentages
among children, reasons for a lack of physical activity for students with visual
impairments that could affect their social and academic performances, along with
recommendations for stopping and reversing these trends will be determined.
The Prevalence of Obesity
The National Health Institute defines being overweight as having a body mass
index (BMI) of 25 or more. According to health professionals, BMI is used
because the formula represents the ratio of weight to height and is considered
the best source for measuring fat percentages. This ratio is a mathematical
formula in which a person’s body weight in pounds is divided by the square of his
or her height in inches. Individuals with a BMI of 25 to 29.9 are considered
overweight and individuals with a BMI of 30 or more are considered obese
(Center for Disease Control [CDC], 2007). For example, a person who weighs
170 pounds and is 6’ will have a BMI in the normal range whereas a person who
is 170 pounds and 5’4” will have a BMI in the obese range. For children and

24
youth, overweight is defined as at or above the 95 percentile of BMI for a
person’s age. At risk for being overweight is at or above the 85th percentile, but
below the 95th percentile. Using the BMI as a gauge for defining obesity and
severe overweight conditions, an estimated 16% of children and adolescents
ages 9 to 19 years are overweight. This statistic represents a 45% increase from
the overweight estimates of 11% in 1994 (CDC, 2007).
To assess changes that occurred in the percentage of children who were
overweight or obese, estimates of the numbers of participants who were
overweight or obese in a 2002 survey were compared with estimates for those
who participated in earlier surveys. The National Health and Nutrition
Examination Survey, (CDC, 2007) and an earlier survey method gathered a
stratified, multistage, probability sample of the U.S. population. A household
interview and a physical examination were conducted for each survey participant.
During the physical examination, conducted in mobile examination centers,
height and weight were measured as part of a more comprehensive set of body
measurements. These measurements were taken by trained health technicians,
using standardized measuring procedures and equipment (CDC, 2007).
The data from the survey showed that weight gain in children and
adolescents was relatively stable from 1960 to 1980. However, from 1980 to
2000, the prevalence of being overweight nearly doubled among children and
adolescents. More precisely, percentages of children ages six to eleven years
increased from an estimated 7% to 11% and among adolescents ages twelve to

25
nineteen years, percentages increased from 5 to 11 (CDC, 2007). The data for
adolescents is of notable concern because overweight adolescents are at
increased risk to become overweight adults (CDC, 2007). The 1999-2002
findings for children and adolescents suggest the likelihood of another generation
of overweight adults who may be at risk for subsequent overweight and obesity
related health conditions.
A report generated through the Healthy Americans Organization in 2007,
entitled “F as in Fat: How Obesity policies are failing in America” notes that the
rate of childhood obesity more than tripled from 1980 to 2004. Approximately 25
million children are now either obese or overweight. The report is a compilation
of statistics from various agencies connected with obesity and overweight issues
around the country. Examples of these agencies are the Center for Disease
Control, the United States Department of Heath and Human Services, the Robert
Wood Johnson Foundation, American Cancer Society and the National
Governors Association Center for Best Practices. The researchers also
conducted telephone interviews with individuals through a random sample of
adults and parents across the country. It is a 116 page report and the most
comprehensive document to date concerning obesity issues in this country. One
notable percentage from the report was found in overweight teenagers ages 10 –
17 for individual states. The rates ranged from a low of 8.5 percent in Utah to
22.8 percent in the District of Columbia. Eight of the 10 states with the highest
rates of overweight children were in the south.

26
Being overweight or obese as a child or adolescent has also been
documented to have long-range health consequences. According to the CDC
(2007), overweight and obese individuals (BMI of 25 and above) are at increased
risks for physical ailments such as high blood pressure, hypertension, type two
(non-insulin dependent) diabetes, coronary heart disease, stroke and some types
of cancer (such as endometrial, breast, prostate, and colon). In 2006, the
prevalence of obesity (BMI greater than or equal to 30) was 32.3% and the
prevalence of diabetes was 11.1 % (CDC, 2007). Percentages for hypertension
in adults increased to 32.7 percent and nine of the top 10 states in percentages
were in the south (CDC, 2007). Research suggests that individuals diagnosed
with diabetes before age 20 have a life span 15 to 27 years shorter than non-
diabetic individuals, and that the earlier the onset, the higher the incidence of
nephropathy, retinopathy, neuropathy and coronary and peripheral vascular
disease (Datar and Strum, 2006). In addition, obesity and being overweight in
children negatively impacts children’s mental health and school performance. In
sum, it has been shown that obesity and being overweight in childhood and
adolescence is often a pathway toward increased risk and development of
obesity-related diseases as adults and long term health problems (CDC, 2007).
The long-term health conditions associated with being overweight or
obese have created enormous economic responsibilities for taxpayers in this
country. According to a study of national costs attributed to being overweight or
obese, medical expenses accounted for 9.1% of total U.S. medical expenditures
27
and may reach as high as $78.5 billion (Finkelstein, Fiebelkorn, and Wang,
2003). Taxpayers through Medicaid and Medicare reimbursement paid
approximately half of these costs.
State-level reimbursement estimates range from $87 million (Wyoming) to
$7.7 billion (California). Obesity-attributable Medicare expenses range from $15
million (Wyoming) to $1.7 billion (California), and $3.5 billion (New York). The
state differences in obesity-attributable expenditures are partly driven by the
differences in the size of state populations (Finkelstein, Fiebelkorn, and Wang,
2003). According to the Department of Health and Human Services (2008),
obesity associated hospital costs for children ages 6 -17 have tripled, from $35
million to $127 million.
The two factors that are the most predominant causes for children and
teenagers being overweight or obese are lack of physical activity and poor eating
habits. Information from recent studies has shown that genetic tendencies for
weight gain are not a major factor in children who are overweight or obese (CDC,
2007) and regular physical activity has many health benefits including weight
control. Despite these statistics, more than a third of teenagers in grades nine to
twelve do not regularly engage in physical activity. Daily participation in high
school physical education classes dropped from 42% in 1991 to 32% in 2006.
Physical education classes are no longer required in middle or high school, and
students often do not participate in structured programs in physical fitness as a
part of their daily activity.

28
There has also been a drop in participation in recreation activities in the
community, and a CDC health survey in 2006 found that more that 22 percent of
adults do not participate in any physical activity at all. The link between physical
inactivity and obesity is very strong and has correlations according to state
statistics. For example, Mississippi has the highest obesity rate and the highest
reported rate of physical inactivity in the country at 31.6 percent (CDC, 2007). As
with obesity, 8 of the 10 states with the highest percentages of inactivity were in
the south.
Current research concerning the rising prevalence of obesity in
adolescents also indicate that poor eating habits established during childhood
become ingrained in a child’s routine and are very hard to break. Only 21% of
young people eat the recommended five or more servings of fruits and
vegetables each day (CDC, 2007). In an article published in National
Geographic entitled, “Why are we so fat?” the author examined the growing
epidemic of obesity in America (Newman, 2004). She remarked that as families
click on the TV in the morning, they see food messages flooding into the kitchen.
Newman states that the average child in the U. S. will watch nearly 10,000
commercials promoting food or beverages a year. Lederman (2004) states that
commercials such as “a huge bag of Double Delight Oreos swimming into view,
Martha Stewart making a chocolate ganache, and a Snickers bar becoming the
ultimate energy bar” exemplify the toxicity of what is being advertised as food
choices in this country. Newman (2004) also asserts that “food behavior

29
intervention is like trying to treat an alcoholic in a town where there’s a bar every
10 feet.” The author continues, “bad food is cheap, heavily promoted, and
engineered to taste good. Healthy food is hard to get, not promoted, and
expensive.” In an article examining the rising percentage of childhood obesity,
intervention legislation in television advertising and food labeling is beginning to
find support in Congress (Hedley, et al, 2002). Emerging school-based efforts
have focused on improving the quality of food sold in schools, limiting sales of
less nutritious foods, improving physical education, and encouraging increased
physical activity either within the school day or after school activities. (Health and
Human Services, 2008). Researchers in the pediatric field are focusing on
childhood obesity and what eating programs or psychological strategies can be
effective for successful interventions in infancy and early childhood ages.
However, in the report by the Healthy Americans organization (2007),
barriers to decreasing childhood obesity and increasing physical activity involve
very complex and complicated issues. In a national survey, it was found that
parents indicated the roadblocks to decreasing obesity were (a) physical activity
and eating patterns of parents, (b) cuts in physical education, recess and health
education at school, (c) environmental factors such as lack of sidewalks and
unsafe neighborhoods, (d) lack of healthy foods in schools, (e) lack of leadership
on the issue, and (f) an under-diagnosis of obesity and overweight children in the
primary care setting. In addition, barriers to increasing physical activity for
children include (a) long work and school hours, (b) family and home influences,

30
(c) communities not designed for physical activity, (d) economic constraints, (e)
emotional aspects of beginning exercise programs and (f) lack of awareness or
knowledge.
Inactivity, Obesity and Visual Impairments
Physical fitness and good nutrition are as important to children with visual
impairments as they are to sighted children. The need for fitness in children who
have visual impairments might even be greater because of the increased energy
required to complete activities of daily living (Buell, 1982). A goal of most
travelers who are visually impaired is to move safely and efficiently through
different and often unfamiliar environments. Being physically fit promotes
successful movement and facilitates the acquisition of orientation and mobility
skills for safe travel in a multitude of environments (Craft, 1986). In fact, a study
by Hatton et al. (1997), research completed with preschoolers age 1-3 indicated
that the more visually impaired a child is, the slower the rate of development of
motor skills. These children also demonstrated delays in reaching
developmental milestones such as mobility and locomotion related behaviors.
Other studies have indicated that children with visual impairments also have
delays in object control and manipulation skills, which can be delayed as much
as three to six months, along with delays in play and social skills (Kroksmark and
Nordell, 2001; Sherrill, 2004).
Even though good nutrition is important to children with visual
impairments, studies about the relationship between nutrition and visual

31
impairment are very scarce. The focus of this portion of the literature review is
on examining the present studies that show need for physical activity for students
who are visually impaired, the lack of access to physical activity and resulting
sedentary behaviors for children who have visual impairments.
According to the American Foundation for the Blind (2007), over 94,000
students are under the age of 21 and receive educational services due to a visual
impairment. Since the inception of Public Law 94-142 in 1975, 85% of students
with visual impairments are mainstreamed into public schools across the country.
However, opportunities for students with visual impairments to actively participate
in regular physical education classes, sports and community activities are limited
because of (1) attitudes of general physical education instructors and
administrators, (2) inadequate equipment and lack of adaptations in physical
education programs, (3) the lack of adequate programming in physical education
classes and (4) the lack of accessibility to community activities with their peers
who are sighted or visually impaired (Lieberman, Houston-Wilson and Kozub,
2002).
In public school settings, children and adolescents with visual impairments
consistently exhibit lower levels of fitness than their sighted peers (Lieberman,
1999). Poor fitness is attributed to the lack of opportunities for students with
visual impairments to participate in physical education classes and sports
programs (Ponchillia, 1995). The lack of access to physical education classes in
public schools has a direct relationship to the physical education teacher’s

32
general lack of knowledge of the adaptive techniques required to include
students with visual impairments, and special education teachers’ lack of
knowledge of specific sports skills (Ponchillia, 1995). Individuals who need
fitness the most actually have the least opportunity to be physically active.
In a study conducted by Lieberman, Robinson and Rollheiser (2006),
adolescents with visual impairments were surveyed concerning their experience
in general physical education classes. The students stated that they were often
not included in activities because of their visual impairment, or the teachers did
not have the right equipment to allow participation. Also, the games and sports
that were introduced in physical education classes were group activities such as
baseball, football and soccer and were not modified for students with visual
impairments.
In comparison, a study by Lieberman, Houston-Wilson and Kozub (2002),
examined how physical educators defined the barriers they faced in including
children with visual impairments in physical education. The questionnaire was
designed to include open-ended questions, and the teachers were chosen
randomly from a pool of physical education teachers in New York City.
Interpretation of the data indicated that the greatest barrier to appropriate
inclusion was lack of preparation in teacher certification programs in physical
education. The physical education teachers reported that university programs did
not provide enough information to give them confidence to include students with
visual impairments in their physical education programs. Though the
33
questionnaire centered on barriers to programming, questions were not asked
concerning perceived attitudes of teachers toward inclusion of students with
disabilities in regular physical education classes. Some of the barriers could be
the teachers’ own limitations, instead of the quality of information provided
through the university curriculum.
Although children and adolescents with visual impairments are vulnerable to
developing lower levels of fitness than their sighted peers, potential aerobic
capacity is considered to be the same between the two groups. In a study
completed in Great Britain, aerobic fitness was compared in ten visually impaired
girls and ten sighted girls who performed a treadmill test to exhaustion (Williams
and Armstrong, et al, 1996). The study showed no significant difference between
the peak oxygen intake and aerobic capacity of the two groups. The participants
were chosen randomly from a database of about 2,000 children who had
previously been tested at an exercise research center. The sighted girls were
selected randomly from a sample matched for age, height and body mass to the
girls who were visually impaired. The major difficulty with this study was the
sample size. According to the authors, over 10,000 blind or visually impaired
students reside in Great Britain. Fifty-three percent of the students attend regular
public schools and do not have additional impairments. The sample size for this
study (20 girls) does not allow for generalization to the rest of the population.
However, the hypothesis is reasonable. If a visually impaired child or adolescent
has no other disabilities, the physiological differences between the girls at the

34
same age, height and body mass should be insignificant. Several studies have
also shown that students with visual impairments have the same potential to
develop physical fitness as their sighted peers, however they do have unique
motor characteristics due to their visual impairment and a higher level of fitness
needs to maneuver through their environment (Shephard, Ward and Lee, 1987;
Winnick, 1985; and Lieberman, Houston-Wilson and Kozub, 2002).
In looking at comparisons between visually impaired and sighted students
fitness levels, a study completed by Kobberling, Jankowski, Leger (1991),
examined the relationship between aerobic capacity and physical activity in blind
and sighted adolescents aged twelve to eighteen. Information gathered from the
data indicated that adolescents with visual impairments had a lower accessible
aerobic capacity than their sighted peers. The goal of the study was not to
examine potential for aerobic capacity, but the differences in the levels of fitness
between the two groups. The participants consisted of four groups; 10 blind and
10 sighted girls and 20 blind and 20 sighted boys, ages 12 to 18 with the mean
age of 14.2 in the girls’ group and 15.5 in the boys’ group. Each group performed
treadmill tests to measure how long the member executed the task and the
length of intensity. According to the authors, measurement in the intensity level
of each exercise time period provided the most significant information concerning
the differences between the blind and sighted groups. Both sighted groups
scored significantly higher than the blind groups on their ability to tolerate higher
levels of intensity over a longer period of time. The overall scores for maximum

35
duration and oxygen capacity were higher in the sighted groups. The authors
concluded that the lower scores for the groups that were blind or visually
impaired could be associated with the lack of opportunities for physical activity for
adolescents with visual impairments that have been critiqued in other studies.
Besides the limited access to physical activity, several other factors could
contribute to a lower level of fitness in adolescents with visual impairments. In
her work with infants and preschoolers, Lois Harrell conceptualized a term called
the “good fairy syndrome”. In a conversation with Dr. Kay Ferrell and recorded in
the textbook used in teacher preparation programs for teachers of students with
visual impairments, she explains the theory.
In short, visually handicapped infants do not begin to move
around on their own until they understand that objects and
people exist even when not in direct contact with the infant’s
experience. Until that time, the infant lives in a fantasy world
under the influence where objects appear and disappear into
avoid. (Harrell, personal communication, May 1983, p.190).
The practical application of this theory is when parents, teachers and family
members move everything next to or close to the infant or child with a visual
impairment so that independent movement is not required. The child develops
the idea that items of importance to him will appear or disappear without any
control by the child. The infant or child does not learn the appropriate motor skills
to promote locomotion and independence because she is not motivated to
36
acquire or move toward objects. Movement becomes foreign to the child and
inactivity is rewarded.
Another component of inactivity in children and adolescents with visual
impairments is the concept of “learned helplessness”. This term is used
frequently in general special education programs and this behavior can
contribute to inactivity and low self-esteem in all children with disabilities. For
example, overprotective behavior used by teachers, parents and families do not
allow students with visual impairments to learn the skills necessary for
independence and self-efficiency. In a study by Lieberman and Robinson (2004),
self-determination, decision-making and physical education were examined with
a group of students with visual impairments who participated in a sports camp.
The questionnaire was designed to measure self-determination and decision
making at home, in class, with friends, in other activities of daily living and in
physical education classes. Results of the study showed that all of the
participants scored low in each of the categories and all of the domains and
those students with visual impairments were given few opportunities to make
decisions for themselves about their own activities. The sample size included 54
campers, ages 11 to 18 attending a residential sports camp for a week. One of
the major concerns about this study is where and how the survey was completed.
Experiences away from their home environment may have created biases
concerning answers about self-determination and decision-making. The time of
day that the survey was completed can also bias the result of the data. However,
37
information concerning the personal attributes of the campers and the time and
day the survey was completed are not included in the study. Even though
difficulties exist with the methods of the study, low outcomes for self-determined
behavior are not surprising. Overall, children and adolescents with visual
impairments struggle with self-determination and decision making behaviors
(Ponchillia, 2002).
Low self-esteem and low self-concept are other factors that were
investigated in studies on lack of physical activity and visual impairment. Harter
(1990), states that a high level of physical competence seems to reinforce
positive self-confidence and contributes to more positive self-worth. In the
competence motivation theory by Harter (1990), the hypothesis is that positive
experiences of behavior lead to the development of positive self-concepts, which,
in turn, lead to feelings of contentment, with a subsequent positive effect on
global self-worth. Harter (1990) concludes that physical competence is essential
to enable children and adolescents with visual impairments to create a
foundation for later satisfaction as adults.
Another factor that could lead to inactivity for students with visual
impairments is parental expectations. In a study conducted by Stuart, Lieberman
and Hand (2006), parent beliefs concerning the need for physical activity were
examined. The premise is that parent expectations and the value placed on
children’s choices of activities influence the children’s belief about the value of
participating and the goals that they develop for those activities. For example,

38
Anderssen and Wold (1992) reported that parental and peer physical activity
levels and parental and peer support for physical activity influence the reported
levels of physical activity of adolescents in general. Therefore, parents who
expect that their children can be successful in a given physical activity and who
value success in that domain are more likely to encourage their children to
engage in physical activity (Stuart, Lieberman and Hand, 2006). However, in the
study on parent beliefs of activity for their children with visual impairment, a
survey given to participants at a sports camp and their parents indicated that as
vision loss increased, parents’ expectations for their child to be physically active
decreased. In addition, the campers with visual impairments also indicated that
they were not prepared to participate in general physical education classes and
that they activities were not appropriate and no one showed them how to do the
activities. Other studies also note that parents of children with visual
impairments lack an understanding of their children’s ability to be physically
active and often engage in overprotective behaviors in an attempt to assist them
(Lieberman and Lepore, 1998; Longmire, 1998; Nixon, 1988).
Overall, the studies on visual impairment focus on the lack of physical
activity and limited access to physical education programs rather than the
nutritional needs of students with visual impairments. Articles focusing on the
variables of obesity and lack of physical activity in children and adolescents with
visual impairments are very scarce. Sedentary behavior and consequences for
obesity have been indirectly linked in several studies; however, the direct

39
relationship between obesity, lack of physical activity and visual impairment has
not been researched.
Strategies for Change
Obesity and lack of physical activity
According to the CDC (2007), the obesity epidemic is not going to subside
without a cultural shift in how the country approaches the issue and suggests that
the focus of obesity prevention has been about appearance. In the report written
by the Healthy Americans Organization (2007), the cultural emphasis must be
changed away from “dieting” and appearance and more towards healthy eating
and physical activity. There needs to be a focus on lifestyle changes, even small
ones to improve a person’s health. For example, even a little physical activity
can have a big impact on improving a person’s health (CDC, 2007)
Several health initiatives to address the obesity epidemic in this country
were developed by the National Center for Chronic Disease Prevention and
Health Promotion through the CDC (2007). Programs to target physical activity,
poor nutrition and obesity were funded in 20 states in 2003 and in 8 additional
states in the spring of 2004. Programs were started in 15 states in 2005 and
another 10 were added in 2006. The purpose of the programs are to conduct and
evaluate nutrition and physical activity interventions, train health care providers
and public health professionals and provide grants to communities for local
obesity prevention initiatives. The intention is to strengthen obesity prevention

40
programs in community settings such as preschools, childcare centers, work
sites, and health care settings.
Recommendations provided in the study by the Healthy Americans
Organization (2007) for combating the obesity epidemic include creating
initiatives in the following areas; (1) improving federal leadership through a
national strategy, (2) fighting obesity in the workplace, (3) helping people become
more physically active, (4) helping individuals choose healthier foods and (5)
accelerating and escalating the research into ways to promote lifestyle changes.
Research studies that provide support for these initiatives present many
challenges. Further recommendations included (1) how obesity relates to
people’s health and life expectancy, (2) can people be fit and fat or is weight loss
necessary for good health, (3) what are the relationships between socioeconomic
and cultural issue and obesity, (4) what are the costs of obesity and the benefits
of possible policy actions and (5) who is responsible for obesity reduction.
Inactivity and visual impairment
The literature provided in this chapter has shown that physical activity and
fitness are essential elements for children and adolescents who are visually
impaired. The barriers to including students in general physical education
classes are numerous. There is not much research conducted on weight
problems of children with visual impairments and its affect on physical activity.
However, given the understanding from studies concerning the potential for the

41
same level of fitness as their sighted peers, problems with weight could be part of
the factors that lead to inactivity for students and adults with visual impairments.
Professionals in the field of visual impairment can use identical programs
suggested for their sighted peers to adapt similar types of intervention strategies
for children and adolescents with visual impairments in the area of weight control
and physical activity. Education strategies and in-service programs must be
designed and provided for regular education teachers including physical
education teachers, administrators, parents, children and adolescents to address
the issues of a lack of access to physical activities and poor nutrition.
The barriers for students accessing the general physical education
classes noted in several studies center around the specificity of instruction with a
visually impaired student. There are 12 major barriers found to be present for
including students with visual impairments in general physical education
(Lieberman, Houston-Wilson and Kozub, 2002; Stuart, Lieberman and Hand,
2006; Wiskochil, Lieberman, Houston-Wilson and Peterson, 2007; Lieberman,
Robinson and Rollheiser, 2006; O’Connell, Lieberman and Peterson, 2006;
Rose, McDonnell and Ellis, 2007). All of these issues were found to play an equal
role in general education settings and affected the level of participation for
students with visual impairments. These barriers included (1) a lack of
professional preparation, (2) lack of equipment, (3) programming and curriculum,
(4) time in teacher’s schedules, (5) communication, (6) qualified
teachers/instructional aides, (7) pace of units, (8) teacher over protectiveness, (9)

42
limited expectations, (10) medical excuses, (11) parental over protectiveness and
(12) apathy of teachers.
Solving the problems created by including students with visual
impairments in general physical education has also been researched in several
studies and involves education of all personnel involved with the student. One of
the main ingredients of a successful physical education program is teacher
preparation (Rose, McDonnell and Ellis, 2007). This includes an appropriate
personnel preparation curriculum that provides the necessary information to
general education teachers in the instruction for visually impaired students.
However, instructional strategies specific to the needs of a student with visual
impairments are outlined in several studies. These include the use of trained
sighted peer tutors for students with visual impairments during class time. The
need for one on one instruction is necessary to understand the skills needed to
successfully participate and has shown to be a positive influence on their sighted
peers (Wischochil, Lieberman, Houston-Wilson and Peterson, 2007). Physical
education teachers must understand the specific needs of visually impaired
students oriented in a particular learning style that will creates successful
understanding. The use of tactile modeling, physical guidance, physical
demonstration with verbal prompts and one on one instruction can be effective
methods of improving motor skills and physical activities of students with visual
impairments (O’Connell, Lieberman, and Peterson, 2006).

43
In addition, general physical education teachers must provide a curriculum
that increases participation in sport and recreational activities that includes a mix
of open (volleyball, football and soccer) and closed (bowling, bocce and
horseshoes) sports and lifetime activities such as tandem biking, running, goal
ball, swimming, wrestling and judo (Lieberman, Robinson and Rollheiser, 2006).
Conclusion
More than 60% of the adult population is overweight, and obesity has
reached epidemic proportions in this country. Childhood obesity has more than
doubled since 1990, and the health consequences are reflected in the rising cost
of health care. Because of these concerns, the Center for Disease Control has
developed programs to address the epidemic in each state and the subject of
childhood obesity is now a national priority. Results from numerous studies have
shown that once a child reaches high levels of weight gain and obesity, weight
control complexities are transferred into adulthood with a greater potential for
health problems, chronic diseases and premature death.
For children and adolescents, sedentary behavior has been identified as a
primary factor that contributes to being overweight or obese. In addition, poor
nutrition habits have been acknowledged to lead to weight control problems in
adulthood. Intervention programs have been designed to address the needs of
children and adults through the CDC and community resources. The strategies
include intervention programs to encourage healthy exercise and nutrition
behaviors to promote weight loss.

44
The connection between being overweight and a lack of physical activity in
children who are blind or visually impaired can also be linked to barriers
associated with access. The inaccessibility of many physical activity programs is
a major hurdle for children who have visual impairments both in physical
education programs and recreation activities in the community. Strategies that
allow for greater access to physical education programs should include
continuing education seminars for regular physical education teachers and
training for special education teachers. In addition it will be important to develop
intervention strategies that enable students to have access to their local
community activities. Addressing the concerns of physical activity, nutrition and
successful independence for children and adolescents with visual impairments
must become a national priority.
Nutrition is a difficult subject to approach with students who are visually
impaired as there are so many variables that include the home and school
environment. Eating habits and “good nutrition” may not be an area where much
change can occur for children and adolescents with visual impairments, as
teachers in public school settings cannot observe much of what their students
consume. However, increasing physical activity and creating accessible
programs for students with visual impairments could be an area that would lend
itself to more success as there are more levees of control and can be visibly
observed.

45
The importance of physical activity for students with visual impairments
has been validated in the literature presented in this chapter in the area of
physical fitness, self-esteem and the creation of effective orientation and mobility
skills for an independent and successful adulthood. Whether or not students with
visual impairments are able to take advantage of physical activity opportunities is
complex. This study was created from the desire to understand whether students
with visual impairments are participating in physical education and recreation
activities in the community, and whether they are accessing these activities with
their sighted and visually impaired peers. The information was gathered from the
perspective of itinerant teachers of students with visual impairments who work
with visually impaired students in public schools. It contributes to an
understanding of the barriers associated with the lack of participation from the
teacher’s viewpoint, and it reports possible intervention strategies that can be
used by teachers who work with visually impaired students.
46
CHAPTER 3
METHODOLOGY
To answer the research questions, the investigator gathered and analyzed
information about the perceptions of teachers of students with visual impairments
regarding physical activity and overweight factors of their blind and visually
impaired students and the effects on academic performance and social
interaction. A survey was conducted through the Internet to obtain information
from teachers of students with visual impairments concerning the topics of
obesity and lack of physical activity among their students.
Blindness and visual impairment are low incidence disabilities, and
professionals in the field are widely dispersed throughout the country. Clusters
of teachers of students with visual impairments are not usually found in one area,
and sampling can be very difficult. Often there is only one teacher of students
with visual impairments in a school district, and in rural areas teachers of
students with visual impairments can serve several counties or districts. Recent
technological advances have allowed educators access to professionals
throughout the country through the use of Internet and email. In a previous study,
teachers of students with visual impairments used the Internet to answer
questions that were used for data collection in an article on the challenges faced
by itinerant teachers in meeting the specific needs of their students (Wolffe,
1997). In addition, professionals in the field of blindness and visual impairment

47
are currently using list-serve opportunities to access information provided by
other instructors and administrators all over the country. Given this ability to
easily communicate across state lines, the current national study was conducted
through several internet listservs utilized by professionals in the field in addition
to members of the Association for Education and Rehabilitation of the Blind and
Visually Impaired, to determine what teachers of students with visual
impairments perceive is their role in educating their students about health and
nutrition and their perceptions of whether or not it impacts social interactions and
academic success.
According to Fowler (2002), the key criteria for successful measurement
with a survey are that (1) probability sampling will ensure that the sample is not a
biased one and that the data are precise, (2) standardized measurement is
consistent across all of the respondents, ensuring comparable information is
obtained, and (3) a survey is the only way to obtain available related data.
Fowler (2002) lists the potential advantages and disadvantages of using
an internet survey: Potential advantages of Internet surveys include:
-Low unit cost of data collection
-Potential high speed of returns
-All the advantages of a self-administered instrument
-All the advantages of a computer-assisted instrument
-Like mail surveys, provides time for thoughtful answers, checking
records, or consulting with others
48
Potential disadvantages of Internet surveys
-Limited to samples of Internet users
-Need for good addresses
-Challenges of enlisting cooperation (depending on sampled groups and
topic)
-Various disadvantages of not having interviewer involved in data
collection
An Internet survey was used because this method provided better access
to respondents than sending out a survey by mail. Post office addresses for
teachers of students with visual impairments often change because of the
inherent “mobility” of the profession. In addition, because of the low incidence of
visual impairment, professionals in the field are spread out all over the country
and there is not a large concentration of teachers of students with visual
impairments in most locations. Internet listservs are the best way to get an
adequate number of completed surveys completed to provide enough data about
the subject. For this study, national listserv contacts through the Association for
Education and Rehabilitation of the Blind and Visually Impaired membership and
the early intervention listserv was utilized to identify individuals appropriate for
the survey. The University of Arizona IRB approved the study in July 2007 (see
approval letter in Appendix D).

49
The Survey
The survey was designed to gather data from teachers of students with
visual impairments about their perceptions concerning their role with their
students within the realm of curriculum instruction. Questions about intervention
strategies, demographics and service delivery were a part of the questionnaire;
information was collected with short answer and Likert scale items to determine
respondent perceptions in the area of nutrition and physical activity.
The survey was comprised of 20 questions and organized into 3
categories. A likert scale of 5 areas of agreement was designed for 9 of the
questions examining beliefs about their students’ nutritional habits, physical
activity, and their ability to access physical education and recreation programs in
their communities. The questions were also designed to measure the beliefs of
teachers of students with visual impairments regarding the relationship between
overweight and lack of participation in physical activity with social and academic
performance with of students. The second category of questions category was
designed to measure percentages of time spent in student activity and service
delivery. The third category of questions was designed to obtain information
concerning the roles and intervention strategies that teachers have found
successful with their students. The questions were voluntary and not all
questions had to be answered to complete the survey.
A preliminary study was conducted with a group of 13 teachers of students
with visual impairments in the Cobb County School District in Marietta, Georgia
50
to complete the survey utilizing their email system to identify any potential
problems before sending it to teachers of students with visual impairments
across the country. As a result, the email request sent to potential respondents
was clarified; and a number of questions were either changed or omitted to
strengthen the survey.
The revised survey was sent out through the Internet list serve established
for Early Intervention Specialists around the country. In addition, email requests
with a link to the survey were sent to chapter presidents through the Association
for Education and Rehabilitation of the Blind and Visually Impaired to be
forwarded to their members. Printed copies of the surveys were either available
by request and given out at conferences in Arizona and Georgia; 175 teachers
completed the survey.
Procedures for data collection
Data were gathered through the internet program “SurveyMonkey.com”.
This program provided the framework for designing the survey, provided an
anonymous base for collection of surveys and a tool in interpreting the data.
Quantitative and qualitative analysis was applied to interpret commonalities and
differences. Frequency and measures of central tendency were calculated for the
Likert items. The demographic data were tabled by the frequency of response.
The short answer portion of the survey was analyzed using qualitative
procedures. The survey was designed to collect data based on the 9 research
questions presented in Chapter one. (See Appendix E – Data Analysis table)

51
To answer the research questions, data were entered into SPSS software
(2007). Frequencies in demographic information about teachers of students with
visual impairments and their students were examined for relationships with the
ratings of importance of physical activity and obesity. Demographic information
was calculated by frequency and percentage to describe community (urban,
suburban, rural), school district size, numbers of visually impaired students
served, student ages, years in the profession as a teacher of students with visual
impairments, and the number of other teachers of students with visual
impairment colleagues in their district.
Two open-ended questions were included in the survey concerning
intervention strategies for losing weight and increasing physical activity for
students with visual impairments. A third open ended question asked for further
comments concerning specific intervention strategies and other suggestions for
the topic. These comments were used to collect information on teacher practices
and resources for physical activity and issues of obesity with their students. To
analyze the data related to successful intervention strategies, a content analysis
was conducted to categorize the responses according to units of meaning and
themes were formed from the similarities of these units. Each response had the
potential of being coded in multiple units of meaning. After all of the responses
were coded, themes were developed to group the units of meanings. To
strengthen the validity and reliability of the thematic categories, a colleague with
a physical education and education in visual impairment background was

52
recruited to independently code the units of meaning and themes for the open-
ended questions. The agreement percentage between the researcher and
colleague was calculated by dividing the numbers of units of meaning and
themes that were identified from the colleague; by the original numbers of units
and themes developed by the researcher for each question. If the agreement
score was less than 85%, negotiations between researcher and colleague
concerning the units of meaning and the themes would be conducted. Adding an
additional theme would be discussed, or the theme was clarified to obtain
agreement.

53
CHAPTER 4
RESULTS
This chapter summarizes the information from 175 completed online
surveys collected through the internet tool “Survey Monkey” targeting teachers of
students with visual impairments in Itinerant public school programs. Surveys
were disseminated through the Early Intervention listserv, provided through the
University of Arizona’s Special Education Department, and the professional
listserv provided through the Association for Education and Rehabilitation of the
Blind and Visually Impaired (AER). Email requests with a forwarded link to the
survey were also sent to AER chapter presidents, and the chapter president of
Division 16 of AER. Paper copies of the survey were also distributed at two
professional conferences, the state AER conference in Georgia and the state
AER conference in Arizona.
The responses were collected for a period of 12 weeks in the fall of 2007.
A sample of teachers voluntarily responded to emails either through the listserv,
forwarded email, or person-to-person contacts inviting them to complete the
survey. The respondents could stop the process at any point, or only answer the
questions that pertained to them. Of the 175 who began the process, 131 (75%)
respondents from 19 states completed the entire survey and 44 partially
completed the survey. Demographic information was collected to determine
community (urban, suburban, rural); school district size; numbers of visually
impaired students served; student ages; years in the profession as a teacher of
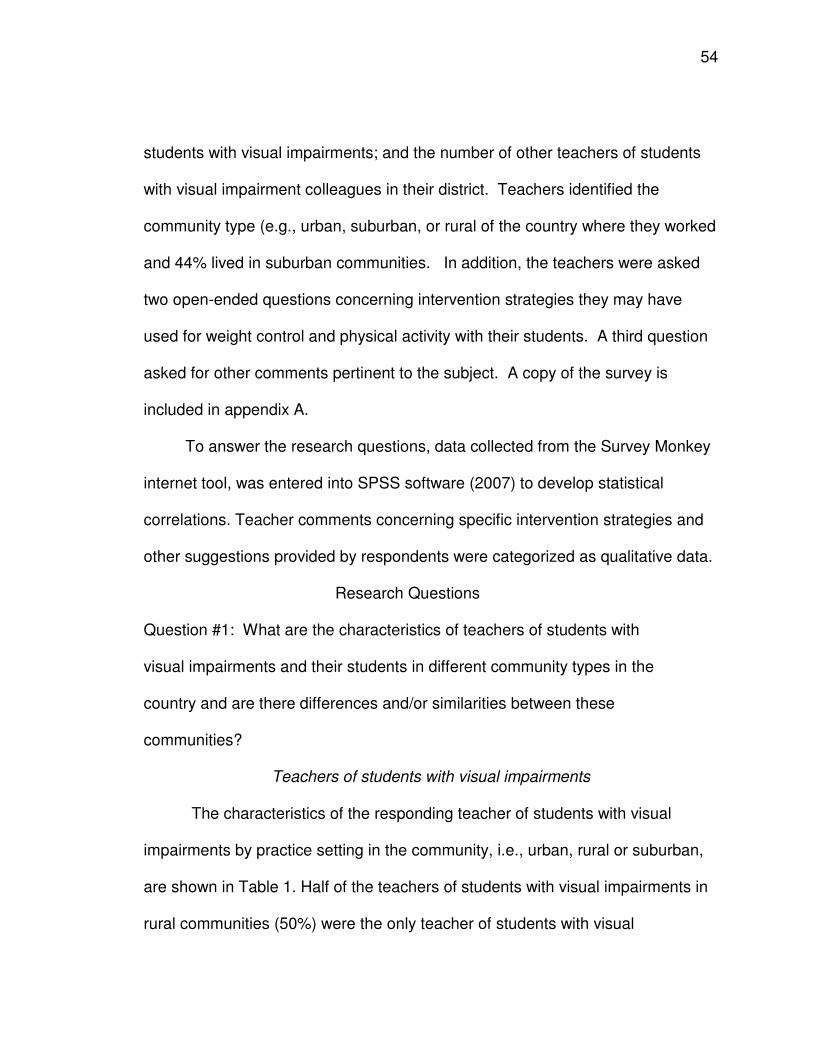
54
students with visual impairments; and the number of other teachers of students
with visual impairment colleagues in their district. Teachers identified the
community type (e.g., urban, suburban, or rural of the country where they worked
and 44% lived in suburban communities. In addition, the teachers were asked
two open-ended questions concerning intervention strategies they may have
used for weight control and physical activity with their students. A third question
asked for other comments pertinent to the subject. A copy of the survey is
included in appendix A.
To answer the research questions, data collected from the Survey Monkey
internet tool, was entered into SPSS software (2007) to develop statistical
correlations. Teacher comments concerning specific intervention strategies and
other suggestions provided by respondents were categorized as qualitative data.
Research Questions
Question #1: What are the characteristics of teachers of students with visual impairments and their students in different community types in the country and are there differences and/or similarities between these communities?
Teachers of students with visual impairments
The characteristics of the responding teacher of students with visual
impairments by practice setting in the community, i.e., urban, rural or suburban,
are shown in Table 1. Half of the teachers of students with visual impairments in
rural communities (50%) were the only teacher of students with visual

55
impairments in their district as compared to 10% of urban teachers of students
with visual impairments and 16% of suburban teachers of students with visual
impairments. Overall, 29% of the 128 who responded to the question, worked in
the urban communities, 44% worked in suburban communities and 27% in rural
communities.
Responses concerning duration of experience in the field were broken
down into 5 areas beginning with 5 years or less and ending with over 20 years.
Information from Table 1 concerning experience for teachers shows that over
30% of teachers reporting in the urban community have been working for over 20
years, in comparison with the suburban communities, where 18% of teachers
have been working for over 20 years. There was a more equal distribution of
25% in the first 3 categories of 0-5, 6-10 and 11-15 years in the field in the
suburban communities. Almost 35% of teachers of students with visual
impairments in the rural communities have been teaching 5 years or less.
Total student population and the population of visually impaired students
per district were categorized according to responses from teachers in specific
community types where they worked. Teachers in urban (50%) and suburban
(45%) communities served overall student populations of 10,000 or more while
67% of rural teachers served fewer than 5,000 students. More than 50% of the
teachers of visually impaired students served at least 26 students with visual
impairments in both the urban and suburban communities, and 80% of rural
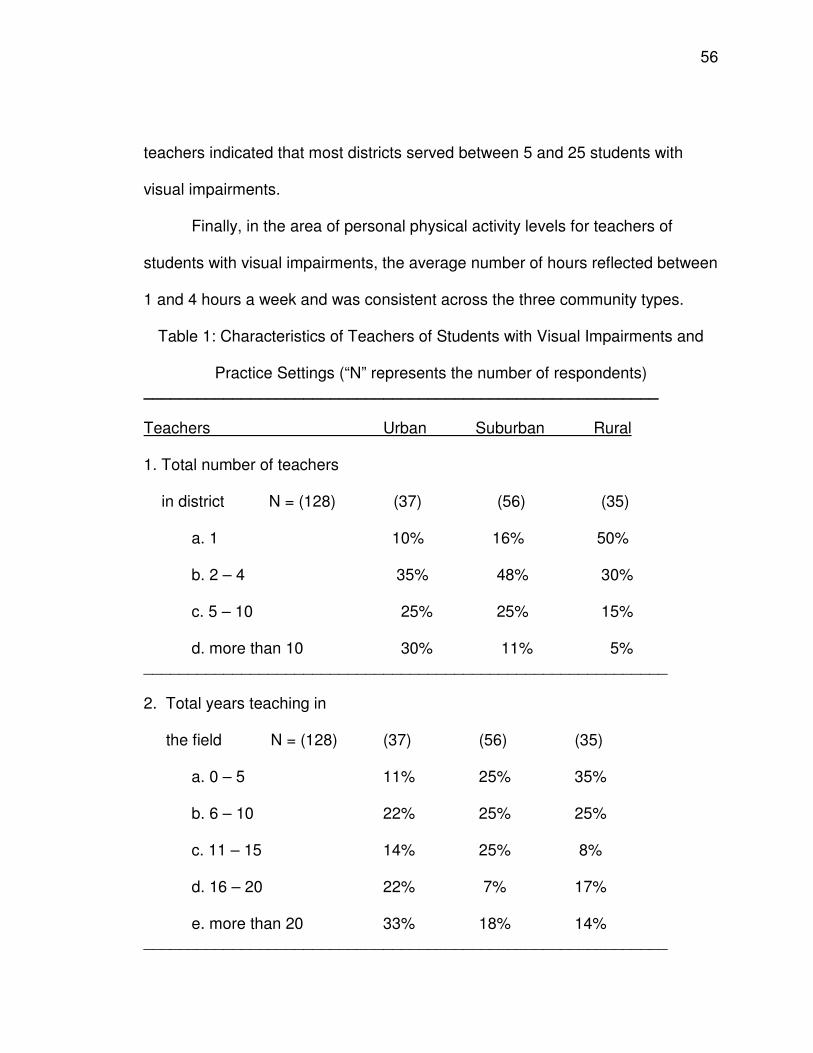
56
teachers indicated that most districts served between 5 and 25 students with
visual impairments.
Finally, in the area of personal physical activity levels for teachers of
students with visual impairments, the average number of hours reflected between
1 and 4 hours a week and was consistent across the three community types.
Table 1: Characteristics of Teachers of Students with Visual Impairments and
Practice Settings (“N” represents the number of respondents) __________________________________________________________ Teachers Urban Suburban Rural 1. Total number of teachers in district N = (128) (37) (56) (35)
a. 1 10% 16% 50% b. 2 – 4 35% 48% 30% c. 5 – 10 25% 25% 15% d. more than 10 30% 11% 5%
___________________________________________________________ 2. Total years teaching in the field N = (128) (37) (56) (35)
a. 0 – 5 11% 25% 35%
b. 6 – 10 22% 25% 25% c. 11 – 15 14% 25% 8% d. 16 – 20 22% 7% 17%
e. more than 20 33% 18% 14%
___________________________________________________________

57
_____________________________________________________________
3. Number of visually
impaired students served N = (120) (36) (51) (33)
a. 0-5 3% 4% 16%
b. 6-10 8% 7% 26% c. 11-25 12% 24% 38% d. 26-50 22% 33% 12% e. > 50 55% 30% 8%
___________________________________________________________ 4. Approximate number of total student pop. N = (125) (36) (55) (34)
a. < l000 8% 5% 27% b. 1000 – 5000 22% 30% 40% c. 5000 – 10,000 19% 22% 21% d. > 10,000 50% 45% 12%
______________________________________________________________ 5. Personal Activity levels of teachers N = (126) (37) (55) (34)
a. < an hour 3% 10% 20% b. 1 – 2 hours 27% 25% 25%

58
c. 2 – 3 hours 24% 25% 20% d. 3 – 4 hours 27% 10% 15% e. 4 – 6 hour 10% 18% 10% f. > 6 hours 9% 12% 10%
Students with Visual Impairments
The characteristics of students participating in programs for the visually
impaired in public schools by practice setting and community, (urban, suburban
and rural) are shown in Table 2. The information collected from the survey
concerning student demographics was reported by teachers of students with
visual impairments from their specific caseloads. In each community, teachers of
students with visual impairments reported that half of their students (50%) were
female and half were male (50%). All teachers reported that over 90% of their
students were less than 20 lbs overweight, and also that over 80% participated in
physical education in their school; however, fewer than 15% participated in
activities outside of school settings. Ages of students with visual impairments
were equally distributed throughout the four age ranges and the three areas
listed in the table.

59
Table 2: Characteristics of Students in Educational Programs for Students with
Visual Impairments
____________________________________________________
Students Urban Suburban Rural 1. Gender of students N = (220) (59) (104) (57) Female 49% 50% 49%
Male 51% 50% 51% _____________________________________________________ 2. Percentage of students who are not at least 20 lbs or more overweight N = (111) (31) (52) (28) <50% to 50% 97% 94% 90% >50% 3% 6% 10% _________________________________________________________ 3. Age of student N = (358) (97) (164) (97)
a. 0 – 5 yrs 25% 25% 25% b. 6 – 10 yrs 25% 25% 25% c. 11 – 14 yrs 25% 25% 25% d. 15 – 19 yrs 25% 25% 25%
_________________________________________________________

60
_____________________________________________________ 4. Participate in Physical Education N = (126) (36) (56) (34) <50% to 50% 16% 15% 17%
>50% 84% 85% 83% _____________________________________________________________ 5. Participate in activities outside of school N = (126) (36) (56) (34) <50% to 50% 92% 86% 90% >50% 8% 14% 10%
_____________________________________________________________
Ethnicity of visually impaired students in each area is shown in Table 3.
There were16-19% Hispanic student across all three communities. Suburban
communities were least likely to have Native American students, but most likely
to have Asian American students. Rural communities were least likely to have
Asian American, Native American or African American students and more likely
to be primarily Caucasian. Finally, urban communities were most likely to have
African American and Multi-Racial students; however, all ethnic groups were well
represented in urban areas.

61
Table 3: Percentage of Ethnicity Community
____________________________________________________________
Ethnicity: Urban Suburban Rural p-value Asian American 5.5% 8.3% 4.3% 0.170
Native American 2.5% 1.5% 4.4% 0.048 African American 24.0% 17.1% 8.9% 0.019 Caucasian 47.0% 53.0% 65.2% 0.050 Multi-racial 15.3% 8.1% 7.0% 0.288 Hispanic 16.0% 19.4% 19.4% 0.822 ___________________________________________________________ Note: Percentages exceed 100% because respondents estimated higher Question #2: What are the perceptions of teachers of students with visual impairments about the importance of physical activity for their students?
This information was collected from the frequency of responses provided through the Survey Monkey software. The Likert Rating scale was used by teachers to indicate a level of importance, with 1 representing “not at all” and 5 equaling “a great deal”. A Chi Square analysis was applied to determine
whether responses were unequally distributed. For this question, most
respondents (60.9%) selected the highest rating of 5 and the second largest
group (32.2%) selected a rating of 4, (See Table 4). Teachers were also given
opportunities to provide comments to the likert questions. The request for

62
comments was strictly voluntary and not required to move on to the next
question. One teacher’s comment exemplifies the intent of the question with the
statement “most children with vision loss are faced with additional stress in their
lives. It is critical that they are in good cardiovascular condition and that their
body metabolism is such that they deal with this. Too many of our children in
special education are left out of the fitness loop when that is really what they
need.”
Table 4: Importance of Physical Activity for Students with Visual Impairments
Percentages
Respondents
(1)
Not at all
1.1%
N = 2
(2)
2.9%
N = 5
(3)
2.9%
N = 5
(4)
32.2%
N = 56
(5)
Great deal
60.9%
N = 106
total
100%
174
Expected Number of Respondents
34.8 34.8 34.8 34.8 34.8 P = <.001
Question #3: Are there differences between visually impaired students’ participation in recreation activities in community settings with their visually impaired and sighted peers? Are there differences within community types?
Overall, the questions concerning participation for visually impaired students in recreation activities in community settings with their sighted or visually impaired peers reflected a slight difference in participation levels. Only 8.2% participated with sighted peers and 3% participated with visually impaired peers in the general community. The differences between

63
visually impaired students participating with sighted peers and visually impaired peers in urban, rural, and suburban areas was analyzed through two, one-way ANOVA analyses, which is shown in table 5. A significant difference was found between two of the groups. Visually impaired students in rural area were significantly less likely to participate with
sighted peers and more likely to participate with their visually impaired peers.
There were no significant differences in participation with sighted or visually
impaired peers between urban and suburban communities.
Table 5: Differences between Participation with Sighted and Visually
Impaired Peers by Community
________________________________________________________________ Variables Urban Suburban Rural p-value___ Recreation w/ sighted peers 3.6 (1.12) 3.4 (0.9) 3.0 (1.24)a* 0.043 Mean (SD) Recreation w/ VI peers 3.5 (1.23) 3.6 (1.12) 4.1 (0.90)b** 0.026 Mean (SD) a* p = 0.050 for comparison w/ urban
b** p = 0.034 for comparison w/ urban
________________________________________________________________
Note: Scores represent Likert Scale Ratings where 5 = a great deal and 1 = not at all
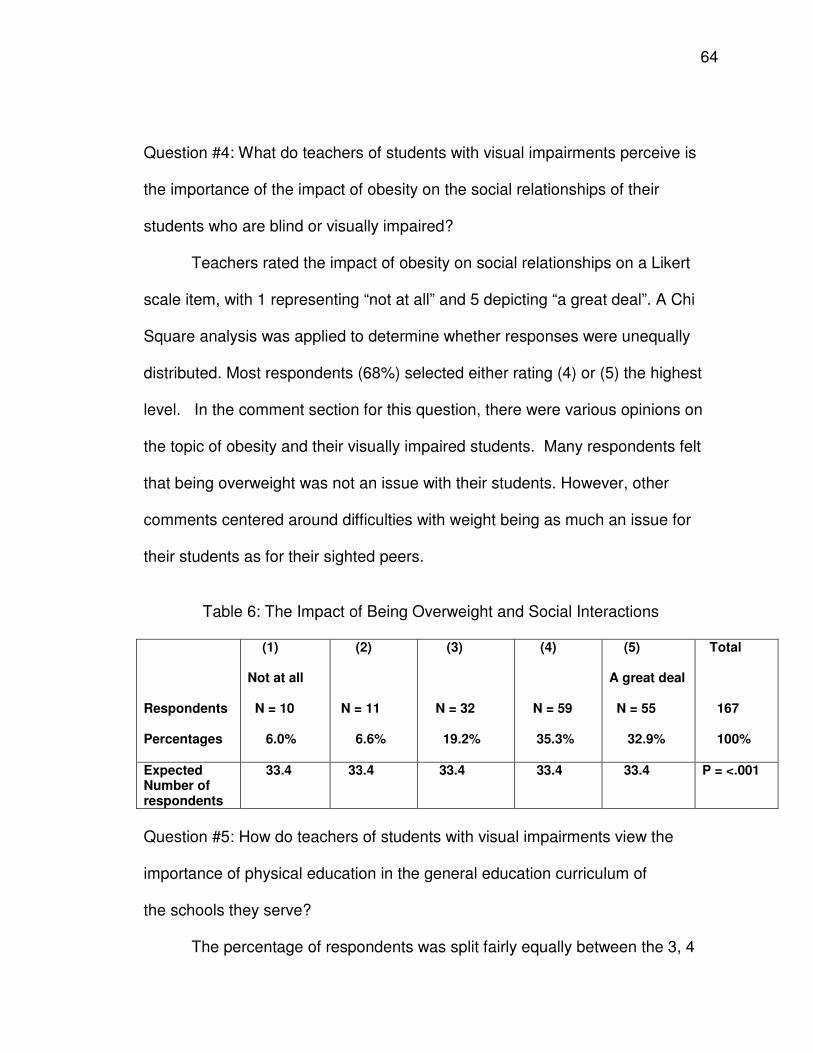
64
Question #4: What do teachers of students with visual impairments perceive is
the importance of the impact of obesity on the social relationships of their
students who are blind or visually impaired?
Teachers rated the impact of obesity on social relationships on a Likert scale item, with 1 representing “not at all” and 5 depicting “a great deal”. A Chi
Square analysis was applied to determine whether responses were unequally
distributed. Most respondents (68%) selected either rating (4) or (5) the highest
level. In the comment section for this question, there were various opinions on
the topic of obesity and their visually impaired students. Many respondents felt
that being overweight was not an issue with their students. However, other
comments centered around difficulties with weight being as much an issue for
their students as for their sighted peers.
Table 6: The Impact of Being Overweight and Social Interactions
Respondents
Percentages
(1)
Not at all
N = 10
6.0%
(2)
N = 11
6.6%
(3)
N = 32
19.2%
(4)
N = 59
35.3%
(5)
A great deal
N = 55
32.9%
Total
167
100%
Expected Number of respondents
33.4 33.4 33.4 33.4 33.4 P = <.001
Question #5: How do teachers of students with visual impairments view the importance of physical education in the general education curriculum of the schools they serve?
The percentage of respondents was split fairly equally between the 3, 4

65
and 5 rating on the Likert scale, with the highest percentage of respondents
(37.8) selecting 4. A Chi Square analysis was applied to determine whether
responses were unequally distributed. Nineteen teachers also added comments
to this question and more information is given concerning participation levels.
Several teachers commented that “it (Physical Education) is very important,
unfortunately, it is the first class that they (visually impaired students) are pulled
from.”
Table 7: Importance of Physical Education in the General Curriculum
Percentages
Respondents
(1)
Not at all
3.5%
N = 6
(2)
7.6%
N = 13
(3)
23.8%
N = 41
(4)
37.8%
N = 65
(5)
A great deal
27.3%
N = 47
Total
100%
172
Expected Number of Respondents
34.4 34.4 34.4 34.4 34.4 P = < .001
Question #6: Do teachers of students with visual impairments perceive that there are relationships between physical activity and academic success of their students?
Almost half (45.3%) of the respondents selected number 4, and 17.4%
indicated the highest rating (5); 63% perceived some relationship between physical ability and academic success, indicating moderate support for a relationship. A Chi Square analysis was applied to determine whether responses
were unequally distributed. Fifteen teachers offered comments and the

66
consensus centered around a common theme. For example, one teacher stated:
“The ability to attend comes with a clear mind and that is also a reflection of an
individual’s emotional and physical well being. Fitness and physical activity plays a vital role in this”.
Table 8: The importance of Physical Activity and Academic Success
Percentages
Respondents
(1)
Not at all
2.9%
N = 5
(2)
12.2%
N = 21
(3)
22.1%
N = 38
(4)
45.3%
N = 78
(5)
Great deal
17.4%
N = 30
Total
100%
172
Expected Number of Respondents
34.4 34.4 34.4 34.4 34.4 P = <.001
Question # 7: According to teachers of students with visual impairments, what percentage of their students participate in physical activities in school and outside of the school environment?
The information reported by teachers of students with visual impairments
indicated that 79% of their students participated in physical education in school and only 25% participated in physical activities in community settings. There were no questions concerning specific participation levels in physical education classes; however more information became evident in the teacher comments provided in the open ended questions as described
later in chapter four.

67
Question #8: Are there relationships between teachers of students with visual impairments personal physical activity and their perceptions of:
- the importance of their student’s physical activity
- the influence of their student’s physical activity on social
interactions
- the influence of their student’s weight in social experiences - the importance of physical education in the general curriculum
- the influence of physical activity on academic success
The correlation co-efficient between teachers’ personal activity and their perceptions of the importance of physical activity, academic success, obesity, interactions with sighted peers and the importance of physical education in the general curriculum are shown in Table 9. None of the correlations were significant (p>0.2), indicating that personal participation in physical activity was not related to their perceptions of importance of physical activity for their visually impaired students or their perceptions of their students’
academic success and social interactions.
Table 9: Correlations between Teacher’s Personal Activity Levels
and Variables _________________________________________________________ Variables_________ _Pearson Correlation__ __p-value_ Importance of physical 0.030 0.736 Activity for their students Academic success of their -0.030 0.741 success of their students

68
Being overweight and 0.005 0.956 social interaction Physical activity affecting -0.018 0.846 interaction with sighted peers Importance of PE curriculum 0.098 0.269 in schools __________________________________________________________ Note: Note: Scores represent Likert Scale Ratings where 5 = a great deal and 1 = not at all Question #9: What intervention strategies do teachers of students with visual impairments believe are successful with their students in reducing obesity and increasing physical activity?
To analyze the data on teacher practices and resources for physical activity and issues of obesity with their students, two open-ended questions were included in the survey, along with a third open ended question that asked for further comments concerning the topic. The questions were voluntary and did not have to be answered to complete the survey, producing a varied number of responses for each open-ended question. To analyze the data related to successful intervention strategies, a
content analysis was conducted to categorize the responses into major themes.
The researcher calculated the number of responses into units of meaning and
the similarity between units were grouped into themes. Each response had the
potential of being coded in multiple units of meanings creating a large amount of
units and themes for each question. To strengthen the validity and reliability of
the thematic categories, a colleague with a physical education and education in

69
visual impairment background was recruited to independently code the units and
themes for each question. The agreement score between the researcher and
colleague and noted in the table was calculated by dividing the number of units of
meaning and themes identified by the researcher and the number identified by
the colleague. Between 88 and 98 percent of agreement of units and themes for
each questions was achieved among researcher and colleague with an overall
average of 94%. The individual breakdowns of agreement percentages are listed
next to each theme. The results are as follows.
Open-ended question #1: What intervention strategies have been successful in helping reduce obesity or weight issues with your students?
One hundred and six people responded to this question, resulting in 193
responses. The responses were broken down to either nutrition or activity
themes, with several subcomponents in each area. Several of the respondents
listed both nutrition and physical exercise as interventions with their students.
The most common intervention was the teacher talking to the students about
either nutrition or physical activity. For example one respondent stated that they
have “discussions and lessons on nutrition and fitness. I have discussions on the
impact of weight (along with other things) on social interactions and perceptions
of other. Encourage involvement of adult blind athletes who discuss importance
of fitness and nutrition.” Of the responses, 19 did not feel that obesity was an
issue with their students, or they did not have students who were obese. Fifteen
responded that they had either not tried an intervention for weight reduction, or

70
didn’t know any interventions that might be successful. The breakdown of
themes is indicated in Table 10, unit number includes responses in each
category.
Table 10: Themes for Strategies Used for Reducing Weight ______________________________________________________________ Nutrition Units % of Agreement Involvement in overall 9 89% Health issues Diet Control 14 95% Realistic discussions with 14 90% student on nutrition and appearance Student taking nutrition classes 9 89% Talking with parents 11 90% about good nutrition Physical Activity Units % of Agreement Participating in Physical 16 94% Education classes Participating in outside 30 90% activities and/or sports Teachers participating with 11 89% student in exercise or walking programs Consulting with PE teacher 8 89% Modifying or adapting 5 90% PE programs *No Interventions done 15 92% **No weight issues 19 93%
TOTAL RESPONSE UNIT 193_________________________

71
Open-ended question #2: What intervention strategies have been successful in increasing physical activity with your students?
One hundred and ten people wrote a response to this item, yielding 153
response. The responses were very similar and indicated that physical education
with adaptations and modifications were necessary for their students to
participate in the class. However over 30% of respondents also indicated that
outside community physical activities was as important as physical education. A
number of responses (20%) indicated that using sighted peers in physical
education programs was an important intervention. There were 10 respondents
who commented on “trying different things but nothing worked” and blaming the
lack of success on other factors such as “no parental involvement” or “not having
the time to spend with students on physical activity”. Another large number of
responses (20%) indicated that there was a “lack of parental involvement with
their children in community or outside recreational activities”. A respondent
commented that “they (I) provide parents with information on programs available
in the community such as the special recreation programs, park district programs
such as the special needs baseball program, and summer camps.” The
breakdown of themes is indicated in Table 11. The unit number includes
respondents in each category.
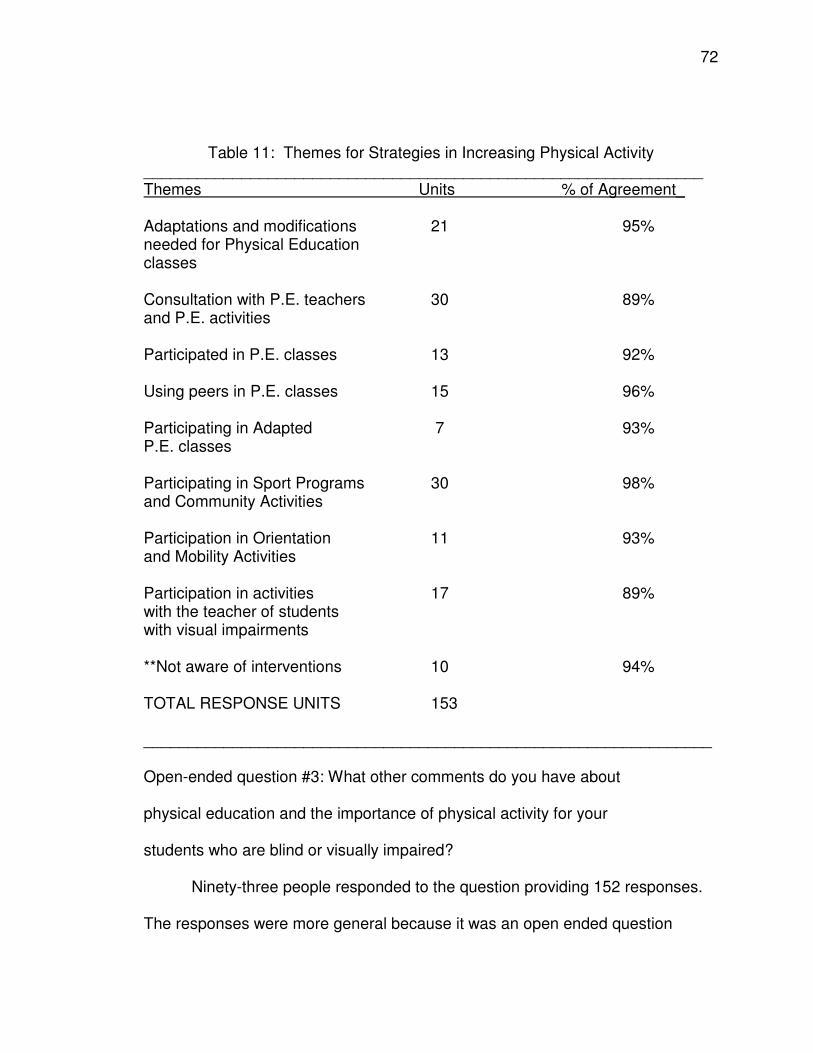
72
Table 11: Themes for Strategies in Increasing Physical Activity _______________________________________________________________ Themes Units % of Agreement_ Adaptations and modifications 21 95% needed for Physical Education classes Consultation with P.E. teachers 30 89% and P.E. activities Participated in P.E. classes 13 92% Using peers in P.E. classes 15 96% Participating in Adapted 7 93% P.E. classes Participating in Sport Programs 30 98% and Community Activities Participation in Orientation 11 93% and Mobility Activities Participation in activities 17 89% with the teacher of students with visual impairments **Not aware of interventions 10 94% TOTAL RESPONSE UNITS 153 ________________________________________________________________ Open-ended question #3: What other comments do you have about physical education and the importance of physical activity for your students who are blind or visually impaired?
Ninety-three people responded to the question providing 152 responses.
The responses were more general because it was an open ended question

73
asking for further comments and opinions about the importance of physical
activity for their students. Five major themes were gleaned from the responses
and centered around (1) more training for Physical Education teachers in the
specific area of visual impairments and activities that could be provided for their students, (2) more parental involvement, both in the early years of their child’s life and including their child in more community activities, (3) the national scope of the problem (4) the importance of physical activity, and, (5) the feeling of their students being excluded from physical education and general sport activities, simply because they were blind. There were very few statements concerning other health concerns, academic demands outweighing the involvement of physical activity and the teacher of students with visual impairments’ responsibility for their student’s physical activity needs. One respondent stated the importance of
physical activity in these words; “I think physical activity is very important for
students who are visually impaired or blind. It gives the student’s confidence
when they are able to complete the physical activity and do it on their own. A lot
of my students are afraid to do physical activities because of their impairment
and have a fear of doing something for the first time. I think that by completing
and doing a physical activity independently, it gives them a chance to feel
successful and hopefully that success and confidence will carry over throughout
their school day in social interactions with peers and in academic work!” The
majority of respondents recognized the need for physical activity and either
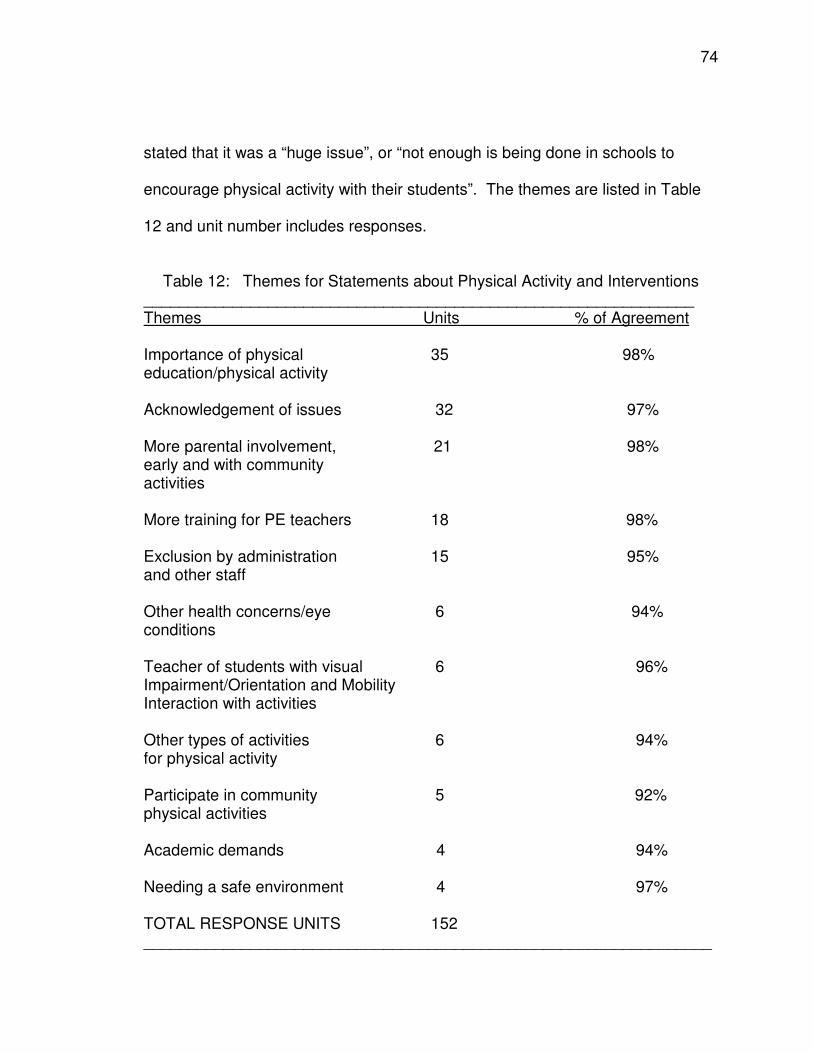
74
stated that it was a “huge issue”, or “not enough is being done in schools to
encourage physical activity with their students”. The themes are listed in Table
12 and unit number includes responses.
Table 12: Themes for Statements about Physical Activity and Interventions
______________________________________________________________ Themes Units % of Agreement Importance of physical 35 98% education/physical activity Acknowledgement of issues 32 97% More parental involvement, 21 98% early and with community activities More training for PE teachers 18 98% Exclusion by administration 15 95% and other staff Other health concerns/eye 6 94% conditions Teacher of students with visual 6 96% Impairment/Orientation and Mobility Interaction with activities Other types of activities 6 94% for physical activity Participate in community 5 92% physical activities Academic demands 4 94% Needing a safe environment 4 97% TOTAL RESPONSE UNITS 152 ________________________________________________________________

75
One comment provided by a teacher in the open-ended question underscored the overall tone of responses provided, “for me, exercise has been the ticket to a healthier, well balanced life. Exercise has had the power to transform how I feel about myself. I know that exercise can do the same thing for our students. Physical challenges can teach a student better than our words can, that they can do more then they think can, that they are strong and capable individuals who can succeed”.

76
CHAPTER 5
DISCUSSION
The previous chapter presented the data collected from online surveys
from teachers of students with visual impairments. The survey consisted of
questions concerning teachers’ perceptions about the importance of physical
activity for their students and its relationship to a variety of characteristics
suggested by existing literature. Questions concerning weight of their students
and whether it had an effect on social relationships were also included.
The information collected from the surveys was analyzed in two ways;
statistical analysis of correlations and frequencies on questions, which were
measured by a Likert scale, and demographic information and comments from
open-ended questions, which were analyzed qualitatively. A total of 175 surveys
were submitted through the online program, Survey Monkey; 131 (75%)
respondents completed the entire survey. This chapter discusses the findings of
the study and is divided into four sections: (1) Relationship of the results to the
literature, (2) limitations of the study, (3) implications for future research and (4)
conclusions.
Comparison with the Literature
This section summarizes the findings of the current study and relates
these findings to the literature. The nine research questions guiding this study
served as the framework for this section.

77
Characteristics of Teachers of Students with Visual Impairment, their Students
with Visual impairments and Community Types
The first research question examined the demographic information
provided by teachers of students with visual impairments about themselves and
the visually impaired students they served. Information was analyzed to
determine community type (urban, suburban, rural); school district size; numbers
of visually impaired students served; student ages; years in the profession as a
teacher of students with visual impairments; and the number of other teachers of
students with visual impairment working in their district and their personal
physical activity levels.
Teachers of Students with Visual Impairments
A rich amount of information was collected by delineating the community
types where teachers worked and comparing these types with other questions on
the survey. There was a significant relationship between the amount of
experience of teachers of students with visual impairments in the field and the
number of other colleagues who worked in their district. Over 50% of the
teachers in rural areas indicated that they were the only teacher of students with
visual impairments and 35% stated that they had less than 5 years of experience.
In comparison, only 10% of urban teachers and 16% of suburban teachers were
the only teachers of students with visual impairments in their district, and over
30% of urban teachers had at least 20 years of experience in the field.

78
According to Correa-Torres and Howell (2004), itinerant teaching is a very
challenging role and new teachers are often not prepared for the rigors of
managing caseloads, dealing with the politics in different schools and paperwork
requirements. When an itinerant teacher of students with visual impairments is
the only professional in the district that serves students with visual impairments,
the teacher can feel frustrated or isolated. The information provided by rural
teachers in the survey attests to the isolation of being the only teacher of
students with visual impairments in their district, along with the limited experience
of teaching less than five years; these are possible indicators of teachers leaving
the field earlier than expected. However, more information should be gathered
from survey questions specific to this topic to collect more evidence concerning
teachers leaving the field.
Students with Visual Impairments
The first research question also analyzed the characteristics of students
with visual impairment in different community types, according to gender, age,
ethnicity, in addition to whether or not the students were 20 pounds overweight
and how often they participated in both physical education classes in their
schools and recreation activities in their communities. Across all three
community types, the characteristics of the students were very similar; including
amount of time students participated in physical education classes and activities
outside of school.

79
Teachers in all community types reported that 90% of their students were
less than 20 pounds overweight. This fact differs from current statistics about
obesity and children in the US. The Center for Disease Control (CDC) (2007),
which reports that over 15% of children age 6 to 17 are obese. In a study
conducted in 2007 by the Healthy Americans organization, some states report
statistics as high as 20% for children age 10 – 17. In addition, Lederman (2004)
reported that students with disabilities are more vulnerable to obesity because of
the lack of opportunities for physical activities, sedentary behavior and lack of
opportunities to learn about the appropriate nutritional choices. Students with
disabilities are reported to be as much as 10% above the national average of
weight of students at the same age without disabilities.
The discrepancy between what the teachers reported and national
statistics could result from several factors. The teachers may not have
understood what the Body Mass Index (BMI) scores say about percentage of
body fat in relation to weight and may be simply using their own subjective views
of how their students look in reporting body weight. This was substantiated by
one of the respondents stating that “I believe you need to define overweight”. In
addition, teachers may have used the students’ sighted peers as examples of
typical weight. Since national statistics indicate that over 30% of adolescents and
teenagers as a whole are either overweight or obese, a comparison with this
group may lead to conclusions that the weights of visually impaired students are
within normal range.

80
Another reason for the discrepancy between national data and this data
may be that a high percentage of children with visual impairments also have
multiple disabilities. In particular, those diagnosed with hypertonic cerebral palsy
are often underweight. These students are also part of an itinerant teacher’s
caseload and could account for a lower percentage of students considered
overweight than in the general student population.
Another factor that could affect the reported percentages of students with
visual impairments considered to be overweight is age of the student. According
to the CDC (2007) and Healthy American’s organization (2007), the adolescent
population with the highest percentages of obesity ranges from 10 – 17. Itinerant
teachers serve all ages of students and young children with visual impairments,
and ages 3 to 9 could comprise the majority of the teacher’s caseload. One
respondent expressed the view that “they (students with visual impairments) are
still in elementary school so doesn't matter much yet”.
Understanding how being overweight or obese can affect physical activity
is important for teachers, students and parents in educating students with visual
impairments and this correlates with Buell’s (1982) conclusion that the need for
fitness in children who have visual impairments might be greater because of the
increased energy required to complete activities of daily living.
Importance of Physical Activity for Students with Visual Impairments
The second research question examined the perceptions of teachers of
students with visual impairments regarding the importance of physical activity for

81
their students. The literature supports the belief that physical activity is important
for all children (CDC, 2007). Studies also indicate that students with visual
impairments have lower levels of fitness and less well-developed motor skills
than their sighted peers (Buell, 1950; Jankowski and Evans, 1981; Lieberman
and McHugh, 2001; Winnick and Short, 1982) In addition, the need for physical
activity is more important for students with visual impairments to benefit their
health and help improve the quality of their lives (Skaggs and Hopper, 1996).
Finally, the goal of students with visual impairments to be safe and independent
travelers can be achieved through physical fitness that promotes successful
movement and facilitate the acquisition of orientation and mobility skills for safe
travel in a variety of environments (Craft, 1986).
Over 90% of teachers of visually impaired students perceived that physical
activity was important for their students. This high response rate towards
promotion of physical activity is supported in the current literature. Comments
from the teachers concerning this issue ranged from “understanding the
importance of physical activity because of the visual impairment”, to “it being the
same level of importance as with their sighted peers”. However, responses
seemed to voice a lot of frustration in not having of control over their students’
physical activity needs and that “it was simply a problem, with no solutions”.

82
Differences in Levels of Participation in Recreation Activities with Visually
Impaired and Sighted Peers
The third research question examined how, when, where and with whom
students with visual impairments participated in activities in their community. The
answers to these questions were supported by the literature, which reports many
barriers faced by students in having accessibility to recreation activities outside of
the school environment. Stuart, Lieberman and Hand (2006) reported that
barriers to physical activity were very complex and involved many sources. In
their study, the lack of parental involvement, low student expectation for the need
for physical activity, the degree of vision loss and poor teacher attitude regarding
involvement of students with visual impairments in activities. Two suggestions
that were offered through the survey was to create parent education programs,
and training programs for teachers enabling both groups to learn about available
opportunities for students with visual impairments to engage in sports and
physical activity.
Teachers in the survey reported that there were very small percentages
of students that participated in activities in the community either with sighted or
visually impaired peers. However, in rural areas, teachers stated that their
students with visual impairments participated more with their visually impaired
peers. One possible explanation of this is where teachers created the
opportunities for their students to participate with other visually impaired

83
students. Since these teachers worked in rural areas, more opportunities are
created as opposed to having opportunities to participate with sighted peers.
Lack of parental involvement and student motivation were also offered as
reasons for students to have limited participation in community activities. This is
substantiated in the literature by Lieberman and Lepore, (1998),Longmire,
(1998), Nixon, (1988) and Kozub, (2006), all of who expressed the concepts that
parents of children with visual impairments lack an understanding of their
children’s ability to be physically active and often engage in overprotective
behaviors in an attempt to assist them.
Kozub (2006) attributed lack of student motivation to participate in physical
activity, either in the community or in school, to the change in family involvement
in physical activity. This is validated by data that comes from the CDC (2007),
stating that there has been an overall decrease in physical activity across the
country in the past 10 years. Also, Lieberman, Houston-Wilson and Kozub (2002)
reported that most students with visual impairments have little awareness of the
many sport activities that they can participate in.
It is clear that this is one of the most significant areas that should be
explored through future research and possible intervention studies. At the
minimum, parent, teacher and administrative education programs should be
implemented, but who should take responsibility is the unresolved question that
professionals in the field of blindness and physical education continue to
consider.
84
Impact of Obesity on Social Relationships
The fourth research question involved an analysis of teachers of students
with visual impairments’ perceptions on whether their students’ social interactions
were affected by their obesity. Three assumptions had to be realized for this to
be an accurate measure of a teacher’s perception. First, teachers had to
understand the basic definition of obesity according to the Body Mass Index
(BMI) meant for their students; second, the students on their caseload had to
meet that criterion; and third, teachers had to perceive a relationship between
obesity and social relationships. With these assumptions in place, teachers were
asked to rate whether or not obesity affected their students’ social relationships.
Although teachers rated the importance of obesity and its relationship to social
relationship, the three assumptions above were not included in the questionnaire
so it was not possible to identify the influence of the three assumptions.
Comments in the question were more related to obesity and social interactions
being as important as with their sighted peers. In addition, most of the
respondents who answered the question felt that their students did not have
difficulties with weight. This was also part of the information provided by
teachers on the qualitative questions concerning intervention strategies.
There is no literature on obesity or being overweight in people with visual
impairment. Studies by Harter, 1990 and Tuttle (2004) examined low-self
esteem and low self-concept, but it addressed how physical activity and physical

85
competence contributed to more positive self worth. However, Ponchillia (2002)
reiterated the point that overall students with visual impairments struggle with
self-determination and decision making skills, which could reflect making poor
nutrition choices that lead to weight issues, or contributing to having difficulties
with social relationships.
The information provided through CDC (2007) and the Healthy American’s
organization (2007) on the problems of obesity and unhealthy eating practices
center more on the medical issues that are created by these choices and not the
effect on social interactions. Eating out is one of the most popular leisure
activities in this country (CDC, 2007); finding healthy ways to have social
interactions is more of the challenge.
Because teachers responding to the survey did not consider being
overweight or obesity to be a problem with their students, future research should
center on the assumptions needed to answer this question more effectively,
including the definitions of obesity and BMI’s calculations for a more critical
description of their students. In addition, it may be important to gather more
specific data on obesity among visually impaired children by age.
However, another consideration that should be part of future research
would be a more basic question about the appropriateness of social interactions
of their students with visual impairments in settings with their sight peers. For
students with visual impairments, being overweight may not be a key factor to
successful social interactions.

86
Importance of Physical Education
The fifth research question was related to the teachers of students with
visual impairments perception of the level of importance of physical education in
the schools that they serve. For the most part, the teachers rated this question as
very important in the general curriculum. However, the teachers also indicated
that the current physical education classes were generally not appropriate or
accessible for their students with visual impairments. Teachers reported that their
students were pulled from physical education classes for other related service
activities, physical education teachers were not prepared for the student with a
visual impairment to be in their class, and parents would not allow their child with
a visual impairment to participate in physical education classes and asked
administrators for exemptions from class.
Recent literature supports the validity of these statements and provides
suggestions for modifications and adaptations needed for inclusion of students
with visual impairments in the general physical education classes. In addition,
Lieberman, Houston-Wilson and Kozub (2002), state that barriers particularly
affecting integration of students with visual impairments into physical education
are opportunities to participate, attitudes of educators, and teachers’ knowledge
of individuals with visual impairments. In the study of perceived barriers to
including students with visual impairments in general physical education,
Lieberman, et al (2002), found that the most prevalent barrier was a lack of
87
professional preparation of general physical education teachers. The second
most prevalent barrier was the lack of appropriate equipment for teaching
students with visual impairments, including auditory ball, bright balls, bright
cones, tactile guidewires and tactile boundaries. The third major barrier was lack
of programming as it pertains to inclusion classes. Because students who are
visually impaired need a different type of instruction that includes some individual
and small group teaching, it is difficult for general physical education teachers to
achieve a successful program for the one or two visually impaired students in a
class of 45 of their sighted peers. However, with the proper training and
planning, physical education teachers would have more success with the diverse
group of students who are included in regular education classes (Lieberman and
Cowart, 1996; Lieberman and Houston-Wilson, 1999; Sherrill, 1998).
Ponchillia (1995) supported the argument that the lack of access to
physical education in public schools has a direct relationship to the physical
education teacher’s general lack of knowledge of the adaptive techniques
required to include students with visual impairment and special education
teachers’ lack of knowledge of specific sports skills. Similarly, the information
collected from the teachers who responded to the survey for this study validated
the need for more training for general physical education teachers and the
provision of the appropriate equipment for instruction with students who are
visually impaired.
88
Relationships between Physical Activity and Academic Success
The sixth research question involved teachers’ perceptions concerning
their students’ academic success and how it related to physical activity. There
was a very mixed response from the teachers on this topic. A considerable
number of respondents (60%) did not feel that there was a major correlation
between the two, and 25% of respondents did not feel that it was part of their
teacher responsibilities. These perceptions may reflect in the trend of decreases
in physical activity levels of adults. According to the Healthy Americans
Organization report (2007), more that half of adults stated that they do not
participate in the CDC’s recommended level of physical activity and more that 22
percent of adult Americans say they do not engage in any physical activity
According to literature on the general population, physical activity is one of
the keys to academic success. In a study conducted by the American College of
Sports Medicine, it was found that 20 minutes of vigorous activity at least three
days every week was associated with students’ ability to excel academically.
Dawn Coe (2004), who was the lead author of the study and assistant professor
of exercise science at Grand Valley State University, stated that physical activity
reduces boredom and increases attention span and concentration. A healthy
level of activity has also shown to increase self-esteem, which may support both
physical activity and academic performance. The CDC (2007) recommends that
any activity that gets the students moving can be effective. The most important

89
thing to do in helping children stay active is consistency and participates on a
regular basis.
No research has been conducted on the relationship between physical
activity and academic performance of students with visual impairments; however,
in the absence of research, it can be assumed that there may be a similar
relationship between activity and academic performance in visually impaired and
sighted students; in fact, academics may be even more closely related to
physical performance, give all of the additional skills required to access the
general education curriculum. According to Jankowski (1991), there is not a
different aerobic capacity between visually impaired students and their sighted
peers, and students with visual impairments should be able to attain the same
level of fitness.
Students with Visual Impairments Participation in Physical Education and
Activities Outside of School
The seventh research question involved the differences between a
student’s participation in physical education in school and participation in
activities outside of the school environment. The purpose of this question was to
determine whether a student with visual impairments would have the same lack
of access to physical activities within a regular school setting as with physical
activities in their own community.
As previously discussed, literature pertaining to barriers to general
physical education programs and the lack of accessibility to community programs

90
were supported by the comments of teachers who responded to the survey.
However, teachers did report that that most of their students participated in
physical education classes. Even though visually impaired students were often
participating in physical education programs, the teachers described students’
difficulties and frustrations with class experiences. One explanation for the
discrepancy between students attending class and actual participation in class
could be in the wording of the question asked on the survey. It simply stated “Do
your students participate in physical education in school?” Details about the level
of participation of the student with a visual impairment in the class, including
whether it was an adapted physical education class or whether students attended
on a regular basis, were not provided. These additional questions might have
given a clearer picture of the student’s participation and the effectiveness of a
general physical education class for these students.
Relationships between a Teacher’s Personal Physical Activity and
Perceptions of Importance
The eighth research questioned involved potential correlations between a
teacher’s own physical activity levels and the five questions concerning the
perceptions of importance on physical activity and obesity for their students.
According to the statistical analysis conducted for this question, there was
no correlation between a teachers’ personal physical activity levels and their
ratings of importance of their students’ physical activity, the influence of physical
activity on social interactions, the influence of weight in social relationships,

91
physical education in the general curriculum and the influence on academic
success.
There is no literature about how perceptions of teachers of students with
visual impairments relate to questions of importance concerning their students
with visual impairments. However, a study by Patrick, Hisley, and Kempler
(2000), found that students are influenced by a teacher’s enthusiasm and vitality
for subjects that are taught, and this could be more motivating than a teacher’s
own personal fitness behavior. One possible explanation could be that these
teachers of students with visual impairments have an unusual concern about
their students because of the nature of their role in public schools. Since class
size is smaller than general education teachers, concerns about quality of life
and the many skills that students with visual impairments need to be successful,
may have a bigger impact than simply teaching one subject. Although regular
education teachers care about their students, teachers of students with visual
impairments may have a more elemental view of caring for their students taken
on by most special education teachers (Lang, and Fox, 2004). This view creates
the basic constituent of teaching students with visual impairments the many skills
needed to be success, independent adults.
Interventions Strategies Used by Teachers of Students with Visual
Impairments with Their Students
The ninth research question involved collecting information from teachers
through two open-ended questions about the strategies that they found
92
successful in increasing levels of physical activity and reducing obesity of
students with visual impairments. The first question concerned intervention
strategies for reducing obesity, and the second one involved strategies for
increasing physical activity. A third open-ended question was included to gain
information from teachers concerning the overall topic of physical activity and
obesity as it pertained to their students.
The teachers who participated in these questions listed a variety of
intervention techniques that they have used with their students in helping them to
reduce weight and increase physical activities. However, only 60% of the 175
respondents answered the first open-ended question, 63% answered the second
one and only 53% answered the last general comment question.
For the first questions, teachers were very mixed on their intervention
strategies concerning weight issues. Many of the teachers did not feel that their
students were overweight, as evidenced by comments such as “none of my
students on my current caseload are overweight”, or “my students do not have
weight issues however, many have multiple impairments that impact their activity
and weight”.
This was also confirmed in comments given from teachers in discussing
the relationship between obesity and social relationships in research question
four. Teachers did not feel that their students with visual impairments were
overweight; as previously discussed, this may be due to a variety of reasons,

93
including a misunderstanding of the definition or the varying ages of the children
served by the teachers.
Even teachers who did feel that their children were overweight gave varied
responses for weight interventions that included teachers having “realistic
discussions with their students on nutrition and appearance” to participation in
physical activities such as “making sure that they are actively participating in
physical education”. Over half of the teachers who commented to this question
reported that both strategies of “controlling diet and encouraging full participation
in gym class” were important in maintaining a normal weight.
These findings support the literature from the CDC (2007) and the Healthy
Americans Organization (2007) concerning weight control and physical activity
needs. Recommendations for daily caloric intake and activity constitute a
balance between the two, with physical activity being a leader in weight reduction
and overall physical, mental and emotional health. According to the report “F as
in Fat – How Obesity Policies are Failing in America” (2007), by only
concentrating on weight loss, it often yields limited results, and successes are
typically small. There is significant scientific consensus around the long term
health benefits of physical activity for everyone, no matter their weight, and this
was confirmed from statements by the teachers.
However over 30% of the 106 respondents did not know of interventions
that could be used or had not tried any type of intervention for weight loss. Along
with this amount, 69 teachers did not respond to the question at all, perhaps

94
indicating that they had not tried interventions, or had no knowledge of strategies
for weight loss. A possible explanation for teachers not responding may be that
they feel that this is not an area that should be or could be covered by a teacher
of students with visual impairments, because of the multitude of instruction needs
and curriculum modifications that have to be covered on an itinerant basis. This
was corroborated by the findings of Correa-Torres and Howell (2004).
The second open-ended question involved intervention strategies that
teachers used with their students to increase physical activity. The information
given from the teachers ranged across a continuum in participation levels for
students with visual impairments from: (1) no strategy used, (2) feelings of
frustrated with the lack of parental, teacher or administrative involvement, (3)
teacher provision of activities for students, (4) collaboration with physical
education teacher, (5) a student’s total inclusion into regular physical education
classes with the appropriate modification and adaptations.
The teachers reported that moving through the continuum of participation
levels from one to five included a great deal of a teacher involvement and
intervention techniques. However, as the level of involvement from teachers
increased, they expressed an increasing frustration in the process of enabling
their students to become involved with inclusive physical education programs.
The barriers that Lieberman, Robinson and Rollheiser (2006) found with students
feeling left out of activities that were not accessible to them because of the
nature of the sport was also supported by the teachers on the survey.

95
Consultation with physical education teachers provided a myriad of positive and
negative stressors for the teachers. According to the findings, physical
education teachers either were receptive to the needs of students with visual
impairments, or requested that the student participate in adapted physical
education classes. Once teachers gave suggestions of what equipment and
modifications should be used with their students, physical education teachers
were more receptive to having students with visual impairments in their classes.
These experiences with physical education teachers are supported by
Lieberman, Houston-Wilson and Kozub (2002) who recommend that teacher
preparation programs provide an expansive curriculum in teaching students with
visual impairments, instead of the typical general special education course that
most general physical education teachers take during their program, so that
these students can achieve more successful inclusion experiences.
Another area where teachers of students with visual impairments found
some success was with the use of peer tutors for students with visual
impairments in the general education class. Some of these students were
trained in the needs of students with visual impairments in classes, some were in
teaching their sighted peers some of the games that visually impaired students
can participate, and some were not trained at all. The teachers did not specify
what type of “tutor” was effective. However, teachers concluded that having
sighted peers involved with their students was a fairly positive experience for
both students. The use of trained peer tutors in general physical education

96
classes was studied by Wiskochil, Lieberman, Houston-Wilson and Peterson
(2007) to evaluate whether sighted tutors could increase learning time in physical
education classes for visually impaired students. It was found that increases in
levels of learning depended on the activity, desire of the student, and
effectiveness of the tutor. Conclusions were that the more individual attention
and small group participation provided, increases in learning occurred for the
students with visual impairments.
It is important to provide whatever modifications and adaptations are
necessary for visually impaired students to be included in general physical
education classes, and it has been demonstrated through studies done by
Blessing, McCrimmon, Stovall and Willford (1993); Buell (1982); Lieberman,
Stuart, Hand and Robinson (2006); and Sherrill (2004), that students with visual
impairments can attain levels of physical fitness that are comparable to those of
their sighted peers. However, responses to this question from teachers and
physical activities for their students indicate the same frustrations and limitations
that other studies show concerning accessibility to physical education and
community activities.
The third open-ended question gave teachers of students with visual
impairments the opportunity to talk generally about the issues of physical activity
and weight with their students. Three of the themes were supported by the
literature previously discussed and reiterate the need for (1) training of physical

97
education teachers, (2) more parental involvement, and (3) importance of
physical activity for their students.
The overall information provided by teachers of students with visual
impairments on this question shows a basic understanding of the need for
physical activity with their students and an awareness of what has been
presented through the Center for Disease Control (CDC, 2007) on the rising
percentages of individuals that are significantly overweight and the decrease in
physical activity, One teacher verified the sentiment of responses given for this
question, “I acknowledge the importance of physical education and activity in all
students and feel this is a curriculum that should be mandatory for all grade
levels.”
Nevertheless, though teacher comments show recognition of the need for
physical activity, extensive solutions were not provided. Interventions that worked
successfully with individual students, not all students, were provided. One
teacher commented that “a great percentage of my students’ parents do not find
that physical education is important. They even write letters to get them out of
P.E. class! I’m sick of the fact that many teachers and administrators think that
since a student is blind or VI, they don’t have to participate in P.E. as they ‘can’t
see’ no matter what their loss. Frustration!!!!” The results of this study sends an
important message about the need to develop more education and training that
supports teachers of students with visually impaired students, their students with
visual impairments, general educators and administrators in understanding the

98
importance of physical activity for short and long term health effects and quality
of life particularly for students with visual impairments. Specific education and
training opportunities should include in-service training and courses in teacher
preparation programs to involve general physical education teachers,
administrators and general education teachers concerning the very specific
needs of students with visual impairments have in public school. Also, the very
dynamic needs of students with visual impairment in the area of motor
coordination and how physical activity creates positive liaisons with their sighted
peers should be included. Finally, teachers of students with visual impairment
need the support of parents, and parents need the support of teachers in
providing resources and opportunities for their students and children with visual
impairments to be physically active and productive human beings.
Limitations of the Study
Several limitations may have influenced the study results. First, the survey
was distributed through a national internet email service and even though
technology and computer use has increased, this method of distribution can
provide an unequal representation of all states of the country, particularly if the
data collected must be a random and anonymous sample.
A second limitation of the study is the nature of those who did respond to
the survey. Because it was a voluntary study sent through the internet, teachers
who were interested in the topic may have been the only ones that responded.

99
There was not a vehicle to identify those who did not want to answer the survey
and could have effective the results.
A third limitation of the study was the specifics of questions asked on the
survey. For example, questions concerning the participation levels of students
with visual impairments were not part of the survey, so the differences between
attendance in physical education classes and actual participation levels in
physical education classes could not be analyzed for actual student involvement.
This may have skewed the statistics of “high levels of participation” by students
with visual impairments in general physical education classes that was reported
by the teachers and meant to be simply reported as attending physical education
classes.
A fourth limitation of the study was in not knowing the background of
teachers of students with visual impaired that answered the survey. Questions
concerning other roles that the teachers were filling within the district, such as
also being an Orientation and Mobility Specialist in addition to a teacher might
have skewed the information given. Also, the possibility that teachers did not
have an understanding of the Body Mass Index scale and how it relates to
overweight and obesity issues would have influenced teachers responding to the
questions on obesity and social relationship and the question on intervention
strategies for obesity.
A fifth limitation of the study is that there was no way to determine that the
respondents were representative of the profession. Teachers are spread out all

100
over the country; many may have chosen not to be part of the listserv or become
a member of AER, and they would not have had the opportunity to answer the
survey. The American Foundation for the Blind reported that there are over 1500
teachers of students with visual impairment currently teaching in either residential
or public school settings. With about 85% of visually impaired student students
attending public school, 175 surveys represents a small percentage of teachers
who could have been used for the study.
In spite of the above-mentioned limitations, the data gathered through this
study are valuable and represent the first in depth study on teachers of students
with visual impairments perceptions on a topic that has been very important to
physical educators. The study findings can be used by practitioners, parents,
students with visual impairments and administrators to validate the need for
appropriate instruction in physical education and opportunities for community
recreation activities.
Implications for Future Research
This is the first study that has examined the perception of teachers of
students with visual impairments about physical activity. The purpose of the
study was to find out what aspects of physical activity teachers in the field of
visual impairment deemed important for their students with visual impairments
and what strategies they applied to enable their students to be more physically
active. The study has raised some questions about whether or not the teachers

101
feel that they are being successful and also, if they want to take on this issue
along with all of the other curricular responsibilities that are required of them.
Information from the teachers was collected through internet listservs and
compiled through a software program that collected data. The questions
designed through the internet survey did not elicit detailed information concerning
teacher perceptions. A future study should be replicated with more open-ended
questions that involved actual case studies of their studies.
Because of the wide distribution of professionals and the low incidence of
students who are visually impaired, it is difficult to gather reliable and
representative data on educational practices. A qualitative study of inclusive
physical education classes with observations, interviews, and focus groups
should be part of a future study so that the researcher can collect information
from a variety of sources.
Teacher perceptions of how weight affects social relationships, and how
many students were overweight indicated lower percentages than hypothesized
in the research questions. Part of the expanded core curriculum for the education
needs of students with visual impairments focuses on recreation, leisure and
physical activity. Perhaps the real dilemma is in finding ways to incorporate
these areas into the general curriculum for students with visual impairments. The
CDC (2007) and Healthy American organization (2007) point out that America is
the fattest country in the world and a combination of healthy food choices and
adequate physical activity is needed for everyone. All students need this

102
information to be healthy and productive adults and all children with or without
disabilities should have access to these opportunities. An area for future
research would be to find ways to integrate the needs of students with visual
impairments with their sighted peers.
The difficulty of studies completed on physical activity with students with
visual impairments is in finding solutions to the problems created by inclusion in
regular education classes, and barriers to community activities. The evidence
born out of the study indicated that teachers of students with visual impairments
continue to be frustrated by the lack of appropriate physical education classes
provided for their students. Even though they noted a high percentage of
attendance in the general physical education classes, evidence provided through
the open-ended questions showed that general physical education teachers are
not including visually impaired students in activities and often have them sit on
the sideline. Administrators are excusing visually impaired students from
physical education classes and are not requiring that they fulfill the physical
education credit needed for graduation. Teachers also reported a frustration with
the lack of opportunities for participation in community activities for their students.
Reported barriers such as a lack of parental involvement, the lack of activities
available to students and the lack of the appropriate equipment for students
persist in being part of the problem of accessibility. Teachers reported that only
eight or nine percent of their students participated in community events.

103
Numerous studies emphasize the increased need for early physical
activity with visually impaired children because of the delays in motor
coordination and lower fitness levels compared with their sighted peers (Buell,
1950a, 1950b; Daugherty and Moran, 1982; Jankowski and Evans, 1981;
Lieberman and McHugh, 2001; Pereira, 1990; Ribaldi, Rider and Toole, 1987;
Skaggs and Hopper, 1996; Skellenger, Rosenblum and Jager, 1997, Winnick
and Short, 1982). However, motivating students with visual impairments to
participate on a regular basis is complex. Instead of future research on the need
for physical activity in inclusive settings for students with visual impairments, a
national agenda on programming to get visually impaired students involved with
physical activity should be created. The factors to be considered include (1)
parent focus groups, (2) physical educator preparation programs, (3) appropriate
fitness programs in public schools and (4) successful visually impaired adults
who have carried a physical activity program into adulthood to find out what
helped them develop their attitudes as adolescents.
Conclusion
The purpose of this study was to examine perceptions of teachers of
students with visual impairments concerning the importance of physical activity
and obesity and its effects on academic success and social relationships. The
teachers acknowledged that physical activity with their students was very
important and even with their students participating in general physical education

104
programs; they described a multitude of barriers that accounted for a lack of
involvement in the class.
Teachers reported on their own personal physical activity levels, but their
perceptions were unrelated to how they felt about their students’ needs to be
active. The teachers did not indicate that being overweight was a particular
problem with their visually impaired students, but they acknowledged that being
overweight and a lack of physical activity does create additional barriers for
academic success and appropriate social relationships for all students.
The teachers also described the same barriers in physical education
classes and access to recreation activities in the community that have been
delineated in past research studies concerning this topic. These were also part
of their dilemma in creating positive physical activity experiences for their
students who were visually impaired. This study supports the needs reported in
the literature for further research to find the effective intervention strategies and
programs to increase physical activity.

105
APPENDIX A
SURVEY FOR TEACHERS

106
Survey for Teachers of Students with Visual Impairments on their perceptions of the effects of obesity and lack of physical activity for their
students with visual impairments
SECTION 1: USING THE LIKERT SCALE, PLEASE CIRCLE THE NUMBER THAT BEST DESCRIBES YOUR BELIEFS IN EACH OF THE FOLLOWING AREAS Likert Scale 5 = A great deal 4 = A moderate amount 3 = Neutral 2 = Somewhat 1 = Not at all 1. How important to you is the physical activity of your students? 1 2 3 4 5 2. How much does your students’ level of physical activity affect their ability to succeed academically? 1 2 3 4 5 3. How much does being overweight affect your students’ ability to have appropriate social interaction with sighted peers 1 2 3 4 5 4. How much does their level of physical activity affect your students’ ability to have appropriate social interaction with sighted peers? 1 2 3 4 5 5. How often do your students have opportunities to participate in recreational activities in the community with sighted peers? 1 2 3 4 5 6. How often do your students have opportunities to participate in recreational activities in the community with peers who are visually impaired and/or blind? 1 2 3 4 5 7. How important is physical education in your schools’ general education curriculum? 1 2 3 4 5

107
SECTION II: INFORMATION ABOUT YOUR SCHOOL DISTRICT, STUDENTS SERVED AND PERSONNEL (please check the BEST answer) 8. What is the approximate total student population in your school district?
___Less than 1000 ___1000-5000 ___5000-10,000 ___10,000 and above
9. What is the ethnic breakdown of all of the students in your school district? (approximate percentage)
___Asian American ___Native American ___African American ___Caucasian ___Multiracial ___Hispanic
10. What is the estimated total number of students who are visually impaired or blind that is served by your school district? ___0-5 ___6-10 ___11-25 ___26-50 ___50 and above 11. What percentage of your students who are visually impaired or blind:
11. Participate in physical education in school? _____ 12. Participate in physical activities outside of school? _____ 13. Are twenty pounds or more overweight? _____ 14. Are male?_____ female?_____
12. Estimate the percentage of your students in each age group:
___0 - 5 years ___6 - 10 years ___11 - 14 years ___15 - 19 years
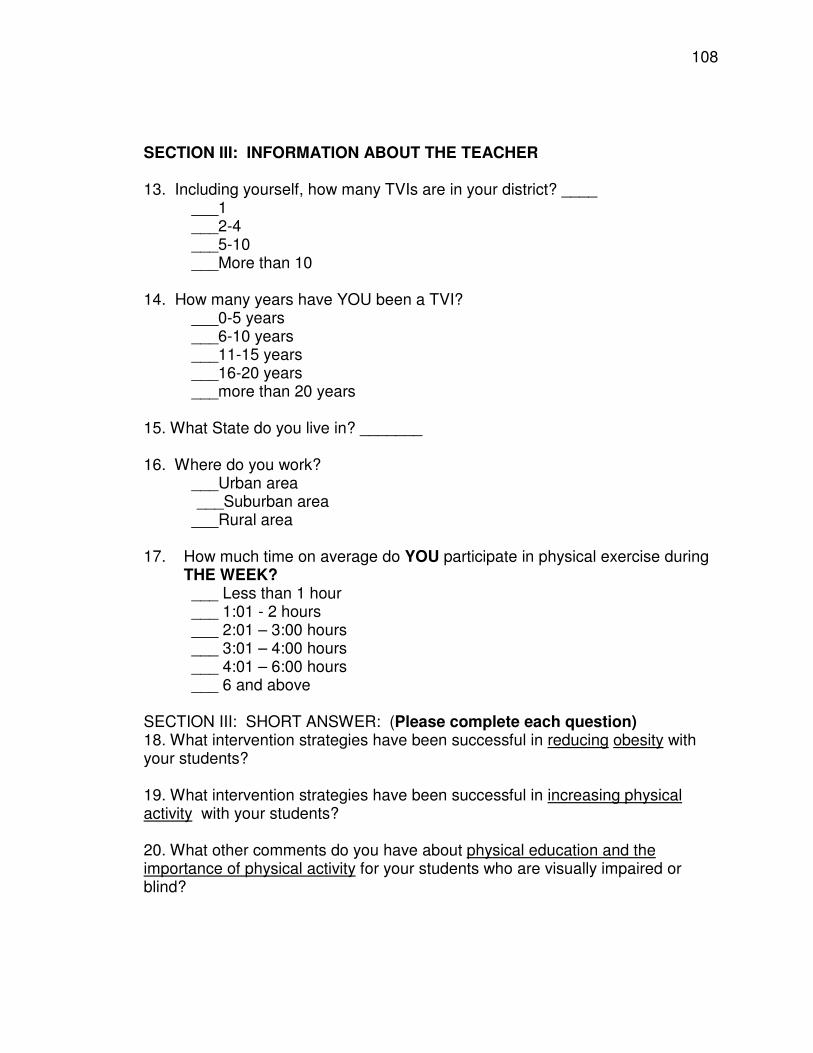
108
SECTION III: INFORMATION ABOUT THE TEACHER 13. Including yourself, how many TVIs are in your district? ____ ___1 ___2-4 ___5-10 ___More than 10 14. How many years have YOU been a TVI?
___0-5 years ___6-10 years ___11-15 years ___16-20 years ___more than 20 years
15. What State do you live in? _______ 16. Where do you work? ___Urban area ___Suburban area ___Rural area 17. How much time on average do YOU participate in physical exercise during THE WEEK?
___ Less than 1 hour ___ 1:01 - 2 hours ___ 2:01 – 3:00 hours ___ 3:01 – 4:00 hours ___ 4:01 – 6:00 hours ___ 6 and above
SECTION III: SHORT ANSWER: (Please complete each question) 18. What intervention strategies have been successful in reducing obesity with your students? 19. What intervention strategies have been successful in increasing physical activity with your students? 20. What other comments do you have about physical education and the importance of physical activity for your students who are visually impaired or blind?

109
APPENDIX B
EMAIL REQUEST

110
Email Script for Survey Request Kathy Zwald – University of Arizona – July 2007
My name is Kathy Zwald and a doctoral candidate at the University of Arizona’s Vision Program under the direction of Dr. Jane Erin. As part of my dissertation research, I am conducting an Internet survey to collect data from Itinerant Teachers of Visually Impaired Students (TVIs) about their perceptions of how obesity and lack of physical activity affects their students’ academic and social skills. The significance of the data collected will be used as a framework to begin to determine the appropriate curriculum strategies that could be used. Childhood obesity has more than doubled since 1970, and the health consequences are reflected in the rising cost of health care. An estimated 30% of U.S. children and adolescents, ages 6 to 19, are overweight or obese and the likelihood of being overweight or obese increases as people get older. Being overweight or obese is especially a problem for children who have visual impairments because of the effect it can have on their academic and social venues and a lack of access to physical activity in the community. In the field of visual impairment and blindness, a Teacher of Students with Visual Impairments (TVI) is often the primary professional involved in a student’s academic and social development in public education programs. The role that the TVI plays in the academic and social development is significant, and it is important to evaluate this role in addressing the nutritional and physical activity needs of students who are visually impaired. If you are an itinerant TVI and would like to participate in the survey, please click on the link below and follow the instructions. This survey is completely voluntary and anonymous. You may quit the survey at any time or skip any questions that you do not want to answer and choose whether you want to send it or not. If you would like a copy of the results, please send an email request to [email protected]. Thank you for your time in this matter. Sincerely, Kathy Zwald www.surveymonkey.com link

111
APPENDIX C
DISCLAIMER FORM

112

113
APPENDIX D
HUMAN SUBJECT RESEARCH STATEMENT

114

115
APPENDIX E
RESEARCH – DATA ANALYSIS

116
RESEARCH QUESTIONS RELATED TO SURVEY QUESTIONS AND DATA ANALYSIS Research Questions Survey Questions Data Analysis
1. What are the characteristics of teachers and 8-10, 12 Demographic information was analyzed by students in different community types in the country 13-16 calculating frequencies and percentages for the and are there differences and /or similarities between variables and used as information concerning these communities? respondents and their students. 2. What are the perceptions of teachers about 1 To describe perceptions of importance of physical the importance of physical activity for their activity, calculations of the number from the likert students? Scale (1=not at all, 5=a great deal) and
percentage of responses in each category was used. A chi square was applied to determine whether response were unequally distributed s
3. Are there differences between students 5, 6 To describe TVI’s perceptions of how often their participation in recreation activities with their students have the opportunity to participate in visually impaired and sighted peers? Are there in physical activity and recreational activities wit differences between community types? their sighted and visual impaired peers, two one way ANOVA analyses were completed with
community type and population, utilizing a standard deviation and a p value less than .05.
4. How much do Teachers of the Visually Impaired 3, 4 Same analysis as in research question 2, with perceive obesity and physical activity affects weight, physical activity and social relationships social relationships of their students who are visually impaired?
5. How do TVIs view the importance of physical 7 Same analysis as in research question 2 & 4 education in the general curriculum of the schools with physical education and general curriculum they serve?
6. Do TVIs perceive that there are relationships 2 Same analysis as research questions 2, 4& 5, between physical activity and academic success with academic success. of their students?
7. According to TVIs, what percentage of their students 11 Same analysis as in research questions 2, 4-6 participate in physical activities in school and with participation in physical activity in and utside outside of school? of school environment.
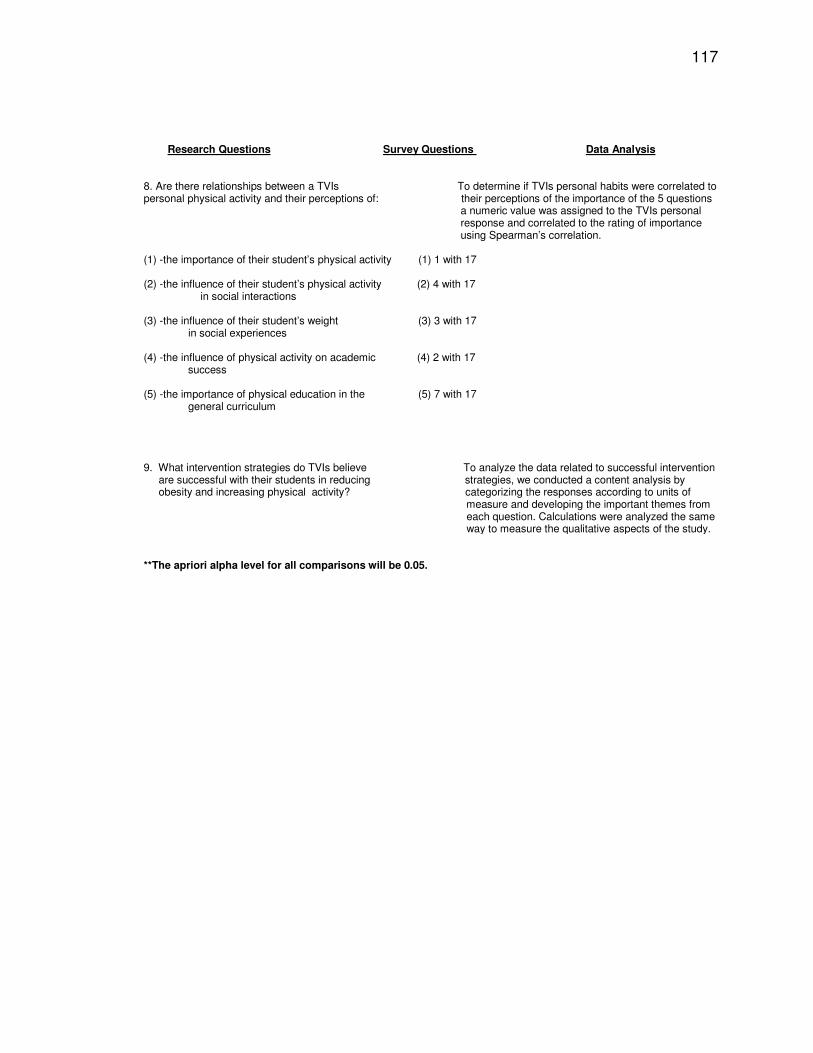
117
Research Questions Survey Questions Data Analysis 8. Are there relationships between a TVIs To determine if TVIs personal habits were correlated to personal physical activity and their perceptions of: their perceptions of the importance of the 5 questions a numeric value was assigned to the TVIs personal response and correlated to the rating of importance using Spearman’s correlation. (1) -the importance of their student’s physical activity (1) 1 with 17 (2) -the influence of their student’s physical activity (2) 4 with 17
in social interactions (3) -the influence of their student’s weight (3) 3 with 17 in social experiences (4) -the influence of physical activity on academic (4) 2 with 17 success (5) -the importance of physical education in the (5) 7 with 17 general curriculum 9. What intervention strategies do TVIs believe To analyze the data related to successful intervention are successful with their students in reducing strategies, we conducted a content analysis by obesity and increasing physical activity? categorizing the responses according to units of
measure and developing the important themes from each question. Calculations were analyzed the same way to measure the qualitative aspects of the study.
**The apriori alpha level for all comparisons will be 0.05.

118
REFERENCES American Foundation for the Blind (2007) Education and Employment Statistics. Retrived on February 3, 2008 from: www.afb.org
Anderssen, N., and Wold, B (1992). Parental and peer influences on leisure-time physical activity in young adolescents. Research Quarterly for Exercise And Sport,63, 341-348. Blessing, D.L., McCrimmon, D., Stovall, J., and Willford, H.N (1993). The effects of regular exercise programs for visually impaired and sighted school children. Journal of Visual Impairment and Blindness, 87, 50-52. Buell, C.E. (1950b). Motor performance of visually handicapped children. Journal of Exceptional Children, 69-72. Buell, C.E. (1982). Physical education for blind children. Springfield, IL: Charles
C. Thomas. Center for Disease Control (2007). Obesity and Physical Activity. Retrieved on
December 10, 2007 from: www.cdc.gov/nccdphp/dnpa. Coe, D. (2007). Exercise is a key to Academic Success. American College of
Sports Medicine Journal, 79, 322-334. Corn, A.L., Hatlen, P.,Huebner, M.K., Ryan, F., and Siller, M.A., (1995). The
National Agenda for the Education of Children and Youths with Visual Impairments, including those with multiple disabilities. New York: AFB Press.
Correa-Torres, S.M., Howell, J.J. (2004). Facing the Challenge of Itinerant
Teaching: Perspectives and Suggestions from the Field. Journal of Visual Impairment and Blindness. 98 , 420-434.
Craft, D. (1986). Curriculum adaptations. In G.T. Scholl (Ed.) Foundations of
education for the blind and visually handicapped children and youth (pp.396-397). New York: American Foundation for the Blind.
Datar, A., and Strum, R. (2006). Childhood Overweight and Elementary School
Outcomes, International Journal of Obesity, 14, 91-94. Daugherty, K.M., and Moran, M.F. (1982). Neuropsychological learning and
developmental characteristics of the low vision child. Journal of Visual Impairment and Blindness. 76, 398-406

119
Ferrell, K.A. (1986) Infancy and Early Childhood. In G.T. Scholl (Ed.) Foundations of education for the blind and visually handicapped children and youth (p.130). New York: AFB Press.
Finkelstein, EA, Fiebelkorn, IC, Wang, G. National medical spending attributable
to overweight and obesity: How much, and who’s paying? Health Affairs 2003; W3; 219–226.
Fowler, F.J. (2002). Survey Research Methods. Thousand Oaks, CA: Sage Publications. Gronmo, S.J, Augestad L.B. (2000). Physical Activity, Self-concept, and Global
Self-Worth of Blind Youths in Norway and France. Journal of Visual Impairment and Blindness, 94, 522-527.
Hanna, R.S. (1986). Effect of Exercise on Blind Persons. Journal of Visual
Impairment and Blindness, 80, 722-725. Harter, S. (1990). Effective motivation reconsidered: Toward a developmental
Model Human Development, 21, 34-64.
Hatlen, P. (1996) The Core Curriculum for blind and visually impaired students, including those with additional disabilities, RE:view, 28, 25-32.
Hatton, D.D., Bailey, D.B., Burchinal, M.R., and Ferrell, K.A. (1997).
Developmental growth curves of preschool children with vision impairments. Child Development, 68, 788-806.
Hedley, AA, Ogden, CL, Johnson, CL, Carroll, MD, Curtin, LR, Flegal, KM.
Overweight and obesity among US children, adolescents, and adults, 1999-2002. JAMA 291:2847.2850.
Hyun-Kyoung Oh, Mehmet A. Ozturk, Kozub, F.M. (2004). Physical Activity and Social Engagement Patterns During Physical Education of Youth with Visual Impairments. RE:view, 36, 39-48.
Jankowski, L.W. and Evans J.K. (1981). The exercise capacity of Blind Children.
Journal of Visual Impairment and Blindness, 75, 248-251. Kroksmark, U., and Nordell, K (2001). Adolescence: The age of opportunities and
obstacles for students with low vision in Sweden. Journal of Visual Impairment and Blindness, 95, 213-220.

120
Kobberling, G., Jankowski, L.W., and Leger, L (1991). The relationship between aerobic capacity and physical activity. Journal of Visual Impairment and Blindness, 85, 382-384.
Kozub, F.M. (2006). Motivation and Physical Activity in Adolescents with Visual
Impairments. Review, 149-160 Lang, M., and Fox, L. (2004). Breaking with tradition: Providing effective professional development for instructional personnel supporting students
with severe disabilities. Teacher Education and Special Education, 27. 163-173.
Lederman, S.A. (2004). Summary of the Presentations at the Conference on
Preventing Childhood Obesity. Pediatrics, 114, 1146-1174. Lieberman, L.J. (2002). Fitness for Individuals who are Visually Impaired or Deafblind. RE:view, 34, 13-23. Lieberman, L.J and Cowart, J. (1996). Games for people with sensory
impairments. Champaign, IL: Human Kinetics. Lieberman, L.J. and Houston-Wilson, C. (1999). Overcoming the barriers to including students with visual impairments and deaf-blindness in physical education. REview, 31, 129-138. Lieberman, L.J, Houston-Wilson, C. and Kozub (2002). Perceived barriers to
including students with visual impairments in general physical education. Adapted Physical Activity Quarterly, 19, 364-377.
Lieberman, L.J. and Lepore (1998). Camp Abilities: A developmental sports
camp for children who are blind and deafblind. Palaestra, 14, 28-31, 46-48.
Lieberman L.J. and MacVicar, J.M. (2003). Play and Recreation Habits of Youths
Who are Deaf-Blind. Journal of Visual Impairment and Blindness, 97, 755-768.
Leiberman L.J and McHugh, B.E. (2001). Health-related fitness of children with
visual impairments and blindness. Journal of Visual Impairment and Blindness, 95, 272-286.
Lieberman, L.J.and Robinson, B.L. (2004). Effects of Visual Impairment, Gender,
and Age on Self-Determination. Journal of Visual Impairment and Blindness, 98, 351-366.

121
Lieberman, L.J., Robinson and Rollheiser (2006). Youth with Visual
Impairments:Experiences in General Physical Education. RE:view, 38, 35-48.
Longmire, P. (1998). Considerations for fitness appraisal, programming, and
counseling of individuals with sensory impairments. Canadian Journal of Applied Physiology, 23, 166-184.
National Center for Chronic Disease Prevention and Health Promotion (2007).
Nutrition and Physical Activity. Retrieved September 19, 2007 from: www.cdc.gov/nccdphp/dnpa.
National Center for Chronic Disease Prevention and Health Promotion (2007).
Physical Activity and Good Nutrition: Essential Elements to Prevent Chronic Disease and Obesity 2004. Retrieved September 23, 2007 from: www.cdc.gov/nccdphp/dnpa.
National Center for Chronic Disease Prevention and Health Promotion (2007).
Defining Overweight and Obesity. Retrieved September 19, 2007 from: www.cdc.gov/nccdphp/dnpa.
Newman, C. (2004). Why are we so Fat? National Geographic, 48, 37-63. Nixon, H. (1998). Reassessing support groups for parents of visually impaired
children. Journal of Visual Impairment and Blindness, 82, 271-278. O’Connell, M., Lieberman, L., Peterson, S. (2006). The use of tactile modeling and physical guidance as instructional strategies in physical activity for
children who are blind. Journal of Visual Impairment and Blindness 100, 65-84. Olmstead, J.E. (1995) Itinerant personnel: A survey of caseloads and working
conditions. Journal of Visual Impairment and Blindness, 89, 102-105. Patrick, B.C., Hisley, J., Kempler, T., College, G., (2000) “What’s everybody so
excited about?”: The effects of teacher enthusiasm on student intrinsic motivation and vitality, Journal of Experimental Education, 68, 217- 237.
Pereira, L.M. (1990). Spatial concepts and balance performance: Motor learning
in blind and visually impaired children. Journal of Visual Impairment and Blindness, 84, 109-111.

122
Ponchillia, P.E., Ponchillia, S.V. (2002). Athletes with Visual Impairments: Attributes and Sports Participation. Journal of Visual Impairment and Blindness. 96, 267-272. Ponchillia, P.E. (1995). AccessSports: A model for adapting mainstream sports
activities for individuals with visual impairments. REview, 27, 5-14. Ribadi, H., Rider, R., and Toole, T. (1987). A comparison of static and dynamic
balance in congenitally blind, sight, and sighted blindfolded adolescents. Adapted Physical Activity Quarterly, 4, 220-225.
Rose, T.E., McDonnell, J., and Ellis, G. (2007) The impact of teacher beliefs on
the provision of leisure and physical activity education curriculum decisions. Teacher Education and Special Education, 30, 183-198.
Ross, D.B., Lottes, C.R., and Glenn, B. (1998). An adaptive physical education program teaching golf to students with visual impairments. Journal of Visual Impairment and Blindness, 92, 684-686. Shephard, R., Ward, R., and Lee, M. (1987). Physical ability of deaf and blind
children. International Perspectives on Adapted Physical Activity, Champaign, IL: Human Kinetics.
Sherrill, C. (2004). Adapted physical activity, recreation and sport: Cross- disciplinary and lifespan (6th ed.) Boston: McGraw-Hill. Skaggs, S., and Hopper, C. (1996). Individuals with visual impairments: A review
of psychomotor behavior. Adapted Physical Activity Quarterly, 13, 16-26. Skellenger A.C., Rosenblum, L.P., and Jager B.K. (1997). Behaviors of
preschoolers with visual impairments in indoor play settings. Journal of Visual Impairment and Blindness, 91, 519-530.
SPSS 16.0 Brief Guide, (2007) SPSS Graduate Pack 16.0 for Windows, SPSS Inc, Chicago, IL. Stuart, Lieberman and Hand (2006). Beliefs about Physical Activity among
Children who are visually impaired and their parents. Journal of Visual Impairment and Blindness, 100, 223-234.
Trust for America’s Health (2007). “F as in Fat”, P. 1 – 116, Retrieved February
21, 2008 from: www.healthyamericans.org
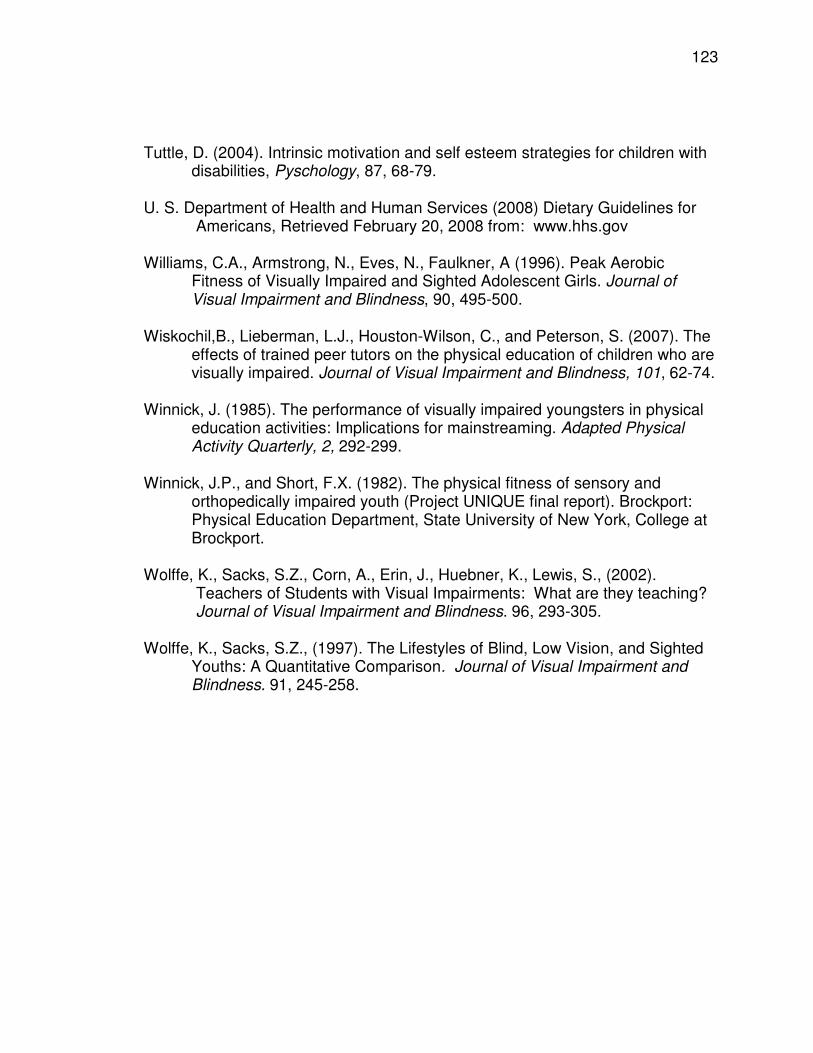
123
Tuttle, D. (2004). Intrinsic motivation and self esteem strategies for children with disabilities, Pyschology, 87, 68-79.
U. S. Department of Health and Human Services (2008) Dietary Guidelines for
Americans, Retrieved February 20, 2008 from: www.hhs.gov Williams, C.A., Armstrong, N., Eves, N., Faulkner, A (1996). Peak Aerobic
Fitness of Visually Impaired and Sighted Adolescent Girls. Journal of Visual Impairment and Blindness, 90, 495-500.
Wiskochil,B., Lieberman, L.J., Houston-Wilson, C., and Peterson, S. (2007). The
effects of trained peer tutors on the physical education of children who are visually impaired. Journal of Visual Impairment and Blindness, 101, 62-74.
Winnick, J. (1985). The performance of visually impaired youngsters in physical
education activities: Implications for mainstreaming. Adapted Physical Activity Quarterly, 2, 292-299.
Winnick, J.P., and Short, F.X. (1982). The physical fitness of sensory and
orthopedically impaired youth (Project UNIQUE final report). Brockport: Physical Education Department, State University of New York, College at Brockport.
Wolffe, K., Sacks, S.Z., Corn, A., Erin, J., Huebner, K., Lewis, S., (2002).
Teachers of Students with Visual Impairments: What are they teaching? Journal of Visual Impairment and Blindness. 96, 293-305.
Wolffe, K., Sacks, S.Z., (1997). The Lifestyles of Blind, Low Vision, and Sighted
Youths: A Quantitative Comparison. Journal of Visual Impairment and Blindness. 91, 245-258.