perceptions of disaster risk and …journalofruralsocialsciences.org/pages/articles/jrss...
TRANSCRIPT
Journal of Rural Social Sciences, 28(3), 2013, pp. 1–31.
Copyright © by the Southern Rural Sociological Association
PERCEPTIONS OF DISASTER RISK AND VULNERABILITY IN
RURAL TEXAS*
ANDREW J. PRELOGSAM HOUSTON STATE UNIVERSITY
and
LEE M. MILLERSAM HOUSTON STATE UNIVERSITY
ABSTRACT
Rural areas are uniquely vulnerable to a variety of hazards given their social and economic composition.
Economic reliance on agriculture and natural resource extraction increases vulnerability to certain types of
natural hazards such as drought, wildfires, and floods. Moreover, rural communities often lack adequate
resources to prepare for and respond to disasters. Using data from the Texas Rural Survey, the U.S. Census,
and the Spatial Hazards Events and Losses Database for the United States; this research explores questions
related to risk perception, vulnerability to disaster, and perceptions of community efficacy in a rural context.
Results indicate that rural Texans show greatest concern for drought, wildfires, tornadoes, and severe winter
weather. However, perceptions of risk were not necessarily a reflection of historical or future risk or perceptions
of community efficacy. This article concludes with comments on the relevance of these findings for community
emergency preparedness planning and resilience in rural settings.
The frequency and intensity of natural disasters in the United States have
increased markedly over the past 50 years (Cutter and Emrich 2005; Prelog 2012).
While estimates of financial losses vary widely (Mileti 1999), reliable estimates
indicate that U.S. losses from weather-related disasters alone exceeded $1 trillion
between 1980 and 2011 (Smith and Katz 2013). The U.S. state of Texas routinely
experiences a variety of natural disaster events, and annual financial losses
attributable to catastrophic disasters in Texas are often the highest in the country
(Insurance Council of Texas 2009, 2010). Human losses from Texas natural
disasters are also notable with conservative estimates indicating that Texas has lost
nearly 2,000 lives and sustained more than 23,000 injuries from natural hazards
since 1960 (Hazards and Vulnerability Research Institute 2013).
That natural disaster losses in Texas are so substantial is, in part, due to the
relative size of Texas’ population and its degree of urbanization. Texas’ population
is the second largest in the country. The state’s 25.1 million people are concentrated
*Please direct correspondence to Andrew Prelog at: CHSS Building, Room 270G, Box 2446,
Huntsville, TX 77341-2446. (936) 294-4542. [email protected]
1
2 JOURNAL OF RURAL SOCIAL SCIENCES
in the fourth (Houston), seventh (San Antonio), ninth (Dallas), and eleventh
(Austin) largest U.S. cities, and these cities are routinely affected by large natural
disaster events. Yet, Texas’ rural population is also substantial at approximately
3.85 million people (U.S. Census Bureau 2010a), a population larger than that of 26
other U.S. states.
Rural areas may be considered especially vulnerable to a variety of hazards
given their social and economic composition (Cutter, Boruff, and Shirley 2003).
Rural communities’ reliance on agriculture and natural resource extraction
(Johnson 2006) increases their vulnerability to certain types of natural hazards such
as drought, wildfires, and floods (Mileti 1999). Furthermore, rural communities
often lack adequate resources to prepare for and respond to disasters, making them
uniquely vulnerable (Cannon 1990; Cross 2001; Weisner et al. 2004). To better
understand vulnerability, risk, and risk perception in rural settings; this research
had three central questions. First, what types of disasters and natural hazards are
of greatest concern to rural residents? Second, do these concerns correspond with
historical disaster impacts? Third, how do risk perceptions correlate with
perceptions of community efficacy in response to disaster?
This paper is organized as follows. First, we provide an overview of the
literature germane to issues of vulnerability, risk, and disaster preparedness in a
rural setting. Second, we provide a demographic overview of rural Texas, as well
as a brief comparison of non-metro and metropolitan counties in the state and a
comparison of rural Texas counties to the rural United States as a whole. Third, we
detail the methods used in this research, including descriptions of our data
collection methods and secondary data sources. Fourth, we discuss our findings
relevant to the research questions proposed above. Finally, we discuss our findings
and the limitations of our study, and propose future directions for research.
VULNERABILITY AND RISK IN A RURAL SETTING
The few studies on rural risk and disaster vulnerability reveal that rural areas
are unique as to types and levels of vulnerability to the impacts of disasters (Alston
2007; Brennan and Flint 2007; Mason 2011; Saenz and Peacock 2006). Restricted
access to resources needed to face disasters can constrain rural communities’
capacity to mitigate the effects of disasters and to recover from them when they do
occur. Furthermore, low-cost rural places are home to people with characteristics
that increase vulnerability to impacts of disaster, such as lower incomes, lower
levels of education, and livelihoods that depend on resource-based occupations. This
section explores the types of vulnerability present in rural areas, how these may be

PERCEPTIONS OF DISASTER RISK AND VULNERABILITY 3
related to perceptions of risk, and possible impacts on rural emergency
preparedness.
Types of vulnerability
Vulnerability can be evaluated based on three social and ecological elements: the
presence of hazards, individual-level characteristics, and community-level variables.
The first type of vulnerability, simply put, points out that people are not vulnerable
if a hazard does not exist. If hazards are present, vulnerability depends on the
degree of threat these hazards pose. For natural hazards, like floods, considerations
would include, for example, the flooding history of a given location. Therefore, the
vulnerability of people and property to flooding in an area is assessed based on the
likelihood that flooding will occur. Often called the “exposure model of
vulnerability” (Burton, Kates, and White 1993), this type of vulnerability may be
equated with a geographic history of hazard events. Regarding this type of
vulnerability, rural places may be considered less vulnerable than urban areas
because fewer people and infrastructures are at risk (Cross 2001). However, physical
vulnerability in rural areas is more nuanced. Because rural economies are often tied
to industries such as agriculture or resource extraction, the productive materials
associated with these industries (e.g., crops and woodlands) are more vulnerable to
certain types of disasters (Flint and Luloff 2005; Johnson 2006).
The second type of vulnerability is based on a suite of individual-level
characteristics shown to enhance or diminish a person’s vulnerability to hazards.
Factors such as employment status, occupation type, income, education level, age,
gender, race, ethnicity, type of residence, home ownership, insurance coverage, and
automobile ownership, among others have all been linked to greater or lesser
vulnerability to hazards (Cutter et al. 2003; Thomas et al. 2013). These
characteristics are largely the result of social inequality—characteristics that
mediate between a person’s exposure to an environmental hazard and their ability
to respond to the stress of exposure. Although not all rural areas are the same
demographically, certain individual-level characteristics do enhance rural residents’
vulnerability. Specifically, rural areas have higher percentages of people living in
poverty and lower per capita incomes than do urban areas. Rural residents also have
lower education levels, are older, and are more likely to occupy manufactured
housing (Johnson 2006).
Variables that influence vulnerability are not limited to individual-level
characteristics. Community-level variables also influence vulnerability to hazards.
These are characteristics of the social, economic, and institutional contexts in which

4 JOURNAL OF RURAL SOCIAL SCIENCES
people are embedded. For example, Hewitt (2000) pointed out the importance of
local land-use regulation and building codes to levels of vulnerability. The capacity
of local residents to communicate, cooperate (Flint 2004), and prepare for
emergencies (Flint and Brennan 2007) also influences vulnerability levels of
individuals and their communities. Economic diversity is also an important
community-level indicator of social vulnerability or lack thereof. Specifically, rural
areas that rely on only one or two economic sectors are generally viewed as more
vulnerable to the effects of disasters (Wilson 2010). Rural areas are also considered
more vulnerable to hazards than urban areas because of relative lack of
infrastructure, resources, and political clout (Brennan and Flint 2007).
Geographically isolated, remote locations may be required to wait days before
outside assistance and additional resources arrive. Additionally, in rural areas
reliant on natural resource-based economic activity to provide jobs and sustain local
services, hazards affecting the natural environment may have particularly dire social
and economic consequences. However, a view that assumes that rural areas are
always more vulnerable than urban areas is overly simplistic.
In fact, rural contexts may be more resilient in some ways than urban
environments. Self-reliance born of isolation and limited social services often
characterizes rural communities. Further, high levels of non-monetized social
capital, such as strong ties within rural social networks and high levels of trust
among community members, facilitates community cooperation and communication
when a community is faced with adversity (see Wilson 2010). Strong social ties and
frequent interaction among residents in rural communities have also been cited as
contributing to rural resilience (Flint 2004; Miller 2007). Other factors like lower
population density (Donner 2007) and closer, more interdependent, relationships
with the natural environment (Flint and Luloff 2005) may also contribute to a
greater ability to weather storms.
Perceptions of Risk
Understanding the social dynamics of risk perception is fundamental to disaster
mitigation, response, and recovery policies (Slovic 1987). Like vulnerability, risk
perception is influenced by sociodemographic variables (Peacock, Brody, and
Highfield 2005). It is well documented that women express higher levels of risk
perception than do men (Miceli, Sotgiu, and Settanni 2007; Miller 2012). Jones et
al. (2013), in their recent cross-cultural study, argued that urban and rural cultural
elements influence risk perceptions and that risk perception is higher in urban areas
than in rural ones. Ritchie and Gill (2007) indicated that variables such as quality

PERCEPTIONS OF DISASTER RISK AND VULNERABILITY 5
of life, community wellbeing, and trust may also influence risk perception. Likewise,
Fatti and Patel (2013) found that risk perception is influenced by levels of trust in
local government. Effectively measuring risk perception is not an easy task.
However, understanding how people assess risk, and to what degree, is an
important step in designing effective warnings, encouraging residents to take
preparedness steps for their own protection, and developing emergency
management plans that address issues most salient to local residents.
Experience with hazardous events influences both individuals and communities.
People living in areas that have endured hazardous events generally express higher
levels of concern for those events (McSpirit et al. 2007; Miceli et al. 2007; Seigrist
and Gutscher 2006). However, the presence of hazards does not necessarily lead to
a perception of risk. In fact, when residents have experienced an event in the past
without significant adversity, they often demonstrate complacency when similar
events occur and may therefore be less likely to adhere to advisories or calls for
mandatory evacuation (Halpern-Felsher et al. 2001). Other disaster scholars
(Viscusi and Zeckhauser 2006; Yamamura 2012) have reported that risk perception
seems unaffected by disaster experiences.
Therefore, the presence of information about a hazard and its potentially
negative impacts does not necessarily result in perceptions of risk. Miceli et al.
(2007) have drawn upon Loewenstein et al.’s (2001) model to explore how emotions
influence cognitive processing of information about hazards to increase or decrease
risk perception. Although Sjöberg (1998) explored the distinction between ‘worry’
and ‘risk perception’ to find only a weak correlation, we asked respondents about
their level of concern about a variety of natural hazards. Sjöberg (ibid.) asked
respondents about a variety of hazards, including many technological hazards. Some
disaster scholars have argued that technological hazards invoke greater levels of
fear, a more emotion-based dread, than natural hazards (Erikson 1994). This may
have influenced the results.
Siegrist and Gutscher (2006) showed that risk perceptions of their respondents
correlated with expert opinions, emphasizing cognitive evaluation of hazards.
However, the work of Loewenstein et al. (2001) offers a model of risk perception
based on how cognitive evaluations of risk are mediated by emotions. Other studies
(MacLeod and Campbell 1992; Seigrist and Gutscher 2006) have tested forms of the
“availability heuristic” in the hopes of understanding the observed disconnect
between the potential for disaster and perception of risk. In sum, how individuals
perceive risk is complex. More research is needed to adequately understand the
processes involved and how they relate to the adoption of protective behaviors.
6 JOURNAL OF RURAL SOCIAL SCIENCES
Disaster Preparedness
Experts on risk perception (Miceli et al. 2007; Seigrist and Gutscher 2006) have
indicated that concern about hazards—perceptions of risk—may lead to forms of
individual protective behaviors; such as developing household emergency plans,
preparing emergency kits, monitoring weather alerts, and so forth. However, other
studies have shown that the link between risk perception and disaster preparedness
is weak at best (Lindell and Whitney 2000; Miceli et al. 2007; Siegrist and Gutscher
2006). While the connection between risk perception (or concern) and individual
protective behaviors has been examined with mixed findings, the relationship
between risk perception and community-level emergency planning is understudied.
Are people more likely to be concerned about hazards if they are uncertain that
their community is prepared to deal with them? Does knowledge of a community
emergency plan correlate with concern? Is concern heightened when there is
increased talk about an event occurring, as when an emergency management plan
is presented or disaster response simulations take place? Or, is individual concern
about disasters independent of community efforts to organize response activities?
Does a community’s experience with disaster events in the past affect levels of
concern about those hazard types? These are questions we explore in the Findings
section of the current paper.
Rural Texas
There are 254 counties in the state of Texas. Of these, 177 (69.7%) may be
designated as rural (Non-metro) counties (Texas Department of State Health
Services 2013).1 These rural counties are concentrated in western Texas, although
large regions in east and south Texas are also considered rural areas (see Figure 1).
Demographically, residents of rural Texas are significantly different from their
urban counterparts. These rural counties are home to older residents, with lower
levels of educational attainment and lower incomes than those living in urban areas
of the state (see Table 1; U.S. Census Bureau 2010a, 2010b). Further, rural areas in
the state usually have higher poverty rates and residents of rural Texas also are
often disproportionately non-Hispanic white in comparison to their urban
counterparts.
1The Texas Department of State Health Services uses the metropolitan and non-metropolitan
designation provided by the U.S. Office of Budget and Management. The terms “rural” and “non-
metro” are used interchangeably. For a review of these designations, see “2010 Standards for
Delineating Metropolitan and Micropolitan Statistical Areas” (U.S. Office of Management and
Budget 2010).

PERCEPTIONS OF DISASTER RISK AND VULNERABILITY 7
FIGURE 1. TEXAS COUNTIES AND METROPOLITAN/NON-METROPOLITAN
DESIGNATIONS, 2012.
Yet these comparisons do not tell the entire story about rural Texas and its
demographic composition. Rural Texas is notably different from rural America as
a whole. The rural population in the United States is largely non-Hispanic white
(79.6 %) and the largest minority group in rural America is African American (8.4
%), followed by Hispanics who constitute approximately 7.5 percent of the
population. By comparison, the largest racial or ethnic minority group in rural
Texas is Hispanic, which constitutes approximately 31.2 percent of the state’s rural
population. On average, rural Texans are also older and have lower levels of
educational attainment. Rates of poverty are higher in rural Texas counties relative
to other rural areas in the United States. Indeed, according to recent U.S. Census

8 JOURNAL OF RURAL SOCIAL SCIENCES
TABLE 1. COMPARISON OF U.S. NON-METRO, TEXAS METRO, AND TEXAS NON-
METRO COUNTIES.
SELECTED CHARACTERISTICS
NON-
METRO METRO
U.S.
NON-
METRO
Median age (2010). . . . . . . . . . . . . . . . . . . . . . . . 39.8 36.1 41.5
Percent population age 65+. . . . . . . . . . . . . . . . 17.0 12.8 16.1
Percent population with high school diploma. 75.5 81.6 81.2
Percent population with baccalaureate degree. 15.7 21.3 23.3
Median household income. . . . . . . . . . . . . . . . . $39,779 $47,374 $38,767
Per capita income.. . . . . . . . . . . . . . . . . . . . . . . . $20,447 $23,991 $21,022
Percent living in poverty. . . . . . . . . . . . . . . . . . 19.3 17.3 17.2
Percent non-Hispanic African-American. . . . . 7.9 12.0 8.4
Percent Hispanic. . . . . . . . . . . . . . . . . . . . . . . . . 31.2 38.5 7.5
Percent non-Hispanic white. . . . . . . . . . . . . . . . 59.1 43.6 79.6
Percent non-Hispanic other. . . . . . . . . . . . . . . . 1.9 5.9 4.5
data, some rural counties in Texas have among the highest poverty rates and lowest
per capita incomes in the country (U.S. Census 2010b). For example, some rural
counties in Texas exhibit the highest poverty rates in the country (e.g.,
Starr—39.3% and Zavala—36.3%). Many rural counties in Texas are home to the
highest concentrations of Hispanic Americans in the country—where the resident
population exceeds 95 percent Hispanic.
METHODS
To better understand the perceptions of risk and vulnerability in rural Texas
we used four data collection methods. First, data from the Texas Rural Survey were
used to assess community members’ perceptions of risk regarding nine different
natural hazard types and of community disaster efficacy, and to acquire general
demographic and household information. Second, data from the Spatial Hazard
Events and Losses Database (SHELDUS) (Hazards and Vulnerability Research
Institute 2012) for the United States were used to detail the historical impact of
natural hazards in areas where respondents lived. Third, phone calls to community
PERCEPTIONS OF DISASTER RISK AND VULNERABILITY 9
emergency management professionals in rural communities were made to assess
whether or not emergency management plans were in place in the respondents’
communities. Finally, TIGER Line/Shapefiles from the U.S. Census (2010c) were
coupled with the survey and hazard data to augment the analysis and generate
thematic maps.
Survey Procedure and Respondents
The Texas Rural Survey was a self-administered mail survey conducted from
July 2012 to October 2012. The survey was a 13-page mail-out and included 46
questions relevant to perceptions of rural and urban living, economic development,
public services, health and healthcare issues, and natural disasters. The original
sample included 4,124 randomly selected households living in 22 rural places
throughout Texas. This sample was stratified in two ways. First, to ensure that
various types of rural areas were included in the sample, three types of rural places
were designated according to population size: 499 or fewer, 500–1,999, and
2,000–10,000. Second, seven “Rural Economic Development” regions designated by
the Texas Department of Agriculture were used to ensure geographic
representativeness of the sample. The sampling frame thus included one place in
each of the three population categories for each of the seven regions and an
additional community with a population of less than 499, which was selected from
the western portion of the state.
The survey administration procedure used the Dillman (Dillman, Smyth, and
Christian 2009) tailored design method. First, selected participant households were
mailed an informational letter in both Spanish and English. The letter indicated
that the participants had been randomly selected to participate in a university-
sanctioned research project on rural Texas. One month after receiving the initial
contact letter, the survey questionnaire was sent to the sampled households.
Instructions accompanying the survey indicated that the survey was to be
completed by the adult individual in the household who had most recently
celebrated his/her birthday. Completion of the survey required approximately
40–50 minutes. Two follow-up mailings were sent to sampled households. A total
of 712 completed surveys were returned, providing us a response rate of 17.3
percent. Table 2 provides the demographic characteristics of the respondents.
Compared with Texas as a whole, our sample was substantially older (mean age =
61.75) and disproportionately female (59.9%). It also overrepresented non-Hispanic
whites (85.9%) and married individuals (68.7%). Finally, respondents had higher
levels of educational attainment and were less likely to be employed.

10 JOURNAL OF RURAL SOCIAL SCIENCES
TABLE 2. DEMOGRAPHIC CHARACTERISTICS OF RESPONDENTS (n=712).
VARIABLE PERCENT VARIABLE PERCENT
Gender Race/Ethnicity
Male. . . . . . . . . . . . . . 40.1 American Indian. . . . 1.2
Female. . . . . . . . . . . . 59.9 African-American. . . 0.6
Education Hispanic. . . . . . . . . . . 10.3
Did not complete HS. 5.1 White (non-
Hispanic).. . . . . . . . . .
85.9
High school/GED.. . 19.2 Other. . . . . . . . . . . . . . 2.1
Some college. . . . . . . 26.1 Marital Status
Associate/Vo-tech. . . 8.4 Married. . . . . . . . . . . . 68.7
Bachelor’s degree. . . 21.3 Cohabitation.. . . . . . . 2.7
Post-graduate. . . . . . 19.9 Divorced/Separated. 6.9
Employed Single. . . . . . . . . . . . . 6.9
Yes.. . . . . . . . . . . . . . . 46.9 Widowed. . . . . . . . . . 14.7
Full-time. . . . . . . 38.4 Other. . . . . . . . . . . . . . 0.1
Half-time. . . . . . . 8.5 VARIABLE VALUE
No. . . . . . . . . . . . . . . . . . . 52.9 Median Age 63.0
Questions from the survey that were relevant to natural hazards and disasters
included measures of concern about a disaster type affecting one’s community, the
respondent’s perception regarding the community’s ability to respond to and
recover from a disaster, and whether the respondent had knowledge of a local
disaster management plan. Specifically, a Likert-type question asked “How
concerned are you about the following natural disasters affecting your community?”
Disasters named included drought, dust storms, earthquakes, floods, hurricanes,
landslide/debris flow, wildfire, tornado/wind storm, and severe winter weather.
Response categories for the Likert scale included: not at all concerned; slightly
concerned; moderately concerned; and very concerned.
Measures of perception of community efficacy from the survey included five
Likert-type survey items indicating the respondent’s general impression of the

PERCEPTIONS OF DISASTER RISK AND VULNERABILITY 11
community’s ability to respond to or recover from a disaster (c. f., Benight 2004;
Meyer 2013). Participants were requested to indicate their level of agreement with
the following statements2:
• My community would rapidly distribute resources (labor, money, food)
following a disaster. (Resources)
• People in my community will work well with each other during disaster
recovery. (Work Well)
• Individuals and organizations are ready to respond to the community’s needs
following a disaster. (Organizations)
• Supporting those in greatest need after a disaster would be a priority for my
community. (Support)
• My community would work toward common recovery goals following a
disaster. (Recovery)
Survey responses to questions regarding concern about particular hazard types,
knowledge of a community’s emergency management plan, and perception of a
community’s willingness and ability to respond to a disaster are detailed in the
findings section below.
Natural Hazard Data
The second source of data, SHELDUS, is considered the most comprehensive
inventory of human and material costs associated with disasters occurring in the
United States (Gall, Borden, and Cutter 2009). SHELDUS data used in this
research included 51 years (1960–2010) of hazard impact data recorded at the
county level. Specific measures include: the type (e.g., hurricane, winter weather,
etc.) and number of recorded hazard events affecting residents in a county; inflation-
adjusted value (2012) of property and crop damages from natural hazards in a
county; and injuries and fatalities from natural hazards. The data were downloaded
from the Hazards and Vulnerability Research Institute in the Department of
Geography at the University of South Carolina (Hazards and Vulnerability
Research Institute 2012).
2 Keywords are indicated in parentheses for reference to the discussion of findings in Figure 2.
12 JOURNAL OF RURAL SOCIAL SCIENCES
Emergency Management Plans
Following collection of the survey data, the researchers contacted local
emergency management professionals in the areas surveyed to ascertain whether
or not the sampled rural communities possessed emergency management plans, and
whether those plans were available to the public. Occasionally, web searches
revealed the existence of emergency management plans in an area. In others, direct
contact with local emergency managers was necessary.
U.S. Census Data
Geographic and demographic data from the U.S. Census were acquired via
internet download (U.S. Census 2010c). 2010 TIGER/Line Shapefiles, with
accompanying demographic data, were employed to generate all geographic
analyses in this research.
FINDINGS
In this section, we first detail the overall findings from the Texas Rural Survey
that address the question of what hazard types are of most concern to rural Texans.
Next, we use GIS analyses to clarify the historical impacts of the various hazard
types and address the question of whether risk perception corresponds to historical
impacts. Finally, we present our findings relevant to the relationship between risk
perception, or concern about disasters, and respondents’ perceptions of community
efficacy in responding to disasters.
Concern about Disaster and Historical Impacts
When asked about their level of concern regarding various types of natural
hazards, rural Texans indicated highest concern for drought, wildfires, and
tornadoes, respectively. As a whole, rural Texans indicated relatively low levels of
concern about landslide/debris flows, earthquakes, hurricanes, and floods. Figure
2 illustrates these results.
Statewide concern about disaster types does not necessarily correspond to
historical impacts of these hazards in Texas. Table 3 provides a summary of hazard
impacts for the years 1960–2010 for the state of Texas (Hazard and Vulnerability
Research Institute 2012).3 For example, financial losses from hurricanes are greatest
3Note that data on losses from hazards are considered conservative estimates and that not all
hazards used in the survey are represented in the natural hazard losses provided by SHELDUS.
Specifically, losses from earthquakes, landslides, and dust storms are absent in Table 3.

PERCEPTIONS OF DISASTER RISK AND VULNERABILITY 13
FIGURE 2. NATURAL DISASTER CONCERN: PERCENT MODERATELY OR VERY
CONCERNED
in Texas, with more than $18 billion in property damage and $2.4 billion in crop
damage attributed to hazards of this type. Yet high levels of concern about drought
and tornadoes may not be misplaced. Historically, crop losses from drought exceed
$9 billion, and tornadoes have been especially injurious to residents in Texas and
have cost Texans nearly $10 billion.
Comparing the respondents’ level of concern about flooding and the historical
impacts of floods also indicates that, while Texas has had historically large human
and financial losses from hazards of this type, historical exposure does not
necessarily translate into concern. The same is true regarding winter weather in

14 JOURNAL OF RURAL SOCIAL SCIENCES
TABLE 3. HISTORICAL IMPACTS OF SELECTED HAZARD TYPES IN TEXAS:
1960–2010.
FATALITIES INJURIES
PROPERTY
DAMAGE
(IN MILLIONS)
CROP
DAMAGE
(IN MILLIONS)
Drought. . . . . . . . 0 0 $730 $9,186
Flood. . . . . . . . . . . 684 7,425 $5,030 $1,551
Hurricane. . . . . . . 151 2,884 $18,200 $2,451
Winter weather. . 155 2,257 $628 $541
Tornado/Wind. . 450 7,431 $7,010 $667
Wildfire. . . . . . . . . 18 59 $116 $176
Texas. Winter weather has been historically damaging; however, rural Texans
indicate low levels of concern for this hazard type.
Geographic Information Systems analysis provides more nuanced findings
relevant to a discussion of the relationship between exposure and level of concern
about natural hazards. A comparison of concern about drought and hurricanes and
their historical impacts most clearly illustrates this relationship. While concern
about the drought is widespread in the state, geographically drought has been
localized in the northeastern and southern regions of Texas. Here, historical
impacts do not translate into higher levels of concern. In contradistinction,
historical exposure to hurricanes does translate into heightened levels of concern
about this hazard. Figures 3 and 4 illustrate this relationship.
As the GIS analysis demonstrates, the discrepancy between historical impacts
and level of concern is mediated by both the hazard type and historical
geographically-specific impacts. In Table 4, zero-order correlation coefficients
confirm this finding and indicate that higher levels of concern about flooding,
hurricanes, and winter weather are associated with historical frequency of hazard
events of these types. There is no statistically significant relationship between
historical exposure to drought, tornadoes, and wildfire and level of concern for
these hazard types.4
4Analysis for spatial autocorrelation (Moran’s I) among counties on “number of events” indicates
statistically significant levels of spatial dependence. Respondents in counties with relatively high (or
low) numbers of historical impacts exist in a “neighborhood” of counties with similar hazard profiles.

PERCEPTIONS OF DISASTER RISK AND VULNERABILITY 15
FIGURE 3. FREQUENCY OF DROUGHT AND RESPONDENT CONCERN ABOUT
DROUGHT
FIGURE 4. FREQUENCY OF HURRICANES AND TROPICAL STORMS AND CONCERN
ABOUT HURRICANES
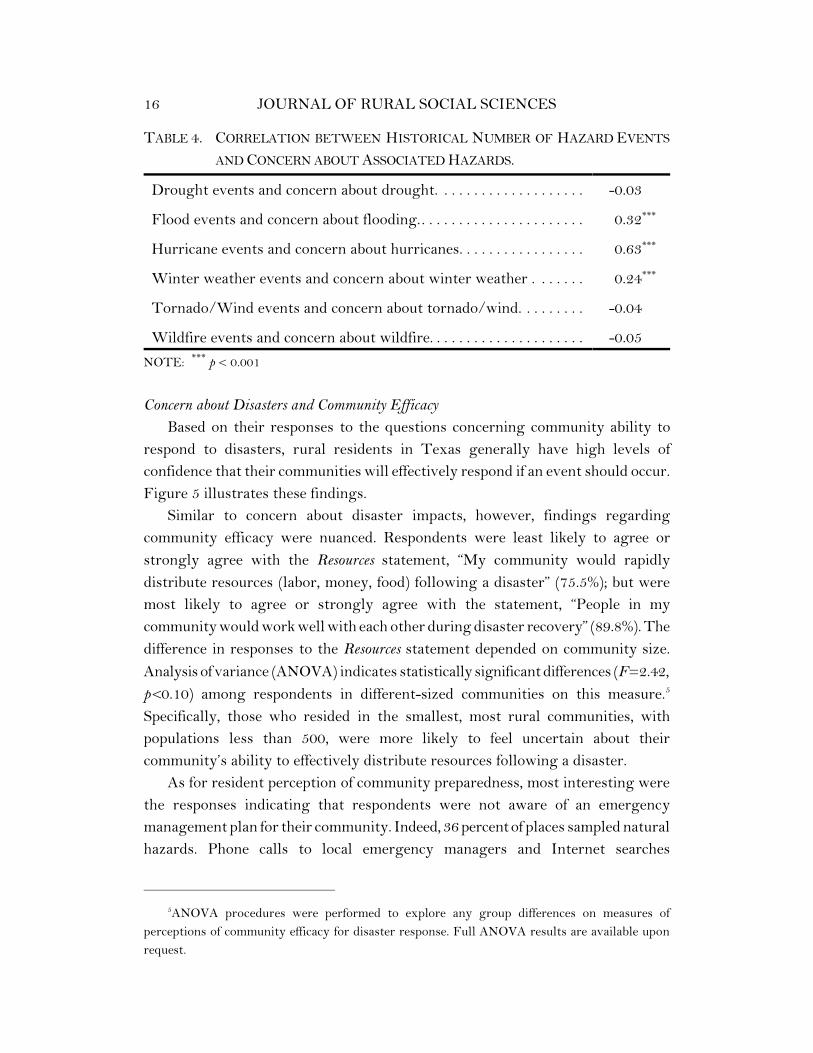
16 JOURNAL OF RURAL SOCIAL SCIENCES
TABLE 4. CORRELATION BETWEEN HISTORICAL NUMBER OF HAZARD EVENTS
AND CONCERN ABOUT ASSOCIATED HAZARDS.
Drought events and concern about drought. . . . . . . . . . . . . . . . . . . . -0.03
Flood events and concern about flooding.. . . . . . . . . . . . . . . . . . . . . . 0.32***
Hurricane events and concern about hurricanes. . . . . . . . . . . . . . . . . 0.63***
Winter weather events and concern about winter weather . . . . . . . 0.24***
Tornado/Wind events and concern about tornado/wind. . . . . . . . . -0.04
Wildfire events and concern about wildfire. . . . . . . . . . . . . . . . . . . . . -0.05
NOTE: *** p < 0.001
Concern about Disasters and Community Efficacy
Based on their responses to the questions concerning community ability to
respond to disasters, rural residents in Texas generally have high levels of
confidence that their communities will effectively respond if an event should occur.
Figure 5 illustrates these findings.
Similar to concern about disaster impacts, however, findings regarding
community efficacy were nuanced. Respondents were least likely to agree or
strongly agree with the Resources statement, “My community would rapidly
distribute resources (labor, money, food) following a disaster” (75.5%); but were
most likely to agree or strongly agree with the statement, “People in my
community would work well with each other during disaster recovery” (89.8%). The
difference in responses to the Resources statement depended on community size.
Analysis of variance (ANOVA) indicates statistically significant differences (F=2.42,
p<0.10) among respondents in different-sized communities on this measure.5
Specifically, those who resided in the smallest, most rural communities, with
populations less than 500, were more likely to feel uncertain about their
community’s ability to effectively distribute resources following a disaster.
As for resident perception of community preparedness, most interesting were
the responses indicating that respondents were not aware of an emergency
management plan for their community. Indeed, 36 percent of places sampled natural
hazards. Phone calls to local emergency managers and Internet searches
5ANOVA procedures were performed to explore any group differences on measures of
perceptions of community efficacy for disaster response. Full ANOVA results are available upon
request.

PERCEPTIONS OF DISASTER RISK AND VULNERABILITY 17
FIGURE 5. PERCEPTIONS OF COMMUNITY PREPAREDNESS: PERCENT AGREE OR
STRONGLY AGREE WITH PREPAREDNESS STATEMENTS
indicated that all areas sampled did have a formal emergency management plan in
place at the time of the survey.
As with the perception that the community would not be able to rapidly
distribute resources following a disaster, knowledge of a community’s disaster plan
depended on community size. ANOVA indicates a statistically significant effect of
community size on knowledge of a disaster plan (F=26.56, p<0.0001). Figure 6
illustrates this relationship. When viewed by size of place, more than 60 percent of
residents in the smallest population category were unaware of local disaster plans.
While many residents did not have knowledge of the disaster plan, this did not
mean that residents believed their community was ill-prepared for a disaster. In fact
the data indicate the opposite. Point-biserial correlations between knowledge of the
plan and perceptions of community efficacy indicate that residents who perceived
high levels of community efficacy in response to disaster were less likely to have
knowledge of their community’s local disaster plans (see Table 5). The converse is
also true. Respondents who indicated knowledge of a disaster management plan

18 JOURNAL OF RURAL SOCIAL SCIENCES
FIGURE 6. AWARENESS OF LOCAL DISASTER MANAGEMENT PLAN AND SIZE OF
COMMUNITY
TABLE 5. POINT-BISERIAL CORRELATION BETWEEN MEASURES OF COMMUNITY
EFFICACY AND KNOWLEDGE OF DISASTER PLAN.
Resources. . . . . . . . . . . . . . . . . . . . . . . . . . . . . . . . . . . . . . . . . . . . . . . -0.33***
Work well. . . . . . . . . . . . . . . . . . . . . . . . . . . . . . . . . . . . . . . . . . . . . . . -0.33***
Organizations. . . . . . . . . . . . . . . . . . . . . . . . . . . . . . . . . . . . . . . . . . . . -0.41***
Support. . . . . . . . . . . . . . . . . . . . . . . . . . . . . . . . . . . . . . . . . . . . . . . . . -0.28***
Recovery. . . . . . . . . . . . . . . . . . . . . . . . . . . . . . . . . . . . . . . . . . . . . . . . -0.34***
NOTE: ***p < 0.001
usually indicated lower levels of confidence that their community would respond
well during a disaster event.
The final question addressed by this analysis concerns the relationship between
respondents’ perception of community efficacy and their concern about disaster.
That is, since different hazard types typically upset routine community functioning

PERCEPTIONS OF DISASTER RISK AND VULNERABILITY 19
in different ways, there ought to be some relationship between levels of concern
about different disaster types and perceptions of community efficacy. Are people
more likely to be concerned about hazards if they are uncertain that their
community is prepared to deal with them? To evaluate this relationship, zero-order
correlations were calculated among the items measuring level of concern about
disaster types and measures of community efficacy. Findings from this analysis are
available in Table 6.
TABLE 6. CORRELATION BETWEEN LEVEL OF CONCERN AND PERCEPTIONS OF
COMMUNITY EFFICACY.
RESOURCES
WORK
WELL PEOPLE SUPPORT RECOVERY
Drought. . 0.07* 0.02 0.13*** 0.03 0.07*
Dust. . . . . . 0.02 0.06 0.06 0.07* 0.04
Earthquake. 0.05 0.04 0.03 0.01 0.03
Flood. . . . . 0.07 0.04 0.04 0.05 0.05
Hurricane. 0.04 0.03 0.00 0.00 0.00
Landslide.. 0.05 0.06 0.05 0.08* 0.08
Fire. . . . . . 0.02 0.00 0.10** 0.05 0.05
Tornado. . 0.01 0.00 0.07* 0.02 0.01
Winter. . . . 0.04 0.02 0.05 0.04 0.01
NOTE: *p < 0.10; **p < 0.05; ***p < 0.01
As Table 6 illustrates, there are few meaningful relationships among survey
items measuring level of concern for specific types of hazards and perceptions of
community efficacy. Several exceptions are notable. First, there are small, but
statistically significant positive relationships between uncertainty of community
responses for the items Resources, People, and Recovery and concern about drought.
That is, on average, respondents who indicated high concern about drought also did
not agree with the statements “My community would rapidly distribute resources
following a disaster,” “Individuals and organizations are ready to respond to the
community’s needs following a disaster,” and “My community would work toward
common recovery goals following a disaster.” Similar positive relationships exist
among the following items: Support and concern about dust storms; Resources and

20 JOURNAL OF RURAL SOCIAL SCIENCES
concern about flooding; Support and Recovery and concern about landslides; People
and concern about fire; and People and concern about tornadoes. In sum, there are
some relationships between level of concern about disasters and perceptions of
community efficacy. That is, regarding some variables, people are more likely to be
concerned about certain hazards if they are uncertain that their community is
prepared to deal with them.
A final question regarding respondents’ level of concern for disasters addresses
the relationship between risk perception and knowledge of a community’s
emergency management plan. Specifically, does knowledge of a community
emergency plan correlate with concern? As Table 7 illustrates, there is some
relationship between these measures. For drought, higher levels of concern are
associated with not having knowledge of a local emergency management plan. In
contrast, higher levels of concern for flooding and hurricanes were associated with
knowledge of an emergency management plan.
TABLE 7. POINT-BISERIAL CORRELATION BETWEEN KNOWLEDGE OF DISASTER
PLAN AND CONCERN ABOUT DISASTER.
KNOWLEDGE OF DISASTER PLAN
Drought. . . . . . . . . . . . . . . . . . . . . . . . . . . . . -0.10***
Dust. . . . . . . . . . . . . . . . . . . . . . . . . . . . . . . . . 0.00
Earthquake. . . . . . . . . . . . . . . . . . . . . . . . . . . 0.01
Flood. . . . . . . . . . . . . . . . . . . . . . . . . . . . . . . . 0.10**
Hurricane. . . . . . . . . . . . . . . . . . . . . . . . . . . . 0.08*
Landslide.. . . . . . . . . . . . . . . . . . . . . . . . . . . . 0.01
Fire. . . . . . . . . . . . . . . . . . . . . . . . . . . . . . . . . -0.02
Tornado. . . . . . . . . . . . . . . . . . . . . . . . . . . . . -0.03
Winter. . . . . . . . . . . . . . . . . . . . . . . . . . . . . . . -0.03
NOTE: *p < 0.10; **p < 0.05; ***p < 0.01
In the next section we provide an overview of these findings and discuss their
relevance to literature on disaster risk, risk perception, and vulnerability in rural
settings.
PERCEPTIONS OF DISASTER RISK AND VULNERABILITY 21
DISCUSSION
A summary of our findings is relevant to a discussion of the three central
questions proposed by this research. First, what types of disasters and natural
hazards are of greatest concern to rural Texans? Second, do these concerns
correspond with historical disaster impacts? Third, how do risk perceptions
correlate with the perception of the community efficacy in responding to disaster?
Perceptions of Risk
Concerning our first question, residents of rural Texas are most concerned
about drought, wildfires, and tornadoes. The concern about both drought and
wildfires is exceptional and we believe this is indicative of rural life overall as these
disaster types are more disruptive to rural areas than they are to urban ones.
Nevertheless, these findings need to be considered in the context of the effects of
“social history.” The Texas Rural Survey was administered between July and
October of 2012, a period when much of Texas was gripped by an exceptional
drought. Indeed, the Texas drought of 2010-2012 garnered national headlines as
farmers and communities struggled to cope with livestock and crop losses and
providing water to their communities (e.g., Nielsen-Gammon 2012). The effects of
this drought did not simply affect water supply and economic activity associated
with it. The Texas drought created what disaster researchers often call a “complex
emergency,” where social and ecological disasters converge to multiply stress on the
community (see Mileti 1999). Here, the exceptional Texas drought also created
conditions whereby wildfires became ubiquitous throughout the state.
In September and October of 2011, Texas experienced its worst wildfire to date,
the Bastrop County Complex Fire, which burned more than 36,000 acres and
destroyed nearly 1,700 homes. In fact, the 2011 fire season in Texas is now
considered the worst wildfire season on record in the state, with more than 31,000
wildfires recorded that year (Jones, Saginor, and Smith 2013). The combination of
an exceptional drought and an explosive 2011 wildfire season may have heightened
concern about wildfire and drought as respondents utilized an “availability
heuristic” (Slovic, Fischhoff, and Lichtenstein 1979; Tversky and Kahneman 1973)
when assessing risks associated with these disaster types. The use of availability
when assessing risks means that people may judge an event as likely or common if
its associated dangers are readily available in memory recall.
An additional comment regarding perceptions of risk about tornadoes is also
necessary. Texas is known to have historically experienced several very damaging
tornadoes. However, the damage, injuries, and loss of life associated with these
22 JOURNAL OF RURAL SOCIAL SCIENCES
events are generally concentrated in the northern part of the state. Even so,
respondents throughout the state indicated concern about this hazard type.
Curiously, both 2011 and 2012 were very quiet years for tornado activity in Texas
(National Climatic Data Center 2013) and this, by itself, may challenge the notion
that respondents utilize an availability heuristic when responding to questions
about disaster risk. However, other parts of the country experienced an
extraordinary tornado season in 2011 and the early part of 2012; and those events
were widely publicized (Cohen 2011; Rice 2012). Most notable was the Joplin,
Missouri tornado in May of 2011 that took the lives of 158 people and injured more
than 1,000 (National Climatic Data Center 2013). Therefore, the notion of the
availability heuristic may not be exclusively associated with physical proximity, but
may also be influenced by the extent of media coverage (c. f., af Wåhlberg and
Sjöberg 2000).
Disaster Consciousness
The second question posed by this research asked whether participants’ concern
about different disaster types corresponded to historical disaster impacts near
participants’ residences. That is, does a community’s or a neighboring community’s
exposure to natural hazards create a “disaster consciousness?” Findings indicated
that perception of risk, or level of concern, was associated with historical impacts
for flooding, winter weather, and hurricanes; but there was no relationship between
level of concern and historical impacts related to tornadoes, wildfires, and drought.
Perception of disaster risk is an important predictor of whether people take
precautionary measures or act to mitigate the effects of a disaster (Growthman and
Reusswig 2006; Lindell 2000). The intellectual field of risk perception is replete
with research investigating the complex interaction of individual psychosocial
factors and experience and its effect on risk perception (e.g., Loewenstein et al.
2001; Whitmarsh 2006). While our research does not directly examine the
psychosocial predictors of risk perception, it does seek to explore the relationship
between the geography of hazard and its possible effects on risk perception.
Previous research has shown that disaster characteristics (e.g., its size or type) and
experience with specific disasters influence whether people believe they are at risk
(Ho et al. 2008). As our findings suggest, however, living in hazardous regions may
influence perceptions of certain risks but not others. Clearly, more research is
needed to understand why relationships between risk perceptions and the
geography of hazard exist for some hazard types but not others.

PERCEPTIONS OF DISASTER RISK AND VULNERABILITY 23
Perceptions of Risk and Community Efficacy
Relevant to our third question, overall, residents in rural Texas indicated high
levels of confidence in their community’s ability to effectively respond to a disaster
event. Our analysis revealed that respondents who expressed uncertainty about
community efficacy were also more likely to voice concern for specific hazards. Lack
of awareness of a local emergency plan seemed to correlate with higher levels of
concern for drought alone. Direct knowledge of a local emergency management
plan, however, was associated with higher levels of concern for floods and
hurricanes. These mixed findings may be the result of the question’s wording.
Residents were asked about their knowledge of a ‘local disaster plan.’ This phrasing
is problematic since plans typically exist only at the county level so residents
outside the county seats may be unlikely to be aware of plans. This would explain
why many respondents were unaware of emergency management plans and
presumably did not know how their local community would fit into the county plan
in case of an emergency, although all counties represented in the sample reported
having emergency management plans. Furthermore, as Scott, McSpirit, and
Hardesty (2012) found in their analysis of emergency planning in rural West
Virginia and Kentucky, knowledge of a disaster management plan does not translate
into the perception of community preparedness. Our findings indicate similarly that
having a local disaster response plan does not translate into perceptions of high
community efficacy in response to disaster.
Further research on rural emergency preparedness is needed but clearly, if rural
residents are not aware of emergency plans, it is improbable that they know what
to do in case of an emergency. Rural residents may have planned on an individual
or household level; but they may not be aware of shelters, supplies, services,
evacuation routes, advisories, information sources, and so on if they are not apprised
of emergency plans in place for their areas. These findings point to a need for more
effective emergency preparedness communication strategies targeting rural
populations.
Limitations
This research has several limitations that are worth noting. As was mentioned
previously, perceptions of risk may be colored by the availability heuristic used by
participants in assessing their levels of concern about different disaster types.
Moreover, it is unclear if participants were, during the data collection period,
personally affected by disasters. A second limitation of the research involves the
relationship between historical disaster impacts and risk perceptions. Some disaster
24 JOURNAL OF RURAL SOCIAL SCIENCES
types are highly localized (e.g., landslides) while others may be widespread (e.g.,
drought). Previous research indicates that a disaster’s scope does have the potential
to color perceptions of individual risk (Ho et al. 2008). Our assessment of
participants’ risk perception does not account for whether participants believed
these events would affect them or the community as a whole.
Another limitation of this study is related to the characteristics of our sample.
Respondents do not accurately represent rural Texas residents. Given that the
people in the sample are more likely to be non-Hispanic white, more financially
secure, more educated, and older than average for rural Texas, the results may be
skewed toward less concern and more confidence in local governmental capacity for
emergency response. However, since most of the respondents were women and
women typically indicate higher levels of concern about risk, some discrepancy may
be mediated. Finally, a low response rate on the survey remains a core weakness of
the study. Further research should seek to remedy these limitations.
First, a longitudinal assessment of risk perceptions among rural Texas residents
might address whether and to what extent salient events such as fire and drought
influence survey responses about these types of hazards. Second, to address whether
respondents had been personally affected by a disaster and whether such
experiences have the potential to influence responses to survey questions, additional
questions could be added to future surveys asking whether and how respondents
had been affected. Third, to account for the difference in the demographic
composition of the sample relative to the composition of the counties from which
the samples were taken, future survey research might consider oversampling
underrepresented groups such as Hispanics and nonwhite rural residents. Finally,
although low response rates are common in mail survey research (Kanuk and
Berenson 1975), options for online survey participation or additional monetary
incentives might be provided to increase the response rate for future surveys.
CONCLUSIONS
Research into perceptions of disaster risk and vulnerability to disasters in rural
settings demonstrates that “ruralness,” broadly defined, has important consequences
for those living in disaster-prone areas. Rural areas and their residents are uniquely
vulnerable to certain disaster types such as drought and wildfires—disasters that
have the potential to undercut the economic vitality of rural areas. Further,
individual and community-level characteristics of those who reside in rural areas
make them “socially vulnerable” to the effects of disasters. Characteristics such as

PERCEPTIONS OF DISASTER RISK AND VULNERABILITY 25
high poverty rates; lower income; and a lack of adequate infrastructure, resources,
or political clout all increase rural residents’ vulnerability to disasters.
Residents of rural Texas are characteristically different from their urban
counterparts and from other rural areas in the United States. Many of these
differences can be highlighted as characteristics that increase resident and
community social vulnerability to disaster. As this research has shown, the
relationship between disaster risk perceptions and historical disaster impacts is
complex. These perceptions of risk are not only associated with historical
experiences with specific hazards, but are also colored by the unique threat to rural
communities that drought and wildfire represent. As our findings indicate,
perception of community efficacy in responding to disasters may also be related to
levels of concern about hazards—but this relationship varies across hazards. On
some of these variables, size of place may be correlated with community
efficacy—with residents in smaller rural places expressing more doubt about
communities’ abilities to distribute resources. Size of place is also important in the
awareness of emergency management plans, as residents in the smallest rural areas
were least likely to report awareness of plans. Curiously, residents’ knowledge of
a community disaster plan was not associated with a perception that the community
could effectively respond to disaster events. This finding is especially relevant to a
discussion of rural community resilience.
Community resilience is fundamentally about the ability to absorb or recover
from an interruption of normal community functioning. Given rural resilience,
various models have been proposed to clarify the environmental and institutional
factors that increase a community’s capacity to respond to disruption (e.g., Wilson
2010). Our research has highlighted one of these factors in rural Texas—social
capital. While rural communities may be uniquely vulnerable to effects of a natural
disaster, this does not mean they are unable to respond or recover. We propose that
respondents who viewed their communities as effective responders to disasters are
indicating high levels of trust in their community. High levels of trust among
community members is often cited as facilitating effective response and recovery
following disaster (e.g., Aldrich 2012). As such, community planning for natural
disasters in rural areas should deliberately focus on facilitating the use of
community trust in their response and recovery activities.
Although the results of the current study are helpful in highlighting the
importance and complexity of rural areas, the results raise many questions. More
research needs to be done to explore relationships among hazards, risk perception,
and disaster preparedness in rural areas. Are rural residents preparing individually

26 JOURNAL OF RURAL SOCIAL SCIENCES
or planning with neighbors for disasters? What are the perceptions of risk for
technological hazards in rural areas? Disasters will clearly continue to affect rural
areas. Ascertaining answers to these and other questions, and sharing this
knowledge with local emergency managers and community members, may do much
to increase the resilience of communities affected by disasters in rural areas.
AUTHOR BIOGRAPHIES
Andrew J. Prelog is Assistant Professor in the Department of Sociology at Sam
Houston State University. His research interests include environmental sociology,
social responses to natural and technological hazards, and environmental justice.
(Email: [email protected])
Lee M. Miller is Associate Professor in the Department of Sociology at Sam
Houston State University. Her research interests include community responses to
disasters and risk perception related to natural and technological hazards,
particularly in rural contexts. (Email: [email protected])
REFERENCES
af Wåhlberg, Anders and Lennart Sjöberg. 2000. “Risk Perception and the Media.”
Journal of Risk Perception 3(1):31–50.
Aldrich, Daniel P. 2012. Building Resilience: Social Capital in Post-disaster Recovery.
Chicago, IL: The University of Chicago Press.
Alston, Margaret. 2007. “‘It’s Really Not Easy to Get Help’: Services to Drought-
affected Families.” Australian Social Work 60(4):421–35.
Benight, Charles C. 2004. “Collective Efficacy Following a Series of Natural
Disasters.” Anxiety, Stress, and Coping 17(4):401–20.
Brennan, M. A. and Courtney G. Flint. 2007. “Uncovering the Hidden Dimensions
of Rural Disaster Mitigation: Capacity Building through Community
Emergency Response Teams.” Southern Rural Sociology 22(2):111–26.
Burton, Ian, Robert W. Kates, and Gilbert F. White. 1993. The Environment as
Hazard. New York, NY: Guildford.
Cannon, Terry. 1990. “A Hazard Need Not a Disaster Make: Rural Vulnerability
and the Causes of 'Natural' Disasters.” Pp. 92–105 in Natural Disasters: Protecting
Vulnerable Communities, edited by P. A. Merriman and C. W. A. Browitt.
London, UK: Redwood Books.
Cohen, Noam. 2011. “Tornado Strikes Missouri City, Hitting a Hospital and Killing
Many.” New York Times, May 23, p. A14.

PERCEPTIONS OF DISASTER RISK AND VULNERABILITY 27
Cross, John A. 2001. “Megacities and Small Towns: Different Perspecitives on
Hazard Vulnerability.” Environmental Hazards 3(2):63–80.
Cutter, Susan L., Bryan J. Boruff, and W. Lynn Shirley. 2003. “Social Vulnerability
to Environmental Hazards.” Social Science Quarterly 84(2):242–61.
Cutter, Susan L. and Christopher Emrich. 2005. “Are Natural Hazards and Disaster
Losses in the U.S. Increasing?” Eos Transactions American Geophysical Union
86(41):381–96.
Dillman Don A., Jolene D. Smyth, and Leah Melani Christian. 2009. Internet, Mail,
and Mixed-mode Surveys: A Tailored Design Method. Hoboken, NJ: John Wiley &
Sons, Inc.
Donner, William R. 2007. “The Political Ecology of Disaster: An Analysis of
Factors Influencing U.S. Tornado Fatalities and Injuries, 1998–2000.”
Demography 44(3):669–85.
Erikson, Kai T. 1994. A New Species of Trouble. New York, NY: W.W. Norton.
Fatti, Christina Elizabeth and Zarina Patel. 2013. “Perceptions and Responses to
Urban Flood Risk: Implications for Climate Governance in the South.” Applied
Geography 36:13–22.
Flint, Courtney G. 2004. “Community Response to Forest Disturbance on Alaska’s
Kenai Peninsula.” PhD dissertation, Department of Agricultural Economics,
Sociology, and Education, The Pennsylvania State University, University Park.
Flint, Courtney G. and M. A. Brennan. 2007. “Rural Communities and Disasters:
Research from the Southern United States.” Southern Rural Sociology 22(2):1–5.
Flint, Courtney and A. E. Luloff. 2005. “Natural Resource-based Communities,
Risk, and Disaster: An Intersection of Theories.” Society and Natural Resources
18(5):399–412.
Gall, Melanie, Kevin A. Borden, and Susan L. Cutter. 2009. “When Do Losses
Count? Six Fallacies of Natural Hazards Loss Data.” Bulletin of the American
Meteorological Society 90(6):799–809.
Grothmann, Torsten and Fritz Reusswig. 2006. “People at Risk of Flooding: Why
Some Residents Take Precautionary Action While Others Do Not.” Natural
Hazards 38(1-2):101–20.
Halpern-Felsher, Bonnie L., Susan G. Millstein, Jonathan M. Ellen, Nancy E. Adler,
Jeanne M. Tschann, and Michael Biehl. 2001. “The Role of Behavioral
Experience in Judging Risks.” Health Psychology 20(2):120–6.
Hazards and Vulnerability Research Institute. 2012. The Spatial Hazard Events and
Losses Database for the United States. Version 12.0 [Online Database]. Columbia,
SC: University of South Carolina. Retrieved June 8, 2013
(http://www.sheldus.org).

28 JOURNAL OF RURAL SOCIAL SCIENCES
Hewitt, Kenneth. 2000. “Safe Place or ‘Catastrophic Society?’ Perspectives on
Hazards and Disasters in Canada.” The Canadian Geographer 44(4):325–41.
Ho, Ming-Chou, Diagee Shaw, Shuyen Lin, and Yao-Chu Chiu. 2008. “How Do
Disaster Characteristics Influence Risk Perception?” Risk Analysis 28(3):635–43.
Insurance Council of Texas. 2009. “Texas Led Nation in Catastrophic Losses in
2008.” Insurance Journal, Janurary 21. Retrieved June 14, 2013
(http://www.insurancejournal.com/news/southcentral/2009/01/21/97119.
htm).
_______. 2010. “Texas Catastrophic Weather Losses Totaled $2.5B in 2009.”
Insurance Journal , Feburary 25. Retrieved June 14, 2013
(http://www.insurancejournal.com/news/southcentral/2010/02/25/107677
.htm)
Johnson, Kenneth. 2006. “Demographic Trends in Rural and Small Town America.”
Reports on Rural America 1(1). Durham, NH: The Carsey Institute, University
of New Hampshire.
Jones, Eric C., Albert J. Faas, Arthur D. Murphy, Graham A. Tobin, Linda M.
Whiteford, and Christopher McCarty. 2013. “Cross-cultural and Site-based
Influences on Demographic, Well-being, and Social Network Predictors of Risk
Perception in Hazard and Disaster Settings in Ecuador and Mexico.” Human
Nature 24(1):5–32.
Jones, Justice, April Saginor, and Brad Smith. 2013. 2011 Texas Wildfires: Common
Denominators of Home Destruction. College Station, TX: Texas A&M Forest
Service.
Kanuk, Leslie and Conrad Berenson. 1975. “Mail Surveys and Response Rates: A
Literature Review.” Journal of Marketing Research 12(4):440–53.
Lindell, Michael K. 2000. “Household Adjustment to Earthquake Hazard: A Review
of Research.” Environment and Behavior 32(4):461–501.
Lindell, Michael K. and David J. Whitney. 2000. “Correlates of Household Seismic
Hazard Adjustment Adoption.” Risk Analysis 20(1):13–25.
Loewenstein, George F., Elke U. Weber, Christopher K. Hsee, and Ned Welch.
2001. “Risk as Feelings.” Psychological Bulletin 127(2):267–86.
MacLeod, Colin and Lynlee Campbell. 1992. “Memory Accessibility and Probability
Judgments: An Experimental Evaluation of the Availability Heuristic.” Journal
of Personality and Social Psychology 63(6):890–902.
Mason, Robyn. 2011. “Confronting Uncertainty: Lessons from Rural Social Work.”
Australian Social Work 64(3):377–94.
PERCEPTIONS OF DISASTER RISK AND VULNERABILITY 29
McSpirit, Stephanie, Shauna Scott, Duane Gill, Sharon Hardesty, and Dewayne
Sims. 2007. “Risk Perceptions after a Coal Waste Impoundment Failure: A
Survey Assessment.” Southern Rural Sociology 22(2):83–110.
Meyer, Michelle Annette. 2013. “Social Capital and Collective Efficacy for Disaster
Resilience: Connecting Individuals with Communities and Vulnerability with
Resilience in Hurricane-prone Communities in Florida.” PhD dissertation,
Department of Sociology, Colorado State University, Fort Collins.
Miceli, Renato, Igor Sotgiu, and Michele Settanni. 2007. “Disaster Preparedness
and Perception of Flood Risk: A Study in an Alpine Valley in Italy.” Journal of
Environmental Psychology 28(2):164–73.
Mileti, Dennis S. 1999. Disasters by Design: A Reassessment of Natural Hazards in the
United States. Washington DC: Joseph Henry Press.
Miller, Lee M. 2007. “Collective Disaster Responses to Katrina and Rita: Exploring
Therapeutic Community, Social Capital, and Social Control.” Southern Rural
Sociology 22(2):45–63.
_______. 2012. “Women and Risk: Commercial Wastewater Injection Wells and
Gendered Perceptions of Risk.” Pp. 91–104 in Risk and Social Theory in
Environmental Management, edited by T. Measham and S. Lockie. Collingwood
VIC, Australia: CSIRO Publishing.
National Climatic Data Center. 2013. “U.S. Tornado Overview–2011” U.S. Tornado
Climatology. Retrieved June 8, 2013. (http://www.ncdc.noaa.gov/oa/climate/
severeweather/tornadoes.html#deadly).
Nielsen-Gammon, John. 2012. “Texas Drought 2012: An Update from UT.” The
Houston Chronicle Online, February 13 (http://blog.chron.com/climateabyss/
2012/02/texas-drought-2012-an-update-from-ut/).
Peacock, Walter G., Samuel D. Brody, and Wes Highfield. 2005. “Hurricane Risk
Perceptions among Florida’s Single family homeowners.” Landscape and Urban
Planning 73(2-3):120–35.
Prelog, Andrew J. 2012. “Longitudinal and Geographic Analysis of the Relationship
between Natural Disasters and Crime in the United States.” PhD dissertation,
Department of Sociology, Colorado State University, Fort Collins.
Rice, Doyle. 2012. “2012 Off to Furious Start in Tornadoes.” USA Today Online,
Janurary 31 (http://usatoday30.usatoday.com/weather/storms/tornadoes/
story/2012-01-30/january-tornado/52893512/1).
Ritchie, Liesel. and Duane Gill. 2007. “Social Capital Theory as an Integrating
Theoretical Framework in Technological Disaster Research.” Sociological
Spectrum 27(1):103–29.
30 JOURNAL OF RURAL SOCIAL SCIENCES
Saenz, Rogelio and Walter Peacock. 2006. “Rural People, Rural Places: The Hidden
Costs of Hurricane Katrina” Rural Realities. 1(2):1–11.
Scott, Shaunna L., Stephanie McSpirit, and Sharon Hardesty. 2012. “Coal Waste
Emergency Planning in West Virginia and Kentucky.” Journal of Appalachian
Studies 18(1-2):149–75.
Siegrist, Michael and Heinz Gutscher. 2006. “Flooding Risks: A Comparison of Lay
People’s Perceptions and Expert’s Assessments in Switzerland.” Risk Analysis.
26(4):971–9.
Sjöberg, Lennart. 1998. “Worry and Risk Perception” Risk Analysis 18(1):85–93.
Slovic, Paul. 1987. “Perceptions of Risk.” Science 236(4799):280–5.
Slovic, Paul, Baruch Fischhoff, and Sarah Lichtenstein. 1979. “Rating the Risks.”
Environment Science and Policy for Sustainable Development 21(3):14–39.
Smith, Adam B. and Richard W. Katz 2013. “U.S. Billion-dollar Weather and
Climate Disasters: Data Sources, Trends, Accuracy, and Biases.” Natural
Hazards 67(2):387–410.
Texas Department of State Health Services. 2013. “County Designations.” Center
for Health Statistics, Health Professions Resource Center. Retrieved June 21,
2013 (http://www.dshs.state.tx.us/chs/hprc/countable.shtm).
Thomas, Deborah S. K., Brenda D. Phillips, William E. Lovekamp, and Alice
Fothergill, eds. 2013. Social Vulnerability to Disasters. 2nd ed. Boca Raton, FL:
CRC Press.
Tversky, Amos and Daniel Kahneman. 1973. “Availability: A Heuristic for Judging
Frequency and Probability” Cognitive Psychology 5(2):207–32.
U.S. Census Bureau. 2010a. “Annual Estimates of Resident Population.”
Washington, DC: U.S. Census Bureau, Population Division, U.S. Department
of Commerce. Retrieved June 21, 2013 (http://factfinder2.census.gov/faces/
tableservices/jsf/pages/productview.xhtml?pid=DEC_10_SF1_P2&prodTy
pe=table).
_______. 2010b. “Small Area Income and Poverty Estimates.” Washington, DC:
U.S. Census Bureau, U.S. Department of Commerce.
_______. 2010c. “TIGER Line/Shapefiles and TIGER/Line Files.” Washington,
DC: U.S. Census Bureau, U.S. Department of Commerce. Retrieved June 21,
2013 (https://www.census.gov/geo/maps-data/data/tiger-line.html).
U.S. Office of Management and Budget. 2010. 2010 Standards for Delineating
Metropolitan and Micropolitan Statistical Areas; Notice. Federal Register. National
Archives and Records Administration. Retrieved July 26, 2013

PERCEPTIONS OF DISASTER RISK AND VULNERABILITY 31
(http://www.whitehouse.gov/sites/default/files/omb/assets/fedreg_2010/0
6282010_metro_standards-Complete.pdf).
Viscusi, W. Kip and Richard J. Zechhauser. 2006. “National Survey Evidence on
Disasters and Relief: Risk Beliefs, Self-interest, and Compassion.” Journal of Risk
and Uncertainty 33(1-2):13–36.
Weisner, Ben, Piers Blaikie, Terry Cannon, and Ian Davis. 2004. At Risk: Natural
Hazards, People's Vulnerability, and Disasters. New York, NY: Routledge.
Whitmarsh, Lorraine. 2006. “Are Flood Victims More Concerned about Climate
Change than Other People? The Role of Direct Experience in Risk Perception
and Behavioural Response.” Journal of Risk Research 11(3):351–74.
Wilson, Geoff. 2010. “Multifunctional ‘Quality’ and Rural Community Resilience.”
Transactions of the Institute of British Geographers 35(3):364–81.
Yamamura, Eiji. 2012. “Experience of Technological and Natural Disasters and
Their Impact on Perceived Risk of Nuclear Accidents after the Fukushima
Nuclear Disaster in Japan 2011: A Cross-country Analysis.” The Journal of
Socio-Economics 41(4):360–3.