perceived readiness of jamaican community college … · perceived readiness of jamaican community...
TRANSCRIPT
PERCEIVED READINESS OF JAMAICAN COMMUNITY COLLEGE
STUDENTS FOR POSTCOLLEGE GOALS
by
DAWN V. SMITH-HENRY
(Under the Direction of Jay W. Rojewski)
ABSTRACT
Concerns have been raised about how effectively Jamaica‘s community colleges prepare
students for academic transfer and career transition. This survey study examined the extent that
involvement, personal characteristics, and college-related variables predicted students‘
perceptions of their readiness for postcollege goals. The study investigated 11 predictors—class
involvement, involvement in extracurricular activities, age, gender, employment status, family
responsibilities, mother education, father education, enrollment, academic major, satisfaction
with college—and two outcome variables, i.e., perceived readiness for work, and perceived
readiness for higher education.
The study‘s conceptual framework was developed from Astin‘s (1984) student
involvement theory, Pace‘s (1984) student development model, and Tinto‘s (1975, 1993) student
departure theory. Based on these theories, it was hypothesized that class and extracurricular
involvement would be important factors in predicting student perceptions of readiness for work
and higher education goals. Descriptive statistics and regression analyses were used to analyze
data from a criterion-based convenience sample of 554 full- and part-time final-year students.
The students were enrolled in four majors—business, hospitality, computer, architecture and
construction—at seven public community colleges in Jamaica.
Higher education was the chief postcollege goal. Involvement variables were the best
overall predictors of perceived readiness for higher education and work. Class involvement was a
stronger predictor than extracurricular involvement. Student age and mother‘s education were the
only statistically significant personal characteristics variables. Satisfaction with college was the
only significant college-related variable for predicting perceptions of readiness for higher
education. Based on these findings, recommendations for practice, policy, and future research
were proposed.
INDEX WORDS: Academic Transfer, Career Transition, Involvement, Postcollege Goals,
Perceived Readiness, Jamaica Community College

PERCEIVED READINESS OF JAMAICAN COMMUNITY COLLEGE
STUDENTS FOR POSTCOLLEGE GOALS
by
DAWN V. SMITH-HENRY
BA, University of the West Indies, Jamaica, 1985
MSc.Ed., Southern Illinois University, 2000
A Dissertation Submitted to the Graduate Faculty of The University of Georgia in Partial
Fulfillment of the Requirements for the Degree
DOCTOR OF PHILOSOPHY
ATHENS, GEORGIA
2011

© 2011
Dawn V. Smith-Henry
All Rights Reserved

PERCEIVED READINESS OF JAMAICAN COMMUNITY COLLEGE
STUDENTS FOR POSTCOLLEGE GOALS
by
DAWN V. SMITH-HENRY
Major Professor: Jay W. Rojewski
Committee: Bettye P. Smith
Myra N. Womble
Thomas Valentine
Electronic Version Approved:
Maureen Grasso
Dean of the Graduate School
The University of Georgia
August 2011
iv
DEDICATION
This document is dedicated to past and present students of Jamaica‘s community
colleges, including those who have successfully transferred into higher education and the
workforce, those preparing for these transitions, and those who have felt disenchanted by
obstacles in the tertiary education system. It is a call to united action by all who have a vested
interest in tertiary education—community college and university educators, administrators,
program planners, policy makers, employers—to remove the barriers to a meaningful and
relevant tertiary education experience. Such action is needed if Jamaicans are to be effectively
and efficiently prepared for the workforce.
v
ACKNOWLEDGEMENTS
I give thanks and praise to my Lord and Savior, Jesus Christ, whose strength and wisdom
has undergirded me throughout this dissertation process. My journey from Jamaica to Athens,
Georgia, has been by His design. To Him be all the glory!
I would like to express grateful thanks for the guidance and support provided by my
committee. Thank you, Dr. Rojewski, for serving as my advisor and major professor. I have
learned a lot from your insightful critique, attention to methodological correctness, and superb
editing skills. Thank you, Dr. Valentine, for your invaluable service as my methodologist. Your
survey development class was the start of a truly transformational adventure. Thanks for
believing in me. Dr. Smith, thanks for helping me clarify the foundations of this study. Dr.
Womble, thanks for helping me articulate implications for practice, for assistance with technical
details, and for being a great listener and friend. Dr. Schell, thanks for the period you served as
theory specialist on my committee. I wish you all the best for the future.
I have been blessed by an outpouring of support from peers and friends. Alicia, what
would I have done without your friendship and support? Thanks for taking the time to help me
format the document, and for your many acts of kindness. You have made a difference to my
stay in Athens. Thanks also to my Jamaican colleagues who supported this research, and to peers
who provided continuous feedback on the questionnaire. To my new church family here in
Athens, thanks for your love, prayers, and encouragement.
Finally, to my family who shared my vision and made sacrifices for me to pursue this
educational goal, I love you.
vi
TABLE OF CONTENTS
Page
ACKNOWLEDGEMENTS………………………………………………………………………v
LIST OF TABLES ..................................................................................................................... ix
LIST OF FIGURES .................................................................................................................... x
CHAPTER
1 INTRODUCTION ..................................................................................................... 1
Context of the Study .............................................................................................. 1
Purpose Statement ................................................................................................. 4
Research Questions ............................................................................................... 7
Conceptual Framework .......................................................................................... 8
Importance of Study ............................................................................................ 16
2 REVIEW OF LITERATURE ................................................................................... 18
Global Overview of Community Colleges ........................................................... 18
Tertiary Education in the Caribbean..................................................................... 20
History and Development of Community Colleges in Jamaica ............................. 22
Empirical Research .............................................................................................. 27
3 METHOD ................................................................................................................ 52
Purpose Statement ............................................................................................... 52
Research Questions ............................................................................................. 53
Logical Framework ............................................................................................. 54

vii
Research Design .................................................................................................. 56
Participants .......................................................................................................... 57
Instrumentation ................................................................................................... 61
Data Collection Procedures.................................................................................. 69
Data Preparation .................................................................................................. 71
Data Analysis ...................................................................................................... 76
Limitations ........................................................................................................... 80
4 FINDINGS ................................................................................................................ 81
Research Questions .............................................................................................. 81
Findings for Research Questions .......................................................................... 82
5 SUMMARY, DISCUSSION, AND RECOMMENDATIONS .................................. 104
Summary of the Study......................................................................................... 104
Review of Findings ............................................................................................. 107
Discussion .......................................................................................................... 113
Recommendations for Practice and Policy........................................................... 118
Recommendations for Future Research ............................................................... 121
Conclusion .......................................................................................................... 123
REFERENCES ....................................................................................................................... 124
APPENDICES ........................................................................................................................ 147
A Map: Jamaica Community Colleges ..................................................................... 148
B IRB Approvals ..................................................................................................... 150
C Letter of Requests to Administer Survey, Permission to Administer Survey ......... 153
D Research Information Sheet for Participants, Administration Script ..................... 158
viii
E Phone Call Script, Follow-Up Phone Call Script ................................................... 161
F Survey Instrument ................................................................................................. 164
G Pilot Study Report................................................................................................. 170
H Dissertation Study Code Book, Problems and Limitations ..................................... 181

ix
LIST OF TABLES
Page
Table 1: Program Levels and Delivery Modes of Specific CCCJ Majors ................................... 58
Table 2: Study Population and Sample Size from Each College ................................................. 60
Table 3: Distribution and Reliability of Key Measures .............................................................. 72
Table 4: Data Analysis Approach .............................................................................................. 76
Table 5: Personal Characteristics of Participants ....................................................................... 83
Table 6: College-Related Characteristics and Post-College Goals of Participants ...................... 85
Table 7: Involvement in Classes Scale—Item Response Analyses ............................................ 86
Table 8: Involvement in Extracurricular Activities Scale—Item Response Analyses................. 88
Table 9: Perceived Readiness for Work Scale—Item Response Analyses ................................. 90
Table 10: Perceived Readiness for Higher Education Scale—Item Response Analyses .............. 92
Table 11: Satisfaction with College Scale—Item Analyses ........................................................ 94
Table 12: Involvement Coefficients and Parameter Estimates (1) ............................................. 98
Table 13: Involvement Coefficients and Parameter Estimates (2) ............................................. 98
Table 14: Correlations among Involvement Predictors and Outcome Variables ......................... 99
Table 15: Regression Parameter Estimates for Class and Extracurricular Involvement ............ 100
Table 16: Best Predictors of Perceived Readiness for Work .................................................... 102
Table 17: Best Predictors of Perceived Readiness for Higher Education .................................. 103
x
LIST OF FIGURES
Page
Figure 1: Logical Framework for Student Perception Study ....................................................... 54
Figure 2: Frequency Distribution of Involvement in Class (IC) Scale ........................................ 73
Figure 3: Frequency Distribution of Involvement in Extracurricular Activities (IE) Scale .......... 73
Figure 4: Frequency Distribution of Perceived Readiness for Work (PRW) Scale ...................... 74
Figure 5: Frequency Distribution of Perceived Readiness for Higher Education (PRH) Scale .... 74
Figure 6: Frequency Distribution of Satisfaction with College (SATC) Scale ............................ 75
1
CHAPTER 1
INTRODUCTION
Context of the Study
The call for an enhanced tertiary (i.e., postsecondary or higher) education and training
system in Jamaica is both timely and urgent, especially in light of Jamaica‘s 2010-2011 overall
Global Competitiveness Index (GCI) ranking of 95 out of 139 countries (World Economic
Forum, 2010). This latest ranking suggests that Jamaica‘s global competitiveness has not
improved since the 2009-2010 report in which the economy was ranked 91 of 133 countries
(World Economic Forum, 2009). Both reports identified higher education and training as one of
12 pillars of global competitiveness critical for economies to advance beyond simple production
and products. The 2010 report concluded that of 15 ―most problematic factors for doing business
[in Jamaica, an] inadequately educated workforce‖ (p. 194) was among the top five. However,
globalization ―requires economies to nurture pools of well-educated workers who are able to
adapt rapidly to their changing environment‖ (World Economic Forum, 2009, p. 18).
To address the country‘s economic and social ills, the Jamaican government launched a
25-year national development plan focused on helping Jamaica achieve developed status by
2030. The national development plan—Vision 2030 Jamaica—advocates continuous
improvements to Jamaica‘s tertiary education system. The goal is to ensure that ―adequate and
high quality tertiary education is provided with an emphasis on the interface with work and
school‖ (Planning Institute of Jamaica [PIOJ], n.d., p. 16). Concerns have also been raised about
deficiencies in education and training in the wider Caribbean region. A World Bank (2005)

2
report linked the Caribbean‘s economic and social ills to inadequacies in the region‘s education
sector. Wolff (2009) called for the strengthening of Caribbean postsecondary education and
training institutions, such as community colleges, to enable them to respond more effectively to
the region‘s pressing economic and social challenges. Pointing to the changing world economy
and increased demand for higher-order skills, Wolff advocated immediate reform rather than
waiting for improved quality at lower levels of the education sector.
Demographics
Jamaica‘s eight primarily commuter colleges have main and subsidiary campuses in most
of the island‘s 14 parishes (see Appendix A). Two of the larger colleges are situated in the
country‘s urban centers—one in the capital city, and the other in Montego Bay, the second city.
A third college is located in close proximity to the capital city. The other five colleges are
located in traditionally farming-oriented rural parishes. With the country‘s economy heavily
dependent on the service sector, tourism may also be an important source of livelihood for
residents in these parishes (Jamaica Tourist Board, n.d.). Kingston, the capital city, has a
population of 667,778—nearly one-third of Jamaica‘s estimated 2.7 million people (Statistical
Institute of Jamaica [STATIN], n.d.a.). There is ongoing migration from rural parishes to
Kingston, and to a lesser extent Montego Bay, a major tourist resort, in search of employment
and better educational opportunities. Montego Bay has a population of approximately 82,000.
Jamaica‘s economic underperformance and low economic growth have led to the displacement
of workers (PIOJ, 2010). Unemployment is pronounced among youth and women (McArdle,
2004; STATIN, n.d.b.).

3
Development and Features of Community Colleges
Community colleges are nontraditional, relatively new postsecondary educational
institutions with multiple goals and missions, constantly evolving to meet the needs of diverse
populations (Bahruth & Venditti, 1990; Cohen & Brawer, 2008; Phillippe & Sullivan, 2005).
The important pioneering work of the American community college movement cannot be
disputed. Developed outside of the mainstream of formal education, the community college
movement in America began in the late 19th to early 20th centuries, fuelled by rapid expansion
in secondary and higher education, demand for trained workers, and a campaign for social
equality (Cohen & Brawer, 2003, 2008). These educational, economic and social factors have
also propelled the development of community college models globally (Raby & Valeau, 2009).
This is true of the Caribbean region where the development of community colleges was driven
by the inability of the regional university to meet increased demands for tertiary education
(Chevannes, 2005). The introduction of the community college concept in Jamaica and the wider
Caribbean more than 40 years ago was influenced by community college models in the U.S. and
Canada (Grant-Woodham & Morris, 2009; Wolff, 2009).
Typically, community colleges are 2-year postsecondary education institutions whose
primary mission is to prepare students for direct entry into the workforce (Cohen & Brawer,
2003, 2008; Laanan, 2000). Over time, the community college mission has expanded and has
become more complex (Bryant, 2001, Laanan, 2000; Phillippe & Sullivan, 2005). Two
distinguishing features of community colleges make them attractive to potential postsecondary
education students. First, they provide educational access to large numbers of persons, despite
having to confront skepticism about their quality and place in higher education (Townsend &
Twombly, 2001). Second, their tuition is generally lower than tuition charged by other
4
postsecondary institutions (Council of Community Colleges of Jamaica [CCCJ], n.d.c; Phillippe
& Sullivan, 2005). In the Caribbean, cost is related to equality of access to tertiary education
(Miller, 2000). Not only is postsecondary education costly in Jamaica, but student loans are also
limited and not easily accessed. Another important feature of the community college is the
increasing diversity of the student population. This diversity is exemplified in the age range,
gender composition, race/ethnicity, social status, and varying goals of students enrolled in these
institutions (Bahruth & Venditti, 1990; Bryant, 2001; Cohen & Brawer, 2003, 2008; Coley,
2000; Laanan, 2000). In addition, the diversity of community colleges is demonstrated in their
size and location—factors which may influence their mission. Small rural colleges would be
expected to have a different focus from larger colleges situated in major cities.
Purpose Statement
Issues of educational quality are particularly relevant to Jamaica‘s eight public
community colleges. The community colleges have traditionally occupied a place near the
bottom of the country‘s higher education hierarchy—below the universities, teacher-training
colleges, and some private colleges. Consequently, although Caribbean governments have
embraced community colleges as legitimate institutions, some educators still consider them to be
mediocre education institutions (Grant-Woodham & Morris, 2009). Jamaica‘s public
universities do not readily accept community college transfer students in their upper division
classes (University of the West Indies [UWI] Research and Policy Group, 2005). Therefore, after
completing a 2-year associate degree program at the community college, a transfer student may
only be exempted from the first year of a 4-year baccalaureate degree program. Based on
enrollment status at the 4-year institution, a student may spend a total of five or more years
pursuing a baccalaureate degree. This situation has resulted in ―tremendous waste of personal

5
and public resources [and] much frustration for the individual‖ (Stennett, 2005, p. 333).
Consequently, the Jamaican colleges are challenged by academic transfer and curriculum
articulation issues. These concerns also confront American community colleges (Ignash &
Townsend, 2001).
In response, community colleges in Jamaica and across the Caribbean have continued to
lobby for greater acceptance of their programs by the universities (Grant-Woodham & Morris,
2009). The Jamaican colleges have made direct representation to local universities via specially-
commissioned hearings and review meetings. Caribbean community colleges have also adjusted
their programs to conform to changes in the higher education system. Moreover, the Jamaican
community colleges have been increasing education offerings to meet rising demand for
postsecondary education and increased competition from foreign institutions with local-based
campuses (Marshall, 2007). Primarily associate degree-granting institutions, the Jamaican
community colleges have added bachelor‘s degrees to their program offerings. Currently, five of
the eight colleges offer one or more of four bachelor degree programs (CCCJ, 2009a). By
offering baccalaureate degrees, the community colleges are increasing higher education options
to graduates of lower-level programs who desire to ―jump-start [their] education and career
goals‖ (Adamson, n.d., para. 1). In addition, all associate degree programs include a work
experience or internship component intended to prepare students for business and industry
(CCCJ, n.d.a).
To address concerns about program and institutional quality, the Jamaican community
colleges have sought and received accreditation for several programs from the University
Council of Jamaica (UCJ), the national tertiary accreditation body. Accreditation is the most
popular form of quality assurance, and it benefits the tertiary education sector as well as the

6
country (London, 2005). As of February 2010, seven of the eight community colleges have had a
number of their programs accredited. While larger colleges have received accreditation for
approximately six to nine programs, most of the smaller colleges have each had at least two
programs accredited (UCJ, n.d.a.). To date, one college has not had any of its programs
accredited, although it is currently offering core associate degree programs that are accredited at
other community colleges. However, this college has review visits pending. The process of
accreditation is ongoing and several colleges either have review visits or accreditation pending as
they seek to have programs re-accredited and/or receive initial accreditation (CCCJ, 2009a).
Although the eight community colleges collaborate to offer common programs, they also
develop unique programs that meet the education needs of their communities. This flexibility is
generally accepted as an advantage. Yet, students want assurance of program quality, typically
associated with program accreditation (UCJ, n.d.b.). Moreover, programs unique to individual
colleges may take longer to be accredited than those offered jointly with other community
colleges. According to the UCJ, accreditation indicates confidence in an institution‘s mission and
goals, quality of faculty, students, academic programs, and appropriateness of resources.
Decisions to accredit or reaffirm program accreditation are primarily based on confidence that an
institution is providing quality education.
Students play a ―profoundly important role in shaping the ethos, culture, and orientation
of colleges and universities everywhere‖ (Altbach, 1994, p. 203). Ultimately, they are the subject
of education policies, and are directly affected by curriculum practice and review. Jamaica‘s
community colleges have been striving to improve their image in the tertiary education sector
and to remain competitive by vigorously pursuing program accreditation and articulation with
higher education institutions (Grant-Woodham & Morris, 2009; Marshall, 2007). In 1999, the

7
Tertiary Level Institutions Unit of the UWI approved advanced placement for the CCCJ‘s
associate degree in business studies program (Roberts, 2003a). Yet, more than 10 years later,
students still do not make a smooth transition into higher education institutions (Leo-Rhynie,
2007; Stennett, 2005) and they may not be adequately prepared for industry (Wolff, 2009; World
Bank, 2005). Gauging student perceptions of the total community college experience and their
preparedness for post-college goals is warranted. Educators need to understand those for whom
they design education products and services, if these are to be effectively and efficiently utilized.
Research in this area is also very limited. Therefore, the purpose of this survey study was to
examine perceptions of Jamaican community college students about their readiness for
immediate postcollege goals. Specifically, the study investigated the extent to which
involvement in class and college extracurricular activities, personal characteristics, and college-
related factors predicted students‘ perceived readiness for identified post community college
goals.
Research Questions
Six research questions guided this study. They were:
1. What are the personal and college-related characteristics of Jamaican community college
students, and what goals do they intend to pursue after completing current studies at the
community college?
2. What forms of class-related and college extracurricular activities do Jamaican community
college students actively and regularly engage in?
3. What work- and college-related tasks do Jamaican community college students feel most
ready to perform?

8
4. What aspects of their college experiences are Jamaican community college students most
satisfied with?
5. To what extent does involvement in classes and college extracurricular activities
independently and collaboratively explain Jamaican community college students‘
perceived readiness for work and for higher education, respectively?
6. What are the best overall predictors of perceived readiness of these Jamaican community
college students for work and for higher education, respectively?
Conceptual Framework
The conceptual framework for this study was based on a synthesis of three related
theories: Astin‘s (1984) student involvement theory, Pace‘s (1984) student development and
college impress model, and Tinto‘s (1975, 1986, 1993) student departure theory. All three
theories are related in that they focus on student involvement and integration into the academic
and social spheres of college as predictors of positive outcomes of the collegiate experience.
Therefore, the study‘s premise was that class and extracurricular involvement at Jamaican
community colleges were very important factors which, combined with specific background and
college-related characteristics, might account for students‘ perceived readiness for higher
education and employment goals. Evidence accumulated over two decades supports the claim
that student achievement at college depends considerably on student engagement and the quality
of effort expended in educational and non-educational activities (Friedlander, Murrell, &
MacDougall, 1993; Pascarella & Terenzini, 1991, 2005).
Student Involvement Theory
To explain persistence in college among traditional students, Astin (1984) proposed the
student involvement theory, based on a 1975 longitudinal study of college dropouts. Earlier,

9
Astin (1970) had conceptualized an input-environment-outcome (I-E-O) model to explain student
development in higher education. Inputs refer to characteristics and traits students take to
college, the environment includes academic and social activities at college, and outcomes
comprise measures of student achievement. Student involvement theory was therefore an
outgrowth of the I-E-O concept used to explain persistence in college among traditional students.
The essence of this theory is that college student learning and persistence are dependent on the
degree of student involvement in academic and nonacademic pursuits (Astin, 1985). Astin‘s
(1975) study found that holding a part-time on-campus job facilitated persistence and
institutional commitment, but retention suffered if a student had a full-time off-campus job.
Furthermore, Astin (1984) distinguished a highly involved student from one who is typically
uninvolved—the former is often on campus, spends much time studying, is actively involved in
campus activities, and frequently communicates with peers and faculty. By contrast, an
uninvolved student is more likely to neglect studies and spend less time on campus, resulting in
infrequent participation in campus activities, and reduced contact with faculty and peers. Astin
(1993) revisited student involvement theory and concluded that the college environment was
important to student satisfaction and persistence. Responding to criticisms of student
involvement theory, Tanaka (2002) defended its robustness in predicting a wide range of factors
influencing student outcomes.
Student Development and College Impress Model
Pace (1984) outlined a model for studying student development that underscores the
impression college makes on the overall student experience. The student development and
college impress model underscored Pace‘s conviction that college does make an impression on
students (Pace, 1979). The model has three basic premises: (a) the college experience comprises

10
all activities and events encountered in college, (b) aspects of the environment and the quantity
and quality of student effort influence the nature or interpretation of these activities and events,
and (c) combined effects of environment and effort result in student development and college
impress. According to Pace‘s (1984) model, students enter college with varying competencies
and personal traits that are influenced by experiences at college. These experiences might include
academic activities, extracurricular events, and interactions with faculty and peers. The
combined experiences are further shaped and given meaning by the breadth and depth of student
effort and the impression made by academic, vocational, and social environments. Central to
Pace‘s model is the concept of quality of effort, defined as ―the amount, scope, and quality of
effort [students] invest in their own learning and development, and specifically in using the
facilities and opportunities that are available in the college setting‖ (Pace, 1984, p. 6). Like
Astin, Pace was convinced that all learning and development required students to make an
investment of time and effort. Thus, quality of effort was a key construct in two instruments
developed and/or influenced by Pace—the College Student Experiences Questionnaire (CSEQ)
and the Community College Student Experiences Questionnaire (CCSEQ; Pace, 1982). The
instruments measure student experiences in three areas: benefits from attending college, amount
of time and effort expended in various activities, and perceptions of the college environment
(Kuh, Pace, & Vesper, 1997). Findings from administrations of the CSEQ and the CCSEQ
support the premise that what students learn in college is significantly influenced by the amount
of effort they invest in the experience. More specifically, results from a pilot study of the original
CCSEQ survey led Pace to conclude the applicability of the quality of effort construct to
community college students (Pace, 1992, 2001).

11
Student Departure Theory
Essentially, Tinto‘s (1975, 1986, 1993) student departure theory states that commitments
to one‘s educational goals and to the institution are shaped by the congruence between student
characteristics and the institution‘s academic and social systems. Therefore, a student who is
deeply committed to completing college and to the institution has a greater likelihood of
persisting to graduation. Tinto (1987) compared colleges to human communities in terms of the
way they both influenced membership. As learning communities, colleges provide opportunities
for students to form supportive peer groups that go beyond the classroom (Tinto, 1998). In this
way, learning is enhanced as students spend more time together outside of class actively engaged
in course-related activities. However, Tinto (1982) conceded that his model was limited in that it
did not account for external factors that may impact student participation at college, nor did it
adequately distinguish between behaviors leading to transfer as against those resulting in
permanent withdrawal from college. Perhaps to compensate for these gaps in student departure
theory, Bean and Metzner (1985) advocated a nontraditional student attrition model that de-
emphasized social integration on campus, while focusing on factors in the external environment
that may exert greater influence on older college students. Researchers have recognized the
utility of the student attrition model in accounting for the academic integration of nontraditional
students (Braxton, Shaw Sullivan, & Johnson, Jr. 1997; Webb, 1989). Yet, the weakness of this
model may lie in the absence of an alternate approach to social integration appropriate to
nontraditional students.
In the 1993 revision of departure theory, Tinto added three phases—separation,
transition, and incorporation—to explain the process of student integration into academic and
social systems at college. In order to effectively transition into the new community, i.e., college,

12
the student must disassociate from certain norms of past communities (Milem & Berger, 1997).
A student at the incorporation stage has fully integrated into the norms and behaviors of the new
community. Despite limitations, Tinto‘s integration model has exerted considerable influence in
empirical research (Kuh, Bean, Hossler, & Stage, 1989; Milem & Berger, 1997), and has been
effectively employed to study student outcomes for over a decade (Cabrera, Nora, & Castaňeda,
1993; Pascarella & Terenzini, 2005).
Application of Theories
Involvement in college is important to student persistence and goal achievement
(Pascarella & Terenzini, 1991, 2005). Theories of student involvement, quality of effort, and
student departure focus on the student as an active participant at college, and assign a prominent
role to the context in which a student participates. Likewise, all three theories assert that benefits
to be gained from college are proportional to the quality and quantity of effort expended by the
student. Besides, Astin‘s student involvement theory considers the influence of external factors
such as employment on student involvement. Conversely, Pace‘s quality of effort construct is an
appropriate measure of the community college experience (Douzenis, 1996; Ethington, Guthrie,
& Lehman, 2001; Friedlander et al., 1993; Pace, 1984; Pace, Friedlander, Lehman, & Murrell,
1990). Together, these three theories captured variables deemed important in investigating the
perceived readiness of Jamaican community college students for post-college goals.
Variable Selection
Selection of outcome and predictor variables for this survey research was primarily based
on student involvement and integration theories, and on review of the community college
literature. Postcollege goals were operationalized as work and higher education. Thus, the study
utilized two outcome variables—perceived readiness for work, and perceived readiness for
13
higher education. Three sets of predictor variables—student involvement, personal
characteristics, and college-related factors—were examined. The selected predictor variables
were: (a) involvement in class, (b) involvement in extracurricular activities, (c) age, (d) gender,
(e) enrollment status, (f) employment status, (g) family responsibilities, (h) time on campus, (i)
parent education, (j) academic major, and (k) satisfaction with college.
Post community college goals. The complex mission of American community colleges
includes preparing students for employment and for higher education opportunities (Bailey,
Jenkins, & Leinbach, 2005; Cohen & Brawer, 2003, 2008; Ignash & Townsend, 2001; Laanan,
2000). These are also key functions of Jamaica‘s community colleges (Grant-Woodham &
Morris, 2009; Miller, 2000; Walsh, 2005; Wolff, 2009). Community colleges enable individuals
to pursue these goals by providing a curriculum that is both academically and vocationally
oriented (Laanan, 2000). To ensure educational success, meet workforce mandates, and address
the lifelong learning demands of varied student groups, community colleges need to offer
comprehensive services constantly adjusted to target specific needs (Phillippe & Sullivan, 2005).
Involvement in class and extracurricular activities. The quality and quantity of student
engagement in academic and college extracurricular activities is positively related to educational
achievements, individual and social growth, and positive perceptions of the collegial experience
(Cohen & Brawer, 2003, 2008; Davis & Murrell, 1993; Douzenis, 1996; Ethington & Horn,
2007; Ethington & Polizzi, 1996; Friedlander & MacDougall, 1991; Glover, 1996; Polizzi &
Ethington, 1998; Swigart & Murrell, 2001). These findings also support the inferences of several
involvement and engagement theorists (see Astin, 1984; Pace, 1984; Tinto, 1993). However, the
nature of involvement may differ for traditional and nontraditional students (Kasworm, 2003,
2005). The traditional or younger college student typically engages in class-related and campus

14
social activities, which define the college experience. For the nontraditional or adult student,
opportunities for collegiate social integration may not exist (Bean & Metzner, 1985). In such a
case, engagement in a connected classroom becomes the defining feature of the collegiate
experience.
Age, gender, and enrollment. The average age of Jamaican community college students
has not been confirmed. However, most students enrolled in full-time (i.e., day) programs are
likely of traditional age (Buckle, 2010). Those enrolled in part-time (i.e., evening) programs may
be nontraditional-aged. Generally, college students older than 25 are termed nontraditional,
while those below age 25 are of traditional age (Bahruth & Venditti, 1990; Spitzer, 2000). Full-
time Jamaican community college enrollees take between 15-18 course credits per semester and
part-time students generally take a maximum of 12 course credits each semester (CCCJ, 2009b).
Over the years, the Jamaican community college sector has been experiencing steady growth in
enrollment (Robotham, 2000). Less rigorous entry requirements and lower fees at the community
college may be attracting an increasing number of students just out of high school. Additionally,
high schools in some parishes have discontinued upper division pre-university courses, and these
students transfer directly into the community college. For the 2009-2010 academic year,
Jamaica‘s community colleges enrolled an estimated 12,106 students, comprising 8,032 females
and 4,074 males (Ministry of Education and Culture [MOEC], Jamaica, 2009). This represents a
1.5% decrease in reported student enrollment for 2008, and a 10% increase over total community
college enrollment for 2007. In 2007, total tertiary enrollment in Jamaica was well below the
regional average of 34% (United Nations Educational, Scientific, and Cultural Organization
Institute of Statistics [UNESCO-UIS], 2009). In addition, gender disparity in favor of females is
a noted feature of Jamaica‘s postsecondary education system (Bailey, 2004; CCCJ, 2009a;

15
Evans & Burke, 2006; Hausmann, Tyson, & Zahidi, 2009; Miller, 2000). This trend of female
dominance is noticeable in community college student enrollments over the last five years
(CCCJ, 2009a; 2010).
Employment status, family responsibilities, and time on campus. Findings from U.S.
postsecondary education research have confirmed that full-time employment while enrolled and
family responsibilities may pose substantial risks to persisting in college (American Council on
Education [ACE], 2003; Horn & Premo, 1995). Nontraditional students enrolled in public
community colleges and other 2-year private institutions are particularly susceptible to these
risks. They are required to balance multiple roles—as spouses, parents and full-time
employees—while pursuing a college education. Unlike their younger peers, these students may
be unable to spend extra time on campus, and are therefore less likely to be involved in
extracurricular activities. Time on campus is important if students are to maintain supportive
relationships with faculty and peers (Astin, 1984; Tinto, 1998). When extenuating circumstances
arise, nontraditional students may be forced to postpone or totally abandon school. To date, no
published study has examined the effects of employment status, family responsibilities, or time
on campus on Jamaican tertiary education students.
Parent education. A report commissioned by the U.S. Department of Education
concluded that college enrollment is strongly linked to parents‘ education, even when other
factors are considered (Choy, 2001). The report findings indicated that as parents‘ education
increased, so too did involvement in their children‘s education, resulting in a greater likelihood
of the student enrolling in postsecondary education. Moreover, students from lower-income
families tended to be over represented among those whose parents had low levels of education.
No studies of the social background of Jamaican community college students have been

16
conducted. However, in view of the biases inherent in the tertiary education sector, these
colleges may primarily enroll students from lower socioeconomic classes (Miller, 2000). On the
other hand, students enrolled in the region‘s universities may disproportionately represent higher
socioeconomic classes.
Academic major. In addition to core associate degree programs, several community
colleges now offer shorter (i.e., certificate and diploma) programs (CCCJ, 2009a). Altogether,
the colleges offer 14 associate degree programs comprising about 400 course subjects, and four
bachelor degree programs. Participants in the current study were enrolled full- and part-time in
bachelor and associate degree programs drawn from four majors—business, hospitality and
tourism, computer, and architecture and construction.
Satisfaction with college. Satisfaction with college implies acceptance of and integration
into the academic, social and physical environments of college. Studies of student satisfaction
with the college experience consistently indicate that satisfaction is more likely to be influenced
by the college experience than by students‘ background or personal characteristics (Astin, 1993).
Student satisfaction with college should not be ignored because the college environment
determines the quality of the undergraduate experience (Kuh, Kinzie, Buckley, Bridges, &
Hayek, 2007).
Importance of Study
This study has importance for practice, policy and further research across the Jamaican
community college sector. First, study findings will be beneficial to on-going program
accreditation efforts and institutional self-study processes at individual colleges. Additionally,
results of the study can provide the basis for professional development activities and influence
dialogue among community college teachers and program coordinators. Such dialogue may
17
include reviews of teaching and evaluation techniques, strategies for improving classroom
involvement, and teacher-student interactions within as well as outside of the classroom.
Second, colleges may be encouraged to initiate or expand collaborative arrangements
with local higher education institutions, and with industry. These arrangements should enable
students to make a seamless transition from the community college into higher education
institutions and to receive authentic work experience or internship opportunities.
Third, the study may have implications for revision of existing community college
policies. Student assessment of academic and non-academic experiences may provide a point of
reference for college presidents and principals, CCCJ administrators, curriculum planners,
program coordinators, academic advisors, and counselors. Revising student-centered policies
might impact practice, resulting in more student-friendly academic and social environments.
Fourth, colleges may be further motivated to seek innovative ways to obtain human,
financial and physical resources needed to improve existing student services and facilities.
The fifth and final reason why this study is important is that it attempted to supplement
community college research. To date, no published study has comprehensively investigated
student perceptions of readiness for employment and higher education goals after completing
studies at the community college. One earlier study (Stewart, 2006) examined student, teacher,
and employer perceptions of the utility of a previously offered program. Two other studies (i.e.,
Buckle, 2010; Marshall, 2007) explored community college transfer effectiveness and the
accreditation process, respectively. It is hoped that this study will stimulate further community
college research in Jamaica and the wider Caribbean. Generally, study findings may complement
the scholarly literature about involvement, integration, and the education and career goals of
community college students.
18
CHAPTER 2
REVIEW OF LITERATURE
This chapter focuses on literature illuminating the effects of student involvement on
higher education and employment goals of community college students. The chapter highlights
four main areas, including a global perspective of the community college mission, tertiary
education in the Caribbean, history and development of the community college movement in
Jamaica, and empirical studies of student preparedness for post community college goals. The
empirical research section is organized under the following subheadings: post community
college goals; student involvement/quality of effort; age, gender and enrollment status;
employment status, family responsibilities and time on campus; parent education; academic
major; and satisfaction with college.
Global Overview of Community Colleges
The United States has been the world leader in higher education developments for many
decades, but during the past decade other countries have followed in their lead, while breaking
new ground to address their unique challenges (Boggs & Irwin, 2009). As demand for flexible
postsecondary education options increases globally (Alfred, Ewell, Hudgins, & McClenney,
1999; Elsner, Boggs, & Irwin, 2008; Raby & Valeau, 2009), traditional 4-year education
institutions are hard-pressed to satisfy these urgent needs. Consequently, this urgency is being
answered by ―an explosion of community college models that provide educational opportunities
and alternative pathways for students who do not fit the traditional higher educational profile and
are often excluded from getting such education‖ (Raby & Valeau, 2009, p. ix). The increasing

19
demand for postsecondary education is fueled by globalization as well as local challenges.
Accordingly, virtually every country has or is contemplating a community college system
characterized by flexible curriculum and service to local populations. Cohen and Brawer (2003)
acknowledged that countries in Europe, Asia, Africa, and South America have established
institutions that provide functions similar to the American community colleges. However, they
emphasized that ―no other countries but the United States, (and to some extent Canada) have
formed comprehensive community colleges‖ (p. 26). Yet, based on case studies presented in
their 2009 book, Raby and Valeau identified five recurrent themes that define community college
models worldwide: academic, philosophical, economic, institutional, and community reforms.
Academic reforms embrace the community college curriculum, teaching strategies, and program
accreditation. Philosophical reforms are linked to sociocultural and political reforms, and speak
to the community college as an equal access and second opportunity institution. Raby and
Valeau (2009) also assessed global adoption of community college systems as motivated by a
desire for economic reforms; and they noted that many case studies also focused on the nature of
institutional reforms. Finally, community reforms refer to the community-oriented nature of
community colleges, which enables response to local needs and empowerment of local citizens.
Community colleges are defined by their response to the local environments they impact,
and thus go by different names in different regions (Elsner et al., 2008; Raby & Valeau, 2009).
For example, community colleges across the globe are also called technical colleges, polytechnic
institutions, institutes of technology, and junior colleges. Yet a common mission—to provide the
education and skills training necessary to positively influence economic and social
improvements in their respective territories—unites these institutions. The U.S. community
college model is considered most influential. In some cases, this model has been ―so extensively

20
adapted to fit local needs that an educator from a U.S. community college might not recognize it‖
(Halder, 2008, p. 275) except for the fundamental features of open access, workforce training,
and credit transfer. Despite the dominance of the U.S. community college model, several
countries have developed unique, exemplary models. One such example is Denmark whose
vocational education and training (VET) system has reportedly influenced education initiatives
and policy in the U.S. (Elsner et al., 2008). Through various education reforms, Denmark‘s VET
system has experienced continuous improvements. Students are able to access multiple pathways
from varying education institutions at different levels: vocational, technical, adult, and university
education, and their goals are purposefully matched with the various options available.
Denmark‘s VET system comprises folk high schools that are part of an unofficial adult education
school system (Bagley & Rust, 2009). These schools provide opportunities for students to
explore subjects not directly related to their course of study for a year, without having to worry
about grades.
Tertiary Education in the Caribbean
In the Caribbean, the term tertiary education is used interchangeably with higher
education to indicate education and training provisions in third level (i.e., postsecondary)
institutions (Howe, 2003). Tertiary education, therefore, includes university- and college-level
programs, technical and vocational education and training, professional and paraprofessional
training, and continuing education programs. Consequently, tertiary education fosters
intellectual, social, personal, professional and occupational growth (Henry-Wilson, 2005;
Roberts, 2003a). Howe reported that the current structure of tertiary education in the English-
speaking Caribbean comprises approximately 150 tertiary-level institutions (TLIs). Of this
number, more than 60% are either national or are publicly supported, 30% are private, and the

21
rest are privately owned with some support from government. An increasing number of offshore
distance providers, some of dubious quality, offer online programs in the region (Brandon,
2003). The University of the West Indies (UWI) performs a regional role, serving 14 Caribbean
territories. With campuses in Jamaica, Trinidad and Barbados, the UWI is the largest university
in the Caribbean. Diversity in the Caribbean tertiary education sector is reflected in the student
population, staffing, and mission of the various institutions (Roberts, 1999, 2003a, 2003b). This
diversity has created challenges related to employability of graduates; competition within the
sector; partnership arrangements (i.e., equivalence, credit transfer, articulation, and
accreditation); technology; availability and use of resources (Leo-Rhynie, 2007).
Jamaica‘s tertiary education sector is relatively small, with approximately 40,000
students enrolled at various colleges and universities (Ministry of Education, Jamaica, 2009).
Yet, over the last 15 years the sector has experienced rapid growth, resulting in diversified
program offerings and delivery modes and many entrance and exit points for students (Leo-
Rhynie, 2007). There is also greater flexibility between programs and/or between education and
employment. Almost half of the approximately 50 TLIs in Jamaica are public, and 90% of
programs in the non-university institutions are below bachelor‘s degrees (Martin & Bray, 2009).
Fifteen colleges—including community colleges, teacher training institutions, and business and
management schools —provide non-university education and training (Nkrumah-Young,
Huisman, & Powell, 2008). Unlike universities which are primarily 4-year institutions, colleges
typically offer 2-year curricula.
22
History and Development of Community Colleges in Jamaica
Background and Rationale
The genesis of the community college movement in Jamaica can be traced to
recommendations from a working party on postsecondary education appointed in 1974 by the
Ministry of Education (Whyte, 1983). The working party was mandated to review the status of
the existing tertiary level system, with respect to (a) its capacity to meet Jamaica‘s manpower
need; (b) inflexible entry requirements into existing institutions; (c) high failure rate among
students taking the British Council‘s Advanced General Certificate Examinations—GCE A-
levels; (d) limitations of the curriculum, partly due to the absence of vocational input; and (e) a
lack of ―orientation towards community and national consciousness‖ (Stewart, 2006, p. 72).The
committee recommended changes to the structure of the GCE A-level program. These changes
included a broader curriculum with non-academic options, as well as a focus on inculcating
national pride. Whyte reported that the community college was viewed as the institution ―that
would best convey the spirit of these recommendations and at the same time form a more
appropriate sequel to the grades 10 and 11 programmes of secondary schools‖ (1983, p. 151).
Thus, community colleges were established in Jamaica to achieve specific educational and social
objectives (Walsh, 2005). Two roles were emphasized: preparation for higher education and for
the workforce.
Earlier, Jamaica‘s movement toward political independence had been accompanied by an
increasing awareness of the importance of developing human resources and the economy through
education (Whyte, 1983). Therefore, the post-independence government targeted expansion of
all levels of education from 1966–1980. However, impacted by slavery and colonialism,
Jamaica‘s education system—particularly postsecondary education—has always favored the
23
privileged few (McArdle, 2004; Miller, 2005). This elitist orientation characterized the UWI,
which was opened in Kingston, Jamaica, in 1948. Ironically, the UWI was established to expand
access to higher education in the region. Cobley (2000) recalled that by the 1960s there was
widespread disenchantment as critics complained that the university had only succeeded in
educating the elites, program offerings were limited and ―the structure of its degrees was locked
into British models of doubtful utility‖ (p. 17). Thus, it became urgent for Caribbean territories to
set up their own domestic institutions. Subsequently, by the 1990s there was an expansion of
higher learning institutions, especially community colleges, in English-speaking Caribbean
countries (Howe, 2003). In 1990, the Association of Caribbean Tertiary Institutions was formed
to integrate and facilitate equal access to the varied Caribbean higher education initiatives.
Growth and Development
Jamaica‘s community college system is one of the fastest growing segments within the
country‘s higher education sector (Robotham, 2000; Stewart, 2006). Over the last 20 years, the
Jamaican colleges have significantly diversified and increased tertiary education opportunities to
the population (Walsh, 2005). In 1974, Excelsior Community College in Kingston and Knox
Community College in Manchester were founded, second in the region to Barbados Community
College, which was opened in 1968. In 1975, two additional community colleges were
established in Jamaica—Montego Bay Community College in St. James and Brown‘s Town
Community College in St. Ann (Whyte, 1983). Today, the eight public community colleges
comprising the Council of Community Colleges of Jamaica (CCCJ) have main and secondary
campuses in at least 10 of the island‘s 14 parishes. They account for 30% of Jamaica‘s TLI
student population (MOEC, Jamaica, 2009). The community colleges are open access institutions
that provide a bridge between secondary education and university (Grant-Woodham & Morris,
24
2009). Traditionally, their highest offering is the associate degree, originally developed to
facilitate smooth transfer into the third year of baccalaureate degree programs at local and
foreign universities (CCCJ, n.d.a.). However, the seamless transfer anticipated by a two-plus-two
arrangement did not materialize.
It may be argued that the recent development of bachelor‘s degrees by Jamaican
community colleges was directly linked to the limited success of the two-plus-two mission. The
larger colleges offer bachelor degree programs, with majors in business studies, management
information systems, and hospitality and tourism management. Together, the community
colleges offer ―more than 400 courses in 12 Associate degree programmes and 4 bachelor‘s
degree programmes‖ (Adamson, n.d., para. 1). Originally designed as a 3-year/6-semester
program, the associate degree is now offered as a 2-year or 4-semester program for students
enrolled in full-time (day) classes and as a 6-semester program for part-time enrollees. On the
other hand, full-time students may complete the bachelor‘s degree over eight semesters (i.e., four
years) while part-time students typically complete the program over 12 semesters (approximately
five years). Students who successfully complete an associate degree at the community college
may transfer directly into year three of a community college-developed bachelor‘s degree
program for an additional two years to the degree.
Mission and Roles
The CCCJ received formal recognition by an Act of Parliament in 2001(CCCJ, n.d.b;
Grant-Woodham & Morris, 2009). However, the Council had been in existence since 1981,
spearheaded by the college principals who initiated various collaborative efforts (Walsh, 2005).
The 2001 Act officially established the Council as a statutory agency under the aegis of the
Ministry of Education, to oversee and harmonize activities of the colleges (CCCJ, n.d.b.). The

25
Act discusses the Council‘s three functions that span the entire community college network: (a)
regulating curriculum development and review, and assessing student progress; (b) promoting
awareness of Jamaica‘s community colleges; and (c) facilitating collaborative arrangements and
professional development activities. The CCCJ‘s influence does not extend beyond Jamaica and
no similar organizations exist elsewhere in the Caribbean (Grant-Woodham & Morris, 2009).
The Council also ensures that common standards of quality are maintained within the community
college network. Both Miller (2000) and Roberts (2003a, 2003b) recognized the diverse mission
and roles of Caribbean community colleges. Miller noted that the founding of community
colleges in the Caribbean served a variety of needs, including preparation for university study,
training for middle level/supervisory positions in industry, continuing/remedial education, and
personal development. Meanwhile, Roberts (2003a) suggested that the community college‘s
focus on adult and continuing education was obvious from enrollment patterns in various
departments.
Caribbean community colleges were designed to be community-focused institutions
―expected to respond to the postsecondary education needs of the people in their vicinity‖
(Grant-Woodham & Morris, 2009, p. 302). However, unlike community colleges in Barbados
and the British Virgin Islands, Jamaica‘s community colleges were not always multipurpose
institutions. Rather, their mission expanded over time from a binary form, intended to provide
another chance for high school students initially unsuccessful in secondary-level examinations to
prepare for university education, to their current status as multipurpose models. Grant-Woodham
and Morris (2009) linked the change in mission to several factors: drastic changes in the tertiary
education sector, community demands, institutional necessity, economic and political influences,
and global developments.
26
Challenges and Opportunities
The complexity of the community college mission, evidenced in students‘ varying
reasons for attending college, amplifies the challenge of defining educational attainment (Bailey,
Jenkins, & Leinbach, 2005; Bryant, 2001). Moreover, the quality of an institution‘s mission and
goals, faculty and students, programs, level and appropriateness of resources all impact
stakeholder perceptions and the recognition conferred on an institution (University Council of
Jamaica [UCJ], n.d.b.). With so many tertiary education options available to students today,
identifying quality education and institutions is paramount (Grant-Woodham & Morris, 2009).
While accreditation and quality are not synonymous, accreditation implies that recognition will
be accorded to the institution. Community colleges in Jamaica and the wider Caribbean might
also be challenged by the enrollment of large numbers of students whose prior academic
attainments have been marginal (Miller, 2000). Miller based his assumption on studies that
indicated ―strong positive correlation between social class and performance in the GCE and CXC
examinations‖ (Miller, 2000, p. 133). However, he acknowledged the need for empirical research
to corroborate this premise. Jamaica‘s community colleges also lack resources needed to support
vocational programs (Wolff, 2009). Consequently, only about 4% of community college
programs are vocationally-oriented (O‘Lawrence, 2008). Finally, insufficient government
funding and pricing programs below market cost (Grant-Woodham & Morris, 2009) are other
major challenges that confront Jamaica‘s community colleges. Pricing programs below market
cost may provide access to a larger segment of the postsecondary population, but it also restricts
profitability of the colleges and ultimately impacts the quality of resources available.
Yet, despite the obvious challenges, Jamaica‘s community colleges have the potential to
stimulate economic growth and to become more influential in the higher education sector.

27
Colleges have the flexibility to develop programs and discontinue others in response to market
demand (CCCJ, n.d.a.). Programs are ―tailor-made for industry, and therefore contain a high
work experience component‖ (CCCJ, n.d.a., para. 9). Likewise, current articulation and
collaborative arrangements with the UWI, Caribbean Examinations Council, and Heart Trust
National Training Agency (Heart Trust NTA) may be seen as opportunities to expand the
CCCJ‘s sphere of influence in the higher education sector. The colleges also have arrangements
with the Association of Community Colleges of Canada, the American Association of
Community Colleges, and with City College in the United Kingdom (Grant-Woodham & Morris,
2009). Some of these partnerships have fostered student and faculty exchange, and have
promoted cooperation in scholarly pursuits.
Empirical Research
Research into Jamaica‘s tertiary education system is limited, with few published studies
of the country‘s community college sector. To date, three studies have been found (Buckle,
2010; Marshall, 2007; Stewart, 2006). Of the three, Stewart‘s 2006 study had greatest relevance
to this study. However, Buckle‘s (2010) and Marshall‘s (2007) dissertation studies also informed
this research. Consequently, the empirical research discussed in this section was primarily drawn
from studies of U.S. community colleges. Most of these studies utilized student involvement and
integration theories. Additionally, the American institutions confront challenges similar to those
faced by Jamaican community colleges. These challenges include skepticism about their quality
and place in higher education (Cohen & Brawer, 2003, 2008; Stewart, 2006; Townsend &
Twombly, 2001). Both systems have also pursued a common tripartite mission: academic
transfer, workforce preparation, and remedial/lifelong learning (Amey & VanDerLinden, 2002;
Grant-Woodham & Morris, 2009; Townsend & Twombly, 2001). Despite negative perceptions,

28
community colleges today are visible and respected postsecondary institutions (Tollefson, 2009).
The community college is also the lead workforce training agency in at least 19 states in the U.S.
(Jenkins & Boswell, 2002).
Post Community College Goals
The increasing diversity of the community college student population will continue to
challenge U.S. community colleges for the next 20 to 30 years, and influence student post
college goals (Phillippe & Sullivan, 2005). While the magnitude of student diversity may not be
as pronounced in Jamaican colleges, similar effects may be produced. Although community
college students report varying reasons for enrolling in postsecondary education, transfer to a 4-
year institution is one of the chief goals (Horn, Peter, & Rooney, 2002). Community colleges
also prepare students to enter or advance in the workforce by providing them with requisite skills
(Lohman & Dingerson, 2005). Based on their extensive post-1990 research, Pascarella and
Terenzini (2005) arrived at several conclusions related to the transfer and career preparation
functions of U.S. community colleges. These findings also have implications for the Jamaican
community college system. Earlier, Pascarella (1997) had confirmed that of approximately 2600
studies reviewed for the 1991 synthesis he co-authored with Terenzini, no more than 5% of the
studies focused on community college students. However, the 2005 text placed greater focus on
phenomena specific to U.S. community college student populations than did the earlier work.
Yet, several findings in the recent research are reportedly consistent with pre-1990 projections.
For example, Pascarella and Terenzini (2005) found that starting a bachelor‘s degree at a
community college instead of a 4-year college decreased the chances of ultimately obtaining the
degree by 15-20%. Besides, enrolling at a 2-year college could reduce students‘ degree goals by
as much as 40%. However, once the community college student transferred to a 4-year institution

29
they were as likely to earn a bachelor‘s degree as their counterparts who started at a 4-year
college or university, although they typically took longer to complete the degree. Pascarella and
Terenzini also reported that students who started their postsecondary education at a community
college were more successful in transferring to academically discriminating 4-year colleges than
they could have enrolled in upon completing high school. They found this to be particularly
significant for students from poor families, or those with low performance levels. In terms of
career goals, Pascarella and Terenzini found that initial attendance at a 2- instead of a 4-year
college reduced the possibility of persistence in math, science, and engineering careers by highly
competent minority students. Yet, initial attendance at a 2- instead of a 4-year college generally
did not significantly affect later occupational status and earnings of individuals with similar
abilities and educational achievement.
Using three data sources: the 1996/2001 Beginning Postsecondary Students Longitudinal
Study (BPS), the 1988 National Educational Longitudinal Study (NELS) fourth follow-up, and
the 1999- 2000 National Postsecondary Student Aid Study (NPSAS), Hoachlander, Sikora, and
Horn (2003) investigated the goals, preparation, and outcomes of U.S. community college
students. The BPS analysis sample was limited to students whose first experience of
postsecondary education was at a community college. On the other hand, the NELS cohort
comprised students who had enrolled in postsecondary education immediately after high school.
The sample used for this study consisted of high school graduates in 1992 that first enrolled in a
community college within two years of graduating from high school. Finally, the NPSAS survey
consisted of a sample representative of the population of students enrolled in postsecondary
education during the 1999- 2000 academic year. Students varied in age, date of entry into
postsecondary education, and were at different stages in their studies. Findings from all three
30
data sets—BPS, NELS, and NPSAS—indicated that, despite varying educational goals,
approximately 90% of community college students enrolled with the aim of obtaining formal
credentials or transferring to a 4-year institution. Hoachlander et al. reported that about 51% of
all community college students (BPS) and nearly 63% of the more traditional students (NELS),
achieved successful outcomes ―when success is defined as any degree attainment or 4-year
transfer‖ (p. 12). Since two-thirds of American community college students are part-time
enrollees, the average time taken to complete an associate‘s degree was three and a half years (as
measured by BPS), and 44% of students pursuing bachelor‘s degrees were still enrolled after six
years. During the 6-year survey period, approximately 29% of all first-time community college
attendees transferred to a 4-year college or university, including about 50% of those with
bachelor degree expectations. Roughly 80% of those who actually transferred had either obtained
a baccalaureate degree or were still pursuing the degree six years after first enrolling in a
community college. Many students who had left the community college without completing a
credential reported positive employment experiences based on their postsecondary education.
However, those who had received a credential were more likely to report favorable impacts than
those who had not earned one.
Roksa and Calcagno (2008) examined the role of academic preparation in community
college students‘ transition to 4-year institutions. The study utilized transcript data for 37,623
first-time, degree-seeking students enrolled in a college credit course at a Florida community
college in fall 1998. Student enrollment was traced for 15 terms including fall, spring, and
summer, through the summer of 2003. With the focus on transfer, the sample was limited to
students who had completed no fewer than 12 non-remedial credits. The study addressed two
main issues: the extent to which academically unprepared students were able to transfer to 4-year

31
institutions, and the role of successful completion of intermediate outcomes in facilitating
transfer and reducing negative effects of inadequate academic preparation. Results suggested that
roughly 20% of students considered unprepared for college-level work when they entered the
community college transferred to a 4-year institution within 15 terms (five years). However,
academically unprepared students trailed their more academically prepared peers, 34% of whom
transferred within five years. Yet, successfully completing intermediate goals ―such as passing
college-level math and writing courses, meeting specific credit thresholds, and earning an
associate degree‖ (p. 2) improved student chances of transfer. Roksa and Calcagno concluded
that community colleges were limited in their ability to alleviate adverse effects of inadequate
academic preparation on transfer. Successful completion of even the most demanding
intermediate outcomes did not remove negative effects of being unprepared for higher education.
Townsend and Wilson (2006) utilized qualitative interviews to identify factors affecting
the academic and social integration of students who had transferred from the community college
to a large state research-focused university. The 19 transfer students were enrolled at the
university during summer and fall 2004. Townsend and Wilson reported that most students
perceived the community college had not adequately prepared them for transfer but that the
university assisted with the transfer process. Responses also indicated that institutional
differences (e.g., size and mission) adversely impacted student academic and social integration at
the university. Based on the research, Townsend and Wilson made three recommendations for
practice by community colleges and 4-year institutions. They were: (a) community colleges may
need to provide more assistance to transfer students, at least initially, to help them better adjust to
a new environment; (b) transfer students need to understand how the mission of a research

32
university affects the behavior of faculty and students; and (c) student support staff at 4-year
institutions may need to take responsibility for helping students integrate into the institution.
Studies by Buckle (2010) and Stewart (2006) provide useful insights into Jamaican
students‘ post-community college education pursuits and stakeholder expectations, respectively.
Buckle‘s study compared the academic performance of community college transfer students with
that of native university students at the University of Technology, Jamaica. The transfer students
had started baccalaureate studies at the community college under franchising arrangements
between both institutions. The designated measures of academic performance were GPA, time to
degree and bachelor degree attainment. The study population comprised an estimated 500
juniors—350 native university students and 150 community college transfers—enrolled as full-
time students in the university‘s business and management faculty during the 2004-2005
academic year. From this population, a sample size of 200 (100 natives and 100 transfers) was
chosen using stratified random sampling technique. The study found no significant difference
between academic achievements of the two groups. Additionally, lower division GPA was found
to be a key determinant in students‘ prospects of achieving the baccalaureate degree.
Meanwhile, Stewart (2006) investigated the quality of the 3-year Associate of Science
Degree (A. Sc.) in Business Studies originally offered by Jamaican community colleges. Stewart
defined quality as ―fitness for purpose, that is, the extent to which the programme has fulfilled its
stated purpose and has satisfied stakeholder expectations‖ (p. i). Employability and transfer
effectiveness were the constructs used to define fitness for purpose. The study utilized a mixed
methods approach to determine the extent to which the curriculum provided graduates with
knowledge, skills, and qualities required by employers and higher education stakeholders. The
community college student sample was drawn from four colleges, representing 23% of the total

33
student population across all eight community colleges. The breakdown was as follows: 84 first-
year students, 59 second-years, and 64 students enrolled in the final year of their program. The
study sample also included 56 graduates of the A Sc. in Business Studies program who had
gained admission into the University of the West Indies (UWI) based on their associate degree
qualifications, 60 students who had gained admission into UWI based on advanced level passes
earned at a community college, and 60 students who had passed their advanced level exams at a
high school. These community college and high school graduates were all enrolled in first-year
social science courses from the1999/2000 through to the 2004/2005 academic years.
Questionnaires were also distributed to lecturers who taught courses in the A. Sc. in Business
Studies program at the four community colleges. Finally, four employers and four graduates of
the A. Sc. program—one from each of the four colleges—were selected for case studies.
Stewart (2006) reported common agreement among stakeholders who expressed how
highly satisfied they were with the program‘s effectiveness and utility. Although approximately
80% of student respondents assigned very high scores to both employability and transfer
effectiveness constructs, in most instances employability was rated slightly higher than transfer
effectiveness. Stewart also found no statistically significant difference in the average
performance of students with associate degree credentials from the community colleges and
those with GCE A‘ Level (i.e., advanced level) qualifications from traditional high schools, in
their first semester at the UWI. Teachers and students were positive about the program‘s capacity
to prepare students for employment, although the former were less specific about the extent to
which the program provided knowledge and skills that could be effectively transferred. Previous
work experience, enrollment reasons, future study plans, and school location were all found to
influence student perceptions. However, school location reportedly had the greatest influence on

34
student responses. The study also found a positive relationship between school location and prior
work experience, with rural students tending to have worked for longer periods before entering
the program.
Student Involvement/Quality of Effort
Findings from pre- and post-1990 research confirmed ―one of the most unequivocal
conclusions‖ (Pascarella & Terenzini, 2005, p. 602): the impact of college is chiefly ascertained
by individual effort and involvement in the academic and nonacademic activities on a campus.
Earlier, Friedlander and MacDougall (1991) arrived at a similar conclusion, emphasizing that
student investment of time in coursework and college-related activities resulted in increased
levels of academic attainment, personal development, and satisfaction with the college
experience. The CCSEQ survey was administered to 1,765 students enrolled in various classes at
a California community college. Students who used the library for research were more likely to
report progress in independent learning, obtaining information, and pursuing ideas than those
who did not. Progress in writing was linked to time devoted to writing activities, while perceived
gains in awareness of cultural diversity and tolerance were related to contacts with students of
varying backgrounds and perspectives.
Other empirical studies of outcomes from the community college experience support
Friedlander and MacDougall‘s (1991) findings. Several of these studies utilized samples drawn
from the CCSEQ database housed at the Center for the Study of Higher Education at the
University of Memphis, Tennessee. Glover (1996) and Ethington and Horn (2007) analyzed data
from the CCSEQ survey completed by community college students across the U.S. who planned
to transfer to a 4-year college or university to complete a bachelor‘s degree. Whereas Glover‘s
study analyzed survey data completed by more than 4,000 students from nine community
35
colleges, Ethington and Horn‘s study utilized a sample drawn from 40 community colleges from
fall 1999 to spring 2001. Results of both studies revealed that students who were more involved
in college-related activities reported greater educational and non-educational achievements than
their peers who were less involved. Glover‘s study found that students who were more involved
in college activities reported more educational and non-educational benefits than those who were
less involved. Ethington and Horn also found increased efforts in extracurricular activities to be
significantly related to perceptions of growth and development.
Polizzi and Ethington (1998) analyzed data from the CCSEQ national database to
investigate differences in the quality of student efforts in varied college experiences, and in
perceived career preparation gains. An initial sample of 3,161 vocational students, described as
those ―enrolled in a vocational program and attending college to gain skills either for a new or a
current job‖ (p. 42) was selected. The sample was reduced to 2,528 as only groups consisting of
at least 200 respondents were chosen, in order to facilitate comparisons between four vocational
groups: business, health, technical/communication and trade/industry. Students with missing
items were also excluded from the sample, which further reduced the sample to 1,891 students.
Polizzi and Ethington reported findings indicating differences among the vocational groups in
effort expended in specific college experiences and in perceived gains in career preparation.
Students in the health major, on average older than students in the other three majors, exerted the
greatest quality of effort in all college activities, and perceived the greatest benefits in career
preparation.
Meanwhile, Swigart and Murrell (2001) examined students attending a 2-year college to
determine if race affected the quality of efforts exerted toward important educational goals and
perceptions of academic and nonacademic gains. A sample of 268 African-American and 284

36
Caucasian students was drawn from a larger national CCSEQ database collected from September
1999 through June 2000. Of the African-American students, 41% were male and 59% female,
with 69% enrolled full-time (i.e., taking 12 or more credit hours). For the Caucasian students
38.5% were male, 61.5% female, and approximately 75% were enrolled full-time. Findings
revealed differences in the relationship between quality of effort, student characteristics, and
self-reported gains for both groups of students. For Caucasian students, self-reported gains were
higher if they were full-time students but lower if females. Swigart and Murrell also reported
greater gains for African-American students, manifested in more involvement toward completing
important educational goals. Generally, results of these CCSEQ-based studies provide strong
support for Pace‘s (1979) proposition that ―student effort is the most important determinant of
growth and development as a result of college attendance‖ (p. 194). Not only does student effort
impact their growth and development, but it also determines educational and career outcomes
(Davis & Murrell, 1993). Likewise, the more involved students are in varied college activities,
the more positive their perceptions of the institution will be. These findings also support student
involvement and departure theories.
The role of social interaction in student educational success at college is much debated.
Such interaction—including participation in student support programs, cultural events, and peer
tutoring—may be vital to the progress of students from disadvantaged groups (Chaney,
Muraskin, Cahalan, & Goodwin, 1998). However, the engagement research studies cited so far
have not distinguished between involvement of younger college students and that of adult
students. Yet it is important to make this distinction since adult students may conceptualize and
experience college participation differently from their younger peers (Kasworm, 2003, 2005).
Using a qualitative case study approach grounded in social constructivist theory, Kasworm
37
(2003) examined how adults conceptualized their classroom learning experiences. The research
was part of a larger study that investigated adult collegiate participation and its relationship to
work, family, and community life roles. Ninety adult undergraduates from six institutions—two
private liberal arts colleges, two public community colleges, and two public universities—were
selected to be part of the final interview sample. Criteria for selection included (a) at least 30
years old, (b) in good academic standing at their institution, (c) currently enrolled in a bachelor‘s
degree or college transfer program at the community college, and (d) completed at least 15 hours
of coursework beyond development studies. From the interviews, three key perspectives
emerged that illuminated how learners construct meanings in the classroom: (a) the classroom as
context for defining college, (b) viewing knowledge in terms of adult life roles, and (c) instructor
actions and elements of program design.
In a follow-up study, Kasworm (2005) examined the nature of adult student identity in a
intergenerational community college classroom. Based on data from an earlier study, the
research focused on how adults defined classroom involvement, and perceptions of their
engagement at college. As in the earlier study, purposeful sampling was used to select
participants. A sample of 28 adult student interviewees was selected from two community
colleges, one rural and the other urban. Study participants were diverse in academic status and in
personal background characteristics such as gender, marital status, enrollment, and employment
status. Kasworm suggested that three identity frames characterized adult students: ―beliefs of
age-appropriate societal norms for involvement in college, beliefs of academic competence based
in age-related notions of academic performance, and beliefs of the ideal college student‖ (p. 8).
Kasworm reported that adult student classroom involvement was characterized by one-on-one
interaction with faculty, illustrated in asking and responding to faculty queries, maintaining eye

38
contact with faculty during lectures and producing quality class work. Active learning tasks in
the college classroom may positively influence institutional commitment, and promote academic
and social integration (Braxton, Milem, & Sullivan, 2000; Tinto, 1993).
Age, Gender, and Enrollment Status
An influx of females, minorities, students of nontraditional age, part-time students,
students working full-time while enrolled, and students from lower-income households, have
swelled community college enrollments (Altbach, 1994; Bryant, 2001; Cohen & Brawer, 2003,
2008; Coley, 2000; Horn, Nevill, & Griffith, 2006; Phillippe & Sullivan, 2005). The community
college research literature distinguishes between traditional- and nontraditional-aged students
(Bahruth & Venditti, 1990; Bryant, 2001). Typically, traditional-aged students are those under
age 25, while nontraditional-aged students are those who are at least 25 years old. Statistics
indicate that the average age of U.S. community college students is 28 (American Association of
Community Colleges [AACC], n.d.). Spitzer (2000) conducted a study of 355 full-time
undergraduates at a private liberal arts college to investigate the best predictors of college GPA
and career decidedness for traditional and nontraditional students. The sample consisted of 267
students of traditional age (age 23 or younger) and 88 students who were 25 or more years old.
The sample was 92% white and 8% Hispanic and African American, reflecting the ethnic
composition of the campus. Data was obtained from several self-report questionnaires and a
background information sheet. Spitzer reported that predictors of GPA (self-regulation, academic
self-efficacy, social support) were consistent with literature. Besides, nontraditional students and
females had higher GPAs and were more focused on career goals. They were found to be more
motivated and self-regulated than traditional students who depended more heavily on the
instructor. They viewed themselves as enhancing the learning process. Grimes (1995) found that

39
older students demonstrated stronger and more goal-focused study techniques than younger
classmates. However, Boylan (2001) argued that students who return to college after being out of
school for a number of years may be less prepared for college than traditional-aged students.
In a related study, Terenzini, Springer, Yaeger, Pascarella, and Nora (1996) investigated
whether precollege characteristics and college experiences of first-generation students differed
from those of traditional students, and the impact of any differences on specific education
outcomes in the first year of college. First-generation students refer primarily to students who are
the first in their families to attend college. The research was part of a 3-year National Study of
Student Learning (NSSL) study of approximately 4,000 new students entering 18 four-year and 5
two-year U.S. colleges and universities in fall 1992.The current study had a sample of 2,685
students (825 first generation and 1860 traditional students) who had completed the first year of
study. Findings indicated differences in both the precollege characteristics and college
experiences of first-generation and traditional students. First-generation students were mainly
female, older, tended to come from lower-income homes, of Hispanic origin, and initially had
lower critical thinking skills. They also had lower degree goals, more dependent children and
reported receiving less encouragement from family to attend college. However, first-generation
students appeared more confident about career goals although they expected having to take a
longer time to complete degrees.
Before 1978, fewer women than men attended college, but ―by 2003, women were ahead,
58 to 42 percent‖ (Cohen & Brawer, 2008, p. 52). Each year since 1978, women in U.S.
community colleges have earned more associate degrees than men. In fact, women are
outperforming men in ―high school grades, test scores, and college preparatory coursework‖
(Kuh, Kinzie, Buckley, Bridges, & Hayek, 2007, p. 23). Society‘s changing attitude toward

40
women‘s roles in the workplace and the home, and relatively greater economic benefits as a
result of college attendance, may be additional factors influencing the increased numbers of
women attending American colleges.
The link between gender and participation is a characteristic feature of Caribbean
education, where ―girls are more highly represented in those sections of the secondary and
tertiary levels of the education system that enhance the prospect of upward social mobility‖
(Miller, 2000, p. 135). This pattern of female dominance is especially evident in Jamaica‘s
tertiary education sector (Miller, 2000; PIOJ, 2009; UNESCO-UIS, 2009). The 2009 Gender Gap
report confirmed the ratio of females to males in postsecondary education in Jamaica as 2.29 to 1
(Hausmann et al., 2009). Females outnumber males in both full-time and part-time enrollments
(Evans & Burke, 2006). Whereas most full-time students enroll in Jamaica‘s public institutions
including community colleges, most part-time students are enrolled in private colleges. Gender
differentiation also extends to Jamaica‘s community colleges (CCCJ, 2009a). Most recent
community college enrollment statistics indicate that female students outnumber males by
approximately 2 to 1(MOEC, Jamaica, 2009). To date, no published studies have compared the
academic performance or persistence rates of male and female community college students in
Jamaica.
Leppel (2002) used data from a 1990 BPS survey to investigate the progress of a group
of 2,647 male and 2,737 female U.S. students who began postsecondary education during the
1989-1990 academic year. The study investigated factors influencing college persistence of men
and women enrolled in baccalaureate degree courses. Initial results indicated no statistically
significant difference in the persistence rates of men and women. However, when other factors
were controlled, women‘s persistence advantage increased over men‘s—leading to Leppel‘s

41
conclusion that characteristic differences between male and female students may affect
persistence. Other findings indicated the combined effect of marriage and children was negative
for both men and women and that being older also lowered persistence rates for both sexes.
Between 1970 and 1990, part-time undergraduate enrollment in U.S. postsecondary
institutions more than doubled, increasing from 2.1 to 5 million students (Horn & Premo, 1995).
In contrast, full-time enrollment in the same period increased by only one-third. Nontraditional
students are overly represented in U.S. community colleges and other similar institutions where
they generally pursue shorter programs than students enrolled at 4-year colleges/universities.
Horn and Premo (1995) found that among part-time students, 55% pursued associate degrees
while 15% were enrolled in vocational certificate programs. In a study that focused on
perceptions of community college students, Horn and Ethington (2002) researched whether
students from different ethnic backgrounds and enrollment status varied in their perceptions of
growth and development outcomes from the community college experience. The sample
consisted of four ethnic groups—Asian /Pacific Islander, Black/African-American,
Hispanic/Latino, and Caucasian—comprising 178 full-time and 178 part-time students, and a
total sample size of 1,424. Data were taken from the national administration of the CCSEQ and
the sample was restricted to students intending to transfer to a four-year institution. Full-time or
part-time status was based on the number of credits taken at the college students were attending
at the time of the study. Findings from the multivariate test for the interaction of ethnic group
and enrollment status were not statistically significant, and differences in perceived growth
among ethnic groups were not dependent on enrollment status.
42
Employment Status, Family Responsibilities and Time on Campus
Generally, researchers have found that a student‘s employment status and the demands of
family responsibilities adversely affect academic achievement and persistence in college. The
student who holds a full-time off-campus job and has family commitments typically has little or
no time to spend on campus. Therefore, there may be no opportunities to build strong collegial
social relationships or to be involved in campus activities. Astin (1993) stressed that working
full-time ―is associated with a pattern of outcomes that is uniformly negative‖ (p. 387), and
having a part-time job off-campus produces effects similar to full-time employment. Bers and
Smith (1991) surveyed 1142 students at a community college in the U.S. Midwest to investigate
the extent to which persistence in college could be predicted by students‘ social and academic
integration in the community college. Study participants were randomly drawn from enrollments
in fall 1988. Student background characteristics—age, gender, employment, ethnicity, and
program, were the covariates included in the analyses. Results revealed that employment status
was most significant, as persisters and nonpersisters varied substantially with respect to outside
employment. Students who persisted tended to be employed outside of college for fewer hours
than those who did not persist. However, unemployed students were less likely to continue
college than those having part-time employment. Moreover, most students above age 25 were
employed full-time. Bers and Smith concluded that employment demands and family
responsibilities might have affected persistence.
However, Balunas (1986) reported completely different findings from a study conducted
at a community college in New York. Balunas used the American College Testing (ACT)
Student Opinion survey in spring 1985 to examine the relationship between number of hours of
employment, GPA and persistence in college of American community college students. The

43
survey collected background information, such as age, gender, marital status, and family
responsibilities from a sample of 464 predominantly white (422) students enrolled in day
programs at the community college. Most of the sample (270) comprised female students. The
students were enrolled in several majors—liberal arts, business, technologies, and health. Results
indicated no significant relationship between number of hours worked per week and GPA. There
was also no significant difference in number of hours worked and college enrollment for the
ensuing semester.
Still, more recent findings from comprehensive national studies indicate that employment
outside of college and family responsibilities may indeed predict engagement and persistence in
college. The Community College Survey of Student Engagement (CCSSE) 2008 report provided
an analysis of the most and least engaged community college students. The report was based on
data collected from a sample of more than 343,000 students from 585 institutions in 48 American
states as well as British Columbia, the Marshall Islands, and Nova Scotia. Findings contained in
the 2008 report were corroborated by the 2009 report (CCSSE, 2009). Both reports revealed that
male students, part-time students, students who work more than 30 hours per week, and
traditional-aged students were among the least engaged community college students. By contrast,
female students, full-time students, students who worked fewer than 30 hours per week, and
students of nontraditional age were among the most engaged. The American Council on
Education (ACE) also released statistics for 2003 showing that more than 80% of beginning
postsecondary students—primarily those enrolled in 2-year colleges—worked at some time
during college enrollment. On average, these students were employed for 30 hours each week.
Although limited employment (working fewer than 15 hours per week) increased persistence and
achievement, work intensity (working 30 or more hours each week) was linked to academic

44
failure. Students who started postsecondary education at a 2-year college and who either did not
work or worked less than 15 hours per week during the first year of college were more likely to
attain a degree or certificate (43% and 45%, respectively) than students who worked in excess of
30 hours per week (24%).
Work intensity and family responsibilities are key risk factors in student persistence,
according to findings from a comprehensive national study commissioned by the U.S.
Department of Education. Horn and Premo (1995) analyzed data from the 1992-1993 National
Postsecondary Student Aid Study (NPSAS: 93). They identified six risk factors for
nontraditional students in the 1992-1993 undergraduate cohort: (a) delayed postsecondary
education, (b) part-time enrollment, (c) independent student status, (d) dependents, (e) single
parent status, and (f) not graduating from high school. Findings revealed that approximately two-
thirds of the undergraduates were affected by at least one of these risk factors, though students
tended to be affected by more than one factor. For example, full-time employment was
associated with part-time enrollment, and students who had dependents worked full-time and
attended college part-time. Among the 1992-1993 cohort, female students were more likely than
males to be older and to have dependents (56% vs. 48%). The report also identified students who
were single parents as one of the groups most at risk of missing classes and withdrawing from
postsecondary education. Unlike nontraditional peers who had substantial responsibilities outside
of college, traditional students generally demonstrated no risk factors. Approximately 56% of
dependent students attained a degree or certificate six years after beginning postsecondary
education, compared with 36% of independent students without children, and 41% of
independents with children. Finally, students with multiple risk factors tended to be females who
were disproportionately enrolled in 2-year or less than 2-year institutions.
45
Parent Education
Postsecondary enrollment is strongly associated with parents‘ education, and parents‘
increased educational status is typically matched by an increase in postsecondary enrollment
(Choy, 2001). These findings were among several presented in a 2001 report sponsored by the
U.S. Department of Education National Center for Education Statistics (NCES). The report was
based on findings from three nationally representative longitudinal studies conducted by NCES:
the National Education Longitudinal Study (NELS), the Beginning Postsecondary Students
Longitudinal Study (BPS), and the Baccalaureate and Beyond Longitudinal Study (B&B). The
NELS study followed a 1988 group of 8th graders until 1994 when most had completed high
school. They were studied every two years until 1994, and then six years later, in 2000.
Meanwhile, the BPS comprised students of varying ages whose first enrollment in postsecondary
education occurred in either 1989-1990 or 1995-1996. The 1989-1990 group was again surveyed
in 1992 and 1994, and the second group was surveyed in 1998. Finally, the B&B study was
administered to 1992-1993 baccalaureate degree awardees in 1994 and 1997.
Choy (2001) found that parents became more involved in their children‘s education when
their education increased, and that students from low-income families were disproportionately
represented among those whose parents had low education. In 1999, 82% of students whose
parents had at least a bachelor‘s degree enrolled in college directly after high school. However,
parent education was important even among those who planned to enroll in a 4-year institution
immediately after high school. By 1994, 65% of those whose parents did not attend college had
enrolled in a 4-year institution, as against 87% of those whose parents had at least a bachelor‘s
degree. Statistics also indicated that high school graduates whose parents did not attend college
were twice as likely as their peers whose parents had attained bachelors or higher degrees to

46
attend public 2-year colleges instead. Choy‘s findings corroborated results of an earlier study that
was also commissioned by the U.S. Department of Education, NCES (Horn & Nuñez, 2000).
Horn and Nuñez reported that first-generation students were less likely than their peers to
participate in academic programs leading to college enrollment within two years of graduating
from high school. In addition, these students consistently trailed peers with educated parents. In
fact, Horn and Nuñez found very noticeable disparity between first-generation students and peers
from families in which at least one parent had attained a bachelor‘s degree. They also found
strong correlation between enrollment in a 4-year college and completion of advanced math
programs.
Using Tinto‘s (1975, 1993) student departure theory to test transfer behaviors and
attitudes of community college students, Nora and Rendón (1990) surveyed students enrolled in
six U.S. community colleges. The study specifically investigated the influence of student
background characteristics, attitudes and behaviors displayed during enrollment at the
community colleges. A systematic random sample was used to select students in four majors
from which transfer was regarded as most likely to occur. The sample was restricted to Hispanics
and Whites, with a total of 569 usable surveys selected for data analysis. The main reason cited
for attending the community college was preparation to transfer to a 4-year college or university.
Nora and Rendón also found that students whose parents had higher levels of educational
achievement demonstrated higher levels of transfer-related behaviors. Not only did they view
transferring in a positive light, but they also tended to apply to more institutions than peers
whose parents were not as educated. No published research has focused on the educational
background of parents whose children are enrolled in Caribbean postsecondary education.

47
Academic Major
From its inception, the community college‘s curricular functions have included
preparation for academic transfer, technical/vocational education, continuing education,
developmental/remedial education, and community service (Cohen & Brawer, 2008; Coley,
2000). Astin (1993) examined 14 freshman majors, two of which (agriculture, and mathematics
and statistics) did not produce significant effects on student outcomes. Astin surmised that the
seeming lack of impact of these majors on student outcomes might be more a reflection of the
small numbers of students enrolled. Results for the other categories indicated the following direct
effects: (a) engineering produced the most significant impact on student outcomes; (b) majoring
in biological science, business, education, fine arts, physical science, and social science,
increased students‘ chances of later pursuing careers directly or indirectly related to these fields;
(c) majoring in the health professions positively influenced self-reported gains in work-related
skills; (d) majors in the humanities positively impacted college GPA, as well as gains in foreign
language and writing skills; and (e) choosing a psychology major was positively linked to several
academic outcomes.
Meanwhile, Pascarella and Terenzini (1991) claimed that based on accumulated
evidence, ―the impacts of academic major are markedly stronger and more consistent in
cognitive areas than in noncognitive ones‖ (p. 614). According to the authors, students showed
highest levels of learning and proficiency in content tests that were congruent with their
academic major. Yet, Pascarella and Terenzini found little consistent evidence to support the
premise that academic major significantly impacted one‘s overall intelligence. Although most of
the post-1990 findings on the effects of major fields support conclusions reported in the 1991
book, new evidence has also emerged (Pascarella & Terenzini, 2005). For example, contrary to
48
pre-1990 findings, more recent research indicates that academic major has ―a significant
influence on occupational status‖ (p. 606). Individuals majoring in traditionally male-dominated
fields such as engineering, mathematics, and the physical sciences tended to be
disproportionately represented in occupations traditionally recognized as high-status fields.
However, the impact of undergraduate major on career mobility in business could not be
conclusively determined from the evidence.
Satisfaction with College
Student perceptions of the environment of their institutions may be important to the
quality of the undergraduate experience (Kuh et al., 2007). Yet, satisfaction with the institution
tends to be disregarded. Murrell and Glover (1996) contended that outcome assessment efforts
do not investigate the interaction between students and community college environments.
However, knowledge of learner activities and their responses to the institution‘s efforts to
provide a ―rich educational environment can add an important dimension in determining the
impact of the educational experience‖ (p. 199). The college environment is a broad term that
includes interpersonal interactions with instructors and peers, academic and nonacademic
support services, and physical resources and facilities. Glover‘s (1996) study of the effects of
campus environment on U.S. community college students found that positive perceptions of
college significantly predicted educational, personal, and social benefits, regardless of age. In
other words, students who evaluated the campus environment most favorably reported greater
academic and nonacademic benefits than peers who were less satisfied.
Kuh and Hu (2001) studied the nature and impact of student-faculty interactions in the
1990s, to determine its impact on student satisfaction during college. They wanted to determine
whether different types of student-faculty contact contributed to learning and satisfaction. Data

49
for the study was obtained from student responses to Pace‘s College Student Experiences
Questionnaire (CSEQ) administered to a sample of 5,409 students randomly selected from126
colleges and universities. Results revealed that faculty-student contact increased during college,
with upper division students more likely to hold stimulating discussions with faculty than lower
division students. The most common type of contact with faculty reported by students involved
seeking course information. Institutional environments characterized by high quality interactions
among students, faculty, and administrators consistently and positively influenced student
satisfaction. However, effects of student-faculty interaction were conditional in that academically
prepared students interacted more frequently with faculty than less prepared peers. Both
academic-related and social out-of-class interactions appeared to have a positive effect on
student satisfaction with the college experience. Kuh and Hu concluded that if colleges expected
to produce satisfied students they should ―develop and sustain a welcoming, supportive,
affirming environment‖ (p.328). Astin (1993) and Thomas (2000) also affirmed the importance
of student-faculty interchange to student overall development and satisfaction with college.
Other researchers have focused on students‘ satisfaction with physical facilities at
college. Veltri, Banning, and Gray Davies (2006) used a qualitative case study to examine
community college students‘ perceptions of the value of specific classroom attributes. They
explored the role of students in classroom design, students‘ assessment of the impact of the
classroom‘s physical structure on their learning, and their expectations of future classroom
design. Students identified physical factors that ―had negative impact on their learning and made
the classroom less than enjoyable‖ (p. 520). These physical features included insufficient space
and furniture, and the arrangement of the room. By contrast, ―physical space amenities where
furniture allowed for group work, interaction, and the room‘s arrangement allowed students to
50
see visuals regardless where they were seated‖ (p. 522) were reportedly more conducive to
learning. Students also graphically illustrated their perceptions of the ideal learning environment.
Pascarella and Terenzini (2005) observed that studying institutional environments may be
more meaningful than emphasizing structural characteristics such as private versus public status,
size, and single-sex versus coeducational orientation. Focusing on the college environment may
provide greater insights into ―between-college effects on learning and cognitive development‖
(p. 599). Pascarella and Terenzini also reported that institutions with an intellectual or analytical
focus facilitated learning and cognitive development, despite size and selectivity. The Noel-
Levitz 2008 National report on 4- and 2-year institutions emphasized the significance of
institutional choice in predicting student satisfaction and the likelihood of remaining at their
institutions. The 2008 report presented a comprehensive compilation of data from students,
faculty, staff, and administrators in the U.S. and Canada. Student responses were collected over a
3-year academic period, from fall 2005 through spring 2008. Among students enrolled in U.S.
institutions, responses were obtained from198,833 students from 244 community, junior, and
technical colleges. The report highlighted greater satisfaction among community college students
than those from 4-year institutions. Across all institution types, females indicated higher levels of
satisfaction than their male peers. Of importance, 68% of community college students enrolled at
their first choice institution expressed satisfaction with the institution, while 79% indicated that if
they had to repeat their education choice they would re-enroll at the same institution. Among
respondents for whom the institution was their second choice, 50% expressed satisfaction with
the institution and 58% would be willing to re-enroll. Based on the reported statistics,
community and technical colleges obtained the highest scores for likelihood to re-enroll at the
community college. The Noel-Levitz 2010 National report confirmed findings about student
51
satisfaction contained in the 2008 report. According to the 2010 report, community college
students across North America have indicated increasing levels of satisfaction for four of the last
five years. Students of nontraditional age, part-time enrollees, and those whose educational goal
was attaining an associate degree reported greatest satisfaction with the community college
experience.

52
CHAPTER 3
METHOD
This chapter describes the method used to accomplish the present study. The chapter
begins with a restatement of the purpose of the study and research questions. The remainder of
the chapter is organized into eight sections describing the logical framework, research design,
participants, instrumentation, data collection procedure, data preparation, data analysis, and
limitations of the study.
Purpose Statement
This survey study investigated the extent to which involvement in course-related and
extracurricular activities combined with personal (age, gender, employment status, family
responsibilities, parents‘ education) and college-related (full-time/part-time enrollment, major,
time on campus, satisfaction with college) characteristics predicted Jamaican community college
students‘ perceived readiness for immediate post community college goals. I theorized that the
predictor variables—involvement in class and extracurricular activities (Astin, 1984; Braxton,
Milem, & Sullivan, 2000; Chaney, Muraskin, Cahalan, & Goodwin, 1998; Davis & Murrell,
1993; Pace, 1984; Tinto, 1975, 1986, 1993); age and gender (Bailey, 2004; Grimes, 1995;
Leppel, 2002; Miller, 2000; Spitzer, 2000); enrollment status (Astin, 1993; Bean & Metzner,
1985; Horn & Ethington, 2002); employment status and family responsibilities (CCSSE, 2008,
2009; Horn & Premo, 1995); time on campus; parents‘ education (Choy, 2001; Horn & Nuňez,
2000); program major (Cheng, 2001; Pascarella & Terenzini, 1991, 2005); and satisfaction with

53
college (Glover, 1996; Pascarella & Terenzini, 2005; Tinto, 1998) might be indicators of
Jamaican students‘ perceptions of readiness for immediate post community college goals.
The outcome construct—perceived readiness for immediate post-community college goals—was
defined as students‘ impressions of their readiness to pursue goals upon completing studies at the
community college. The complex mission of U.S. and Caribbean community colleges includes
preparing students for higher education and work (Bailey, Jenkins, & Leinbach, 2005; Grant-
Woodham & Morris, 2009; Ignash & Townsend, 2001; Laanan, 2000; Walsh, 2005; Wolff,
2009). Consequently, postschool goals were operationalized as work and/or higher education.
Research Questions
The following research questions were examined:
1. What are the personal and college-related characteristics of Jamaican community college
students, and what goals do they intend to pursue after completing current studies at the
community college?
2. What forms of class-related and college extracurricular activities do Jamaican community
college students actively and regularly engage in?
3. What work- and college-related tasks do Jamaican community college students feel most
ready to perform?
4. What aspects of their college experiences are these Jamaican community college students
most satisfied with?
5. To what extent does involvement in classes and college extracurricular activities
independently and collaboratively explain Jamaican community college students‘
perceived readiness for work and for higher education, respectively?
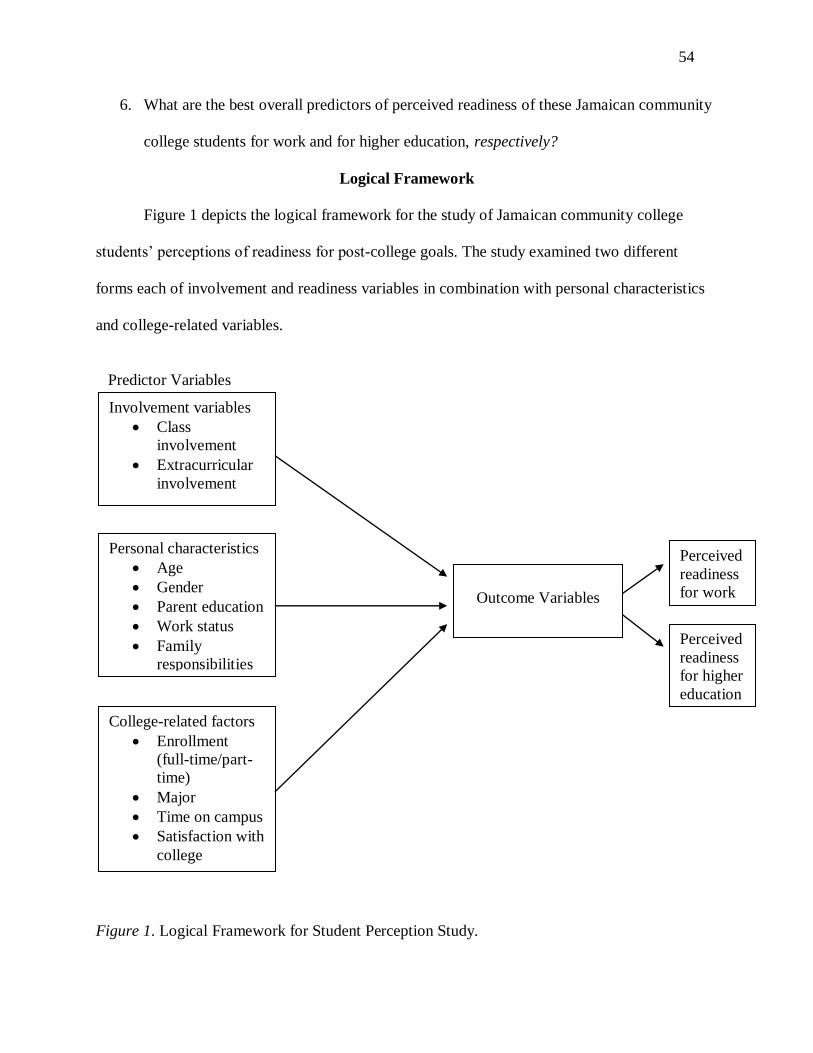
54
6. What are the best overall predictors of perceived readiness of these Jamaican community
college students for work and for higher education, respectively?
Logical Framework
Figure 1 depicts the logical framework for the study of Jamaican community college
students‘ perceptions of readiness for post-college goals. The study examined two different
forms each of involvement and readiness variables in combination with personal characteristics
and college-related variables.
Predictor Variables
Figure 1. Logical Framework for Student Perception Study.
Involvement variables
Class
involvement
Extracurricular
involvement
Personal characteristics
Age
Gender
Parent education
Work status
Family
responsibilities
College-related factors
Enrollment
(full-time/part-
time)
Major
Time on campus
Satisfaction with
college
Outcome Variables
Perceived
readiness
for work
Perceived
readiness
for higher
education

55
The logical framework evolved from review of the college student involvement literature,
and conceptualizes a student‘s perceived readiness for work and higher education as each being
predicted by three sets of variables, including involvement in classes and college extracurricular
activities, personal characteristics, and college-related factors. Involvement variables are
grounded in Astin‘s (1984) student involvement theory, Pace‘s (1984) quality of effort construct,
and Tinto‘s (1975, 1993) student departure theory. These theorists concurred that the degree to
which a student benefits from college is directly related to level of involvement and integration
in academic and non-academic college activities. The involvement variables were, therefore,
presumed to be key predictors, and the study investigated the extent to which this was the case.
The two outcome variables—perceived readiness for work and for higher education—were
consistent with the employment and higher education missions of the Jamaican community
college sector (Adamson, n.d.; Evans & Burke, 2006; Miller, 2000; Walsh, 2005).
The framework also proposed that a student‘s personal characteristics such as age,
gender, employment status, family responsibilities, and parent education may influence
perceived readiness for work and higher education goals. The importance of student background
characteristics to college persistence has been widely recognized (Bean & Metzner, 1985; Choy,
2001; Grimes, 1995; Leppel, 2002; Pascarella & Terenzini, 2005; Spitzer, 2000; Tinto, 1987,
1993). Likewise, college-related factors such as enrollment status (Astin, 1993; Bean & Metzner,
1985; Horn & Ethington, 2002), major (Cheng, 2001; Pascarella & Terenzini, 1991, 2005), time
on campus, and satisfaction with the college experience (Glover, 1996; Tinto, 1998) have been
found to influence persistence and perceptions of benefits from the college experience.
The logical framework was designed to illustrate that a variety of factors might impact
college students‘ perceptions of how prepared they are to pursue goals after college. It
56
hypothesized that involvement in classes and in college extracurricular activities are important
factors which, together with student personal and college-related characteristics, may predict
perceptions of student readiness to pursue work and higher education goals. For Jamaican
community college students enrolled in the final year of a community college-developed
associate or baccalaureate degree, and who indicate employment or higher education plans
directly after completing these studies, the framework presents several conceptualizations. First,
a student who is actively engaged in classes and in extracurricular college activities may perceive
greatest readiness for employment or higher education goals. Second, students enrolled in
specific majors and those who indicate satisfaction with the overall college experience may feel
more prepared for employment or higher education goals than their peers. Third, perceptions of
readiness for work or higher education studies may be linked to age and gender. Fourth, students
who attend college as part-time enrollees, hold full-time jobs while attending college, and who
have family responsibilities may feel less prepared for higher education goals and more prepared
for work than their peers who do not meet these criteria. Finally, students with at least one parent
or guardian holding a college degree may perceive greater readiness for work and higher
education goals than peers whose parents do not.
Research Design
The study utilized a cross-sectional survey design. In a cross-sectional design, data is
collected at one point in time, although the actual data collection period may vary (Fraenkel &
Wallen, 2006). Survey research is a non-experimental quantitative design widely used in the
social sciences (Muijs, 2004). However, surveying in the 21st century has been transformed from
a relaxing interactive encounter to a highly detached experience that is increasingly mediated by
technology (Dillman, Smyth, & Christian, 2009).

57
Yet, despite the mode utilized—internet, mail, or mixed—the survey is generally
recognized for its (a) value as a source of scientific information (Creswell, 2003, 2008;
Scheuren, 2004), (b) effectiveness in systematically collecting and documenting feedback
(Richardson, 2005), (c) replicability with a wide range of participants for various purposes,
especially when coverage rather than depth is desired (Babbie, 1990; Hill, 2001), (d) ease of
administering, recording responses, and managing the data collection process, (e) relatively low
cost, and (f) suitability for sensitive topics, or when anonymity is preferred. For these reasons,
survey design was deemed appropriate for this perception study. I administered the survey at
each participating college, according to tailored design approach (Dillman et al., 2009) and
Institutional Review Board (IRB) protocol (see Appendices B-E).
Participants
Population
The population for this study (N = 1,531) comprised students enrolled at eight public
community colleges in Jamaica, three of which are residential colleges. Approximately 70% of
the population was concentrated in three colleges (CCCJ, 2010). The following criteria defined
the population: (a) students enrolled in one of eight Jamaican community colleges, recognized as
part of the CCCJ, (b) completing the final year of a community college-developed associate or
bachelor‘s degree program, (c) full- and part-time enrollees, and (d) pursuing one of four
majors—business studies; hospitality and tourism; computer; or architecture and construction
technology. Data revealed that 50% of the population was enrolled in a business studies major,
24% were pursuing hospitality and tourism studies, 18% were enrolled in a computing major and
8% were completing an associate degree in architecture and construction technology. Final-year
students were selected for the study based on presumed acquired college experiences and greater
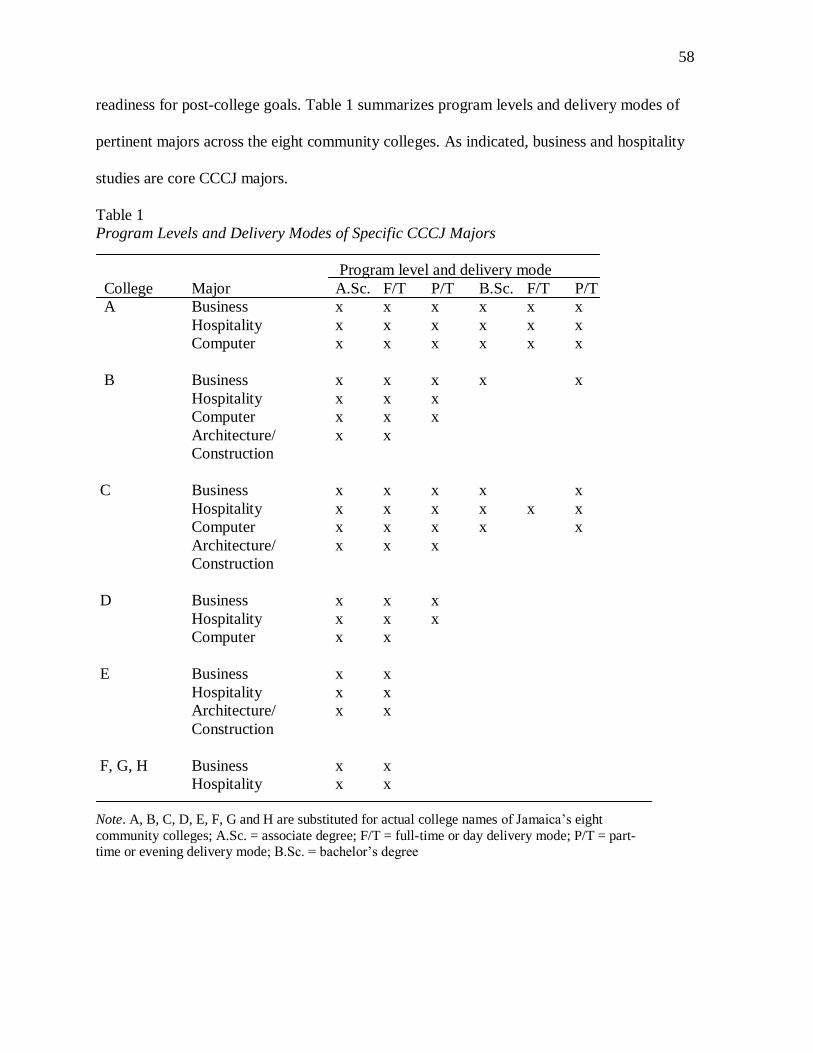
58
readiness for post-college goals. Table 1 summarizes program levels and delivery modes of
pertinent majors across the eight community colleges. As indicated, business and hospitality
studies are core CCCJ majors.
Table 1
Program Levels and Delivery Modes of Specific CCCJ Majors
Program level and delivery mode
College Major A.Sc. F/T P/T B.Sc. F/T P/T
A Business x x x x x x
Hospitality x x x x x x
Computer x x x x x x
B Business x x x x x
Hospitality x x x
Computer x x x
Architecture/ x x
Construction
C Business x x x x x
Hospitality x x x x x x
Computer x x x x x
Architecture/ x x x
Construction
D Business x x x
Hospitality x x x
Computer x x
E Business x x
Hospitality x x
Architecture/ x x
Construction
F, G, H Business x x
Hospitality x x
Note. A, B, C, D, E, F, G and H are substituted for actual college names of Jamaica‘s eight
community colleges; A.Sc. = associate degree; F/T = full-time or day delivery mode; P/T = part-
time or evening delivery mode; B.Sc. = bachelor‘s degree

59
Sample
The optimal sampling plan for any study is the one that yields the most representative
sample of the chosen population (Huberty & Petoskey, 1999). Furthermore, the type of sample a
researcher uses will influence ―the accuracy of the inferential guess or the definition of the
population toward which the inferential guess is directed‖ (Huck, 2008, p. 105). With this in
mind, a simple random sample was the preferred strategy for this study. In a simple random
sample, each member of the population has ―an equal and independent chance of being selected‖
(Fraenkel & Wallen, 2006, p. 95). Once a sufficiently large sample is drawn, there is a strong
possibility that the sample will be representative of the population of interest.
However, several barriers ultimately led to the use of a nonrandom convenience sample.
The difficulties encountered included lack of timely communication from most colleges,
difficulty of obtaining enrollment data and class lists, bureaucracy at some colleges, which
adversely affected communication dissemination to relevant personnel, and sudden changes to
scheduled college visits. Consequently, a convenience sample was taken from seven of the eight
Jamaican community colleges, as one college chose not to participate in the study. In a
convenience sample, data is collected based on the availability of individuals and the
corresponding population is hypothetical in that the researcher believes it comprises individuals
similar to those in the sample (Huck, 2008). The major disadvantage of the convenience sample
is the possibility of bias since it is not representative of the target population (Fraenkel &
Wallen, 2006). Huck (2008) recommended providing detailed descriptions of convenience
samples in order to conceptualize the nature of the abstract population to which inferences are
directed.

60
Three main steps were taken to minimize the risk of bias in the sample. First, sample
selection strictly adhered to criteria identified previously (i.e., full- and part-time Jamaican
community college students, final-years, completing one of four specified majors). Thus, a
criterion-based convenience sampling method was utilized. Criterion sampling enables a
researcher to select a sample based on set criteria (Gall, Gall, & Borg, 2007). Second, student
groups were chosen from the population of interest based on current college enrollment data and
class lists. Third, every attempt was made to select as large a sample as possible from each
participating college. Although using too few or too many participants in regression analyses
may be problematic (Green, 1991), a large sample size is required if a researcher wishes to detect
small meaningful effects or differences in population means (Olejnik, 1984). Moreover, large
sample sizes are justified for regression studies that include many predictors (e.g., k ≥ 10), if
accuracy is desired (Algina & Olejnik, 2000). Algina and Olejnik (2000) determined that sample
size of 343 is needed to achieve ± 0.05 accuracy when k = 10, p2 = 0.05 and the median value of
the distribution of adjusted R2 = 0.048. Krejcie and Morgan (1970) recommended a sample size
of 310 for a population of 1600. The total sample chosen for this study (n = 554) included over
90% of the target population at one college, and 60% at another. Table 2 summarizes population
data for all eight colleges and the sample size from each college included in the study.
Table 2
Study Population and Sample Size from Each College
College Population Sample size % sampled
A 300 179 60
B 386 150 39
C 393 65 17
D 195 51 26
E 109 48 44
F 60 35 58
G 28 26 93
H* 60 0 -
Total 1531 554 36 Note. * This college did not participate in the study.

61
Instrumentation
A researcher-designed self-report survey instrument was used for this study of Jamaican
community college students‘ perceptions of their readiness for post-college goals. A self-report
instrument can provide valuable information about individuals‘ beliefs, attitudes, and behaviors.
Surveys produce numerical scores from which inferences can be made about individual
differences on personal attributes (Gall et al., 2007). The decision to develop an instrument was
taken after examining several student involvement surveys. Two of these instruments were
particularly useful, namely, the CCSEQ (Pace, Friedlander, Lehman, & Murrell, 1999), and The
Community College Student Report (CCSR)—survey instrument for the Community College
Survey of Student Engagement (CCSSE, 2005). However, both instruments are lengthy. Unduly
lengthy or complex surveys might jeopardize accuracy and response rates, and increase
administration costs (Hill, 2001). In addition, the instruments contained items irrelevant to the
Jamaican education context and do not directly measure readiness behaviors. Using either
instrument to survey Jamaican community college students would, therefore, raise serious
validity concerns.
Two studies investigated educational gains of Jamaican community college students
(Buckle, 2010; Stewart, 2006). Stewart‘s (2006) study most closely paralleled the current study.
To determine the utility of a 3-year Associate of Science degree (A. Sc.) in business studies,
Stewart surveyed community college students and teachers, as well as employers and higher
education representatives. Goals of the current study were similar to Stewart‘s study. However,
whereas the earlier study explored student and stakeholders‘ perceptions of one program that is
no longer offered, this study focused entirely on the perceptions of students enrolled in four
majors currently offered across the Jamaican community college system. Moreover, unlike
62
Stewart‘s study, the current research involved students enrolled in associate and bachelor‘s
degree programs. Furthermore, the survey instruments used in the previous study were not
available to guide instrument development for this study. Consequently, I decided to develop an
instrument with items reflecting involvement and readiness behaviors among the population of
interest. The 5-page instrument contained 51 items, 39 of which measured five constructs:
involvement in classes and class activities (IC), involvement in extracurricular activities (IE),
perceived readiness for work (PRW), perceived readiness for higher education (PRH) and
satisfaction with college (SATC). The involvement and readiness constructs were central to this
study. However, completion of the PRH construct items was optional for participants who did
not intend to pursue higher studies upon completing current studies at the community college.
The survey also contained a general section, with open- and closed-ended questions designed to
obtain demographic and background information about study participants. The Student
Involvement Questionnaire used to collect data for this dissertation study appears in Appendix F.
Instrument Development
The instrument development process encompassed three broad phases: (a) developing
measures of involvement and readiness, (b) selecting predictor and outcome variables, and (c)
conducting survey validation activities. Each of these phases incorporated several logical steps,
explained in the ensuing discussion.
Clarifying involvement and readiness. Involvement and readiness were primarily
clarified based on the community college literature and theories of student involvement and
integration. Over the years, a growing body of community college literature has focused on the
benefits of student involvement and the quality of student efforts in educational and non-
educational contexts on campus (Cohen & Brawer, 2003, 2008; Davis & Murrell, 1993;

63
Ethington & Horn, 2007; Ethington & Polizzi, 1996; Friedlander & MacDougall, 1991; Glover,
1996; Pascarella & Terenzini, 1991, 2005; Polizzi & Ethington, 1998; Swigart & Murrell, 2001).
Predicated on theories of student involvement and integration, these studies have found that
students who are more immersed in academic and non-academic college activities report greater
educational and non-educational achievements than peers who expend less effort. Thus, the
extant community college literature conceptualizes student involvement as embodying both
quality and quantity of participation. Likewise, readiness for immediate post-college goals was
defined based on literature about the mission of community colleges in the Caribbean and the
U.S. (Grant-Woodham & Morris, 2009; Ignash & Townsend, 2001; Laanan, 2000; Pearson,
Ethington, Gould, & Murrell, 2009; Walsh, 2005; Wolff, 2009). Traditionally, students‘ reasons
for enrolling in community colleges in the Caribbean and the U.S. include program transfer and
preparation for the workforce. Therefore, perceived readiness for immediate post-college goals
was operationalized as student impressions of how ready they are to begin or continue
employment and/or to pursue higher education studies after completing current studies at the
community college.
Items measuring involvement and readiness. The second stage in developing measures
for student involvement and readiness practices involved generating and refining a large pool of
items. Huberty and Petoskey (1999) advised against using single items to measure a
characteristic or trait as this could adversely impact validity and reliability, and restrict the
variability of scores. A preliminary set of items was generated based on careful review of the
literature, existing instruments, informal conversations with Jamaican community college and
university lecturers, and personal experience as an instructor and former program coordinator at
a Jamaican community college. Creating an item pool to measure involvement and readiness

64
behaviors entailed a thorough review of existing community college instruments such as the
CCSEQ and CCSR, which are founded on involvement theories similar to those underlying this
study. The CCSEQ was adapted to fit the diverse U.S. community college student population and
experiences (Pace, 1992) and focuses on the quality of effort students put into learning
(Ethington, Guthrie, & Lehman, 2001; Friedlander, Murrell, & MacDougall, 1993). The
instrument contains more than 100 items measuring student involvement in a wide variety of
college academic and non-academic activities. Students are also asked to estimate benefits
gained from involvement in these activities. The CCSR collects data on the engagement of
American community college students to highlight successful educational practices that foster
student learning and retention (McClenney, 2007). The instrument also asks students to assess
their level of satisfaction with the academic and non-academic college services offered.
Response scales. A summated rating scale—commonly used in the social sciences to
assess people‘s attitudes, opinions and values—was utilized for this perception study. A
summated rating scale (a) contains multiple items to be combined or summed, (b) includes
individual items that measure an attribute that may vary quantitatively rather than qualitatively,
(c) has no correct answer, and (d) uses individual statements that respondents are required to rate
(Spector, 1992). In addition, a well-developed summated rating scale produces greater reliability,
accuracy, and scope than individual yes- or-no questions. Three response scales—agreement,
frequency, and evaluation—were deemed most appropriate to elicit participant responses to scale
items on the survey. Spector (1992) differentiated between an agreement scale, which requires
participants to determine the extent of agreement or disagreement and a frequency scale, which
asks participants to indicate how often they engaged in a particular behavior. Conversely, an
evaluation response scale requires respondents to rate behaviors or practices along a dimension

65
from positive to negative, or vice versa. For the IC and SATC constructs in sections one and five,
an agreement scale with the following scale anchors was used: strongly disagree, disagree,
agree, and strongly agree. However, the IE scale in section two utilized a frequency response
choice including never, rarely, sometimes, and often. Finally, the PRW and PRH scales used the
following evaluation response choices: not ready, somewhat ready, ready, and very ready.
A 4-point Likert-type range was used with each of the five scales and a total score
calculated for each construct. Accordingly, items on the IC and SATC scales were assigned the
following values: 1(strongly disagree), 2 (disagree), 3 (agree), and 4 (strongly agree). The IC
score range was 10 to 40, while the SATC range was 4 to 16. A high score on the IC scale
(maximum score = 40) identified a student who was very involved and expended much effort in
classes and course-related activities. Likewise, a high SATC score (maximum = 16) identified a
student who was highly satisfied with the current college and overall experiences there. The IE
scale had the following values: 1 (never), 2 (rarely), 3 (sometimes), and 4 (often), with scores
ranging from 10 to 40. Again, a high IE score connoted very high levels of involvement in
college extracurricular activities. Values for the PRW and PRH scales were allocated as follows:
1(not ready), 2 (somewhat ready), 3 (ready), and 4 (very ready), with scores ranging from 8 to
32 and from 7 to 28, respectively. Thus, a high score on the PRW scale (maximum = 32)
signified that students perceived they were fully prepared to begin or continue employment
based on experiences at the current community college. Similarly, a high PRH score (maximum
= 28) indicated that students felt very prepared for higher education studies after completing
current studies at the community college.
Predictor variables. In quantitative research, initial variable selection is very important
and may be justified by pertinent literature, researcher experience, or advice from colleagues
66
(Huberty & Petoskey, 1999). Predictor variables were selected for this study based on the
empirical literature, theory, and researcher experience and knowledge of the Jamaican
community college system. Advice from colleagues who teach in the Jamaican community
college sector and feedback from the pilot study were also invaluable to the revision of items.
Ultimately, three sets of predictor variables were examined—personal characteristics, college-
related characteristics, and two involvement variables. Personal characteristic variables were age,
gender, employment status, family responsibilities, mother‘s education and father‘s education.
College-related variables were enrollment status, major, time on campus, and satisfaction with
college. Of the 12 individual predictor variables, seven were categorical and the remainder (age,
time on campus, satisfaction with college, involvement in classes, and involvement in college
extracurricular activities) continuous.
Outcome variables. The outcome construct—perceived readiness for post- college
goals—was a broad categorization for the two outcome variables investigated, i.e., perceived
readiness for higher education studies and perceived readiness for work. The study therefore
focused on the extent to which student involvement in classes and college extracurricular
activities predicted perceptions of readiness for these specific goals after the community college
experience. The initial item pool for the readiness constructs was developed based on the
literature, as well as researcher knowledge of the Jamaican community college education
curriculum. Readiness scale items were then revised to ensure they reflected core skills needed
for success at the workplace or in higher education. This revision was accomplished through
literature review conducted at the University of Georgia, and at the University of the West
Indies, Jamaica, aided by informal telephone conversations with Jamaica university instructors.

67
Survey Validation
Validity is concerned with whether an instrument measures what it sets out to measure.
Therefore, the concept of validity is aptly conveyed by the word accuracy (Huck, 2008). Two
types of validity evidence were important for this researcher-developed instrument—content
validity and construct validity. Content validity is concerned with coverage, or the extent to
which items on an instrument cover a domain of interest. Conversely, construct validity is the
degree to which a test may be considered an appropriate measure of the construct, that is, it
indicates that scores from the instrument may be correctly interpreted as measures of the
construct of interest (Crocker & Algina, 2008). The validity of the four principal measures
(involvement in classes, involvement in extracurricular activities, perceived readiness for higher
education, perceived readiness for work) and the college satisfaction scale rested on two main
factors: (a) source of items and (b) item review. A comprehensive review of literature, the
study‘s theoretical framework, and researcher experience guided the preliminary drafts and final
development of a survey instrument with items measuring the constructs. Item review included
peer reviews, conversations with community college instructors, program coordinators, and work
experience supervisors in Jamaica, informal discussions with lecturers and program coordinators
at one of the local universities to which students typically transfer, and a survey critique session.
Survey critique. I organized a survey critique session with seven persons, including a
survey methodologist. Attendees were doctoral students primarily from the Departments of Adult
and Workforce education at the University of Georgia. One student was also an instructor in the
Georgia technical college system. The group provided valuable feedback on the survey
directions, item choice, and clarity of individual items. Much of the discussions focused on how
to resolve some logical problems related to the IC scale. The following recommendations were
68
offered: (a) define involvement more broadly to account for both quality and quantity of
interaction, (b) review items to ensure their relevance and appropriateness to scale, and (c) use an
agreement scale with the IC construct. Two other important decisions were made based on
feedback from this session: (a) to revise the PRW scale items based on the American College
Testing (ACT) workplace skills (ACT, n.d.), and (b) to make the PRH scale optional for students
who do not have immediate plans to further their education.
Pilot study. A pilot study was used to ascertain whether the instrument had internal
consistency, i.e., reliability. Consistency—the degree to which scores are the same when the test
is repeated—is the essence of reliability (Crocker & Algina, 2008). Therefore, the
appropriateness of the instrument to measure the primary constructs—involvement and
readiness—rested on consistency across subsets of items on the instrument. After receiving
approval from the University of Georgia‘s Institutional Review Board (IRB), the instrument was
piloted in August 2010 with three groups of final-year students (n = 61) enrolled at one of seven
Jamaican community colleges included in the current study. However, participants in the pilot
were not part of the final study. The students were pursuing a CCCJ business major at an
associate or bachelor‘s degree level. The sample shared other demographic characteristics with
participants in the current study, including age, gender, enrollment and work status. The survey
was conducted via direct classroom administration, according to approved IRB procedures and
protocol referred to earlier. Time taken to complete the survey ranged from 5-10 minutes. Very
few problems were noted, although several surveys were returned with items left blank. After
completing the instrument, participants provided feedback on the clarity of instructions and
items, as well as the general appearance and length of the instrument.

69
Reliability analyses of the instrument‘s four scales revealed Cronbach‘s alpha reliabilities
ranging from a low of .71 to a high of .87. Thus, results of the reliability analysis were positive,
as was the overall pilot administration. A complete report of the pilot study is included in
Appendix G. The survey instrument was subsequently revised based on participant feedback and
findings from the pilot data. The most significant change to the original instrument was the
addition of a fifth scale—a 4-item college satisfaction scale that replaced the original one-item
measure. The change was made to address concerns about the validity of using a single scale
item to measure a construct (Crocker & Algina, 2008; Huberty & Petoskey, 1999; Spector,
1992). Items on the new Satisfaction scale were influenced by review of the community college
research literature and involvement theory.
Data Collection Procedures
Several steps were taken to ensure efficiency and effectiveness of the data collection
process. First, permission to conduct the research study was obtained from the CCCJ‘s Executive
Director. Second, the principal or president of each of the eight community colleges was
contacted via a formal request letter similar in content to the letter sent to the Executive Director
of the CCCJ. Each letter outlined the purpose and importance of the study, the survey procedure,
steps to be taken to maintain participant privacy and confidentiality and provided contact details
for the researcher. A copy of the survey instrument was enclosed with each letter. However,
unlike the letter sent to the Executive Director, letters sent to the principals requested
confirmation of suitable dates to visit the college within the prescribed survey period, as well as
class schedules and enrollment data. Third, email and telephone contacts were made with
program coordinators and registrars at each college to introduce the study, encourage
participation, and access class schedules and enrollment statistics. Finally, follow up emails and

70
telephone calls to principals, program coordinators, and registrars confirmed receipt of
correspondence and scheduled dates for college visits. Relevant personnel were also reminded to
submit outstanding data (see Appendices B-E). Consistently maintaining contacts with relevant
personnel at the research sites is reminiscent of the tailored design approach. This approach
utilizes multiple contacts with participants—a technique found to be most effective in increasing
response rates (Dillman et al., 2009). Seven of the eight colleges responded positively and agreed
to have their students surveyed. Surveys were conducted at the seven colleges via direct
classroom administration from November 15 through December 3, 2010. In most cases, the
survey was administered during the first 15 minutes of a class period.
Before administering the survey, I addressed teachers‘ and program coordinators‘
concerns and questions and thanked them for facilitating the research. The teacher then left the
classroom to prevent any breach of student privacy and confidentiality. Subsequently, the survey
was administered to student participants according to guidelines in the Administration Script and
Research Information Sheet for Participants (Appendix D). Administration protocol included (a)
emphasizing that participation was voluntary, (b) explaining steps taken to ensure participant
privacy and confidentiality, (c) allowing participants to respond anonymously, and (d) permitting
participants to place completed or blank surveys in an envelope. Although the survey was
administered to class groups, participants were discouraged from communicating with each other
while completing the questionnaires. To indicate appreciation, candy and simple tokens such as
book markers, key rings, and colored pens were distributed to participants. All 554 surveys
distributed to participants were completed and returned for use in the study, yielding a 100%
response rate.
71
Data Preparation
In preparation for analysis, data collected from the 554 surveys was input into an Excel
spreadsheet and then exported to SPSS for data cleaning and analysis. Data preparation involved
coding and assigning values to nominal, ordinal, and scale variables and recording specific
problems associated with survey items (see Appendix H). Data cleaning was then carried out to
achieve three main purposes: (a) to check for completeness of data, (b) to determine if there were
any implausible values, and (c) to standardize data entries for demographic items that required
written responses. The data cleaning run involved calculating statistics and producing frequency
tables showing minimum and maximum values for each survey item. Responses were generally
valid. In a few cases, participants entered impossible responses to variables such as year of birth
and time on campus. These problems were logically resolved by leaving them as blanks and
assigning them as system missing. There were no unusable surveys, and very few were returned
with responses missing (i.e., Items 47—year of birth, 48—family responsibilities, and 50—
mother and father education). Non-response to these demographic items ranged from 3% - 5%.
The time on campus variable (Item 45) was found to be clouded by residency status as
participants residing on campus indicated spending from 168-200 hours per week on campus.
The decision was therefore taken to exclude this variable from further analysis. On the other
hand, year of birth was standardized as age by subtracting the indicated year of birth from the
current year (2010).
The instrument‘s two involvement and two readiness constructs, and the satisfaction sub-
construct were organized into five scales. Composite scores were obtained by summing item
scores, resulting in a total score for each scale. In order to evaluate internal consistency
reliability, Cronbach alphas were calculated for all five scales and indicated generally
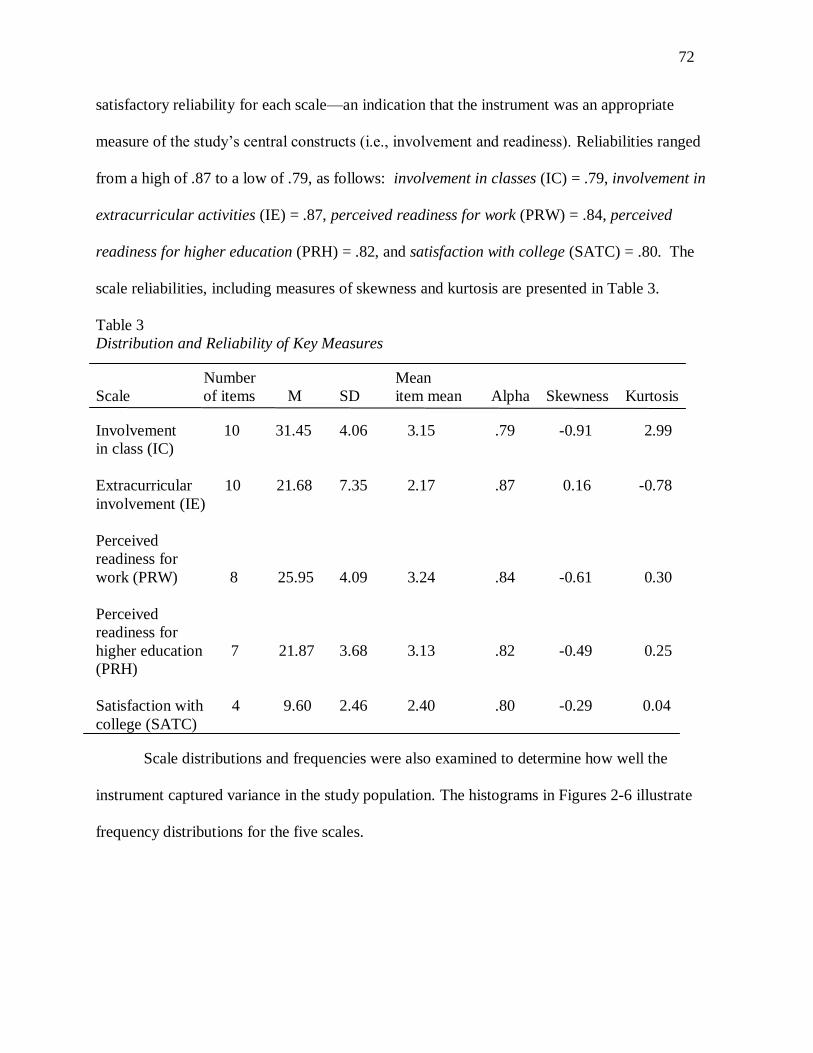
72
satisfactory reliability for each scale—an indication that the instrument was an appropriate
measure of the study‘s central constructs (i.e., involvement and readiness). Reliabilities ranged
from a high of .87 to a low of .79, as follows: involvement in classes (IC) = .79, involvement in
extracurricular activities (IE) = .87, perceived readiness for work (PRW) = .84, perceived
readiness for higher education (PRH) = .82, and satisfaction with college (SATC) = .80. The
scale reliabilities, including measures of skewness and kurtosis are presented in Table 3.
Table 3
Distribution and Reliability of Key Measures
Number Mean
Scale of items M SD item mean Alpha Skewness Kurtosis
Involvement 10 31.45 4.06 3.15 .79 -0.91 2.99
in class (IC)
Extracurricular 10 21.68 7.35 2.17 .87 0.16 -0.78
involvement (IE)
Perceived
readiness for
work (PRW) 8 25.95 4.09 3.24 .84 -0.61 0.30
Perceived
readiness for
higher education 7 21.87 3.68 3.13 .82 -0.49 0.25
(PRH)
Satisfaction with 4 9.60 2.46 2.40 .80 -0.29 0.04
college (SATC)
Scale distributions and frequencies were also examined to determine how well the
instrument captured variance in the study population. The histograms in Figures 2-6 illustrate
frequency distributions for the five scales.

73
Figure 2. Frequency Distribution of Involvement in Classes (IC) Scale.
Figure 3. Frequency Distribution of Involvement in Extracurricular Activities (IE) Scale.

74
Figure 4. Frequency Distribution of Perceived Readiness for Work (PRW) scale.
Figure 5. Frequency Distribution of Perceived Readiness for Higher Education (PRH) Scale.

75
Figure 6. Frequency Distribution of Satisfaction with College (SATC) Scale.
The frequency histograms demonstrate adequate variance within all five scales, as shown
by the standard deviation (SD) for each scale. This confirms that the instrument‘s scales were
appropriate for the constructs examined. Variability in scores was greatest for the IE scale (SD =
7.35) and least for the SATC scale (SD = 2.46), which most closely approximates the shape of
the normal distribution. Conversely, the Involvement in Class (IC) distribution (see Figure 2)
shows peakedness as a large number of scores are at the center of the distribution. Values for
skewness (-0.91) and kurtosis (2.99) from Table 3 indicate more non-normality in the scores for
Class Involvement than in the other distributions. However, extreme values for skewness and
kurtosis are accepted as greater than +3.0 or less than -3.0 (Huck, 2008). Data is generally
considered approximately normal in shape if skewness and kurtosis values range from -1.0 to
+1.0. Therefore, to varying degrees, the perceived readiness for higher education (PRH),
perceived readiness for work (PRW) and involvement in extracurricular (IE) distributions also

76
approach a normal distribution. This means that most of these scale scores are clustered near the
middle of the distribution, and there is a gradual and proportional decrease in frequency in both
directions away from the score center.
Data Analysis
Data analysis was conducted to answer each of the study‘s research questions. Statistical
analyses were performed to yield descriptive statistics for research questions one through four.
Simple and multiple linear regression, and general linear model (GLM) procedures were used to
answer research question five, while multiple regression analyses answered research question 6.
Table 4 outlines the data analysis approach for all six questions.
Table 4
Data Analysis Approach
Research question Survey items Variable (s) Analysis
1. What are the personal 40-50 -Enrollment status Descriptive statistics
and college-related -Major (frequencies and
characteristics of -Goal percentages)
Jamaican community -Employment status
college students, and -Gender
what goals do they -Age
intend to pursue after -Family responsibilities
completing current -Mother education
studies at the -Father education
community college?
2. What forms of class- 1-20 -Involvement in class Descriptive statistics
related and extra- -Involvement in extra- (means, standard
curricular activities curricular activities deviation,
do Jamaican community frequencies,
college students actively percentages)
and reguarly engage in?
3. What work- and 21-35 -Perceived readiness Descriptive statistics
college-related for work (means, standard
tasks do Jamaican -Perceived readiness deviation,
community college for higher education frequencies,
students feel most percentages)
ready to perform?
(continued)

77
Table 4
Data Analysis Approach (continued)
Research question Survey items Variable (s) Analysis
4. What aspects of 36-39 -Satisfaction with college Descriptive
their college (statistics,
experiences are means, standard
Jamaican community deviation,
college students frequencies,
most satisfied with? percentages)
5. To what extent does 1-35 -Involvement in class score Simple/multiple
involvement in -Involvement in extra- regression,
class and extra- curricular activities score GLM
curricular activities -Perceived readiness for work
independently and score
collaboratively predict -Perceived readiness for higher
students‘ perceived education score
readiness for work
and for higher
education, respectively?
6. What are the best 1-41, 43-49 -Involvement in class score Multiple regression
overall predictors -Involvement in extra-
of students‘ curricular activities score
perceived readiness -Satisfaction with college score
for work and for -Enrollment status
higher education, -Major
respectively? -Employment status
-Gender
-Age
-Family responsibilities
-Mother education
-Father education
Descriptive statistics selected to describe the sample for this study and to determine goals
after the community college were means, frequencies, percentages, and standard deviation.
These statistics were used to describe variables of enrollment status, major, employment status,
gender, age, family responsibilities, and parent education for the students surveyed. In addition,
mean and standard deviation statistics were necessary to identify those class, extracurricular,
work- and college-related activities most common among the sample, and to determine what
78
aspects of the college experience students found most satisfying (research questions 2-4). Item
analyses tables are used to present descriptive data findings. The primary advantage of
descriptive statistics is that it allows researchers to use a few measures to describe much
information (Fraenkel & Wallen, 2006). However, descriptive statistical analysis does not permit
generalizations beyond the study group. The arithmetic mean or average is one of three measures
of central tendency that enables non-statisticians ―to describe the characteristics of groups in a
general way‖ (Best & Kahn, 1998, p. 342). The mean is the most popular and perhaps most
useful of all statistical measures as it accommodates all scores in a distribution. However, its
accuracy may be affected by extreme outliers, resulting in incorrect description of data (Fraenkel
& Wallen, 2006). By contrast, the standard deviation (SD) is a primary measure of variability
and is considered a powerful, stable, and most useful statistic (Best & Kahn, 1998; Fraenkel &
Wallen, 2006; Gall et al., 2007). The stability of the SD as an index of variability is due to the
fact that it accounts for all scores in a distribution and is not influenced by extreme values (Huck,
2008). Frequency distributions summarize categorical data by indicating the total number in a
category or group. Generally, frequency distributions are informative, but ―often the information
they contain is hard to visualize‖ (Fraenkel & Wallen, 2006, p. 191). Although frequency tables,
graphs, and charts are very useful for summarizing large amounts of information, percentages
may be more readily understood by individuals with little knowledge of statistics. Moreover, the
data provided in frequency distributions can be easily summarized through percentages.
Regression analyses were employed to answer research questions five and six.
Regression analyses may be conducted for predictive or explanatory purposes, both of which are
important to research (Huck, 2008; Pedhazur, 1997). According to Pedhazur (1997),
understanding how both purposes differ is necessary to appropriately use regression analysis and
79
accurately interpret findings. Predictive research focuses on ―practical applications, whereas in
explanatory research the main emphasis is on understanding phenomena‖ (Pedhazur, 1997, p.
196). Problems often arise from misuse and invalid interpretation of explanatory regression
analysis, but if validly used predictive regression analysis does not pose these problems. The
choice of predictors may be empirically determined or guided by theory (Huberty & Petoskey,
1999; Pedhazur, 1997). Predictive regression analysis was chosen for this survey research study.
A series of simple regression analyses, as well as multiple regression and GLM
procedures were performed to answer research question five, while multiple regression analyses
were conducted to answer question six. In regression analysis, Y represents the outcome or
criterion variable and X the predictor (Huberty & Petoskey, 1999; Huck, 2008). Predictive
regression analysis therefore studies the predictability of Y based on the X variables (Huberty &
Petoskey, 1999). Simple regression analysis is utilized when there is one X and one Y variable, to
determine the degree to which variability in Y may be accounted for or predicted by X. A simple
linear regression of Y on X is obtained when ―Y means for the different levels of X differ from
each other and lie on a straight line‖ (Pedhazur, 1997, p. 17). Multiple regression analysis
involves one Y and several X variables. Additionally, multiple regression utilizes three popular
variable selection procedures—stepwise selection, forward selection, and backward
elimination—to reflect the order in which data on the predictors is entered into the analysis.
According to Pedhazur (1997), there is no unanimity concerning which variable selection
method is most effective, as each method has advantages and disadvantages. However, there
seems to be some consensus that the stepwise (Huberty, 2003; Huberty & Petoskey, 1999) and
forward selection methods are flawed. Therefore, in order to answer research question six, the
backward elimination technique was utilized. Ultimately, selection of the best set of predictors
80
was made based on a pre-determined criterion of a .05 significance level. The central elements of
a regression analysis include (a) R2 (or r
2), which indicates the proportion of variability in the
criterion variable accounted for by the predictor variables; (b) adjusted R2, which removes bias
associated with R2
(Huck, 2008; Pedhazur, 1997); (c) test of the regression coefficients or slopes
(b,); and (d) tests for interaction effects or homogeneity of the regression slopes. The F-test
investigates whether the relationship can be generalized to the population represented by the
sample. Finally, four assumptions of multiple regression—normality, linearity, reliability of
variable measurement and homoscedasticity—should be tested (Pedhazur, 1997). Normality
refers to the normal distribution of variables, linearity is the assumption of a straight line
relationship between the independent and dependent variables, and homoscedasticity assumes
equal variance in scores for independent variables at all values of the dependent variable.
Limitations
Three limitations are relevant to this study. First, although specific criteria guided sample
selection and a 100% response rate was achieved, data for the study were collected via
convenience sampling. Consequently, findings from the research are not necessarily
generalizable to the population of interest. Second, only final-year students, i.e., those who had
achieved academic success, were surveyed. Less successful students might feel differently about
their readiness for higher education and work goals. Third, my administrative and teaching
experiences at one of the colleges included in this study may have indirectly influenced
participant response. These experiences influenced the focus of this dissertation research.
However, I had never met or interacted with any of the survey respondents before conducting the
research. Moreover, every effort was made to ensure the data collection process was objective,
and that respondent privacy and confidentiality were maintained.

81
CHAPTER 4
FINDINGS
This chapter describes findings obtained from the survey instrument completed by
respondents. Findings are organized and presented in relation to each of the six research
questions that guided the study. The purpose of this study was to examine the perceptions of
Jamaican community college students about their readiness for postcollege goals, and to
determine the degree to which class and college extracurricular involvement predicted perceived
readiness for these goals.
Research Questions
1. What are the personal and college-related characteristics of Jamaican community college
students, and what goals do they intend to pursue after completing current studies at the
community college?
2. What forms of class-related and college extracurricular activities do Jamaican community
college students actively and regularly engage in?
3. What work- and college-related tasks do Jamaican community college students feel most
ready to perform?
4. What aspects of their college experiences are these Jamaican community college students
most satisfied with?
5. To what extent does involvement in class and college extracurricular activities
independently and collaboratively explain Jamaican community college students‘
perceived readiness for work and for higher education, respectively?
82
6. What are the best overall predictors of perceived readiness of these Jamaican community
college students for work and for higher education, respectively?
Findings for Research Questions
Research Question 1
What are the personal and college-related characteristics of Jamaican community college
students, and what goals do they intend to pursue after completing current studies at the
community college?
Personal characteristics. The ratio of females to males in the study sample was 1.65 to 1.
Respondents‘ ages ranged from 18 to 46, while the mean age was 21.82 (n = 539, SD = 4.55).
Furthermore, almost 60% of the sample reported being unemployed for most of their college
career, and nearly 40% had no family responsibilities. Of those who were employed, over 90%
reported having off-campus jobs. Item 49—Impact of family responsibilities on college activities
(n = 402)—was optional for several respondents, based on responses to Item 48. Consequently,
non-response to this item (27.4%) was expected and ignorable. In terms of parent education,
8.4% of respondents indicated having no knowledge of their mother‘s or maternal guardian‘s
level of education, while 27.2% reported having no knowledge of their father‘s or paternal
guardian‘s educational level. A secondary or high school education was the highest educational
level attained by approximately 50% of mothers or maternal guardians (n = 534) and 40% of
fathers or paternal guardians (n = 525). In addition, nearly 13% of mothers or maternal guardians
reportedly held a bachelor‘s degree, and just over 5% had a master‘s degree or higher. On the
other hand, 7.4% of fathers or paternal guardians held a bachelor‘s degree, and 4.2% attained a
master‘s degree or higher.

83
Non-response (i.e., to Item 50—mother education and father education) accounted for 3.6% and
5.2% of the sample, respectively. Table 5 presents details of survey respondents‘ personal
characteristics.
Table 5
Personal Characteristics of Participants
Variable n %
Gender
Female 345 62.3
Male 209 37.7
Age
18-21 344 63.8
22-25 108 20.0
26-30 62 11.5
31-35 13 2.4
36-40 8 1.6
41 and above 4 0.7
Employment status
Full-time job 123 22.2
Part-time job 106 19.1
Employed on campus 18 7.8
Employed off campus 213 92.2
Did not work 325 58.7
Impact of family responsibilities on classes
No family responsibilities 218 39.4
Does not affect classes 178 32.2
Little interference 130 23.5
Much interference 27 4.9
Impact of family responsibilities on college activities
No extracurricular involvement 149 37.1
No interference 136 33.8
Little interference 93 23.1
Much interference 24 6.0
(continued)

84
Table 5
Personal Characteristics of Participants (continued)
Variable n %
Mother/Guardian‘s highest educational level
Primary school 26 4.9
Some secondary/high school 166 31.1
Secondary/high school diploma 116 21.7
Some college 61 11.4
Associate‘s degree 23 4.3
Bachelor‘s degree 68 12.7
Master‘s degree or higher 29 5.4
Father/Guardian‘s highest educational level
Primary school 34 6.5
Some secondary/high school 117 22.3
Secondary/high school diploma 101 19.2
Some college 47 9.0
Associate‘s degree 22 4.2
Bachelor‘s degree 39 7.4
Master‘s degree or higher 22 4.2
Note. N = 554.
College-related characteristics and postcollege goals. Approximately 80% of the study
sample was enrolled full-time in one of four majors at seven community colleges in Jamaica.
Over 70% indicated plans to immediately pursue higher education goals after completing studies
at the community college—either as full-time students or by combining work and study.
Table 6 reveals the college-related characteristics and postcollege goals of study respondents.

85
Table 6
College-Related Characteristics and Post-College Goals of Participants (N=554)
Variable n %
Enrollment status
Full-time 442 79.8
Part-time 112 20.2
Major
Business 228 41.2
Hospitality & tourism 148 26.7
Computer 134 24.2
Architecture & construction 44 7.9
Postcollege goals
Work 151 27.2
Higher education 241 43.5
Work and study 150 27.1
Other 12 2.2
Research Question 2
What forms of class-related and college extracurricular activities do Jamaican community
college students actively and regularly engage in?
Students were asked to evaluate the degree of involvement and effort, and how frequently
they participated in various class-related and extracurricular college activities. These activities
were organized into two of the five scales included on the survey instrument—Involvement in
Classes and Course-Related Activities (IC) and Involvement in Extracurricular Activities (IE).
For each item on all five scales, students responded to a 4-point Likert-type scale. Responses on
the IC scale ranged from 1(strongly disagree) to 4 (strongly agree), while those on the IE scale
ranged from 1(never) to 4 (often). Each of the two scales contained 10 items, and the sum of
responses created an IC and an IE score for each respondent, respectively.
Class-related activities. Total IC scores of 10 or below (i.e., the minimum possible score
= strongly disagree) signified that a respondent was not actively involved in or put no effort into

86
class-related activities. Total scores between 11 and 20 signified that respondents put very little
effort into class-related activities. Respondents scoring between 21 and 30 reported some class
involvement and effort expended in course activities. Scores of between 31 and 40 (i.e., the
maximum score range = strongly agree) indicated that respondents expended much effort and
were very involved in classes and course-related activities. Analysis of item responses revealed
that individual IC scale item mean scores ranged from 2.43 to 3.63. Mean scores were lowest on
item 10—I discussed my academic progress with an instructor or course advisor (M = 2.43, SD
= 0.83), and highest on item 2—I actively participated in group-assigned course work (M = 3.63,
SD = 0.56). Respondents also had low mean scores for item 9—I discussed class content with
instructors outside of class (M = 2.67, SD = 0.71), and item 8—I frequently discussed class
topics with peers outside of the classroom (M = 2.95, SD = 0.76). Details of item responses to the
IC scale—with items arranged in descending order based on mean scores—are given in Table 7.
Table 7
Involvement in Classes scale—Item Response Analyses
Frequency (%)
Strongly Strongly
Item No. Stem M SD disagree Disagree Agree agree
2. I actively participated 3.63 0.56 5 6 179 364
in group-assigned (0.9) (1.1) (32.3) (65.7)
course work
4. I put a lot of effort into 3.39 0.62 5 27 271 251
doing research for class (0.9) (4.9) (48.9) (45.3)
assignments
5. I put a lot of effort into 3.33 0.71 9 50 246 249
studying for a test or (1.6) (9.0) (44.4) (44.9)
final exam
(continued)
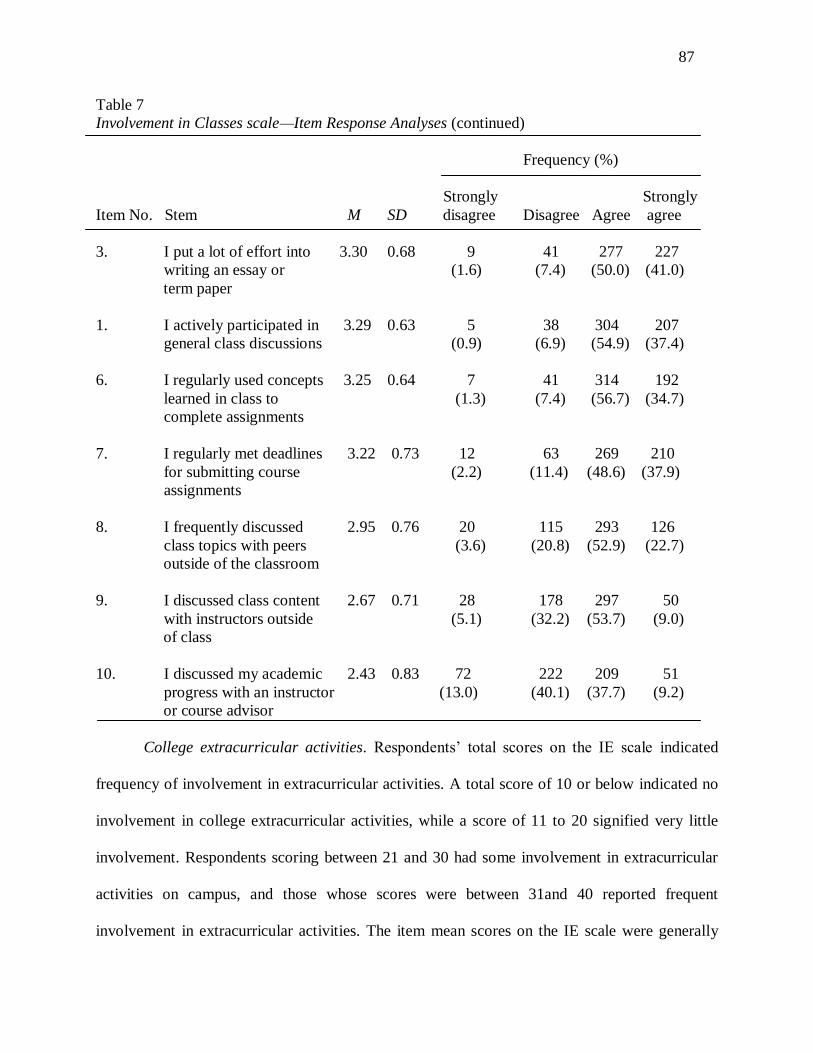
87
Table 7
Involvement in Classes scale—Item Response Analyses (continued)
Frequency (%)
Strongly Strongly
Item No. Stem M SD disagree Disagree Agree agree
3. I put a lot of effort into 3.30 0.68 9 41 277 227
writing an essay or (1.6) (7.4) (50.0) (41.0)
term paper
1. I actively participated in 3.29 0.63 5 38 304 207
general class discussions (0.9) (6.9) (54.9) (37.4)
6. I regularly used concepts 3.25 0.64 7 41 314 192
learned in class to (1.3) (7.4) (56.7) (34.7)
complete assignments
7. I regularly met deadlines 3.22 0.73 12 63 269 210
for submitting course (2.2) (11.4) (48.6) (37.9)
assignments
8. I frequently discussed 2.95 0.76 20 115 293 126
class topics with peers (3.6) (20.8) (52.9) (22.7)
outside of the classroom
9. I discussed class content 2.67 0.71 28 178 297 50
with instructors outside (5.1) (32.2) (53.7) (9.0)
of class
10. I discussed my academic 2.43 0.83 72 222 209 51
progress with an instructor (13.0) (40.1) (37.7) (9.2)
or course advisor
College extracurricular activities. Respondents‘ total scores on the IE scale indicated
frequency of involvement in extracurricular activities. A total score of 10 or below indicated no
involvement in college extracurricular activities, while a score of 11 to 20 signified very little
involvement. Respondents scoring between 21 and 30 had some involvement in extracurricular
activities on campus, and those whose scores were between 31and 40 reported frequent
involvement in extracurricular activities. The item mean scores on the IE scale were generally
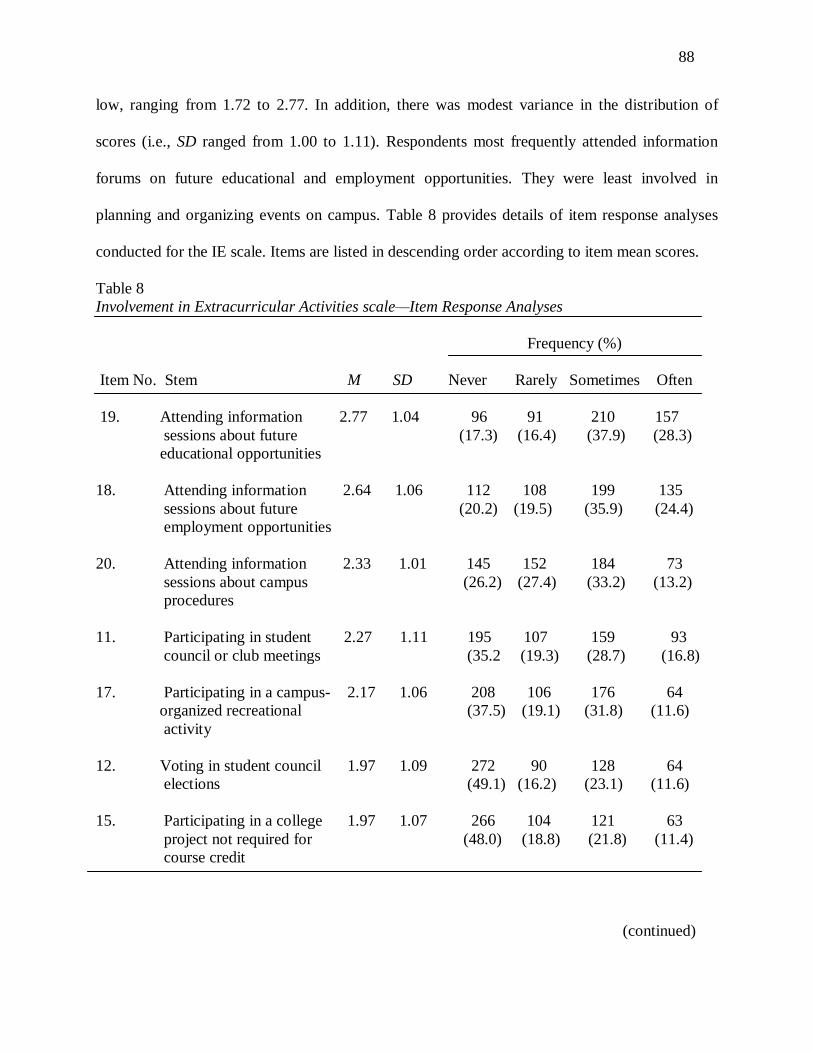
88
low, ranging from 1.72 to 2.77. In addition, there was modest variance in the distribution of
scores (i.e., SD ranged from 1.00 to 1.11). Respondents most frequently attended information
forums on future educational and employment opportunities. They were least involved in
planning and organizing events on campus. Table 8 provides details of item response analyses
conducted for the IE scale. Items are listed in descending order according to item mean scores.
Table 8
Involvement in Extracurricular Activities scale—Item Response Analyses
Frequency (%)
Item No. Stem M SD Never Rarely Sometimes Often
19. Attending information 2.77 1.04 96 91 210 157
sessions about future (17.3) (16.4) (37.9) (28.3)
educational opportunities
18. Attending information 2.64 1.06 112 108 199 135
sessions about future (20.2) (19.5) (35.9) (24.4)
employment opportunities
20. Attending information 2.33 1.01 145 152 184 73
sessions about campus (26.2) (27.4) (33.2) (13.2)
procedures
11. Participating in student 2.27 1.11 195 107 159 93
council or club meetings (35.2 (19.3) (28.7) (16.8)
17. Participating in a campus- 2.17 1.06 208 106 176 64
organized recreational (37.5) (19.1) (31.8) (11.6)
activity
12. Voting in student council 1.97 1.09 272 90 128 64
elections (49.1) (16.2) (23.1) (11.6)
15. Participating in a college 1.97 1.07 266 104 121 63
project not required for (48.0) (18.8) (21.8) (11.4)
course credit
(continued)
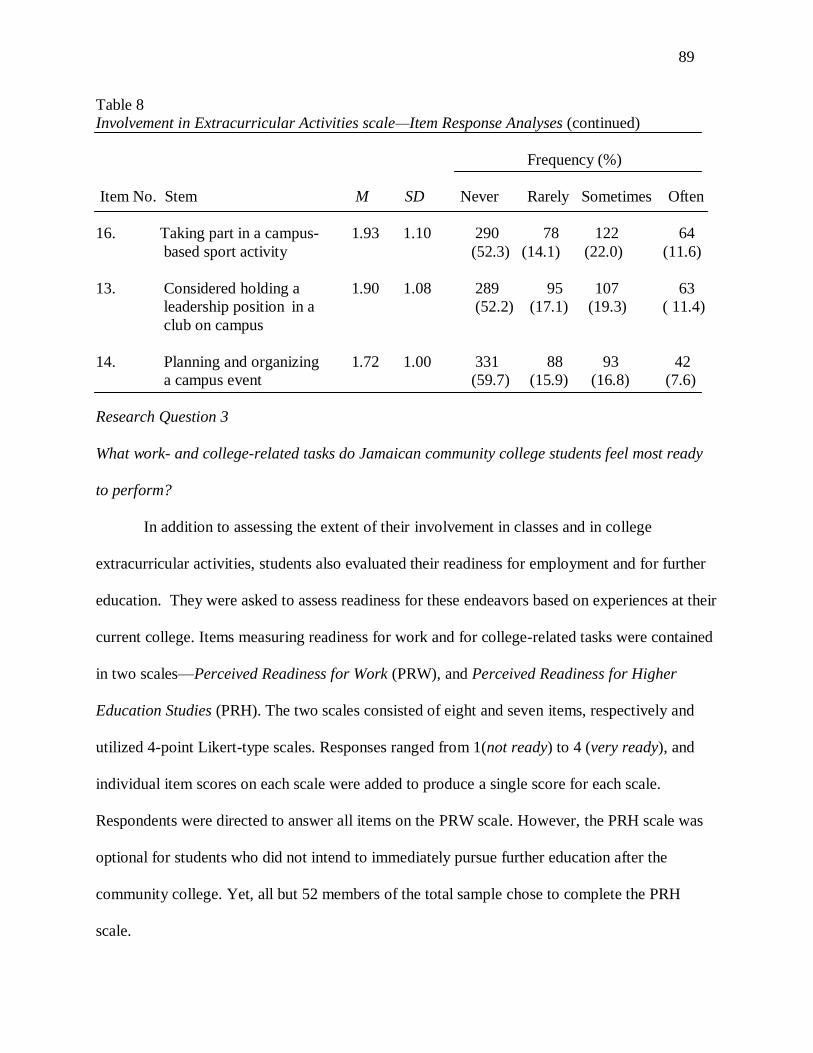
89
Table 8
Involvement in Extracurricular Activities scale—Item Response Analyses (continued)
Frequency (%)
Item No. Stem M SD Never Rarely Sometimes Often
16. Taking part in a campus- 1.93 1.10 290 78 122 64
based sport activity (52.3) (14.1) (22.0) (11.6)
13. Considered holding a 1.90 1.08 289 95 107 63
leadership position in a (52.2) (17.1) (19.3) ( 11.4)
club on campus
14. Planning and organizing 1.72 1.00 331 88 93 42
a campus event (59.7) (15.9) (16.8) (7.6)
Research Question 3
What work- and college-related tasks do Jamaican community college students feel most ready
to perform?
In addition to assessing the extent of their involvement in classes and in college
extracurricular activities, students also evaluated their readiness for employment and for further
education. They were asked to assess readiness for these endeavors based on experiences at their
current college. Items measuring readiness for work and for college-related tasks were contained
in two scales—Perceived Readiness for Work (PRW), and Perceived Readiness for Higher
Education Studies (PRH). The two scales consisted of eight and seven items, respectively and
utilized 4-point Likert-type scales. Responses ranged from 1(not ready) to 4 (very ready), and
individual item scores on each scale were added to produce a single score for each scale.
Respondents were directed to answer all items on the PRW scale. However, the PRH scale was
optional for students who did not intend to immediately pursue further education after the
community college. Yet, all but 52 members of the total sample chose to complete the PRH
scale.

90
Work-related tasks. Total scores on the PRW scale ranged from 8 to 32. Respondents
scoring 8 or below believed they were not ready to perform specified work-related tasks. Scores
between 9 and 16 showed that respondents perceived limited readiness for work tasks.
Conversely, those scoring between 17 and 24 perceived themselves ready to complete work-
based tasks, while those who scored from 25 to 32 indicated they were very ready to undertake
these tasks. Means of items on this scale extended from 3.01 to 3.52, revealing a rather restricted
range of scores. Individual item analyses revealed that respondents believed they were most
ready to utilize the computer and internet for work-related tasks and communication (M = 3.52,
SD = 0.67). They also felt ready to adhere to standards of work and conduct (M = 3.49, SD =
0.65). On the other hand, they indicated least readiness for preparing work documents (M = 3.01,
SD = 0.79), and for team projects (M = 3.02, SD = 0.85). Details of item response analyses for
the PRW scale are contained in Table 9. Items are listed in descending order, according to mean
scores.
Table 9
Perceived Readiness for Work scale—Item Response Analyses
Frequency (%)
Not Somewhat Very
Item No. Stem M SD ready ready Ready ready
23. Using the computer 3.52 0.67 8 31 182 333
and Internet for (1.4) (5.6) (32.9) (60.1)
work-based tasks
and communication
28. Maintaining work 3.49 0.65 6 28 211 309
standards and (1.1) (5.1) (38.1) (55.8)
rules of conduct
(continued)

91
Table 9
Perceived Readiness for Work scale—Item Response Analyses (continued)
Frequency (%)
Not Somewhat Very
Item No. Stem M SD ready ready Ready ready
24. Receiving and 3.31 0.71 11 47 257 239
effectively (2.0) (8.5) (46.4) (43.1)
communicating
verbal messages
26. Observing and 3.29 0.73 11 59 241 243
correctly (2.0) (10.6) (43.5) (43.9)
following on-the-job
procedures and
demonstrations
27. Meeting deadlines 3.21 0.75 9 81 250 214
(1.6) (14.6) (45.1) (38.6)
25. Applying critical 3.11 0.77 12 99 258 185
thinking and problem- (2.2) (17.9) (46.6) (33.4)
solving methods to
work-related tasks
21. Completing a team 3.02 0.85 30 106 243 175
project in the (5.4) (19.1) (43.9) (31.6)
workplace
22. Preparing work- 3.01 0.79 19 113 263 159
related documents (3.4) (20.4) (47.5) (28.7)
College-related tasks. The seven college-related tasks on the PRH scale produced total
scores from 7 to 28. Respondents with a total score of 7 or below perceived no readiness to
perform identified tasks. Respondents scoring between 8 and 14 felt somewhat ready to complete
the tasks, while those scoring between 15 and 21 believed they were ready to do so. Total scores
from 22 to 28 indicated that respondents perceived they were very ready to perform the specified

92
college-related tasks. Item mean scores ranged from a low of 2.84 to a high of 3.36.
Respondents indicated they were most ready to work with others on group assignments
(M = 3.36, SD = 0.71) and least ready to write effective essays (M = 2.84, SD = 0.78). Items and
details of participant responses for the PRH scale appear in Table 10.
Table 10
Perceived Readiness for Higher Education Studies scale—Item Response Analyses
Frequency (%)
Not Somewhat Very
Item No. Stem M SD ready ready Ready ready
35. Working as part 3.36 0.71 10 40 210 242
of a team to complete (2.0) (8.0) (41.8) (48.2)
group assignments
29. Using different sources 3.27 0.74 11 55 222 214
to locate information (2.2) (11.0) (44.2) (42.6)
for class assignments
33. Submitting assignments 3.23 0.72 7 65 237 193
on time (1.4) (12.9) (47.2) (38.4)
34. Studying for a class test 3.16 0.75 7 86 230 179
or final exam (1.4) (17.1) (45.8) (35.7)
30. Reading and making 3.11 0.71 9 74 272 147
sense of new course (1.8) (14.7) (54.2) (29.3)
materials at college
32. Making strong oral 2.91 0.86 31 116 223 132
arguments and (6.2) (23.1) (44.4) (26.3)
presentations
31. Writing effective essays 2.84 0.78 19 145 238 100
(3.8) (28.9) (47.4) (19.9)
93
Research Question 4
What aspects of their college experiences are these Jamaican community college students most
satisfied with?
The fifth scale of the survey instrument measured student satisfaction with the overall
college experience. The Satisfaction with College (SATC) scale comprised four items using a
4-point, Likert-type response scale. Responses ranged from 1(Strongly disagree) to 4 (Strongly
agree). A SATC score was achieved for each respondent by summing responses to the four scale
items. Total scores of 4 or below indicated respondents were completely dissatisfied with the
overall college experience. Scores between 5 and 8 signified that respondents felt mostly
dissatisfied with their college experiences. However, respondents who scored between 9 and 12
were satisfied with the overall college experience, while those who received scores from 13 to 16
were very satisfied with the specified aspects of their college experience. Findings showed a
somewhat limited range of generally low mean scores, as respondents tended to avoid both
extreme response options (i.e., strongly disagree and strongly agree). Instead, most respondents
indicated either disagreement or agreement with the items on this scale. Respondents were most
satisfied with the overall college experience (M = 2.66, SD = 0.75) and least satisfied with
college facilities (M = 2.26, SD = 0.75). Table 11 summarizes data related to items on the SATC
scale.
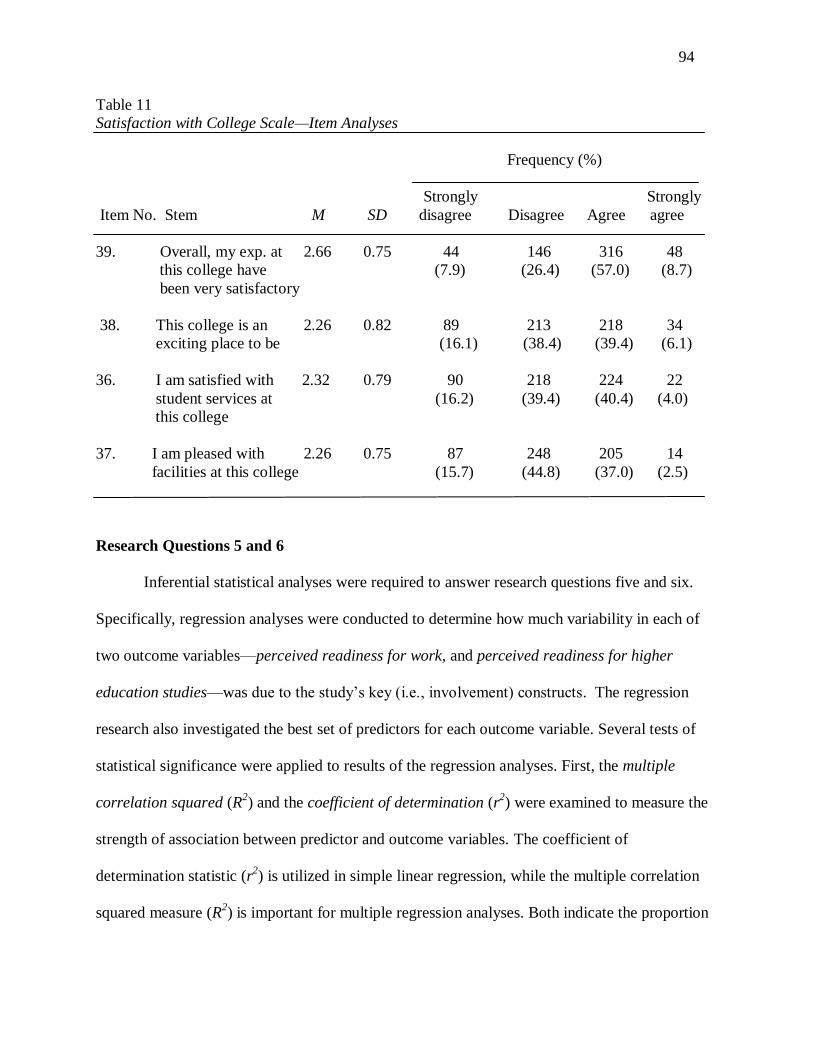
94
Table 11
Satisfaction with College Scale—Item Analyses
Frequency (%)
Strongly Strongly
Item No. Stem M SD disagree Disagree Agree agree
39. Overall, my exp. at 2.66 0.75 44 146 316 48
this college have (7.9) (26.4) (57.0) (8.7)
been very satisfactory
38. This college is an 2.26 0.82 89 213 218 34
exciting place to be (16.1) (38.4) (39.4) (6.1)
36. I am satisfied with 2.32 0.79 90 218 224 22
student services at (16.2) (39.4) (40.4) (4.0)
this college
37. I am pleased with 2.26 0.75 87 248 205 14
facilities at this college (15.7) (44.8) (37.0) (2.5)
Research Questions 5 and 6
Inferential statistical analyses were required to answer research questions five and six.
Specifically, regression analyses were conducted to determine how much variability in each of
two outcome variables—perceived readiness for work, and perceived readiness for higher
education studies—was due to the study‘s key (i.e., involvement) constructs. The regression
research also investigated the best set of predictors for each outcome variable. Several tests of
statistical significance were applied to results of the regression analyses. First, the multiple
correlation squared (R2) and the coefficient of determination (r
2) were examined to measure the
strength of association between predictor and outcome variables. The coefficient of
determination statistic (r2) is utilized in simple linear regression, while the multiple correlation
squared measure (R2) is important for multiple regression analyses. Both indicate the proportion

95
of variance in the outcome variable predicted or accounted for by each independent variable or
set of variables, respectively. Further, the test of R2 proceeds as for r
2, and reveals
whether the
regression of the dependent variable (Y) on the independent variable (X) is statistically
significant (Pedhazur, 1997). In other words, the test of R2 is equivalent to testing whether at
least one regression coefficient differs from zero. Yet, R2 may overestimate variance in the
dependent variable. Therefore, the adjusted R2 statistic is accepted as a more realistic predictor of
variability in the outcome variable associated with the independent variables.
Second, findings from tests of regression coefficients are also presented. The regression
coefficient or slope for each predictor variable indicates the size of the variable‘s effect on the
dependent or outcome variable. In addition, the positive or negative sign on the coefficient
indicates the direction of the effect—whether the dependent variable is expected to increase or
decrease. For example, in simple linear regression, the coefficient reveals how much increase or
decrease is expected in the outcome variable when the predictor variable increases by one point.
In regression with multiple predictors, the coefficient indicates how much the outcome variable
will increase when a particular predictor increases by one unit, holding all other predictors
constant. Generally, distinction is made between the unstandardized regression coefficient or test
statistic (b, B) and beta, the standardized parameter estimate (β). The former refers to raw scores,
while the latter refers to standard scores. Other statistics reported in these findings are measures
of statistical significance, including p-values, the omnibus F distribution, t-test statistics, and
standard error. The p-value (or significance level) measures how much evidence exists to reject
the null hypothesis—that the predictors have no effect on or account for no change in the
outcome variable. Generally, a small p-value is evidence to reject the null hypothesis (Ho) and
the smaller the p-value, the more evidence there is against Ho. A large p-value means little or no
96
evidence exists to reject Ho. As a rule, a significance level of .05 is the accepted point at which to
reject the null hypothesis. This means there is only a 5% chance that results obtained would
appear in a random distribution. The omnibus F distribution for regression slopes is reported
with degrees of freedom (df) for the numerator and denominator. The omnibus F-test measures
whether means of regression slopes, main effects, and interaction effects are statistically
significant. When the omnibus F-test is significant, this means the variable of interest is
effective, or the difference between groups is highly likely. Best and Kahn (1998) surmised that
an F ratio considerably greater than 1 is likely to be too large to ascribe to sampling error.
Degrees of freedom in a distribution refer to the number of independent values or observations in
the final calculation. The t-statistic is the coefficient divided by its standard error. It indicates
whether a nonzero relationship for the coefficient exists in the population, based on sample data
(Fraenkel & Wallen, 2006). The standard error is also a very useful statistic. It estimates the
magnitude of variation in the coefficient, as well as the accuracy with which it is measured. If the
coefficient is substantially larger than the standard error, then the t-test is regarded as statistically
significant (Kerlinger, 1979).
Finally, findings of interaction effects are also reported. Interaction signifies that the
regression of the dependent or Y variable on an independent (X) variable is conditioned by
another (Z) variable (Aiken & West, 1991). Therefore, interaction focuses on the joint effects of
two or more variables. For example, in a two-way interaction where A*B is the product of A and
B, which is a test of their interaction, the regression coefficient for A shows the effect of A when
B is zero, and the coefficient for B shows the effect of B when A is zero. If an interaction effect
is present, tests are conducted to determine exactly where the significant differences lie. Simple
main effects are analyzed if no statistically significant interaction effects are found.

97
Research Question 5
To what extent does involvement in class and college extracurricular activities independently
and collaboratively explain Jamaican community college students’ perceived readiness for work
and for higher education, respectively?
A series of simple linear regression analyses were used to test if each of two continuous
variables—involvement in class (IC) and involvement in college activities (IE)—significantly
predicted perceived readiness for work and for higher education, respectively. Results indicated
involvement in classes accounted for 13% of variation in respondents‘ perceived readiness for
work (r2 = .13, adjusted r
2 = .129, F(1, 551) = 82.69, p < .001), while involvement in
extracurricular activities accounted for 6% (r2 = .06, adjusted r
2 = .059, F(1, 552) = 35.73, p <
.001). On the other hand, class involvement explained 19% of variability in respondents‘
perceived readiness for higher education studies (r2 = .19, adjusted r
2 = .188, F(1, 499) = 116.43,
p < .001), and extracurricular involvement predicted 9% (r2 = .09, adjusted r
2 = .09, F(1, 500) =
50.90, p < .001). In all cases, adjusted r2 values were similar to values reported for r
2. Findings
for the involvement regression coefficients were also statistically significant (p < .001) and each
regression slope had a positive effect on the dependent variable. For example, for every one
point increase in class involvement, perceived readiness for work was expected to increase by
.37 points. Again, for every one point increase in extracurricular involvement, perceived
readiness for work was predicted to increase by .14 points. Tables 12 and 13 summarize findings
for regression coefficient and parameter estimates related to perceived readiness for work and for
higher education, respectively. The constant is the intercept estimate—the value of the dependent
variable (Y) when the independent variable (X) is zero.

98
Table 12
Involvement Coefficients and Parameter Estimates (1)
Unstandardized Standardized
coefficient Std. coefficient
Model Variable b error t p
1 Constant 14.480 1.272 11.39 .000
Involvement 0.37 0.040 0.36 9.09 .000
in class
Model statistics r2 = .13, adjusted r
2 = .129, F(1, 551) = 82.69, p = .000
2 Constant 22.975 0.526 43.70 .000
Involvement 0.14 0.023 0.25 5.98 .000
in extracurricular
Model statistics r2 = .06, adjusted r
2 = .059, F(1, 552) = 35.73, p =.000
Note. N = 554. Dependent variable: Perceived readiness for work (PRW).
Table 13
Involvement Coefficients and Parameter Estimates (2)
Unstandardized Standardized
coefficient Std. coefficient
Model Variable b error β t p
1 Constant 9.571 1.150 8.33 .000
Involvement 0.39 0.036 0.44 10.79 .000
in class
Model statistics r2 = .19, adjusted r
2 = .188, F(1, 499) = 116.43, p = .000
2 Constant 18.583 0.487 38.16 .000
Involvement 0.15 0.021 0.30 7.13 .000
in extracurricular
Model statistics r2 = .09, adjusted r
2 = .091, F(1, 500) = 50.90, p = .000
Note. N = 502. Dependent variable: Perceived readiness for higher education (PRH).
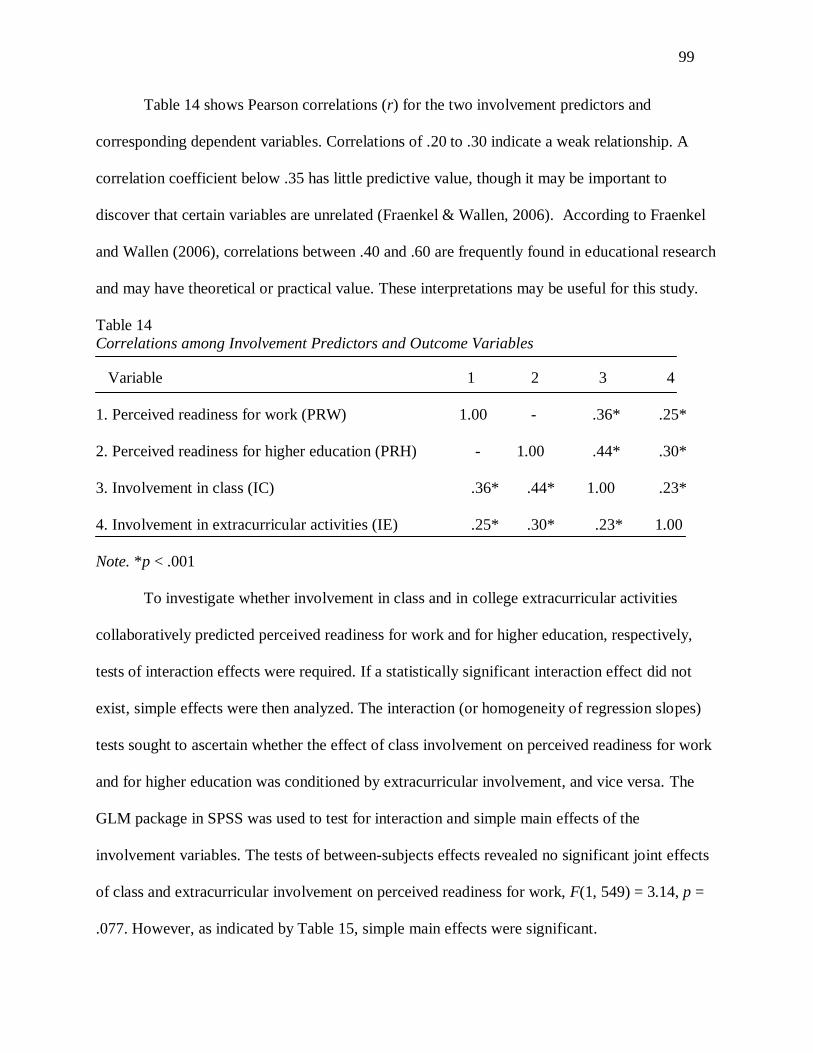
99
Table 14 shows Pearson correlations (r) for the two involvement predictors and
corresponding dependent variables. Correlations of .20 to .30 indicate a weak relationship. A
correlation coefficient below .35 has little predictive value, though it may be important to
discover that certain variables are unrelated (Fraenkel & Wallen, 2006). According to Fraenkel
and Wallen (2006), correlations between .40 and .60 are frequently found in educational research
and may have theoretical or practical value. These interpretations may be useful for this study.
Table 14
Correlations among Involvement Predictors and Outcome Variables
Variable 1 2 3 4
1. Perceived readiness for work (PRW) 1.00 - .36* .25*
2. Perceived readiness for higher education (PRH) - 1.00 .44* .30*
3. Involvement in class (IC) .36* .44* 1.00 .23*
4. Involvement in extracurricular activities (IE) .25* .30* .23* 1.00
Note. *p < .001
To investigate whether involvement in class and in college extracurricular activities
collaboratively predicted perceived readiness for work and for higher education, respectively,
tests of interaction effects were required. If a statistically significant interaction effect did not
exist, simple effects were then analyzed. The interaction (or homogeneity of regression slopes)
tests sought to ascertain whether the effect of class involvement on perceived readiness for work
and for higher education was conditioned by extracurricular involvement, and vice versa. The
GLM package in SPSS was used to test for interaction and simple main effects of the
involvement variables. The tests of between-subjects effects revealed no significant joint effects
of class and extracurricular involvement on perceived readiness for work, F(1, 549) = 3.14, p =
.077. However, as indicated by Table 15, simple main effects were significant.
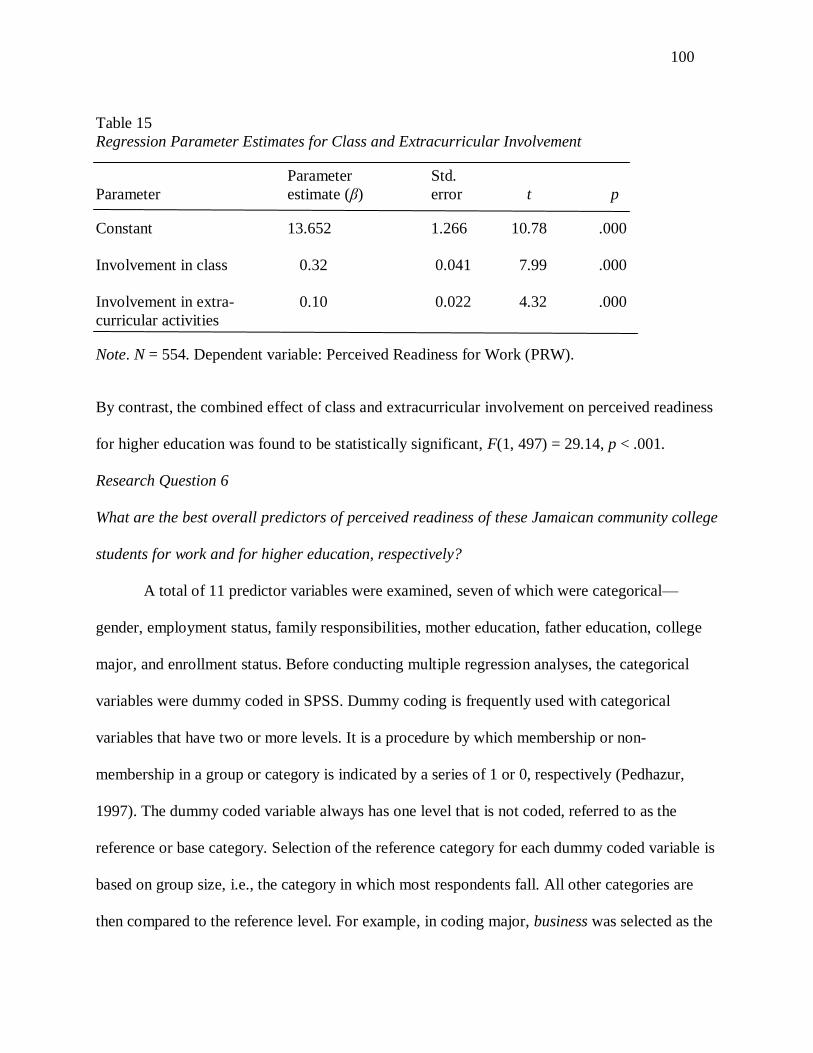
100
Table 15
Regression Parameter Estimates for Class and Extracurricular Involvement
Parameter Std.
Parameter estimate (β) error t p
Constant 13.652 1.266 10.78 .000
Involvement in class 0.32 0.041 7.99 .000
Involvement in extra- 0.10 0.022 4.32 .000
curricular activities
Note. N = 554. Dependent variable: Perceived Readiness for Work (PRW).
By contrast, the combined effect of class and extracurricular involvement on perceived readiness
for higher education was found to be statistically significant, F(1, 497) = 29.14, p < .001.
Research Question 6
What are the best overall predictors of perceived readiness of these Jamaican community college
students for work and for higher education, respectively?
A total of 11 predictor variables were examined, seven of which were categorical—
gender, employment status, family responsibilities, mother education, father education, college
major, and enrollment status. Before conducting multiple regression analyses, the categorical
variables were dummy coded in SPSS. Dummy coding is frequently used with categorical
variables that have two or more levels. It is a procedure by which membership or non-
membership in a group or category is indicated by a series of 1 or 0, respectively (Pedhazur,
1997). The dummy coded variable always has one level that is not coded, referred to as the
reference or base category. Selection of the reference category for each dummy coded variable is
based on group size, i.e., the category in which most respondents fall. All other categories are
then compared to the reference level. For example, in coding major, business was selected as the

101
base category as this was the most popular program of study among research participants.
Likewise, full-time enrollment was chosen as the reference category for respondents‘ enrollment
status, female for gender, and primary school for mother‘s and father‘s highest educational level.
Consequently, 33 variables were analyzed for each of the two dependent variables.
To carry out the required analyses, three common variable selection procedures—
stepwise, forward, backward—were considered. Pedhazur (1997) acknowledged that there is no
consensus on any one selection procedure. Rather, he advised that these procedures be restricted
to prediction. Forward and stepwise selection techniques are similar in that both begin with no
variables in the model and variables are systematically added based on significance of the F
statistic. The two procedures are different in that forward selection retains variables already in
the model, while stepwise selection scrutinizes all variables in the model and deletes those not
producing a significant F statistic. Backward elimination starts with all predictors entered in the
model and each predictor examined in turn to determine the decrease in R2 that would result from
its removal. Therefore, the variables deleted are those whose removal would result in the
smallest decrease in R2. The variables retained in the final model are regarded as making
considerable contribution to prediction of the outcome variable. Pedhazur noted that the forward
selection procedure is seriously flawed in that ―predictors entered into the analysis are retained,
even if they have lost their usefulness upon inclusion of additional predictors‖ (p. 222). Other
researchers have warned against using stepwise procedures for ordering predictor variables
(Huberty, 2003; Huberty & Petoskey, 1999). Consequently, I decided to utilize the backward
elimination procedure to determine the best set of predictors for each outcome variable.
Involvement in class, extracurricular involvement, respondent age, and mother education
were the best predictors of perceived readiness for work, R2 = .20, adjusted R
2 = .198, F(4, 507)
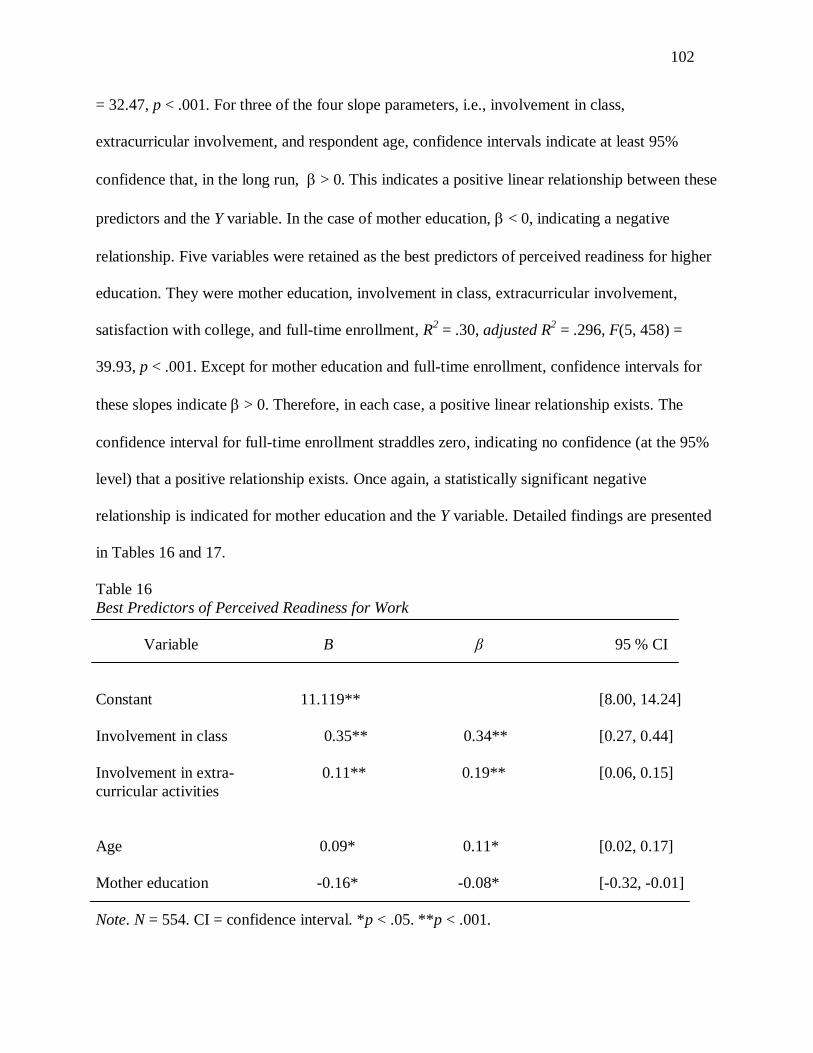
102
= 32.47, p < .001. For three of the four slope parameters, i.e., involvement in class,
extracurricular involvement, and respondent age, confidence intervals indicate at least 95%
confidence that, in the long run, > 0. This indicates a positive linear relationship between these
predictors and the Y variable. In the case of mother education, < 0, indicating a negative
relationship. Five variables were retained as the best predictors of perceived readiness for higher
education. They were mother education, involvement in class, extracurricular involvement,
satisfaction with college, and full-time enrollment, R2 = .30, adjusted R
2 = .296, F(5, 458) =
39.93, p < .001. Except for mother education and full-time enrollment, confidence intervals for
these slopes indicate > 0. Therefore, in each case, a positive linear relationship exists. The
confidence interval for full-time enrollment straddles zero, indicating no confidence (at the 95%
level) that a positive relationship exists. Once again, a statistically significant negative
relationship is indicated for mother education and the Y variable. Detailed findings are presented
in Tables 16 and 17.
Table 16
Best Predictors of Perceived Readiness for Work
Variable B β 95 % CI
Constant 11.119** [8.00, 14.24]
Involvement in class 0.35** 0.34** [0.27, 0.44]
Involvement in extra- 0.11** 0.19** [0.06, 0.15]
curricular activities
Age 0.09* 0.11* [0.02, 0.17]
Mother education -0.16* -0.08* [-0.32, -0.01]
Note. N = 554. CI = confidence interval. *p < .05. **p < .001.

103
Table 17
Best Predictors of Perceived Readiness for Higher Education
Variable B β 95 % CI
Constant 5.842** [3.35, 9.26]
Mother education -0.19* -0.11* [-0.33, -0.05]
Involvement in class 0.39** 0.42** [0.31, 0.46]
Extracurricular involvement 0.10** 0.21** [0.06, 0.15]
Satisfaction with college 0.14* 0.09* [0.02, 0.26]
Full-time enrollment 0.68+ 0.07
+ [-0.10, 1.45]
Note. N = 502. CI = confidence interval. *p < .05. **p < .001. + = p > .05

104
CHAPTER 5
SUMMARY, DISCUSSION, AND RECOMMENDATIONS
This chapter interprets findings presented in Chapter 4. The chapter is organized into six
sections, including a summary of the study, review of findings, discussion, recommendations for
practice and policy, recommendations for future research, and conclusion.
Summary of the Study
Preparation for career and higher education are primary missions of Jamaica‘s
community colleges (Miller, 2000; Walsh, 2005). The colleges have been making sustained
efforts to improve their traditionally inferior image in the Jamaican postsecondary education
sector, while tackling competition from internal and external postsecondary education providers
(Marshall, 2007). The community colleges have also been aggressively pursuing program
accreditation and re-accreditation. Consequently, several programs—mainly associate degree
programs—are now accredited. In addition, several colleges now offer community college-
developed baccalaureate degrees. Lower tuition, easier access, and less demanding entry
requirements make these institutions increasingly appealing to Jamaicans seeking a
postsecondary education. However, attaining an associate degree qualification does not
guarantee students a smooth transition from the community college to public universities (Evans
& Burke, 2006); Miller, 2005; UWI Research and Policy Group, 2005). Moreover, in view of
deficiencies in workforce training in Jamaica and the wider Caribbean (Gregory, 2003; McArdle,
2004; Taylor-Stone, 2008; World Bank, 2005), students‘ preparation for employment may also
be inadequate. Accordingly, it is worthwhile to investigate students‘ perceptions of how

105
effectively the community college has prepared them for further education and career goals. This
study investigated the extent to which class and extracurricular involvement, student background
characteristics, and factors at college predicted students‘ perceptions of readiness for further
education and career goals.
Six research questions guided the study.
1. What are the personal and college-related characteristics of Jamaican community college
students, and what goals do they intend to pursue after completing current studies at the
community college?
2. What forms of class-related and college extracurricular activities do Jamaican community
college students actively and regularly engage in?
3. What work- and college-related tasks do Jamaican community college students feel most
ready to perform?
4. What aspects of their college experiences are these Jamaican community college students
most satisfied with?
5. To what extent does involvement in class and college extracurricular activities
independently and collaboratively explain Jamaican community college students‘
perceived readiness for work and for higher education, respectively?
6. What are the best overall predictors of perceived readiness of these Jamaican community
college students for work and for higher education, respectively?
Survey research design was chosen for this study because it is cross sectional, and is also
an efficient means of collecting large amounts of descriptive data from respondents (Best &
Kahn, 1998). Other advantages of survey research include the likelihood of high response rates
and low cost (Fraenkel & Wallen, 2006). A researcher-administered survey allows the researcher
106
to directly address participant concerns and questions. The survey instrument used to collect data
for this study was empirically designed. Its development was guided by community college
student involvement literature, relevant community college surveys, and theories of student
involvement and integration. Therefore, the study‘s conceptual framework was predicated on
three complementary theories—Astin‘s (1984) student involvement theory, Pace‘s (1984) quality
of effort construct, and Tinto‘s (1986, 1993) student departure theory. The instrument contained
six sections, five of which measured student perceptions of class and extracurricular
involvement, perceived readiness for work and higher education goals, and satisfaction with the
college experience. Each of these five sections was organized into a scale, and total scores were
calculated for each. In the sixth section, respondents provided demographic information,
including gender, year of birth, employment status, postcollege goals, enrollment status, family
responsibilities, college major, and parent education. The instrument was administered to class
groups at seven Jamaican community colleges during the first 15-20 minutes of a class period,
from November to December 2010.
Data collection proceeded according to the tailored design method (Dillman, Smyth, &
Christian, 2009) and in keeping with conventions approved by The University of Georgia‘s
Institutional Review Board. Before the instrument was administered, it was reviewed by peers
and knowledgeable analysts. The instrument was then pretested with a group of Jamaican
community college students who shared characteristics with participants included in the final
study. Pilot testing confirmed the reliability of the original instrument‘s four scales, which
ranged from .71 to .87. The instrument was subsequently revised based on pilot study findings
and on feedback from pilot participants, and a fifth scale—Satisfaction with College—was
added. Reliability analyses obtained from the final survey administration revealed that
107
Cronbach‘s alpha reliabilities for the five scales ranged from .79 to .87. Data from the CCCJ
(2010) indicated the total study population across the eight colleges was 1,531. Of this number,
554 respondents completed surveys. All 554 surveys were useable despite a few missing
responses on some surveys; thus the response rate was 100%. It is possible that scores on the
various scales are exaggerated, perhaps influenced by social desirability. However, it is more
likely that the data are valid because (a) there was variance among the sample in terms of how
respondents rated their involvement in various activities, (b) respondent privacy and
confidentiality were maintained, and (c) participants responded anonymously.
Review of Findings
Respondents completed the 51-item Student Involvement Questionnaire that was
developed to specifically address the six research questions by eliciting information about
involvement and readiness behaviors, degree of satisfaction with the college experience, and
respondent personal and college-related characteristics. Respondents used 4-point Likert-type
agreement, frequency, and evaluation answer choices to rate their class and extracurricular
involvement, readiness for work and higher education, and level of satisfaction with college.
Survey data were analyzed using descriptive statistics, and simple and multiple regression
analyses. A review of findings from the data analysis is described below by research question.
Findings from Research Question 1 describe the personal and college-related
characteristics of respondents. They also reveal respondents‘ goals after completing studies at the
community college. Exactly 62.3% of the sample was female and 37.7% was male. Respondents
ranged in age from 18 to 46, and the mean age was 21.82. The largest majority of respondents
fell into the 18 to 21 age category. Likewise, most respondents were not employed (58.7%) and
had no family responsibilities (39.4%) during their college career, and nearly all of those who

108
were employed worked off-campus. Again, 32.2% of respondents reported that their family
responsibilities did not impact classes, 23.5% reported their family duties had little impact on
classes, and 4.9% indicated their family responsibilities had much impact on classes. Of those
responding to the question about the impact of family responsibilities on college activities,
37.1% indicated that they were not involved in college activities, while 33.8% reported no
conflict between responsibilities to family and involvement in college activities. Additionally,
23.1% of respondents disclosed that family responsibilities had little impact on their involvement
in college activities, and 6.0% reported that their family responsibilities had much impact on
their involvement in extracurricular activities. Meanwhile, 52.8% of respondents reported that
secondary education or a high school diploma was the highest education achieved by their
mother or maternal guardian, followed by 12.7% with a bachelor‘s degree, 11.4% with some
college education, 5.4% with a Master‘s degree or higher, 4.9% with primary school
qualifications, and 4.3% with an associate‘s degree. Conversely, 41.5% of fathers or paternal
guardians reportedly attained only secondary education or a high school diploma, followed by
9.0% with some college education, 7.4% with a bachelor‘s degree, 6.5% with primary school
qualifications, 4.2% with an associate‘s degree, and 4.2% with a Master‘s degree or higher.
Approximately 79.8% of survey respondents were full-time college enrollees, and 20.2% were
enrolled part-time—a ratio of almost 4 to 1. A majority of respondents (41.2%) were pursuing a
business major, 26.7% majored in hospitality and tourism studies, 24.2% in computer studies,
and 7.9% in architecture and construction. With regard to their postcollege goals, 44.5% of
respondents indicated their intention to directly pursue higher education studies after completing
current community college programs, 27.8% planned to enter or return to the workforce, and
27.7% reported that they intended to work while pursuing higher studies.

109
Research Question 2 focused on identifying class-related and college extracurricular
activities that respondents actively and regularly engaged in. Section 1 of the Student
Involvement Questionnaire required respondents to use an agreement response option to assess
their involvement and degree of effort expended in classes and class-related activities. The items
were organized into the Involvement in Classes (IC) scale, and the sum of all item responses
yielded the IC score. The agreement answer choices ranged from 1 (strongly disagree) to 4
(strongly agree). The IC mean score was 31.45 (SD = 4.06), with a minimum score of 10 and a
maximum of 40. The higher the score, the more involved and the greater the effort respondents
exerted in class activities. Results revealed that 98% of the sample reported active participation
in group-assigned coursework, 94.2% put much effort in conducting research for class
assignments, and 89.3% put a lot of effort into studying for a test or final exam. By contrast,
62.7% discussed class content with teachers outside of class, and only 46.9% discussed their
academic progress with a teacher or course advisor. The second section of the instrument was a
10-item Involvement in Extracurricular Activities (IE) scale that required respondents to indicate
how regularly they participated in specific college extracurricular activities. The frequency scale
responses available were 1(never), 2(rarely), 3(sometimes), and 4(often), and an IE scale total
was obtained by adding the values of individual item responses. The mean score for this scale
was 21.68 (SD = 7.35), and scores ranged from 10 to 40. A high IE score indicated frequent
involvement in extracurricular activities. An estimated 28.3% of the sample reported frequent
attendance at information sessions on future educational opportunities, and 24.4% often attended
employment-related information sessions. However, only 7.6% reported regular involvement in
planning and organizing campus activities, while 11.4% frequently participated in a voluntary
college project, or considered holding a leadership position in a campus-based club.
110
Research Question 3 focused on identifying career and higher education tasks that
respondents felt most ready to undertake, based on their current community college experiences.
The Perceived Readiness for Work (PRW) and Perceived Readiness for Higher Education (PRH)
scales used 4-point evaluation choices, with the following anchors: 1(not ready), 2 (somewhat
ready), 3(ready), and 4(very ready). The PRW scale was compulsory, while the PRH scale was
optional for respondents whose post-college goal did not include pursuing higher education
studies. However, 90.6% of the sample completed the PRH scale. Individual responses to the 8
PRW and 7 PRH items, respectively, were summed to produce a single score for each scale. The
mean score for the PRW scale was 25.95 (SD = 4.09), with a minimum score of 8 and a
maximum of 32. The PRH mean score was 21.87 (SD = 3.68), and total scores ranged from 7 to
28. High PRW and PRH scores indicated that respondents perceived that they were highly
prepared for work and higher education, respectively, based on the community college
experience. Of the specified work-based tasks, 60.1% of respondents believed they were most
ready to use the computer and Internet to complete tasks and communicate at work, followed by
55.8% who indicated that they were most prepared to maintain workplace standards and rules.
Yet only 28.7% felt very ready to prepare work-related documents, while 31.6% felt very ready
to complete team projects at work. Review of responses to the PRH scale revealed that 48.2% of
respondents were most ready to work as part of a team on group assignments at college, while
42.6% felt very ready to identify and use different information sources for course assignments.
However, only 19.9% of respondents felt very ready to write effective essays, and 26.3%
reported they were most ready to engage in oral debates and presentations.
The goal of Research Question 4 was to discover what aspects of the community college
experience respondents were most satisfied with. Satisfaction with College (SATC) was the fifth

111
scale on the Student Involvement Questionnaire. The SATC scale contained four items and
utilized a 4-point agreement response choice, with anchors that ranged from 1(strongly disagree)
to 4(strongly agree). Each respondent‘s SATC score was calculated by adding responses to the
four scale items. The SATC mean score was 9.60 (SD = 2.46), with a minimum score of 4 and a
maximum of 16. Item mean scores were low and the range was restricted (i.e., M = 2.66-2.26,
SD = 0.82-0.75). Respondents reported greatest satisfaction with their total community college
experiences (65.7%) and least satisfaction with college facilities (39.5%).
Regression analyses were conducted to answer Research Questions 5 and 6. Research
Question 5 investigated the extent to which IC and IE individually and jointly explained PRW
and PRH, respectively, in the survey sample. First, simple linear regression analyses were carried
out to determine if IC and IE significantly explained either of the two outcome variables—PRW
and PRH. Even when adjusted r2 values were considered, IC consistently accounted for greater
variability in each outcome variable than IE. For example, IC explained 13% of variability in
PRW, compared to 6% of variance explained by IE, and 19% of variance in PRH, whereas IE
accounted for 9%. These findings were statistically significant (p < .001). Moreover, IC
significantly predicted PRW scores, b = .37, t(551) = 9.09, p < .001, as well as PRH scores, b =
.39, t(499) = 10.79, p < .001. By contrast, IE significantly predicted a smaller increase in scores
for PRW, b = .14, t(551) = 5.98, p < .001, and for PRH, b = .15, t(499) = 7.13, p < .001. Next,
tests of interaction effects were carried out to determine joint effects of IC and IE on PRW and
PRH, respectively. Where no statistically significant interaction effects were found, simple
effects were then analyzed. The interaction effect of IC and IE on PRW was non-significant,
F(1,549) = 3.14, p = .08, but simple main effects were significant (p < .001). The parametric test
results indicated that IC accounted for a greater proportion of increase in PRW scores, = .32,

112
t(549) = 7.99, than IE, = .10, t(549) = 4.32. However, the interaction effect of IC and IE on
PRH was statistically significant, F(1,497) = 29.14, p < .001. Post hoc probing of the joint
effects of IC and IE on PRH indicated that IC produced more significant differences in scores for
PRH, = .35, t(497) = 9.66, p < .001, than IE, = .11, t(497) = 5.53, p < .001.
Finally, Research Question 6 investigated the best overall predictors of PRW and PRH,
respectively. Seven of the 11 predictor variables examined were categorical, and therefore had to
be dummy coded before multiple regression analyses could be conducted. Consequently, 33
predictor variables were analyzed using backward elimination procedures in SPSS. The best
predictors selected for PRW were IC, IE, respondent age, and mother‘s education, R2 = .20,
adjusted R2 = .198, F(4, 507) = 32.47, p < .001. Confidence interval estimates (95% CIs) for IC,
IE, and age [0.27, 0.44], [0.06, 0.15] and [0.02, 0.17], respectively, indicated positive linear
relationships between these predictors and PRW, but a negative linear relationship between
mother‘s education and PRW, β = -0.08, CI = -0.32, -0.01. In the second set of analyses, five
variables were retained as the best set of predictors of PRH—IC, IE, satisfaction with college
(SATC), mother‘s education, and full-time college enrollment, R2 = .30, adjusted R
2 = .296, F(5,
458) = 39.93, p < .001. The 95% CIs for IC, IE, and SATC signified positive linear relationships
between these variables and PRH. Again, the 95% CI estimate for mother‘s education denoted a
statistically significant negative relationship, β = -0.11, CI = -0.33, -0.05. There was no
confidence at the 95% level of a positive relationship between full-time enrollment and PRH
[-0.10, 1.45], and only marginal statistical significance (p = .09).

113
Discussion
Findings from this study support the main premise of the study‘s logical framework, and
aspects of student involvement, quality of effort, and student departure theories (see Astin, 1984;
Pace, 1984; Tinto, 1993). The findings also confirm as well as challenge conclusions based
primarily on American community college research, and have important implications for practice
within the Jamaican community college sector.
First, students identified higher education as their chief postcollege goal, with workforce
transition as a secondary goal. This finding was especially marked when consideration was given
to the percentage of students planning to combine work and higher education pursuits. It is also
consistent with the increased global demand for higher education opportunities (Alfred, Ewell,
Hudgins, & McClenney, 1999; Elsner, Boggs, & Irwin, 2008; Raby & Valeau, 2009). Students
who were higher-education bound felt most ready to engage in group assignments and to utilize
various information sources for class assignments. On the other hand, students headed for the
workforce indicated that they were most prepared to use the computer and Internet for work
tasks and communication. Like their American counterparts, Jamaica‘s community colleges
emphasize higher education and workforce preparation (Miller, 2000; Walsh, 2005). Academic
transfer may be the chief mission of the Jamaican colleges (Grant-Woodham & Morris, 2009),
but workforce preparation is foremost for American community colleges (Jenkins & Boswell,
2002). Buckle (2010) found no difference in academic performance of native Jamaican
university students and students who had transferred from the Jamaican community colleges.
Further, starting a bachelor‘s degree at the community college did not jeopardize degree
attainment. Findings from Buckle‘s study and the current study suggest that the Jamaican
colleges may be effectively preparing students for higher education studies.
114
A second finding was the pre-eminence of the involvement variables in predicting
perceived readiness for higher education and work, respectively, over the personal characteristics
and college-related variables. This finding supports Pace‘s (1984) quality of effort premise and
the study‘s logical framework, both of which proposed that student background and college-
related characteristics may be less important than involvement in college. In addition, the study
found class involvement to be the strongest predictor of perceived readiness for higher education
and for work, while involvement in extracurricular activities produced smaller effects on both
outcomes. Students reported greatest involvement in class activities that required much peer
group or individual effort, and in extracurricular activities directly linked to higher education and
employment goals. Study findings on the role of class involvement in student educational
outcomes reinforce involvement and departure theories (see Astin, 1984; Pace, 1984; Tinto,
1993). Studies of American community college students have also found that involvement and
perceptions of benefits strongly influence achievements at college and/or future outcomes
(Glover, 1996; Horn & Ethington, 2002; McClenney & Marti, 2006; Polizzi & Ethington, 2008;
Swigart & Murrell, 2001). The current study‘s discovery of the minimal effects of extracurricular
involvement contradicts the American community college literature and aspects of involvement
theory. It also challenges Astin‘s (1984) definition of an engaged student. Kasworm (2003, 2005)
acknowledged that work and family commitments may prevent adult students from participating
in out of class activities, and that, for these students, class involvement defines the college
experience. Spitzer‘s (2000) findings from a study of traditional and nontraditional students
found that nontraditional, i.e., adult students were more motivated and self-regulated than
younger students. However, this explanation does not hold for the traditional-aged students in the
study sample—an estimated four-fifths of the total sample—most of whom reported little
115
participation in extracurricular activities. It may be that opportunities for extracurricular
involvement are limited and/or that meeting course requirements does not leave students with
much time to participate in college activities.
A third finding was that mother‘s education produced small but statistically significant
negative effects on students‘ perceived readiness for higher education and for work. When all
predictors were held constant, a decrease in mother‘s education was accompanied by a decline in
perceived readiness for work and for higher education, respectively. On the other hand, father‘s
education was not a statistically significant predictor of either perceived readiness for work or for
higher education. The highest educational qualification for approximately 50% of mothers and
40% of fathers was a secondary or high school education, while 13% of mothers and 7% of
fathers held a bachelor‘s degree. Only 5% of mothers and 4% of fathers held Master‘s degrees or
higher. No previously published study of the Jamaican postsecondary education sector has
investigated the relationship between parents‘ education and student postsecondary enrollment or
outcomes. However, such an investigation may reveal that parents of students enrolled in the
community colleges have lower educational qualifications than parents of students enrolled in
the public universities (Miller, 2000). Moreover, traditional shortage of male role models and
absence of the father figure from Jamaican households (Miller, 1992, 1994) combined with the
nurturing role mothers play in their children‘s development, may account for the importance of
mother‘s education. National studies conducted in the U.S. have found strong correlation
between parent education and postsecondary enrollment, especially among community college
populations (Choy, 2001; Horn & Nuñez, 2000; Nora & Rendón, 1990).
Another important finding was that student age significantly predicted perceptions of
readiness for work but not for higher education. Approximately 80% of the study sample were

116
aged 24 and under. Age also had a very small effect on extracurricular involvement, in that
younger students reported more involvement in these activities than students of nontraditional
age. These findings are not surprising, given that 60% of the mostly traditional-aged study
sample reported no paid employment for most of their college career, and in view of the earlier
discussion of involvement patterns of adult and younger students. Clearly, adult students, i.e.,
those aged 25 and above, and who are typically part-time enrollees because of full-time work
and/or family commitments, would be expected to perceive greater preparation for employment
than their younger peers. The American postsecondary education research literature supports this
finding. Spitzer (2000) and Terenzini, Springer, Yaegar, Pascarella, and Nora (1996) found that
nontraditional students placed more emphasis on and were more confident about career goals
than traditional students. Although American community colleges typically enroll larger
proportions of nontraditional students than higher education (AACC, n.d., Bryant, 2001; NCES,
2004), findings from this study suggest the reverse may be true of Jamaica‘s community
colleges. This latter finding was supported by Buckle (2010).
Finally, satisfaction with college was the only college-related factor to significantly
predict perceived readiness for higher education. However, satisfaction with college did not
predict perceived readiness for work. This finding partially supports the study‘s logical
framework. Neither academic major nor enrollment status was found to be statistically
significant at the .05 alpha levels—a surprising result, especially for academic major. Most
students in the sample were pursuing a business major, which is a core specialization across the
community college system. The Associate degree in business studies program is generally
regarded as the CCCJ‘s flagship program, as it was the first to be developed and to receive
official accreditation status from the local tertiary accrediting agency. On the other hand, full-

117
time enrollment was one of five variables selected as best predicting perceived readiness for
higher education. However, it was only marginally significant, with an alpha level of .09.
Findings suggest that, unlike full-time enrollees, students enrolled in part-time (evening)
programs are generally older, employed full-time, and may have family commitments.
Therefore, it is logical for full-time enrollees to focus on pursuing higher education studies, and
for part-time students to focus on employment rather than higher education goals.
Students reported satisfaction with the overall college experience, though they were
dissatisfied with college facilities and services. They seemed inclined to overlook inadequate
and/or unavailable college facilities and services and to focus instead on their primary goal—
preparation for higher education. This finding contradicts research and theory linking perceptions
of the social and physical aspects of the college environment to student education outcomes (see
Astin, 1993; Jenks, Kahane, Bobinski, & Piermarini, 1979; Kuh & Hu, 2001; Tinto, 1993; Veltri,
Banning, & Gray Davies, 2006). However, Pascarella and Terenzini (2005) found that
educational institutions with an academic rather than a structural focus fostered more learning
and cognitive growth. Findings from the current study seem to confirm this. Of course, it is
important for colleges to regularly measure student satisfaction. This assessment can guide
institutional decisions and determine areas requiring urgent attention (Noel-Levitz, 2010).
Ultimately, measuring student satisfaction may enhance the quality of the undergraduate
experience and increase educational benefits to students and their families (Bryant, 2006).
Appraisal of student satisfaction is also useful for institutional self-study and program
accreditation processes in Jamaican community colleges. Pace (1984) believed colleges should
be held accountable for providing resources, programs and activities that motivate student
learning and development. Given the decline in financing of postsecondary education by
118
Caribbean governments (Howe, 2003), Jamaican community colleges do not have adequate
funding for needed programs and resources (Grant-Woodham & Morris, 2009; Wolff, 2009).
Therefore, community colleges are forced to be creative, and to prioritize areas they consider
critical to student academic outcomes. For this reason, they may be forced to place less focus on
student social and personal development programs and resources.
Although more research is required for a fuller understanding of students‘ perceived
readiness for postcollege goals, findings from this study lead to five major conclusions. First,
higher education was the primary post-college goal of students surveyed in this study. This
means most full-time students plan to enter higher education institutions as soon as they
complete current community college studies, and most part-time students intend to pursue
advanced studies while working. Second, classroom engagement was the strongest predictor of
perceived readiness for higher education and work. By contrast, extracurricular involvement had
minor effects on students‘ perceived readiness for both outcomes. Third, mother‘s education
influenced perceptions of readiness for higher education and work, though the effects were
minimal. Fourth, student age was a significant predictor of perceived readiness for work and
determined involvement in extracurricular activities. Finally, satisfaction with college predicted
perceptions of readiness for higher education. Students apparently valued the college experience
although they were not satisfied with services and facilities at their respective colleges.
Recommendations for Practice and Policy
The following recommendations for practice and policy are based on findings from this
survey study:
1. Transition into higher education was the chief postcollege goal of Jamaican community
college students. Although students believed they were ready for this transition, the

119
process can be frustrating. Community college and university educators need to address
the challenges related to student transfer. Current arrangements foster system-wide
cooperation among community college instructors for curriculum planning and student
assessment. However, except for collaboration on university programs franchised to the
community colleges, no cooperative education arrangements exist between community
college and university educators. It is therefore recommended that university instructors
work closely with community college instructors to prepare students for university study.
Both institutions may need to implement policies to accommodate this collaboration. For
example, university instructors could teach pre-determined course topics, write course
material, conduct education seminars, and serve as guest presenters. Both groups could
share education and informational resources, and work together on student assessments
and curriculum review. Such collaboration may remove redundancies from the
curriculum.
2. Students also expected to transition into careers after completing community college
studies. Some students planned to start their first jobs, others expected to return to jobs
held previously, and a third group indicated that they would seek new job opportunities.
Yet, they reported little readiness for preparing work documents and for participating in
team projects. Community college instructors and work experience coordinators should
emphasize activities within and outside of the classroom that help students develop these
competencies. For example, students should be encouraged to participate in more work-
based team projects for course credit. Taylor-Stone (2008) contended that tertiary
institutions are not adequately training students for the workforce, and that they are not
equipping the workforce with critical thinking, digital technology, and problem solving

120
skills. Based on these claims as well as findings from the study, it is imperative that
community college administrators and program coordinators pursue stronger cooperative
arrangements with employers and business leaders to more effectively prepare students
for the workforce. These partnerships should allow employers to serve as advisors on
business curriculum panels, and influence curriculum design and review. Survey
respondents revealed interest in attending employment-based information forums.
Program coordinators should work alongside employers to design a manual that informs
students about general workplace practices and careers related to their specific fields. The
manual should be regularly updated to reflect contemporary practices and trends. Current
work experience policies may also need to be reviewed and amended where necessary.
3. Regardless of postcollege goals, students reported greatest benefits from class
involvement, and only limited gains from involvement in extracurricular activities. They
also indicated they were least prepared to write effective essays. Therefore, instructors
should focus on developing essay writing skills. Also, in light of prevailing economic
constraints, class involvement should be prioritized, and teachers should use available
resources to encourage greater classroom engagement in varied learning activities.
Moreover, teaching strategies that facilitate cooperative learning should be emphasized.
To this end, colleges should provide professional development opportunities and support
for teachers to effectively engage students in the classroom. Likewise, ongoing training
should be provided for staff members directly involved in student services. Examples of
appropriate training and professional development opportunities include courses, web
sites, discussion forums, seminars and conferences, and mentoring programs with master
teachers.
121
Recommendations for Future Research
Based on the findings from this survey study, the following recommendations for future
research are provided:
1. Replicate this study with students at the community college who are not enrolled in
community college-developed programs. Compare results from the new study with
results from this study of students in community college-developed programs to
determine if there are any similarities and differences. If there are differences, ascertain
where they exist, what they mean, and how they can be useful.
2. Using qualitative research methodology such as interview or case study, repeat this
student perception study in Jamaican community colleges. Qualitative research will allow
for rich and detailed descriptions of findings, as students describe their feelings and tell
their own stories. The use of open-ended questions like Item 51 on the survey instrument
used in this study (see Appendix F) will allow students to fully describe their community
college experiences and share their views on how prepared they feel for higher education
and work goals. Data obtained from this study can then be coded according to common
themes. Though not generalizable, these detailed findings will be very useful to
community college educators.
3. This study found small but significant effects of college extracurricular involvement on
perceived readiness for work and for higher education, respectively. Tinto (1998) referred
to colleges as communities in which social integration is only possible if supportive peer
and faculty relationships exist, and if students are committed to the institution. Generally,
students with work and family responsibilities are less likely to have these supportive
college relationships. It may also be that students are motivated to achieve academic

122
success and their positive perceptions are tied to high levels of self-efficacy. According to
Bandura (1986) learners who possess high levels of self-efficacy are resilient and
maintain efforts necessary to perform successfully and achieve their aims. Conduct a
study that examines the relationship between motivation and perceived readiness for
postcollege goals.
4. The current study measured students‘ perceptions at one point in time. Perceptions are
subject to change. Moreover, students‘ beliefs about their readiness for higher education
may not be supported by actual readiness data. The Jamaican community colleges have
been accused of substandard tertiary education programs (Grant-Woodham & Morris,
2009) and students have experienced difficulties when they try to transfer into some
universities (Miller, 2005). Conduct a study that investigates the academic performance
of students from the current study sample who have transferred into local public and
private universities. Use variables such as GPA, time to degree, and graduation rates to
measure academic performance. Compare findings from the new study with results from
this study.
5. Conduct a study that explores perceptions of community college teachers that taught
students in this study, university instructors, and employers about the preparation of
community college students for higher education and career goals. Compare results of the
new study with this student perception study.
6. One of the limitations of this study was that it only examined the perceptions of students
successful (i.e., in final-year) at the community college. Therefore, conduct a study that
compares perceptions of readiness for higher education and work of different groups of
students enrolled in Jamaican community college-developed programs.

123
Conclusion
Jamaica needs to increase participation in postsecondary education in order to promote
and sustain economic development (UNESCO-UIS, 2009). Enhancing higher education and
training will produce an efficient workforce and increase global competitiveness (World
Economic Forum, 2009, 2010). The Jamaican government has embarked upon a national
development plan targeting economic and social development (PIOJ, n.d.). A fundamental goal
is to achieve a globally competitive postsecondary education system that effectively harmonizes
work and school. Despite limited resources, Jamaica‘s community colleges have proven that they
are able to provide access to a wide cross-section of persons, some of whom would otherwise be
unable to pursue postsecondary education. Over time, the colleges have improved their image by
aggressively pursuing and attaining program recognition and accreditation. Yet, the absence of
an efficient integrated postsecondary education system prevents community college graduates
from transitioning smoothly into public universities (Evans & Burke, 2006; Stennett, 2005).
Concerns have also been raised about students‘ preparation for workforce transition (Wolff,
2009). These circumstances suggested a need to examine students‘ perceptions of their readiness
for post community college goals, i.e., higher education and work.
Increasingly, college students globally are demanding an education that is relevant,
convenient, responsive, and flexible, and they have many options from which to choose (Alfred
et al., 1999). Students enrolled in Jamaica‘s community colleges have the same expectations.
Therefore, community college educators should consistently gauge student perceptions of the
collegiate experience, and engage them in meaningful learning activities. By so doing, they will
be better able to manage the quality of this experience and enhance student outcomes.

124
REFERENCES
Adamson, C. (n.d). Message from the Executive Director. Retrieved from the Council of
Community Colleges of Jamaica (CCCJ) website:
http://cccj.edu.jm/index.php?option=com_content&view=article&id=36&Itemid=22
Aiken, L. S., & West, S. G. (1991). Multiple regression: Testing and interpreting interactions.
Newbury Park, CA: Sage.
Ajzen, I., & Fishbein, M. (1980). Understanding attitudes and predicting social behavior.
Englewood Cliffs, NJ: Prentice-Hall.
Alfred, R., Ewell, P., Hudgins, J., & McClenney, K. (1999). Core indicators of
effectiveness for community colleges: Toward high performance (2nd ed., Report
No. JC990083). Washington, DC: American Association of Community Colleges.
Retrieved from ERIC database. (ED426749)
Algina, J., & Olejnik, S. (2000). Determining sample size for accurate estimation of the squared
multiple correlation coefficient. Multivariate Behavioral Research, 35(1), 119-137.
doi:10.1207/S15327906MBR3501_5
Altbach, P. (1994). Students: Interests, culture, and activism. In A. Levine (Ed.), Higher
learning in America 1980-2000 (pp. 203-221). Baltimore, MD: Johns Hopkins
University Press.
American Association of Community Colleges (AACC). (n.d.). American association of
community colleges 2010 fact sheet. Retrieved from
http://www.aacc.nche.edu/AboutCC/Documents/factsheet2010.pdf
125
American College Testing (ACT). (n.d.). WorkKeys: Assessments. Retrieved from
http://www.act.org/workkeys/assess/
American Council on Education (ACE). (2003, August). Student success: Understanding
graduation and persistence rates (Issue Brief). ACE Center for Policy Analysis.
Washington, DC: Author. Retrieved from website:
http://www.acenet.edu/AM/Template.cfm?Section=Home
Amey, M. J., & VanDerLinden, K. E. (2002).The institutional context of community
college administration (Research Brief, Leadership Series No. 4). Washington, DC:
American Association of Community Colleges. Retrieved from ERIC database.
(ED503503)
Astin, A. W. (1970). The methodology of research on college impact (Pt. 1). Sociology of
Education, 43, 223–254. doi:10.2307/2112065
Astin, A. W. (1975). Preventing students from dropping out. San Francisco, CA: Jossey-Bass.
Astin, A. W. (1984). Student involvement: A developmental theory for higher education.
Journal of College Student Development, 25, 297-308.
Astin, A. W. (1985). Achieving educational excellence: A critical assessment of priorities
and practices in higher education. San Francisco, CA: Jossey-Bass.
Astin, A. W. (1993). What matters in college? Four critical years revisited. San
Francisco, CA: Jossey-Bass.
Babbie, E. R. (1990). Survey research methods. Belmont, CA: Wadsworth.
Bagley, S. S., & Rust, V. D. (2009). Community-based folk high schools in Norway,
Sweden, and Denmark. In R. L. Raby & E. J. Valeau (Eds.), Community college

126
models: Globalization and higher education reform (pp. 279-298). Dordrecht, The
Netherlands: Springer. doi:10.1007/978-1-4020-9477-4_16
Bahruth, R. E., & Venditti, P. N. (Eds.). (1990). Profiles in success: Reflections on the
community college experience (Report No. ISBN-0-87117-220-8). Washington,
DC: American Association of Community and Junior Colleges. Retrieved from ERIC
database. (ED350051)
Bailey, B. (2004). Gender and education in Jamaica: Who is achieving and by whose
standard? Prospects, 34, 53-69. doi:10.1023/PROS.0000026679.99139.91
Bailey, T., Jenkins, D., & Leinbach, T. (2005, September). Graduation rates, student
goals, and measuring community college effectiveness (Issue Brief No. 28). New York,
NY: Columbia University, Community College Research Center.
Balunas, L. (1986). A study of the effects of student employment on grade point average
and retention at Broome community college (Working Paper Series No. 3-86).
Binghamton, NY: Institute for Community College Research. Retrieved from ERIC
database. (ED277446)
Bandura, A. (1986). Social foundations of thought and action: A social cognitive theory.
Englewood Cliffs, NJ: Prentice-Hall.
Bean, J. P., & Metzner, B. S. (1985). A conceptual model of nontraditional undergraduate
student attrition. Review of Educational Research, 55, 485-508, 520-539.
doi:10. 3102/00346543055004485
Bers, T. H., & Smith, K. E. (1991). Persistence of community college students: The
influence of student intent and academic and social integration. Research in
Higher Education, 32, 539-556. doi:10.1007/BF00992627
127
Best, J. W., & Kahn, J. V. (1998). Research in education (8th ed.). Needham Heights, MA:
Allyn & Bacon.
Boggs, G. R., & Irwin, J. (2009). Preface. In R. L. Raby & E. J. Valeau (Eds.),
Community college models: Globalization and higher education reform (pp. ix-
xii). Dordrecht, The Netherlands: Springer.
Boylan, H.R. (2001). Making the case for developmental education. Research in Developmental
Education, 12(2), 1-4. Retrieved from
http://www.deanza.edu/studentsuccess/bsi/Article_04
Brandon, E. P. (2003, July). New external providers of tertiary education in the
Caribbean. Prepared for the International Institute for Higher Education in Latin
America and the Caribbean (IESALC). Retrieved from
http://cavehill.uwi.edu/bnccde/epb/Unesco2.pdf
Braxton, J. M., Shaw Sullivan, A. V., & Johnson, R. M., Jr. (1997). Appraising Tinto‘s
theory of college student departure. In J. C. Smart (Ed.), Higher Education: Handbook of
Theory and Research, 12 (pp. 107-164). New York, NY: Agathon.
Braxton, J. M., Milem, J. F., & Sullivan, A. S. (2000). The influence of active learning on
the college student departure process: Toward a revision of Tinto‘s theory. The
Journal of Higher Education, 71, 569-590. doi:10.2307/2649260
Bryant, A. N. (2001). Community college students: Recent findings and trends [ERIC
Review]. Community College Review, 29(3), 77-93. doi:10.1177/009155210102900305
Bryant, J. L. (2006). Assessing expectations and perceptions of the campus experience: The
Noel-Levitz student satisfaction inventory. New Directions for Community Colleges,
134, 25-35. doi:10.1002/CC.234

128
Buckle, E. M. (2010). A comparison of the academic performance of Jamaican community
college transfer students and native university students enrolled in a collaborative
baccalaureate degree program (Doctoral dissertation). Retrieved from
http://repository.lib.ncsu.edu/ir/bitstream/1840.16/4674/1/etd.pdf
Cabrera, A. F., Nora, A., & Castaňeda, M. B. (1993). College persistence: Structural
equations modeling test of an integrated model of student retention. The Journal
of Higher Education, 64, 123-139. doi:10.2307/2960026
Chaney, B., Muraskin, L. D., Cahalan, M. W., & Goodwin, D. (1998). Helping the
progress of disadvantaged students in higher education: The federal student
support services program. Educational Evaluation and Policy Analysis, 20, 197-215.
doi:10.2307/1164492
Cheng, D. X. (2001). Assessing student collegiate experience: Where do we begin?
Assessment and Evaluation in Higher Education, 26, 525-538.
doi:10.1080/02602930120093869
Chevannes, B. (2005). Legislation of tertiary education in the Caribbean. Caracas, Venezuela:
International Institute for Higher Education in Latin America and the Caribbean
(UNESCO-IESALC).
Choy, S. (2001). Students whose parents did not go to college: Postsecondary access,
persistence, and attainment. Findings from the condition of education 2001 (NCES 2001-
126). Washington, DC: U.S. Department of Education. Retrieved from
http://nces.ed.gov/pubs2001/2001126.pdf

129
Cobley, A. G. (2000). The historical development of higher education in the Anglophone
Caribbean. In G. D. Howe (Ed.), Higher education in the Caribbean: Past, present and
future directions (pp. 1-23). Kingston, JA: The University of the West Indies.
Cohen, A. M., & Brawer, F. B. (2003). The American community college (4th ed.). San
Francisco, CA: Jossey-Bass.
Cohen, A. M., & Brawer, F. B. (2008). The American community college (5th ed.). San
Francisco, CA: Jossey-Bass.
Coley, R. J. (2000). The American community college turns 100: A look at its students,
programs, and prospects (ETS Policy Evaluation and Research Center).
Princeton, NJ: Educational Testing Service.
Community College Survey of Student Engagement (CCSSE). (2005). The community
college student report (CCSR). Retrieved from University of Texas at Austin,
Center for Community College Student Engagement website:
http://www.ccsse.org/aboutsurvey/CCSR_2005.pdf
Community College Survey of Student Engagement (CCSSE). (2008). Essential elements of
engagement: High expectations and high support. Austin, TX: The University of Texas,
Community College Leadership Program. Retrieved from
http://www.ccsse.org/publications/2008_National_Report.pdf
Community College Survey of Student Engagement (CCSSE). (2009). Making connections:
Dimensions of student engagement (2009 CCSSE Findings). Austin, TX:
The University of Texas, Community College Leadership Program. Retrieved from
http://www.ccsse.org/publications/national_report_2009/CCSSE09_nationalreport.pdf

130
Council of Community Colleges of Jamaica (CCCJ). (n.d.a.). The twelve facts.
Retrieved from http://cccj.edu.jm/
Council of Community Colleges of Jamaica (CCCJ). (n.d.b.). The Council of Community
Colleges of Jamaica Act. Retrieved from
http://cccj.edu.jm/index.php?option=com_wrapper&view=wrapper&Itemid=6
Council of Community Colleges of Jamaica (CCCJ). (n.d.c.). The Council of Community
Colleges of Jamaica: Vision statement. Retrieved from
http://cccj.edu.jm/index.php?option=com_content&view=article&id=5&Itemid=8
Council of Community Colleges of Jamaica (CCCJ). (2009a). Enrollment and graduation
data: 2004–2008 [Data file]. St. Catherine, Jamaica: Author.
Council of Community Colleges of Jamaica (CCCJ). (2009b). Student handbook:
Associate of science and bachelor of science in business studies 2009-2010.
Retrieved from http://cccj.edu.jm/
Council of Community Colleges of Jamaica (CCCJ). (2010, November). CCCJ final-year
enrollment data:2010-2011 [Data file]. St. Catherine, Jamaica: Author.
Creswell, J. W. (2003). Research design: Qualitative, quantitative, and mixed method
approaches. Thousand Oaks, CA: Sage.
Creswell, J. W. (2008). Educational research: Planning, conducting, and evaluating
quantitative and qualitative research (3rd ed.). Upper Saddle River, NJ: Prentice
Hall.
Crocker, L., & Algina, J. (2008). Introduction to classical and modern test theory.
Florence, KY: Cengage.

131
Davis, T. M., & Murrell, P. H. (1993). A structural model of perceived academic,
personal, and vocational gains related to college student responsibility. Research
in Higher Education, 34, 267-289. doi:10.1007/BF00991846
Dillman, D. A., Smyth, J. D., & Christian, L. M. (2009). Internet, mail, and mixed-mode
surveys (3rd ed.). Hoboken, NJ: Wiley.
Douzenis, C. (1996). The relationship of quality of effort and estimate of knowledge gain
among community college students. Community College Review, 24, 27-35.
doi:10.1177/009155219602400304
Elsner, P. A., Boggs, G. R., & Irwin, J. T. (Eds.). (2008). Global development of
community colleges, technical colleges, and further education programs.
Washington, DC: American Association of Community Colleges.
Ethington, C. A., Guthrie, A. M., & Lehman, P. W. (2001). CCSEQ: Test manual and
comparative data (3rd ed.). University of Memphis, Center for the Study of
Higher Education.
Ethington, C. A., & Horn, R. A. (2007). An examination of Pace‘s model of student
development and college impress. Community College Journal of Research and
Practice, 31, 183-198. doi:10.1080/10668920600857222
Ethington, C. A., & Polizzi, T. B. (1996). An assessment of the construct validity of the
CCSEQ quality of effort scales. Research in Higher Education, 37, 711-730.
doi:10.1007/BF01792953
132
Evans, H., & Burke, O. (2006, January). National report on higher education in Jamaica.
Prepared for UNESCO-IESALC. Retrieved from
http://www.iesalc.unesco.org.ve/dmdocuments/biblioteca/libros/national_report_jamaica.
Fraenkel, J. R., & Wallen, N. E. (2006). How to design and evaluate research in
education (6th ed.). New York, NY: McGraw-Hill.
Friedlander, J., & MacDougall, P. (1991). Increasing student involvement in learning.
Leadership Abstracts, 4(12), 1-34.
Friedlander, J., Murrell, P. H., & MacDougall, P. (1993). The community college student
experiences questionnaire. In T. W. Banta (Ed.), Making a difference: Outcomes
of a decade of assessment in higher education (1st ed., pp. 196-210). San
Francisco, CA: Jossey-Bass.
Gall, M. D., Gall, J. P., & Borg, W. R. (2007). Educational research: An introduction
(8th ed.). Boston, MA: Allyn & Bacon.
Glover, J. W. (1996). Campus environment and student involvement as predictors of
outcomes of the community college experience. ASHE Annual Meeting Paper
(Report No. HE029748). Memphis, TN: University of Memphis. Retrieved from
ERIC database. (ED402831)
Grant-Woodham, J., & Morris, C. (2009). Community colleges embracing change: The
Anglophone Caribbean perspective. In R. L. Raby & E. J. Valeau (Eds.),
Community college models: Globalization and higher education reform (pp. 299-
320). Dordrecht, The Netherlands: Springer. doi:10.1007/978-1-4020-9477-4_17
133
Green, S. B. (1991). How many subjects does it take to do a regression analysis?
Multivariate Behavioral Research, 26, 499-510. doi:10.1207/s15327906mbr2603_7
Gregory, R. (2003). The role of TVET and the Caribbean Association of National Training
Agencies (CANTA) and allied bodies within the Caribbean Single Market and Economy
(CSME). Retrieved from
http://www.cinterfor.org.uy/public/english/region/ampro/cinterfor/news/biblio/roletvet.
doc
Grimes, S. K. (1995). Targeting academic program to student diversity utilizing learning
styles and learning-study strategies. Journal of College Student Development, 36,
422-430.
Halder, J. (2008). Three styles of community college development: India, the Dominican
Republic, and Georgia. In P. A. Elsner, G. R. Boggs, & J. T. Irwin (Eds.), Global
development of community colleges, technical colleges, and further education
programs (pp. 269-275). Washington, DC: American Association of Community
Colleges.
Hausmann, R., Tyson, L. D., & Zahidi, S. (2009). The global gender gap report 2009.
World Economic Forum, Geneva, Switzerland. Retrieved from
http://www.weforum.org/pdf/gendergap/report2009.pdf
Henry-Wilson, M. (2005). Towards a higher education system for Jamaica: The government
perspective. In R. Holding & O. Burke (Eds.), Revisiting tertiary education policy in
Jamaica: Towards personal gain or public good? (pp. 3-10). Kingston, Jamaica: Ian
Randle.
134
Hill, R. B. (2001). Survey research. In E. I. Farmer & J. W. Rojewski (Eds.), Research
pathways: Writing professional papers, theses, and dissertations in workforce
education (pp. 201-222). Lanham, MD: University Press of America.
Hoachlander, G., Sikora, A. C., & Horn, L. (2003). Community college students: Goals,
academic preparation, and outcomes. Postsecondary education descriptive analysis
reports (Report No. NCES-2003-164). Washington, DC: National Center for Education
Statistics. Retrieved from ERIC database. (ED479827)
Horn, L., Nevill, S., & Griffith, J. (2006). Profile of undergraduates in U.S. postsecondary
education institutions, 2003-04: With a special analysis of community college students:
Statistical analysis report (NCES 2006-184). Washington, DC: National Center for
Education Statistics. Retrieved from ERIC database. (ED491908)
Horn, L., & Nuñez, A-M. (2000). National Center for Education Statistics. Mapping the road to
college: First-generation students’ math track, planning strategies, and context of
support (NCES 2000-153). Washington, DC: U.S. Department of Education. Retrieved
from http://nces.ed.gov/pubs2000/2000153.pdf
Horn, L., Peter, K., & Rooney, K. (2002). Profile of undergraduates in U.S. postsecondary
institutions: 1999-2000 (NCES 2002-168). Washington, DC: U.S. Department of
Education, National Center for Education Statistics.
Horn, L. J., & Premo, M. D. (1995). Profile of undergraduates in U.S. postsecondary
education institutions: 1992-93. With an essay on undergraduates at risk (NCES
96-237). Washington, DC: U.S. Department of Education, Office of Educational
Research and Improvement. Retrieved from http://nces.ed.gov/pubs/96237.pdf

135
Horn, R. A., & Ethington, C. A. (2002). Self-reported beliefs of community college
students regarding their growth and development: Ethnic and enrollment status
differences. Community College Journal of Research and Practice, 26, 401-413.
doi:10.1080/02776770290041765
Howe, G. D. (2003, January). Contending with change: Reviewing tertiary education in
the English-speaking Caribbean (Final version). The International Institute for
Higher Education in Latin America and the Caribbean (IESALC), UNESCO.
Caracas, Venezuela. Retrieved from
http://unesdoc.unesco.org/images/0013/001315/131593e.pdf
Huberty, C. J. (2003). Multiple correlation versus multiple regression. Educational and
Psychological Measurement, 63(2), 271-278. doi:10.1177/0013164402250990
Huberty, C. J., & Petoskey, M. D. (1999). Use of multiple correlation analysis and
multiple regression analysis. Journal of Vocational Education Research, 24, 15-43.
Huck, S. W. (2008). Reading statistics and research (5th ed.). Boston, MA: Allyn & Bacon.
Ignash, J. M., & Townsend, B. K. (2001). Statewide transfer and articulation policies:
Current practices and emerging issues. In B. K. Townsend & S. B. Twombly
(Eds.), Community colleges: Policy in the future context (pp. 173-192). Westport,
CT: Ablex.
Jamaica Tourist Board. (n.d.). Tourism in Jamaica: Resort areas. Retrieved from
http://www.jtbonline.org/tourism_jamaica/Pages/ResortAreas.aspx
Jenkins, D., & Boswell, K. (2002). State policies on community college workforce
development: Findings from a national survey (Report No. JC030014). Denver, CO:

136
Education Commission of the States. Center for Community College Policy.
Retrieved from ERIC database. (ED471147)
Jenks, J., Kahane, J., Bobinski, V., & Piermarini, T. (1979). The relationship between perceived
college student satisfaction and goal-directedness. Measurement and Evaluation in
Guidance, 11(4), 225-229. doi:10.1111/j.2150-1092.1979.tb01010.x/pdf
Kasworm, C. (2003). Adult meaning making in the undergraduate classroom. Adult
Education Quarterly, 53, 81-98. doi:10.1177/0741713602238905
Kasworm, C. (2005). Adult student identity in an intergenerational community college
classroom. Adult Education Quarterly, 56, 3-20. doi:10.1177/0741713605280148
Kerlinger, F. N. (1979). Behavioral research: A conceptual approach. New York, NY: Holt.
Krejcie, R. V., & Morgan, D. W. (1970). Determining sample size for research activities.
Educational and Psychological Measurement, 30, 607-610.
Kuh, G. D., Bean, J. P., Hossler, D., & Stage, F. K. (Eds.). (1989). ASHE reader on
college students. Needham Heights, MA: Ginn.
Kuh, G. D., & Hu, S. (2001). Focus of faculty: Challenges and changing roles. The
effects of student-faculty interaction in the 1990s. The Review of Higher
Education, 24, 309-332. doi:10.1353/rhe.2001.0005
Kuh, G. D., Kinzie, J., Buckley, J. A., Bridges, B. K., & Hayek, J. C. (Eds.). (2007).
Piecing together the student success puzzle: Research, propositions, and
recommendations. ASHE Higher Education Report, 32(5), 1-182.
Kuh, G. D., Pace, C. R., & Vesper, N. (1997). The development of process indicators to
estimate student gains associated with good practice in undergraduate education.
Research in Higher Education, 38, 435–454. doi:10.1023/A:1024962526492

137
Laanan, F. S. (2000). Community college students‘ career and educational goals. New
Directions for Community Colleges, 112, 19-33. doi:10.1002/CC.11202
Leo-Rhynie, E. (2007). Prospects and challenges of the tertiary education sector in Jamaica. In
K. O. Hall & R. M. Cameron (Eds.), Higher education: Caribbean perspectives (pp. 9-
20). Kingston, Jamaica: Ian Randle.
Leppel, K. (2002). Similarities and differences in the college persistence of men and
women. The Review of Higher Education, 25, 433-450. doi:10.1353/rhe.2002.0021
Lohman, E. M., & Dingerson, M. R. (2005). The effectiveness of occupational-technical
certificate programs: Assessing student career goals. Community College Journal
of Research and Practice, 29, 339-355. doi:10.1080/10668920590911850
London, E. (2005). Quality assurance and regulation issues. In R. Holding & O. Burke (Eds.),
Revisiting tertiary education policy in Jamaica: Towards personal gain or public good?
(pp. 284-296). Kingston, Jamaica: Ian Randle.
Marshall, Y. J. (2007). A multi-case study of the accreditation self-study process in community
colleges in Jamaica (Doctoral dissertation). ProQuest Dissertations and Theses database.
(AAT No. 3268173)
Martin, M., & Bray, M. (2009, July). Tertiary education in small states: Development trends and
policy implications. Policy forum on tertiary education in small states, IIEP, Paris.
Retrieved from IIEP publications website:
http://www.iiep.unesco.org/information-services/publications.html
McArdle, T. (2004). Workforce education and development in Jamaica. In J. W. Rojewski (Ed.),
International perspectives on workforce education and development (pp. 165-187).
Greenwich, CT: Information Age.
138
McClenney, K. M. (2007). The community college survey of student engagement.
Community College Review, 35, 137-146. doi:10.1177/0091552107306583
McClenney, K. M., & Marti, C. N. (2006, December). Exploring relationships between student
engagement and student outcomes in community colleges: Report on validation research
(Working Paper). Retrieved from
http://www.inpathways.net/ExploringOutcomesEngagementCommunityCollege.pdf
Milem, J. F., & Berger, J. B. (1997). A modified model of college student persistence:
Exploring the relationship between Astin‘s theory of involvement and Tinto‘s
theory of student departure. Journal of College Student Development, 38, 387-400.
Miller, E. (1992). Men at risk. Mona, Jamaica: University of the West Indies.
Miller, E. (1994). Marginalization of the black male (2nd ed.). Mona, Jamaica: Canoe Press.
Miller, E. (2000). Access to tertiary education in the Commonwealth Caribbean in the 1990s.
In G. D. Howe (Ed.), Higher education in the Caribbean: Past, present and future
directions (pp. 117-141). Kingston, Jamaica: The University of the West Indies.
Miller, E. (2005). The University of the West Indies, Mona, and postsecondary education in
Jamaica. In R. Holding & O. Burke (Eds.), Revisiting postsecondary education policy in
Jamaica. Kingston, Jamaica: Ian Randle.
Ministry of Education and Culture (MOEC) Jamaica. (2009). Jamaica education statistics 2009-
2010: Annual statistical review of the education sector. Kingston, Jamaica: Author.
Retrieved from http://www.moec.gov.jm/EDUCATION STATISTICS 2009-2010.pdf
Muijs, D. (2004). Doing quantitative research in education: With SPSS. London, UK: Sage.
139
Murrell, P. H., & Glover, J. W. (1996). The community college experience: Assessing
process and progress. Community College Journal of Research and Practice, 20,
199–200. doi:10.1080/1066892960200207
National Center for Education Statistics (NCES). (2004). The condition of education 2004
(NCES 2004-077). Washington, DC: U.S. Department of Education.
Nkrumah-Young, K. K., Huisman, J., & Powell, P. (2008). The impact of funding
policies on higher education in Jamaica. Comparative Education, 44, 215-227.
doi:10.1080/03050060802041209
Noel-Levitz, Inc. (2008). 2008 national research report. National student satisfaction and
priorities report. Executive summary. Retrieved from
http://www.noellevitz.com/documents/shared/Papers_and_Research/2008/NatSatisfaction
ReportExecutiveSummary08.pdf
Noel-Levitz, Inc. (2010). 2010 national research report. National student satisfaction and
priorities report. Executive summary. Retrieved from
http://www.noellevitz.com/documents/shared/Papers-and_Research/2010/SSI EXEC
SUM_report_1210.pdf
Nora, A., & Rendón, L. I. (1990). Determinants of predisposition to transfer among
community college students: A structural model. Research in Higher Education,
31, 235-255. doi:10.1007/BF00992310
O‘Lawrence, H. (2008). Workforce competencies: A comparison of U.S. and Jamaican
experiences. In V. C. X. Wang & K. P. King (Eds.), Innovations in career and
technical education: Strategic approaches towards workforce competencies
around the globe (pp. 193-217). Charlotte, NC: Information Age.

140
Olejnik, S. F. (1984). Planning educational research: Determining the necessary sample
size. Journal of Experimental Education, 53(1), 40-48.
Pace, C. R. (1979). Measuring outcomes of college: Fifty years of findings and
recommendations for the future. San Francisco, CA: Jossey-Bass.
Pace, C. R. (1982). Achievement and the quality of student effort (Report No. SP022214).
Washington, DC: National Commission on Excellence in Education. Retrieved from
ERIC database. (ED227101)
Pace, C. R. (1984). Measuring the quality of college student experiences: An account of the
development and use of the College Student Experiences Questionnaire.
Los Angeles, CA: University of California at Los Angeles.
Pace, C. R. (1992). The development and framework of the CCSEQ. In P. W. Lehman (Ed.),
CCSEQ: Test manual and comparative data. Community College Student Experiences
Questionnaire (pp. 1-98). Los Angeles, CA: Center for the Study of Evaluation.
Retrieved from ERIC database. ( ED345792)
Pace, C. R. (2001). The development and framework of the CCSEQ. In C. A. Ethington,
A. M. Guthrie, & P. W. Lehman (Eds.), CCSEQ: Test manual and comparative data
(3rd ed.). The University of Memphis, TN: Center for the Study of Higher Education.
Pace, C. R., Friedlander, J., Lehman, P. W., & Murrell, P. H. (1990). Community College
Student Experiences Questionnaire (CCSEQ). The University of Memphis, TN:
Center for the Study of Higher Education.
Pace, C. R., Friedlander, J., Lehman, P. W., & Murrell, P. H. (1999). Community College
Student Experiences Questionnaire (CCSEQ). (rev.ed.). University of Memphis,
Center for the Study of Higher Education.

141
Pascarella, E. T. (1997). It‘s time we started paying attention to community college students.
About Campus, 1(6), 14-17.
Pascarella, E. T., & Terenzini, P. T. (1991). How college affects students: Findings and
insights from twenty years of research. San Francisco, CA: Jossey-Bass.
Pascarella, E. T., & Terenzini, P. T. (2005). How college affects students (Vol. 2). A third
decade of research. San Francisco, CA: Jossey-Bass.
Pearson, F. C., Gould, P. D., Ethington, C. A., & Murrell, P. H. (2009). Community
college student experiences questionnaire (CCSEQ): Test manual and comparative data
(4th ed.). University of Memphis, TN: Center for the Study of Higher Education.
Pedhazur, E. J. (1997). Multiple regression in behavioral research: Explanation and prediction
(3rd ed.). New York, NY: Harcourt Brace.
Phillippe, K. A., & Sullivan, L. G. (2005). National profile of community colleges: Trends and
statistics (4th ed.). Washington, DC: American Association of Community Colleges.
Planning Institute of Jamaica (PIOJ). (2009). Economic and social survey Jamaica (ESSJ) 2009.
Kingston, Jamaica: Author.
Planning Institute of Jamaica (PIOJ). (2010). Presentation at the labour market forum 2010.
―The PIOJ perspective: The role of the Jamaican labour market in a contracting fiscal
environment‖. Retrieved from
http://www.pioj.gov.jm/PressRoom/Speeches/tabid/119/Default.aspx
Planning Institute of Jamaica (PIOJ). (n.d.). Vision 2030 Jamaica: National development plan.
Planning for a secure and prosperous future. Retrieved from
http://www.vision2030.gov.jm/NationalDevelopmentPlan/tabid/73/Default.aspx
142
Polizzi, T. B., & Ethington, C. A. (1998). Factors affecting gains in career preparation: A
comparison of vocational groups. Community College Journal of Research and
Practice, 22, 39-52. doi:10.1080/1066892980220104
Raby, R. L., & Valeau, E. J. (Eds.). (2009). Community college models: Globalization
and higher education reform. Dordrecht, The Netherlands: Springer.
Richardson, J. T. E. (2005). Instruments for obtaining student feedback: A review of the
literature. Assessment & Evaluation in Higher Education, 30, 387-415. doi:10.1080/
02602930500099193
Roberts, V. (1999). Programme articulation: The making of a regional tertiary education
system. Journal of Education and Development in the Caribbean, 3, 145-169.
Roberts, V. (2003a). Overcoming barriers to access and success in tertiary education in
the Commonwealth Caribbean. International Studies in Educational
Administration, 31(3), 2-15.
Roberts, V. (2003b). The shaping of tertiary education in the Anglophone Caribbean:
Forces, forms and functions. London, UK: Commonwealth Secretariat.
Robotham, D. (2000). Changing a university: Reconciling quantity with quality- the case
of the University of the West Indies. In G. D. Howe (Ed.), Higher education in
the Caribbean: Past, present and future directions (pp. 237-250). Kingston,
Jamaica: The University of the West Indies.
Roksa, J., & Calcagno, J. C. (2008). Making the transition to four-year institutions:
Academic preparation and transfer (CCRS Working Paper No. 13). Columbia
University, NY: Community College Research Center. Retrieved from ERIC database.
(ED501683)
143
Scheuren, F. (2004, June). What is a survey? American Statistical Association (ASA).
Retrieved from http://www.whatisasurvey.info/downloads/pamphlet_current.pdf
Spector, P. E. (1992). Summated rating scale construction: An introduction. Newbury Park, CA:
Sage.
Spitzer, T. M. (2000). Predictors of college success: A comparison of traditional and
nontraditional age students. National Association of Student Personnel
Administrators, 38, 82-98.
Statistical Institute of Jamaica (STATIN). (n.d.a.). Population by parish 2010. Retrieved from
website: http://www.statinja.gov.jm/populationbyparish.aspx
Statistical Institute of Jamaica (STATIN). (n.d.b.). Labour market and earnings: Labour force.
Retrieved from website: http://statinja.gov.jm/LabourForceMainIndicators.aspx
Stennett, N. (2005). The need for an integrated tertiary education system: A community college
perspective. In R. Holding & O. Burke (Eds.), Revisiting tertiary education policy in
Jamaica: Towards personal gain or public good? (pp. 331-341). Kingston, Jamaica:
Ian Randle.
Stewart, M. A. (2006). An evaluation of the fitness for purpose of the Associate Degree in
Business Studies offered by Jamaican community colleges. (Doctoral dissertation,
University of the West Indies, Kingston, Jamaica).
Swigart, T. E., & Murrell, P. H. (2001). Factors influencing estimates of gains made among
African-American and Caucasian community college students. Community College
Journal of Research and Practice, 25, 297-312. doi:10.1080/106689201750122406
Tanaka, G. (2002). Higher education‘s self-reflexive turn. The Journal of Higher Education, 73,
263-296. doi:10.1353/jhe.2002.0024
144
Taylor-Stone, L. (2008, May). Case studies of public-private partnerships for education and
workforce development. The case of Jamaica: HEART Trust-NTA. Prepared for the
Organization of American States (OAS). Retrieved from
http://www.sedi.oas.org/dttc/comp/docs/JamaicaCase.pdf
Terenzini, P. T., Springer, L., Yaeger, P. M., Pascarella, E. T., & Nora, A. (1996). First-
generation college students: Characteristics, experiences, and cognitive development.
Research in Higher Education, 37, 1-21. doi:10.1007/BF01680039
Thomas, S. L. (2000). The ties that bind: A social network approach to understanding student
integration and persistence. The Journal of Higher Education, 71, 591- 615.
doi:10.2307/2649261
Tinto, V. (1975). Dropout from higher education: A theoretical synthesis of recent research.
Review of Educational Research, 45, 89-125. doi:10.2307/1170024
Tinto, V. (1982). Limits of theory and practice in student attrition. The Journal of Higher
Education, 53, 687-700. doi:10.2307/1981525
Tinto, V. (1986). Theories of student departure revisited. In J. Smart (Ed.), Higher Education:
Handbook of Theory and Research, 2 (pp. 359-384). New York, NY: Agathon.
Tinto, V. (1987). Leaving college: Rethinking the causes and cures of student attrition.
Chicago, IL: University of Chicago Press.
Tinto, V. (1993). Leaving college: Rethinking the causes and cures of student attrition (2nd ed.).
Chicago, IL: University of Chicago Press.
Tinto, V. (1998). Colleges as communities: Taking research on student persistence seriously.
The Review of Higher Education, 21, 167-177.
145
Tollefson, T. A. (2009). Community college governance, funding, and accountability: A
century of issues and trends. Community College Journal of Research and Practice, 33,
386–402. doi:10.1080/10668920802580481
Townsend, B. K., & Twombly, S. B. (Eds.). (2001). Community colleges: Policy in the future
context. Westport, CT: Ablex.
Townsend, B. K., & Wilson, K. B. (2006). A hand hold for a little bit: Factors facilitating
the success of community college transfer students to a large research university.
Journal of College Student Development, 47, 439-456. doi:10.1353/csd.2006.0052
United Nations Educational, Scientific and Cultural Organization (UNESCO-UIS).
(2009). UIS statistics in brief: Education in Latin America and the Caribbean. Tertiary
enrollment. Retrieved from website: http://www.uis.unesco.org/Pages/default.aspx
University Council of Jamaica (UCJ). (n.d.a.). List of accredited programs as at August 2009.
Retrieved from http://www.ucj.org.jm/accreditation.htm
University Council of Jamaica (UCJ). (n.d.b.). The accreditation process. Retrieved from
http://www.ucj.org.jm/accreditation.htm
University of the West Indies (UWI) Research and Policy Group. (2005). Proposal for a national
postsecondary education system for Jamaica. Kingston, Jamaica: Mona School of
Business.
Veltri, S., Banning, J. H., & Gray Davies, T. (2006). The community college classroom
environment: Student perceptions. College Student Journal, 40, 517-527.
Walsh, J. (2005). The community college sector: Context, challenges, imperatives, options. In
R. Holding & O. Burke (Eds.), Revisiting tertiary education policy in Jamaica: Towards
personal gain or public good? (pp. 220-236). Kingston, Jamaica: Ian Randle.

146
Webb, M. (1989). A theoretical model of community college student degree persistence.
Community College Review, 16, 42-49. doi:10.1177/009155218901600406
Whyte, M. (1983). A short history of education in Jamaica (2nd ed.). London, UK:
Hodder and Stoughton.
Wolff, L. (2009). Challenges and opportunities for postsecondary education and training
in Barbados, Bahamas, Guyana, Jamaica, and Trinidad & Tobago. In R. L. Raby
& E. J. Valeau (Eds.), Community college models: Globalization and higher
education reform (pp. 173-195). Dordrecht, The Netherlands: Springer.
doi:10.1007/978-1-4020-9477-4_11
World Bank. (2005). A time to choose: Caribbean development in the 21st century
(Report No. 31725-LAC). Caribbean Country Management Unit : Poverty Reduction
http://siteresources.worldbank.org/LACEXT/Resurces/317250LAC.pdf
World Economic Forum (2009). The global competitiveness report 2009-2010 (Geneva,
Switzerland). Retrieved from
http://www.weforum.org/pdf/GCR09/GCR20092010fullreport.pdf
World Economic Forum. (2010). The global competitiveness report 2010-2011 (Geneva,
Switzerland). Retrieved from
http://www3.weforum.org/docs/WEF_GlobalCompetitivenessReport_2010-11.pdf

147
APPENDICES

148
Appendix A
Map: Jamaica Community Colleges

149
Map of Jamaica Showing Community Colleges
Key:
College A - Kingston and Saint Andrew; Saint Thomas
College B - Saint Catherine
College C- Saint James
College D – Saint Ann and Saint Mary
College E – Manchester and Clarendon
College F – Saint Ann
College G – Saint Elizabeth
College H - Portland
College C
College D
College D
College E
College E
College F
College G
College H
College A
College A
College B

150
Appendix B
IRB Approvals

151
IRB Approval - Pilot Study
KIMBERLY C Fowler
Actions
To:
Jay W Rojewski
Cc: Dawn Vivienne Smith-henry
Inbox
Tuesday, August 03, 2010 9:49 AM PROJECT NUMBER: 2011-10017-0
TITLE OF STUDY: Perceived Readiness of Jamaican Community College Students for Post-College
Goals PRINCIPAL INVESTIGATOR: Dr. Jay W. Rojewski
Dear Dr. Rojewski,
The University of Georgia Institutional Review Board (IRB) has reviewed and approved your above-titled
proposal through the exempt (administrative) review procedure authorized by 45 CFR 46.101(b)(2) -
Research involving the use of educational tests (cognitive, diagnostic, aptitude, achievement), survey procedures, interview procedures or observation of public behavior, /unless:/(i). the information obtained
is recorded in such a manner that human participants can be identified, directly or through identifiers
linked to the participants; /and/(ii). any disclosure of the human participants' responses outside the research could reasonably place the participants at risk of criminal or civil liability or be damaging to the
participants' financial standing, employability, or reputation.
Your approval packet will be sent by mail. Please remember that any changes to this research proposal can only be initiated after review and approval by the IRB (except when necessary to eliminate apparent
immediate hazards to the research participant). Any adverse events or unanticipated problems must be
reported to the IRB immediately. The principal investigator is also responsible for maintaining all applicable protocol records (regardless of media type) for at least three (3) years after completion of the
study (i.e., copy of approved protocol, raw data, amendments, correspondence, and other pertinent
documents). You are requested to notify the Human Subjects Office if your study is completed or
terminated.
Good luck with your study, and please feel free to contact us if you have any questions. Please use the
IRB number and title in all communications regarding this study.
Regards,
Kim Fowler, CIP
Human Subjects Office
627A Boyd Graduate Studies Research Center
University of Georgia Athens, GA 30602-7411
Telephone: 706-542-5318 Fax: 706-542-3360
https://www.ovpr.uga.edu/compliance/hso/

152
IRB Approval - Amendment – Rojewski and Smith-Henry-Final Study
PROJECT NUMBER: 2011-10017-1
TITLE OF STUDY: Perceived Readiness of Jamaican Community College Students for Post-College Goals
PRINCIPAL INVESTIGATOR: Dr. Jay W. Rojewski
Dear Dr. Rojewski,
The University of Georgia Institutional Review Board (IRB) has reviewed and approved your request for modifications to the above-titled human subjects proposal. It was determined that the amendment request
continues to meet the criteria for exempt (administrative) review procedures.
Your approval packet will be sent via campus mail. Please remember that any changes to this research
proposal can only be initiated after review and approval by the IRB (except when necessary to eliminate
apparent immediate hazards to the research participant). Any adverse events or unanticipated problems must be reported to the IRB immediately. The principal investigator is also responsible for maintaining
all applicable protocol records (regardless of media type) for at least three (3) years after completion of
the study (i.e., copy of approved protocol, raw data, amendments, correspondence, and other pertinent documents). You are requested to notify the Human Subjects Office if your study is completed or
terminated.
Good luck with your study, and please feel free to contact us if you have any questions. Please use the IRB number and title in all communications regarding this study.
Regards,
Kim Fowler, CIP
Human Subjects Office
627A Boyd Graduate Studies Research Center
University of Georgia
Athens, GA 30602-7411
Telephone: 706-542-5318
Fax: 706-542-3360
http://www.ovpr.uga.edu/hso/
153
Appendix C
Letter of Requests to Administer Survey
Permission to Administer Survey

154
Letter to CCCJ Executive Director
May 11, 2010
Address of Executive Director
Dear Sir:
Permission to Conduct Dissertation Study
I am writing as follow-up to discussions with the previous Executive Director in 2009 concerning my
dissertation study. My purpose in writing is to inform you about my dissertation study and to seek the
Council‘s assistance in completing the study.
The dissertation study, entitled Perceived Readiness of Jamaican Community College Students for Post College Goals, is being conducted under the direction of Dr. Jay W. Rojewski in the Program of Workforce
Education at the University of Georgia. The purpose of the study is to examine students‘ perceptions of their
readiness for immediate goals after the community college experience. More specifically, the study seeks to
investigate the extent to which involvement in class and college activities combined with students‘ personal
and situational characteristics explain perceived readiness for higher education and employment goals. The
study will contribute to existing literature, and findings may inform on-going CCCJ institutional and program
accreditation processes, and influence policy and practice.
In order to meet the objectives of this study, I am requesting permission to conduct a pilot study with 30-50
students in late May or early June, and then to administer the full survey from mid- to late September or early
October. I would like to survey final-year students enrolled full- and part-time in CCCJ associate and
bachelors‘ degrees at all eight community colleges. I will therefore need your assistance to identify students
enrolled in these programs across the eight colleges.
The survey is anonymous and there are no known risks or discomforts associated with the research (see survey
prototype). A few days before administering the full survey I would need to distribute a letter describing the
study to the students. A copy of this letter is also attached. The actual survey administration at each college
would include the following: a brief introduction to the survey, distributing it to students, allowing them
enough time to complete it, and then collecting it. Completing the survey should take approximately 10
minutes and students will be informed that participation is voluntary. Consequently, they may choose not to
participate or may stop at any time.
I will be happy to answer any questions about the study. Please feel free to call me at 706-389-6019 or send an
email to [email protected] or [email protected]. You may also contact my faculty advisor, Dr. Rojewski,
at 706-542-4461 or [email protected] if you have questions or concerns. If you agree to allow me to conduct
the study with your students, please sign and have each community college principal/president sign the
attached letter of authorization. Please return to me by mail using the attached self-addressed envelope by May
10.
I anticipate a favorable response and thank you for your consideration.
Sincerely,
Dawn Smith-Henry
Graduate Student
University of Georgia
Attachments

155
Letter to College Principals/Presidents
October 22, 2010
Dear Principal/President
Permission to Conduct Research: November 15-30, 2010
You may recall our telephone conversation in June, when I informed you that the CCCJ Executive Office has
granted me permission to survey students across the community college network (see attachments).
Consequently, this letter is a reminder and also a formal request for permission to survey CCCJ students at
your College, during the period November 15-30, 2010. I have also contacted other administrative personnel at
your College and am still awaiting CCCJ enrollment statistics.
As I indicated in our earlier communication, this survey is part of my dissertation study: Perceived Readiness
of Jamaican Community College Students for Post College Goals. The study is being conducted under the
direction of Dr. Jay W. Rojewski, Professor in the Program of Workforce Education at the University of
Georgia. The purpose of the study is to examine students‘ perceptions of their readiness for immediate goals
after the community college experience. More specifically, the study seeks to investigate the extent to which
involvement in class and college activities combined with students‘ personal and situational characteristics
may explain perceived readiness for higher education and employment goals. It is hoped that findings from the
study may inform on-going CCCJ institutional and program accreditation processes.
The survey will be conducted via direct classroom administration, according to procedures and protocol
approved by the Institutional Review Board at the University of Georgia. This means that student
confidentiality and anonymity will be maintained. Moreover, students should require no more than 10-15
minutes to complete the questionnaire. If possible, I would prefer to administer the questionnaire during the
first 15 minutes of the class period.
To ensure that the survey process is smooth and to minimize disruption of regular class schedules, I would like
to receive the following as soon as possible:
1. Confirmation of suitable dates to visit your college (during the prescribed period)
2. Class schedules and enrollment data for CCCJ students, specifically for full- and part-time
final-year students at your main and subsidiary campuses (even if data is incomplete).
You may contact me via email at [email protected] or by telephone at 706-351-7279. After November 10,
2010, you may contact me via email or by telephone: 876-939-0445 (Home) or 876-859-4185 (Cell).
I anticipate a favorable and timely response and look forward to visiting your College.
Sincerely,
Dawn Smith-Henry
Doctoral Candidate
University of Georgia
Attachments
156
157
Permission to Survey CCCJ Students – Extended Deadline
URGENT Wednesday, October 20, 2010 8:53 AM
From: "Cebert Adamson" <[email protected]>
Dear Dawn,
The Council of Community Colleges of Jamaica (CCCJ) gives permission to Dawn Smith-
Henry, under the guidance of Dr. Jay Rojewski of the University of Georgia, Department of
Workforce Education, Leadership and Social Foundations, to survey students across the
community college network, as part of research for a dissertation study, entitled: Perceived
Readiness of Jamaican Community College Students for Post-College Goals.
The research will be conducted from November-December, 2010.
--
Cebert Adamson
Executive Director
The Council of Community Colleges of Jamaica
Telephone: (876) 704-0111 (to 4)
Fax: (876) 704-0110
Website: http://cccj.edu.jm/
158
Appendix D
Research Information Sheet for Participants
Administration Script

159
PERCEIVED READINESS OF JAMAICAN COMMUNITY COLLEGE STUDENTS
FOR POST-COLLEGE GOALS
Research Information Sheet for Participants
We are currently conducting a study on the extent to which student involvement at the community college
impacts readiness for goals after the community college experience. The study is entitled, ―Perceived
Readiness of Jamaican Community College Students for Post-College Goals‖. We need your help to better
understand the nature of student involvement at Jamaican community colleges and how this involvement may
affect readiness for work or higher education studies. The study is being conducted by Dawn Smith-Henry, a
doctoral student from the Department of Workforce Education at The University of Georgia, under the
guidance of Dr. Jay Rojewski, Professor of Workforce Education. The information you provide will be used in
a dissertation prepared by Dawn Smith-Henry and supervised by Dr. Jay Rojewski.
However, your participation in this study is strictly voluntary. You can refuse to take part or stop taking part
at any time without penalty or loss of benefits to which you are otherwise entitled. Your grades or class
standing will not be affected by your decision to participate or not to participate in this research study. If you
choose not to participate in the study, please place a blank questionnaire inside the envelope.
We hope you will choose to participate in this important study. Participants must be 18 years of age or older
and must be in the final year of their programmes. There are no direct benefits to study participants. However,
results of the study may be useful to Jamaican community college educators and administrators who are
engaged in institutional self-study and programme accreditation processes. Findings may also challenge
Jamaican educators to more vigorously pursue and/or strengthen staff professional development efforts and
collaborative arrangements with higher education institutions and with industry. The study is also expected to
enhance existing scholarly research.
Please note that participation is completely confidential. To protect your confidentiality and option to not
participate, only you will handle the questionnaire after it is distributed. You will be asked to place your own
questionnaire into a large envelope at the front of the room. The teacher of this course will never see your
completed questionnaire and the researchers will not be able to identify individual respondents. When we
publish our findings, the report will be based on groups and not on individuals.
If you choose to participate, you will be asked to complete a questionnaire. Most people will be able to
complete the questionnaire in less than 15 minutes. There is no right or wrong answer and we do not foresee
this study causing you any harm or discomfort. However, if you are uncomfortable about completing the
questionnaire, simply return a blank questionnaire.
Study participants will be given candy and/or simple tokens such as key rings, book markers and colored pens
as incentives.
If you have any questions about this research, please contact Dawn Smith-Henry at email address
[email protected] or telephone number 706-389-6019; or Dr. Jay Rojewski via email address
[email protected] or telephone number 706-542-4461. The Department‘s mailing address is Workforce
Education, Leadership, & Social Foundations, 221 River‘s Crossing, The University of Georgia, Athens, GA
30602 (telephone number 706-542-1682). For questions or concerns that may arise during this study, please
write to: Human Subjects Office, The University of Georgia, 612 Boyd Graduate Studies Research Center,
Athens, GA 30602-7411. You may also contact them via email at [email protected] or call 706-542-3199.
Please note: Completion and return of this questionnaire implies that you have read this information and
consent to participate in the research.
THANK YOU FOR PARTICIPATING IN THIS IMPORTANT RESEARCH!

160
THE STUDENT INVOLVEMENT QUESTIONNAIRE
Administration Script
1. The researcher will enter the classroom at a pre-determined time that was scheduled with
input of the class instructor and approved by the program coordinator.
2. The researcher will introduce herself to the students.
3. The researcher will explain her presence in the classroom and the purpose of the study.
4. The researcher will distribute the Research Information Sheet to each student and give
students enough time to read it.
5. The researcher will review the following points discussed in the Research Information
Sheet: (a) participation is strictly voluntary, so participants may return a blank
questionnaire if they choose not to participate and (b) identities and participation are
completely confidential.
6. The researcher will place a large envelope in a visible and neutral location in the
classroom for collection of the questionnaires. Participants will be instructed to place
completed questionnaires inside the envelope.
7. The researcher will distribute questionnaires to students and emphasize the following: (a)
each questionnaire consists of five pages comprising five sections, (b) sections 1-3 and
section 5 should be completed by all participants, and (c) section 4 should only be
completed by those who intend to pursue higher education studies after completing
current studies at the community college.
8. The researcher will inform participants that she will remain in the classroom to answer
any questions or address any concerns that might arise. She will ask participants not to
consult with each other as they complete the questionnaire.
9. For the pilot study, time taken to complete the questionnaire will be recorded and student
feedback on the clarity of items and instructions will be obtained after the survey is
completed.
10. The researcher will express appreciation to participants by handing out simple tokens.
11. The researcher will collect the envelope, seal it and exit the classroom.

161
Appendix E
Phone Call Script
Follow-Up Phone Call Script

162
PILOT AND FINAL STUDY PHONE CALL SCRIPT
FOR PROGRAM COORDINATORS AND CLASS INSTRUCTORS
Researcher: Hello, my name is Dawn Smith-Henry and I am a graduate student at the University
of Georgia. I am currently conducting a dissertation study under the guidance of Dr.
Jay Rojewski, Professor of Workforce Education at the University of Georgia.
The title of the study is: ―Perceived Readiness of Jamaican Community College
Students for Post-College Goals‖. We are seeking the help of your students to better
understand the nature of student involvement in Jamaican community colleges, and
how this involvement may affect readiness for work or higher education studies.
I have a letter granting permission to survey your students. However, I would
like to emphasize that student participation in the study is voluntary. If the students
choose to participate, they will be required to complete a questionnaire that should
take no more than 10-15 minutes to complete. Before the questionnaire is
distributed, each student will be given a Research Information sheet to read. The
Information sheet will explain that participation is voluntary, that identities and
responses will be treated with the strictest confidence, and that completion and
return of the questionnaire implies that they have read the information and agree to
participate in the research. There are no known risks to students from participating
in the study.
We propose to administer the survey to students in their respective classrooms.
Consequently, I am seeking permission to meet with you at a mutually convenient
time in order to discuss class schedules, and to arrange a date and time for meeting
your students. I will also be available to address any further questions or concerns
related to the study.
I do appreciate your willingness to facilitate this important research.
I am hopeful that findings from the study will benefit the Jamaican community
college sector. For my part, I will make every effort to administer the survey
as efficiently as possible so that disruption of classroom instruction will be
minimized.
I look forward to meeting with you. Thank you!

163
FOLLOW-UP PHONE CALL SCRIPT
FOR PROGRAM COORDINATORS AND/OR CLASS INSTRUCTORS
Hello, my name is Dawn Smith-Henry and I am a graduate student at the University of Georgia.
You may recall that I recently administered a questionnaire to your students, as part of my
dissertation study into student involvement and perceived readiness for goals after the Jamaican
community college experience.
Thanks for allowing me to survey students during regular class time. I hope my presence did not
create too much of a distraction and that you were able to make up for time lost because you
facilitated me.
Unfortunately, a few groups have still not been surveyed. I am therefore requesting permission to
again meet with you in order to discuss class schedules for these groups and to arrange dates and
times for meeting with students.
As before, I would like to conduct the survey via direct classroom administration and I promise
to honor the confidence and trust placed in me. All procedures previously followed to ensure
participant privacy and confidentiality will be adhered to in this second administration.
Once again, I will endeavor to conduct the survey as quickly and efficiently as possible. Please
accept my sincerest thanks for the vital role you are playing in accommodating this important
research.

164
Appendix F
Survey Instrument

165
Student Involvement Questionnaire
Students in Jamaica’s community colleges vary considerably with respect to how they approach their college experience. Some are very involved in activities while others are not. Some plan to go right into the workforce, while others plan to continue their education.
This survey is designed to help college educators better understand their students. Your anonymous and frank responses will provide useful information for programme planning and improvement. There are no right or wrong answers. Please take a few minutes to respond to the following questions.
The Questionnaire has six (6) sections. All participants are asked to complete Sections 1-3 and Sections 5 and 6. Please complete Section 4 if you intend to pursue higher education studies after completing studies at the community college.
Section I. Involvement in Classes and Course-Related Activities
This Section asks you to assess the extent of your involvement, and how much effort you put into a variety of course-related activities during your entire time at this college.
To what extent do you agree with each of the following statements?
Please circle one choice for each item
1. I actively participated in general class discussions
strongly disagree disagree agree Strongly agree
2. I actively participated in group- assigned course work
strongly disagree disagree agree Strongly agree
3. I put a lot of effort into writing an essay or term paper
strongly disagree disagree agree Strongly agree
4. I put a lot of effort into doing research for class assignments
strongly disagree disagree agree Strongly agree
5. I put a lot of effort into studying for a test or final exam
strongly disagree disagree agree Strongly agree
6. I regularly used concepts learned in class to complete assignments
strongly disagree disagree
agree Strongly agree
7. I regularly met deadlines for submitting course assignments
strongly disagree disagree
agree Strongly agree
8. I frequently discussed class topics with peers outside of the classroom
strongly disagree disagree
agree Strongly agree
9. I discussed class content with instructors outside of class
strongly disagree disagree
agree
Strongly agree
10.I discussed my academic progress with an instructor or course advisor
strongly disagree disagree
agree
Strongly agree
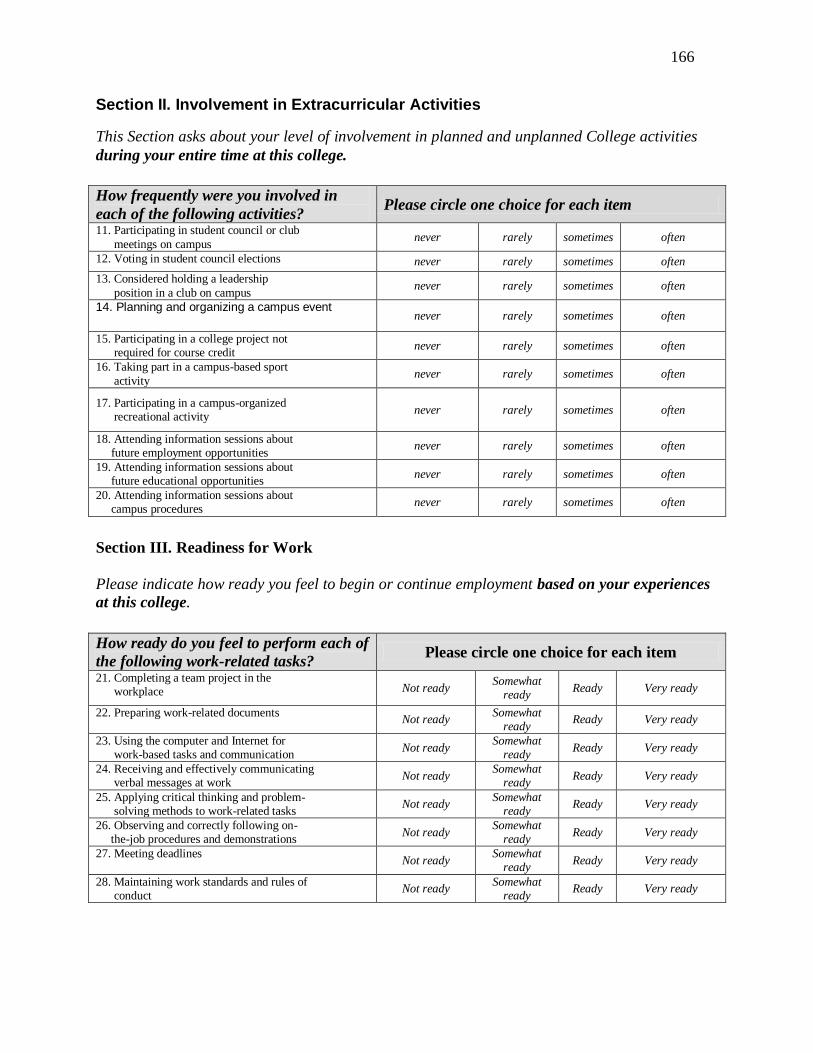
166
Section II. Involvement in Extracurricular Activities
This Section asks about your level of involvement in planned and unplanned College activities
during your entire time at this college.
How frequently were you involved in
each of the following activities? Please circle one choice for each item
11. Participating in student council or club
meetings on campus never rarely sometimes often
12. Voting in student council elections never rarely sometimes often
13. Considered holding a leadership
position in a club on campus never rarely sometimes often
14. Planning and organizing a campus event never rarely sometimes often
15. Participating in a college project not required for course credit
never rarely sometimes often
16. Taking part in a campus-based sport
activity never rarely sometimes often
17. Participating in a campus-organized recreational activity
never rarely sometimes often
18. Attending information sessions about future employment opportunities
never rarely sometimes often
19. Attending information sessions about future educational opportunities
never rarely sometimes often
20. Attending information sessions about campus procedures
never rarely sometimes often
Section III. Readiness for Work
Please indicate how ready you feel to begin or continue employment based on your experiences
at this college.
How ready do you feel to perform each of
the following work-related tasks? Please circle one choice for each item
21. Completing a team project in the workplace Not ready
Somewhat ready
Ready Very ready
22. Preparing work-related documents Not ready
Somewhat ready
Ready Very ready
23. Using the computer and Internet for work-based tasks and communication
Not ready Somewhat
ready Ready Very ready
24. Receiving and effectively communicating verbal messages at work
Not ready Somewhat
ready Ready Very ready
25. Applying critical thinking and problem- solving methods to work-related tasks
Not ready Somewhat
ready Ready Very ready
26. Observing and correctly following on- the-job procedures and demonstrations
Not ready Somewhat
ready Ready Very ready
27. Meeting deadlines Not ready
Somewhat ready
Ready Very ready
28. Maintaining work standards and rules of conduct
Not ready Somewhat
ready Ready Very ready

167
Section IV. Readiness for Higher Education Studies
Please complete this Section IF YOU PLAN TO PURSUE HIGHER EDUCATION STUDIES
after the community college.
How ready do you feel to perform each
of the following tasks at college? Please circle one choice for each item
29. Using different sources to locate information for class assignments
Not ready Somewhat
ready Ready Very ready
30. Reading and making sense of new course materials at college
Not ready Somewhat
ready Ready Very ready
31. Writing effective essays Not ready
Somewhat ready
Ready Very ready
32. Making strong oral arguments and presentations
Not ready Somewhat
ready Ready Very ready
33. Submitting assignments on time Not ready
Somewhat ready
Ready Very ready
34. Studying for a class test or final exam Not ready
Somewhat ready
Ready Very ready
35. Working as part of a team to complete group assignments
Not ready Somewhat
ready Ready Very ready
Section V. Satisfaction with College (PLEASE ANSWER THIS SECTION)
Please rate your level of satisfaction with the college you are currently attending
To what extent do you agree with each of
the following statements?
Please circle one choice for each item
36. I am satisfied with student services at this college
strongly disagree
disagree agree Strongly agree
37. I am pleased with facilities at this college strongly
disagree disagree agree Strongly agree
38. This college is an exciting place to be strongly
disagree disagree agree Strongly agree
39. Overall, my experiences at this college
have been very satisfactory
strongly
disagree disagree agree Strongly agree
Section VI. General Information (PLEASE ANSWER THIS SECTION)
40. Are you taking classes full-time or part-time at this college? (Check one)
Full-time (15 or more course credits each semester)
Part-time
41. What is your programme major? ___________________________________________
Please answer each of the following questions. Write your response in the space provided or
check (√) the box that represents your choice. Remember, no attempt will be made to identify
you.
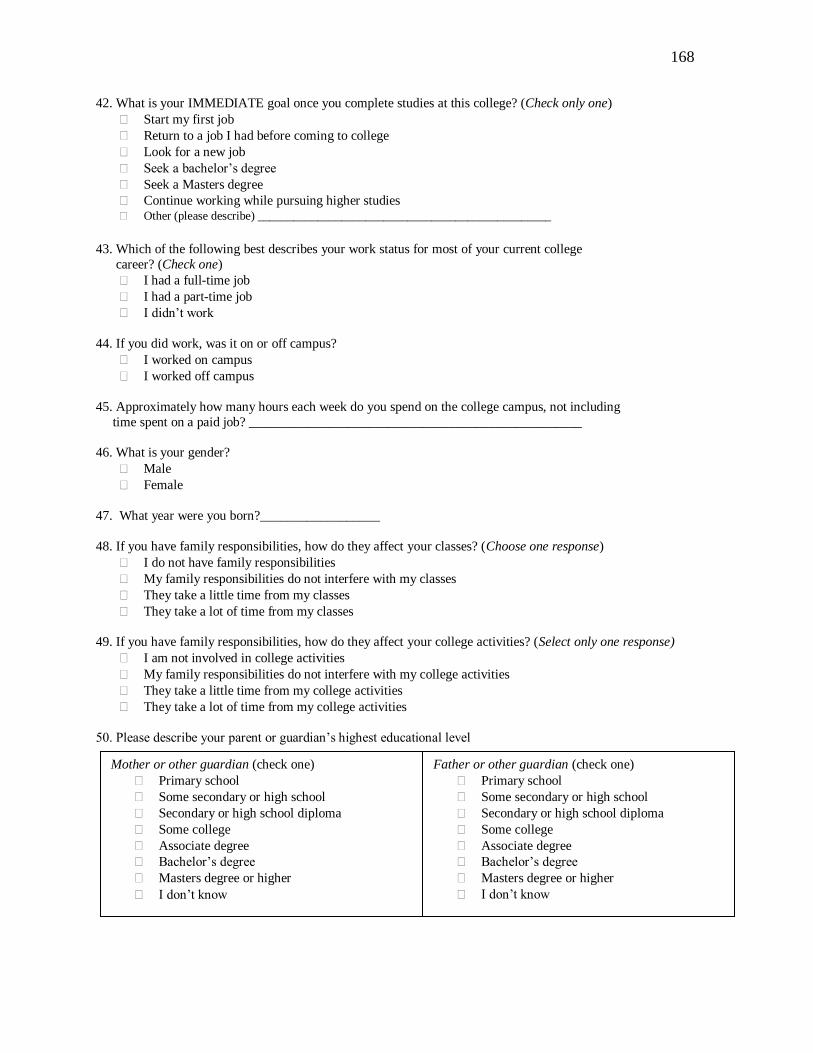
168
42. What is your IMMEDIATE goal once you complete studies at this college? (Check only one)
Start my first job
Return to a job I had before coming to college
Look for a new job
Seek a bachelor‘s degree
Seek a Masters degree
Continue working while pursuing higher studies Other (please describe) _________________________________________________
43. Which of the following best describes your work status for most of your current college
career? (Check one)
I had a full-time job
I had a part-time job
I didn‘t work
44. If you did work, was it on or off campus?
I worked on campus
I worked off campus
45. Approximately how many hours each week do you spend on the college campus, not including
time spent on a paid job? __________________________________________________
46. What is your gender?
Male
Female
47. What year were you born?__________________
48. If you have family responsibilities, how do they affect your classes? (Choose one response)
I do not have family responsibilities
My family responsibilities do not interfere with my classes
They take a little time from my classes
They take a lot of time from my classes
49. If you have family responsibilities, how do they affect your college activities? (Select only one response)
I am not involved in college activities
My family responsibilities do not interfere with my college activities
They take a little time from my college activities
They take a lot of time from my college activities
50. Please describe your parent or guardian‘s highest educational level
Mother or other guardian (check one)
Primary school
Some secondary or high school
Secondary or high school diploma
Some college
Associate degree
Bachelor‘s degree
Masters degree or higher
I don‘t know
Father or other guardian (check one)
Primary school
Some secondary or high school
Secondary or high school diploma
Some college
Associate degree
Bachelor‘s degree
Masters degree or higher
I don‘t know

169
51. Would you like to share anything else about your experiences at this college?
THANK YOU FOR SHARING YOUR VIEWS!
THANK YOU FOR SHARING YOUR VIEWS!

170
Appendix G
Pilot Study Report

171
Memorandum
To: Jay Rojewski, Committee Chair
Thomas Valentine, Methodologist
Bettye P. Smith
Myra N. Womble
From: Dawn Smith-Henry
Date: October 19, 2010
Subject: Results of Pilot Survey
A. Administration Procedures
After receiving initial approval from the Institutional Review Board (IRB) the first week
of August 2010, I administered the pilot survey to 61 students at one of eight
Jamaican community colleges that will be included in the final study. However,
participants in the pilot survey will not be part of the final study. Survey participants
comprised three groups of students with similar demographics—age, gender, full- and
part-time enrollment status, and major—to the population for the final study. Thus, the
sample included final-year students enrolled full- and part-time in associate and
bachelors‘ degree programs at this college. The survey was conducted via direct
classroom administration and according to procedures and protocol approved by the IRB
for the pilot and final study.
B. Data Collection Procedures
In administering the survey, I adhered to instructions contained in the Administration
script and the Research Information Sheet (Attachment C). For example, I placed a large
envelope in a visible and neutral location in each classroom and instructed participants to
place completed questionnaires and/or returned blanks inside the envelope. On the whole,
participants appeared quite willing to complete the questionnaires and they complied with
my request to place the questionnaires inside the envelope. On average, participants took
approximately 10 minutes to complete the survey. No blanks were returned, but several
questionnaires had unanswered items. After completing the survey, participants provided
feedback on the clarity of instructions and items, general appearance, and length of the
instrument. On the whole, I was pleased with the success of the pilot administration and
data collection process.
C. Analysis of Pilot Data
Guided by my methodologist, I analyzed the pilot survey data to examine the following:
Item distribution

172
Reliability of the scales
Measurement sensitivity
i. Item Distribution
Of the 35 items comprising four scales—Involvement in Classes and Course-Related
Activities, Involvement in Extracurricular Activities, Readiness for Work, and
Readiness for Higher Education Studies—all but 4 items demonstrated adequate
variance on the 4-point Likert response scale. So, although some skewness was
exhibited, we determined that variance was satisfactory for 31 items. The four items
that showed restricted variance came from the Involvement in Classes (IC) and
Perceived Readiness for Higher Education (PRH) scales. The items were: (a) item 2
(ic2): I participated in group-assigned course activities, (b) item 6 (ic6): I effectively
used concepts and methods learned in class to answer new class assignments, (c)
item 33 (rh33): Submitting assignments on time, and (d) item 34 (rh34): Studying for
a class test or final exam. For ic2, no one either strongly disagreed (response one) or
disagreed (response two) with the statement; instead, 72% expressed strong
agreement. On the other hand, although no one expressed strong disagreement, there
was a wider range of responses to ic6, rh33, and rh34.
Table 1 summarizes survey participants‘ use of the response range for the four
identified items.
Item # Response Range Frequency Percent Using Range
ic2
3 17 28
4 44 72
Total 61 100
ic6
2 5 8
3 36 60
4 19 32
Total 60 100
Missing 1
rh33
2 6 11
3 24 44
4 25 45
Total 55 100
Missing 6
rh34
2 10 18
3 23 42
4 22 40
Total 55 100
Missing 6
Table 1: Response range for identified items
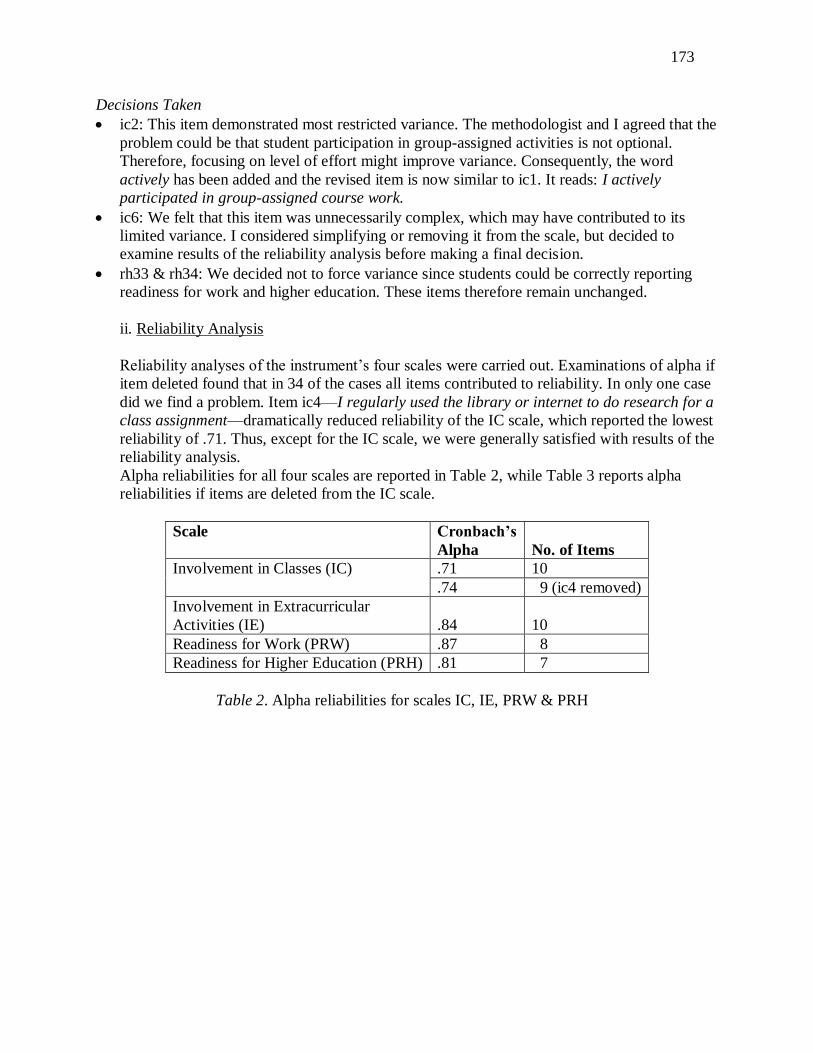
173
Decisions Taken
ic2: This item demonstrated most restricted variance. The methodologist and I agreed that the
problem could be that student participation in group-assigned activities is not optional.
Therefore, focusing on level of effort might improve variance. Consequently, the word
actively has been added and the revised item is now similar to ic1. It reads: I actively
participated in group-assigned course work.
ic6: We felt that this item was unnecessarily complex, which may have contributed to its
limited variance. I considered simplifying or removing it from the scale, but decided to
examine results of the reliability analysis before making a final decision.
rh33 & rh34: We decided not to force variance since students could be correctly reporting
readiness for work and higher education. These items therefore remain unchanged.
ii. Reliability Analysis
Reliability analyses of the instrument‘s four scales were carried out. Examinations of alpha if
item deleted found that in 34 of the cases all items contributed to reliability. In only one case
did we find a problem. Item ic4—I regularly used the library or internet to do research for a
class assignment—dramatically reduced reliability of the IC scale, which reported the lowest
reliability of .71. Thus, except for the IC scale, we were generally satisfied with results of the
reliability analysis.
Alpha reliabilities for all four scales are reported in Table 2, while Table 3 reports alpha
reliabilities if items are deleted from the IC scale.
Scale Cronbach’s
Alpha
No. of Items
Involvement in Classes (IC) .71 10
.74 9 (ic4 removed)
Involvement in Extracurricular
Activities (IE)
.84
10
Readiness for Work (PRW) .87 8
Readiness for Higher Education (PRH) .81 7
Table 2. Alpha reliabilities for scales IC, IE, PRW & PRH

174
Table 3. Alpha if item deleted for IC scale
As Table 3 illustrates, all items except ic4 contributed to reliability of the IC scale. Elimination
of ic4 increased alpha reliability to .74.
Decisions Taken
ic4: Upon closer examination and based on survey participant feedback, we identified this as
a double item—ambiguous in that it combined two ideas in one question. Ultimately, I
decided the issue was more one of effort; so, instead of eliminating the item, I decided to
refocus it to read: I put a lot of effort into doing research for class assignments.
ic6: Despite showing poor variance, this item contributed to the overall reliability of the IC
scale. Hence, it will not be removed, but will be recast as follows:
I regularly used concepts learned in class to complete assignments.
iii. Measurement Sensitivity
Scale distributions, inter-correlations and frequencies were examined to determine how well
the instrument captured variance in the pilot population.
Scales: Correlations computed for the four scales—IC, IE, PRW, and PRH--revealed
that, for the small pilot data, persons who were very involved in class activities felt ready
for work and for higher education studies. In other words, class involvement predicted
readiness both for work and for higher education studies. Conversely, extracurricular
involvement did not predict readiness for work or for higher education. As explained
previously, a few scale items demonstrated limited variance. Yet, the pilot
instrument documented variance among all items. From these findings we concluded
that the instrument‘s four scales are appropriate for the constructs being studied. Pearson
correlations for the four scales are summarized in Table 4.
Items Cronbach’s
Alpha if Item
Deleted
ic1 .68
ic2 .68
ic3 .71
ic4 .74
ic5 .67
ic6 .69
ic7 .71
ic8 .68
ic9 .66
ic10 .67

175
IC total IE total PRW total PRH total
IC total
Sig. (2-tailed)
N
60
.215
59
.001
59
.000
54
IE total
Sig (2-tailed)
N
.215
59
60
.527
59
.860
54
PRW total
Sig (2-tailed)
N
.001
59
.527
59
60
.003
54
PRH total
Sig (2-tailed)
N
.000
54
.860
54
.003
54
55
Table 4. Pearson correlations for scales IC, IE, PRW & PRH
The histograms in Figure 1 illustrate frequency distributions for the four scales
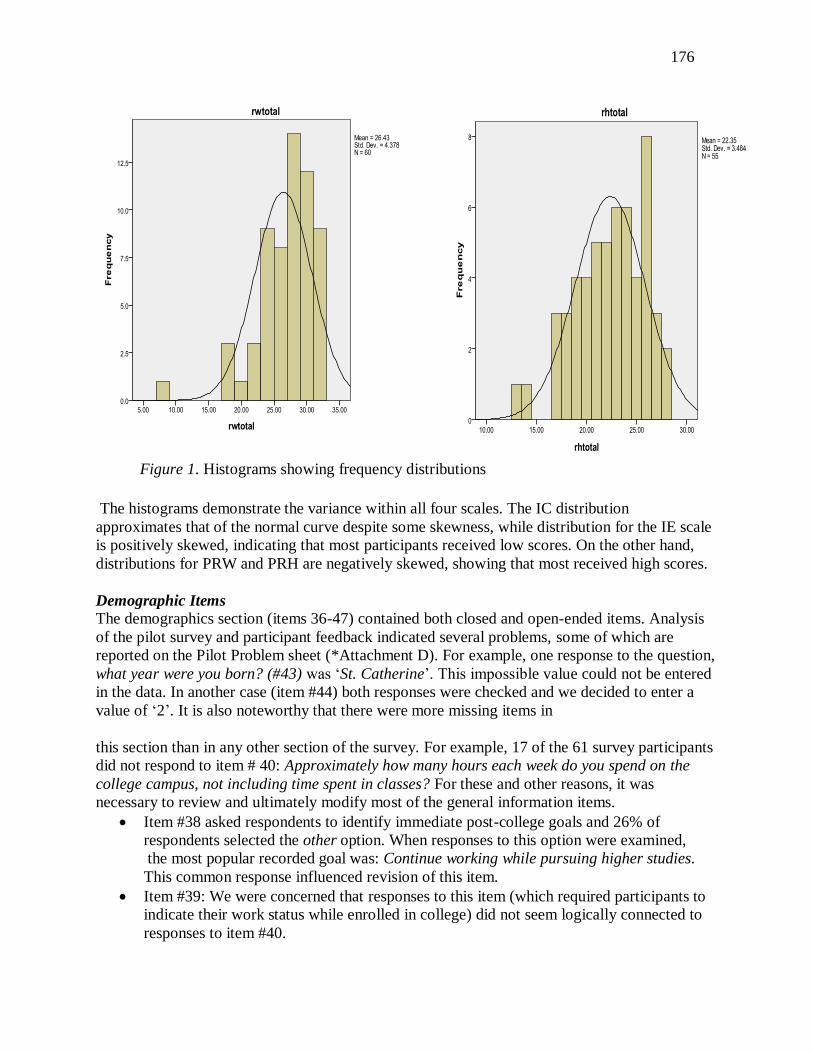
176
The histograms demonstrate the variance within all four scales. The IC distribution
approximates that of the normal curve despite some skewness, while distribution for the IE scale
is positively skewed, indicating that most participants received low scores. On the other hand,
distributions for PRW and PRH are negatively skewed, showing that most received high scores.
Demographic Items The demographics section (items 36-47) contained both closed and open-ended items. Analysis
of the pilot survey and participant feedback indicated several problems, some of which are
reported on the Pilot Problem sheet (*Attachment D). For example, one response to the question,
what year were you born? (#43) was ‗St. Catherine‘. This impossible value could not be entered
in the data. In another case (item #44) both responses were checked and we decided to enter a
value of ‗2‘. It is also noteworthy that there were more missing items in
this section than in any other section of the survey. For example, 17 of the 61 survey participants
did not respond to item # 40: Approximately how many hours each week do you spend on the
college campus, not including time spent in classes? For these and other reasons, it was
necessary to review and ultimately modify most of the general information items.
Item #38 asked respondents to identify immediate post-college goals and 26% of
respondents selected the other option. When responses to this option were examined,
the most popular recorded goal was: Continue working while pursuing higher studies.
This common response influenced revision of this item.
Item #39: We were concerned that responses to this item (which required participants to
indicate their work status while enrolled in college) did not seem logically connected to
responses to item #40.
Figure 1. Histograms showing frequency distributions

177
Responses to item #44 (current living situation) in some cases also appeared to contradict
answers to item #45 (financial support). For example, a few persons who indicated they
lived at home with parents also said they provided financial support. While this could be
true, it is more likely an interpretation problem.
(* See also comments from the final item #47 and the pilot study code book)
Changes to Demographic Items
Item 38: The option, Continue working while pursuing higher studies, has been added to
the list of post-college goals. This item is now #42.
Item 39: The options for this item (now #43) have been rewritten, with a follow-up item
(#44) included. The new and follow-up items appear in the Summary of Changes section.
Item 40: This item has been reworded to reduce interpretation errors and hopefully
improve participant response. The new item (#45) reads:
Approximately how many hours each week do you spend on the college campus, not
including time spent on a paid job?
Items 44 & 45: These items have been refocused to center on the study‘s involvement
constructs. Item #44(now #48) is linked to class involvement, while item #45 (now #49)
was added as a follow-up item with focus on extracurricular involvement. Please refer to
the Summary of Changes section for the amended items.
I. Other Needed Changes
I felt justified in making changes to three additional items: one from the RH scale and two
demographic items.
Item #29: The original item reads: Using the library or Internet effectively to locate
information. I decided to modify this item to minimize ambiguity, since it could be
interpreted as a ‗double‘ item—two questions in one item. The revised item reads thus:
Using different sources to locate information for class assignments.
Item #41: This item asked participants to rate overall satisfaction with college. All 61
participants responded, with 67% satisfied and 7% very satisfied with college. We
calculated Pearson correlations and found that satisfaction with college was significantly
correlated with involvement in classes, readiness for work and readiness for higher
education, but not with extracurricular involvement.
Table 4 presents these findings.
SAT41 IC total IE total RW total RH total
SAT 41
Sig. (2-tailed)
N
61
.041
60
.749
60
.019
60
.003
55
Table 5. Pearson correlations for SAT41 with scales IC, IE, RW & RH
Despite the findings, we were concerned that it is impossible to determine reliability
with a one-item scale measure. I therefore explored three options: (a) removing the item,
since satisfaction is implied in the instrument‘s four central scales, (b) changing the
response options from a 3- to a 4-point scale, or (c) developing a satisfaction scale by
using 4 or 5 items from an already validated college satisfaction scale. I chose the latter

178
option. The new Satisfaction scale consists of four items, three of which were influenced
by the College Environment scale of the Community College Student Experiences
Questionnaire (CCSEQ). This scale is included as Attachment E. The revised
Satisfaction scale is presented in the final (Summary of Changes) section.
Items 46a & 46b: Guided by feedback from pilot study participants and cultural
norms in the country where research will be conducted, minor changes have been
made to response choices for this item. Thus, the following response choices have
been added: primary school, some high school, and Masters degree and higher. The
new items (now 50a & 50b) are included in the summary section of this memo.
II. Summary of Changes
This section summarizes all changes that have been made to the instrument. A copy of the
updated instrument is included with the older instrument as Attachment B. The final table (5)
presents original items that have been revised and the corresponding new items. As indicated, in
most cases the new item has been assigned a different number. In addition, where only a word or
phrase has been added to the original item, this is highlighted for emphasis.
Table 6. Original survey items and corresponding changes
Old Item New Item
#2. I participated in group-assigned course
activities
I actively participated in group-assigned course work
#4. I regularly used the library or Internet to do
research for a class assignment
I put a lot of effort into doing research for class
assignments
#6. I effectively used concepts and methods
learned in class to answer new class
assignments
I regularly used concepts learned in class to answer
questions
#29. Using the library or Internet effectively to locate
information
Using different sources to locate information for class
assignments
#38. What is your IMMEDIATE goal once you complete studies at this college? (Check one)
o Start my first job
o Return to a job I had before coming to
college
o Look for a new job
o Seek a bachelor‘s degree
o Seek a Masters degree
o Other (please describe) _______________
#42. What is your IMMEDIATE goal once you complete studies at this college? (Check one)
o Start my first job
o Return to a job I had before coming to
college
o Look for a new job
o Seek a bachelor‘s degree
o Seek a Masters degree
o Continue working while pursuing higher
studies
o Other (please describe) _______________

179
Old Item New Item
#39. Which of the following best describes your work
status for most of your current college career?
(Check one)
o I worked full-time off campus
o I worked part-time off campus
o I worked full-time on campus o I worked part-time on campus
o I did not work
#43.Which of the following best describes your work
status for most of your current college career?
(Check one)
o I had a full-time job
o I had a part-time job
o I did not work
#44. If you did work, was it on or off campus?
o I worked on campus
o I worked off campus
#40. Approximately how many hours each week do you
spend on the college campus, not including time
spent in classes?
#45. Approximately how many hours each week do you
spend on the college campus, not including time
spent on a paid job?
#41. Overall, how satisfied are you with your
experiences at this college?
o Very satisfied
o Satisfied
o Not satisfied
Section V. Satisfaction with College (Items 36-39)
To what extent do you agree with each of the following
statements? (Strongly disagree/disagree/agree/strongly
agree)
I am satisfied with educational services at this college I am satisfied with the facilities at this college
This college is a stimulating and exciting place
My overall experiences at this college have been
positive
#44. Which of the following best describes your current
living situation?
o I live at home with parents and other
family members
o I am a head of household
#48. If you have family responsibilities, how do they
affect your classes?(Choose only one response)
o I do not have family responsibilities
o My family responsibilities do not interfere
with my classes
o They take a little time from my classes
o They take a lot of time from my classes
#46a. Please describe your parent or guardian‘s highest educational level
Mother or other guardian (check one)
o No diploma
o High school diploma
o Some college
o Associate degree
o Bachelor‘s degree
o Graduate degree
o I don‘t know
#50a. Please describe your parent or guardian‘s highest educational level
Mother or other guardian (check one)
o Primary school
o Some high school
o High school diploma
o Some college
o Associate degree
o Bachelor‘s degree
o Masters degree or higher
o I don‘t know
III. Final Comments
On the whole, we were pleased with the results of the pilot study. The direct classroom
administration and data collection procedures went smoothly, participants appeared to have
understood the directions, and the response scales utilized were effective. Moreover, item
distribution and reliability analyses were generally very satisfactory and the instrument captured

180
variance. While substantive changes have been made to a few items, we avoided drastic changes
to the instrument that would require another pilot study. I would like to thank the committee for
the feedback provided throughout this process and welcome your comments on the pilot results
and proposed changes. If I do not hear from you by November 5, I will assume I have your
approval to continue with the study, pending final approval from the IRB.
Once again, thank you for your continued support and encouragement.

181
Appendix H
Dissertation Study Code Book
Problems and Limitations
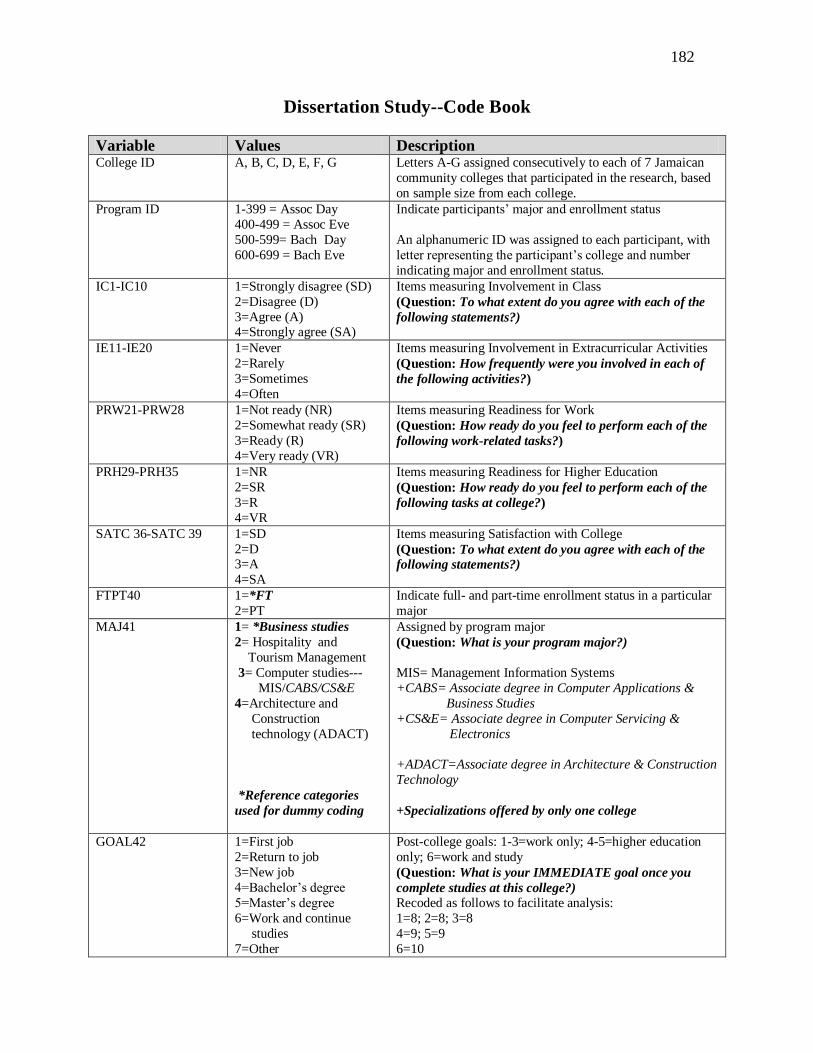
182
Dissertation Study--Code Book
Variable Values Description College ID A, B, C, D, E, F, G Letters A-G assigned consecutively to each of 7 Jamaican
community colleges that participated in the research, based
on sample size from each college.
Program ID 1-399 = Assoc Day
400-499 = Assoc Eve
500-599= Bach Day
600-699 = Bach Eve
Indicate participants‘ major and enrollment status
An alphanumeric ID was assigned to each participant, with
letter representing the participant‘s college and number
indicating major and enrollment status.
IC1-IC10 1=Strongly disagree (SD)
2=Disagree (D)
3=Agree (A) 4=Strongly agree (SA)
Items measuring Involvement in Class
(Question: To what extent do you agree with each of the
following statements?)
IE11-IE20 1=Never
2=Rarely
3=Sometimes
4=Often
Items measuring Involvement in Extracurricular Activities
(Question: How frequently were you involved in each of
the following activities?)
PRW21-PRW28 1=Not ready (NR)
2=Somewhat ready (SR)
3=Ready (R)
4=Very ready (VR)
Items measuring Readiness for Work
(Question: How ready do you feel to perform each of the
following work-related tasks?)
PRH29-PRH35 1=NR
2=SR
3=R
4=VR
Items measuring Readiness for Higher Education
(Question: How ready do you feel to perform each of the
following tasks at college?)
SATC 36-SATC 39 1=SD
2=D 3=A
4=SA
Items measuring Satisfaction with College
(Question: To what extent do you agree with each of the
following statements?)
FTPT40 1=*FT
2=PT
Indicate full- and part-time enrollment status in a particular
major
MAJ41 1= *Business studies
2= Hospitality and
Tourism Management
3= Computer studies---
MIS/CABS/CS&E
4=Architecture and
Construction
technology (ADACT)
*Reference categories
used for dummy coding
Assigned by program major
(Question: What is your program major?)
MIS= Management Information Systems
+CABS= Associate degree in Computer Applications &
Business Studies
+CS&E= Associate degree in Computer Servicing &
Electronics
+ADACT=Associate degree in Architecture & Construction
Technology
+Specializations offered by only one college
GOAL42 1=First job
2=Return to job
3=New job
4=Bachelor‘s degree
5=Master‘s degree
6=Work and continue
studies
7=Other
Post-college goals: 1-3=work only; 4-5=higher education
only; 6=work and study
(Question: What is your IMMEDIATE goal once you
complete studies at this college?)
Recoded as follows to facilitate analysis:
1=8; 2=8; 3=8
4=9; 5=9
6=10
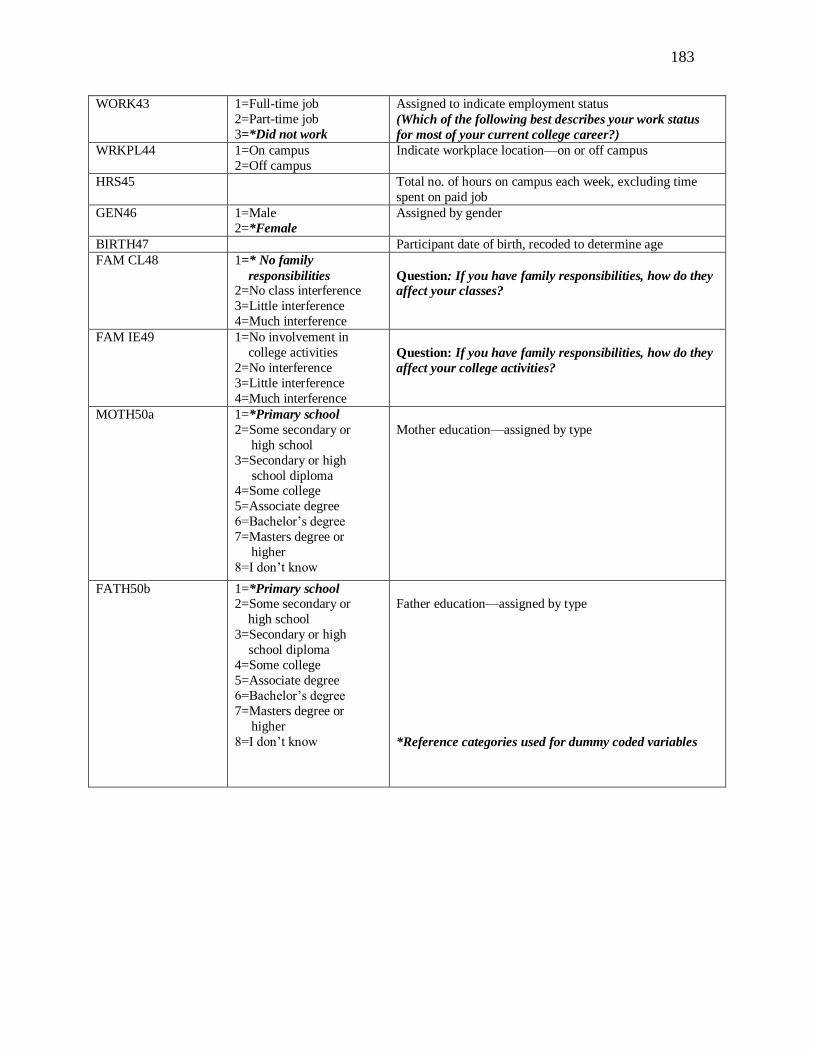
183
WORK43 1=Full-time job
2=Part-time job
3=*Did not work
Assigned to indicate employment status
(Which of the following best describes your work status
for most of your current college career?)
WRKPL44 1=On campus
2=Off campus
Indicate workplace location—on or off campus
HRS45 Total no. of hours on campus each week, excluding time
spent on paid job
GEN46 1=Male
2=*Female
Assigned by gender
BIRTH47 Participant date of birth, recoded to determine age
FAM CL48 1=* No family
responsibilities 2=No class interference
3=Little interference
4=Much interference
Question: If you have family responsibilities, how do they
affect your classes?
FAM IE49 1=No involvement in
college activities
2=No interference
3=Little interference
4=Much interference
Question: If you have family responsibilities, how do they
affect your college activities?
MOTH50a
1=*Primary school
2=Some secondary or
high school
3=Secondary or high
school diploma 4=Some college
5=Associate degree
6=Bachelor‘s degree
7=Masters degree or
higher
8=I don‘t know
Mother education—assigned by type
FATH50b 1=*Primary school 2=Some secondary or
high school
3=Secondary or high
school diploma
4=Some college
5=Associate degree
6=Bachelor‘s degree
7=Masters degree or
higher
8=I don‘t know
Father education—assigned by type
*Reference categories used for dummy coded variables

184
Problems and Limitations
ID Variable Description of Problem/Limitation
A19 IC8 Participant recorded two responses for this item (8) from the Involvement in classes scale: 1=strongly disagree and 3=agree.
Solution: Entered a value representing the average of both responses
(i.e., 2)
A11 A22
WORK43 WKPL44
Response to WORK43: did not work conflicts with response to WKPL44: worked off campus.
Solution: Resolved contradiction logically by entering the assigned value for
WORK43 and leaving WKPL44 blank. Before analysis, WKPL44 was sent to ‗missing‘.
A13
A47
A53 B111
B126
B153 C194
C203
D251 F314
F317
HRS45
These participants entered impossible values for HRS45 (Total no. of hours spent on
campus each week, excluding time spent on a paid job).
Responses included the following: Not sure of the hours
A lot
Only hours I have class, if not I leave Not sure
A lot of time
Every day Every day because I’m a boarder
A lot can’t estimate
None
Solution: Left blank; in addition, implausible values of 200 and 168 (hrs) were removed from the data set.
A10
A15 A22
HRS45 Where a range of hours was given, an average was calculated. For example,
participants A10, A15 and A22 indicated spending 10-12, 8-10 and 9-10 hours each week, respectively, on campus. Therefore, 11, 9 and 9.5 hours, respectively, were
entered.
A28
A403 B103
G356
BIRTH47 These participants entered impossible values for BIRTH47 (Year of birth), as
follows: July
Jamaica
Kingston, Jamaica Hanover, Jamaica
Solution: Left blank
A15
A59 A24
A29
FAM IE 49 Responses from participants A15 and A59 to FAM IE49 (Impact of family
responsibilities on college activities): no interference contradicts responses to the previous item: FAM CL48 (how family responsibilities affect classes) in which both
indicated they had no family responsibilities.
Solution: Entered assigned value for response to FAM CL48 and left FAM IE49
blank. For analysis, sent FAM IE49 to ‗missing‘. Likewise, participants A24 and A29 indicated having no family responsibilities, yet
selected response 3 for FAM IE49: they take a little time from my college activities
Solution: Logically resolved as for the previous cases.