peptide changes in the parabrachial nucleus following cervical vagal stimulation
TRANSCRIPT

THE JOURNAL OF COMPARATIVE NEUROLOGY :HX:390305 (1996)
Peptide Changes in the Parabrachial Nucleus Following Cervical
Vagal Stimulation
TAREK M. SALEH ANI) DAVID F. CECHETTO Stroke and Aging, Robarts Research Institute, and Department of Physiology,
University of Western Ontario, London, Ontario N6A 5K8, Canada
ABSTRACT Previous studies in our laboratory have shown that the peptides, neurotensin (NT),
cholecystokinin (CCK), substance P (SP), somatostatin (SOM), and calcitonin gene-related peptide (CGRP), have a role in modulating ascending visceral sensory information from the nucleus of the solitary tract to the thalamus via a mandatory synapse in the parabrachial nucleus (PB). In this investigation, we examined the changes in the levels of these peptides detected by immunohistochemistry in response to cervical vagal stimulation in the inactin- anesthetized male Wistar rat. Paired control and experimental animals were instrumented to monitor blood pressure and heart rate. The vagus nerve was stimulated for 0.5, 2, or 4 hours, after which time the animals were perfused and the brains processed immunohistochemically for the Fos protein and the peptides NT, CCK, SP, SOM, and CGRP. Vagal stimulation for 1 hour produced large numbers of Fos-positive cells in the external lateral (el), external medial (em), and central lateral (cl) subnuclei of the PB (N = 3 ) . Vagal stimulation produced a reduction in the level of immunolabeling for NT, SOM, and CCK in the el and em subnuclei of the PB. This depletion was present at 0.5 hour and increased in magnitude with the length of vagal stimulation, reaching a maximum after 4 hours. In contrast, the immunolabeling for SP and CGRP increased after 0.5 hour, reaching a maximum after 2 hours of vagal stimulation in the el and em subnuclei of the PB. After 4 hours of vagal stimulation, the immunolabeling for SP and CGRP was depleted in the two PB subnuclei. Thus, the neuropeptides NT, CCK, SP, SOM, and CGRP, which modulate the visceral sensory information in the PB, are influenced somewhat differentially by the level of activity in the vagus nerve. I iwii WiI?y-L,iss, Inc.
Indexing terms: substance P, neurotensin, calcitonin gene-related peptide, cholecystokinin, somatostatin
The ascending visceral sensory pathway was predicted after Dell and Olson’s pioneering experiments in 1951 when they recorded evoked potentials from the lateral frontal cortex and the ventral basal thalamus following stimulation of the cut end of the cervical vagus nerve (Dell and Olson, 1951). Since then, the parabrachial nucleus (PB) has been shown to be a major relay site for visceral information ascending to the ventral basal thalamus and terminating in the insular cortex (Cechetto, 1987; Cechetto and Saper, 1987; Saleh and Cechetto, 1993). The PB has also been well established as a major site for cardiovascular regulation (Mraovitch, 1982; Chamberlin and Saper, 1992). The PH is composed of 10 subnuclei (Fulwiler and Saper, 19841, of which the central lateral (el), external lateral (el), and external medial (em) subnuclei receive afferent input, including cardiorespiratory and gastrointestinal informa- tion, from the nucleus of the solitary tract (Herbert et al., 1990). This information is, in turn, relayed to the contralat-
era1 ventral basal thalamus (for review, see Cechetto, 1987). This projection is organized such that the rostra1 taste region of the nucleus of the solitary tract projects primarily to the ventrolateral and medial portion of the PB nucleus, whereas the caudal general visceral sites of the nucleus of the solitary tract project primarily to the lateral PB subnuclei (Norgren, 1985; Herbert et al., 1990).
The presence of neuropeptides such as calcitonin gene- related peptide (CGRP), substance P (SP), neurotensin (NT), somatostatin (SOM), and cholecystokinin (CCK) in the ascending visceral pathway from the nucleus of the solitary tract to the PB has been established neuroanatomically (Mantyh and Hunt, 1984; Leslie, 1985; Herbert and Saper,
Accepted August 24. 1995. Address reprints requests to Dr. David F. Cechetto. John P. Robarts
Research Institute, 100 Pwth Drive. P.O. Box 5015. London, Ontario N6A 5K8, Canada.
c. 1996 WILEY-LISS, INC.

NEUROCHEMICAL CHANGES IN THE PB
1990). Receptor localization and terminal labeling studies also confirm the abundance of the receptors and terminals for these peptides in the PB (NT: Young and Kuhar, 1981; SOM: Epelbaum et al., 1987; CCK: Zarbin et al., 1983; SP: Quirion et al., 1983; CGRP: Kruger et al., 1988).
Recently, we demonstrated that NT, when injected into the PB, has a potent excitatory effect on ascending visceral input to the contralateral visceral relay nucleus of the thalamus (Saleh and Cechetto, 1993). In contrast, CGRP, SP, and CCK, when injected into the PB, resulted in a potent inhibition of the visceral afferent input to the thalamus (Saleh and Cechetto, 1993). SOM inhibited the spontaneous firing of visceral thalamic neurons without affecting the evoked response to vagal stimulation (Saleh and Cechetto, 1993). These results demonstrate that these peptides play a specific role in modulating visceral sensory input from the PB to the ventral basal thalamus. However, these results do not provide evidence that these peptides are released into the PB in response to visceral afferent activa- tion, or the circumstances under which these peptides are released, or even the subnuclei of the PB in which the release takes place. To determine if these peptides are responsive to visceral activation, we examined whether the immunolabeling for the peptides CGRP, SP, NT, SOM, and CCK in the parabrachial subnuclei change in response to cervical vagus nerve stimulation and whether the level of these changes is dependant on the length of vagal stimula- tion.
The expression of the nuclear protooncogene, c-fos, a neuronal marker for cellular activation, has been widely accepted as a metabolic marker for polysynaptic pathway tracing (Dragunow and Robertson, 1987; Dragunow and Faull, 1989). I t has been shown that noxious and non- noxious peripheral stimulation evokes c-fos expression in spinal and medullary dorsal horn neurons (Hunt et al., 1987; Leah and Menetrey, 1989; Anton et al., 1991). In addition, Gieroba and Blessing (1994) demonstrated bilat- eral Fos-positive cells in the lateral PB following unilateral abdominal vagal stimulation in the conscious rabbit. We also used Fos immunohistochemistry to confirm which PB subnuclei receive visceral afferent information from the cervical vagus nerve.
METHODS General surgical preparation
Male Wistar rats (N = 30; 250-300 g) were anesthetized with inactin (100 mg/kg, i.p.). Catheters (PE-50) were inserted into the femoral artery to monitor blood pressure and heart rate. Arterial blood pressure was measured with a pressure transducer (Gould P23 ID) connected to a Grass model 7E polygraph, and heart rate was determined from the pulse pressure by using a Grass model 7P 44C tacho- graph. An endotracheal tube was inserted to facilitate the animals' respiration. The left vagus nerve was located through a midline cervical incision, isolated, and placed on stainless steel stimulating electrodes that were fixed in place with dental impression material. The cervical vagus nerve was crushed distal to the electrodes, thereby permit- ting activation of visceral afferents only. A heating blanket connected to a temperature controller was used to maintain the animals' rectal temperature at 37.0 ? 1°C throughout the experiment.
Paired sham-operated animals experienced all the same surgical procedures, including placement of the electrodes
2' J 2 50
400 a,
- 3
I
+ p 6
:i 200
B
----?t!---
t 4 his
t 50 Hz. 1mA
t 50 Hz, 1 mA
MNV ......
Fig. 1. A: Example of the blood pressure and heart rate changes evoked by vagal stimulation. The left side of the trace shows the maximal reflex decrease in heart rate and blood pressure, and the right side shows the sustained decrease in blood pressure and heart rate obtained during vagal stimulation (cycle of 1 second on/2 seconds off) for up to 4 hours. B: Representative drawing shows a coronal section of the rat pons outlining the parabrachial (PB) subnuclei. These bound- aries define the areas that were used to measure the density of the peptide immunostaining. PB subnuclei include the central lateral (cl), external lateral (el), external medial (em), medial (m), and Kolliker- Fuse (kn. LC, locus coeruleus; MCP, middle cerehral peduncle; MNV, mesencephalic trigeminal nucleus; MoV, motor trigeminal nucleus; MTV, mesencephalic trigeminal tract; scp, superior cerehral peduncle; TLD, laterodorsal tegmental nucleus.
on the vagus nerve, but no current was passed through the stimulating electrodes.
Vagal stimulation To activate vagal afferents in the experimental animals,
the stimulus intensity was determined at which a 5-second train of pulses (50 Hz and 2-ms pulse duration) produced a maximal reflex decrease in the heart rate (45-68 beats/ minute) and blood pressure (30-45 mmHg) of the animal. Following determination of the maximal reflex stimulation intensity, the animal was allowed to stabilize for 1 hour to allow for recovery of cardiovascular parameters, after which time the cervical vagus nerve was stimulated with a l-sec- ond-oni2-second-off cycle (50 Hz and 2-ms pulse duration) for 0.5, 2, or 4 hours, respectively, at the maximal stimulus intensity (1-3 mA; Fig. 1A). We used varying periods of vagal stimulation (up to 4 hours) to determine at which time changes would occur and to determine whether there was a time-dependant change in the immunohistochemical

392 T.M. SALEH AND D.F. CECHETTO
staining of the peptides. The l-second-on/2-second-off cycle was chosen to minimize arterial pressure and heart rate changes and to provide a more dynamic presentation of visceral activation.
At the end of each stimulus period, under deep anesthe- sia, the animal was perfused transcardially with ice-cold 10 mM phosphate buffered saline (pH 7.4) followed by sodium acetate (pH 6.5) and sodium borate (pH 11) in 4% parafor- maldehyde and 10 mM phosphate buffer. The stimulus was left on until the end of the first saline wash. The brains were removed and cytoprotected with 30% sucrose in the last fixative overnight. For c-fos immunohistochemistry, the animals were perfused with ice-cold 10 mM phosphate buffered saline followed by 4% paraformaldehyde in phos- phate buffered saline (pH 7.41.
Processing of tissues All solutions for the processing of the paired sham-
operated control and experimental tissues were made to- gether and then divided between the sections of the two brains, which were processed simultaneously, to ensure standardization of the staining conditions and reduce experi- mental error. Two or three experimental animals with their corresponding control were processed simultaneously. The incubation times for all the animals were the same. The peroxidase antiperoxidase technique, developed by Stern- berger ( 19791, was used and included the following series of steps. A 1-in-3 series of transverse sections of the brains of both experimental and control animals were cut on a freezing microtome (30 pn) and placed in 0.05 M Tris buffered saline (Trizma hydrochloride in 0.9% saline, pH 7.6). All sections were washed twice in Tris buffered saline, followed by incubation in a 10% sheep serum and 0.3% Triton reagent solution that serves to block nonspecific antigenic sites on the tissues. Each series of sections were then incubated with the respective primary antibody ( N T and CCK, Incstar; SP and CGRP, Peninsula; Fos, Oncogene Science; at a dilution of 1:1,0001 on a slowly revolving shaker bath at 4°C for 2 days. This Fos antibody has been shown to react with other Fos-related antigens and with the Fos protein. The sections were subsequently washed and incubated with a sheep anti-rabbit antiserum (1:50) and 1% sheep serum + 0.3% Triton for 90 minutes. Subsequently, the sections were washed, and the peroxidase reagent (peroxidase antiperoxidase) was added for 90 minutes. The antigenic sites were visiualized by the addition of the chromogenic substrate, 3,3’-diaminobenzidine hydrochlo- ride, and hydrogen peroxide (0.3 ~ I i m l ) for approximately 15-30 minutes. The sections were then dehydrated and mounted onto glass microscope slides and coverslipped.
Immunocytochemical controls such as preadsorption of the sections with the antigen or omission of the primary antibody from the incubation solution were also done for each of the peptide antibodies. Control sections through the PB were treated in exactly the same manner, except that the primary antisera were adsorbed by preincubating for 1 hour with the appropriate antigens at a concentration of 50 pg peptide per milliliter of diluted serum or by ommission of the primary antibody.
Data analysis Tissues were examined and photomicrographs were taken
by using a Leitz Diaplan microscope. Staining intensity was
analyzed by using an imagmg device (Imaging Research Inc.) connected to the microscope to provide a quantitative measure of the immunostaining for the peptides in the matched control and experimental tissue sections. Three to five (rostra1 to caudal) sections through the PB for each peptide in each animal were averaged, and this mean was used to calculate the overall mean intensity for that peptide in three animals. All measures were made by an investiga- tor who was unaware of the identity of the brain sections that were being analyzed. Measures of the relative optical density of peptide staining was used to compare semiquan- titatively the amount of immunocytochemical reaction product generated by the paired sections under identical conditions. The gray scale values range from black ( 0 ) to white (2.5).
The selection of the PB subnuclei was determined by landmarks on the immunohistochemical sections (superior cerebellar peduncle, dorsal surface of the brain, and supe- rior cerebellar tract ). In addition, adjacent thionin stained sections throughout the rostrocaudal extent of the PB were used as an aid in reproducibly determining the boundaries of the PB subnuclei.
The background optical density was obtained from neural tissue on the same section without specific peptide staining (superior cerebellar peduncle) and was subtracted from the optical density of the immunolabeled areas of the PB subnuclei to obtain the optical density readings that re- flected more accurately only the specific staining of termi- nals and cell bodies.
Paired experimental and control sections through the PB were analyzed by the imaging device. The average of each experimental animal for a peptide immunolabeling was expressed as a percent of its corresponding control. Data for the average immunocytochemical reaction product (three experimental and three control animals for each peptide) on the ipsilateral and contralateral sides of the PB both within and between groups were analyzed by using Student’s t test for paired observations. Fos antigens and CGRP-immuno- positive cell bodies in the el, em, and cl subnuclei of the PB were counted under the light microscope (40X I and com- pared with their paired controls. The number of immuno- positive cells in the PB subnuclei were averaged from a minimum of three and a maximum of five sections through the PB, and this number was used to calculate the mean for all animals. Values in the results are expressed as the mean 2 standard error of the mean.
RESULTS For all experimental animals ( N = 15), left cervical vagal
stimulation ( l-second-on/2-second-off cycle) resulted in an overall average decrease in blood pressure and heart rate of 26 5 10 mmHg and 38 t 14 beatsiminute, respectively. These changes in the animals’ blood pressure and heart rate were maintained for the duration of the stimulation period (Fig. 1A). No significant change in blood pressure or heart rate of the sham-operated control animals ( N = 15) was observed.
Figure 1B illustrates the outlines of the relevant PB subnuclei. This drawing shows what we consider to be the boundaries of the PB subnuclei of interest, and these boundaries were used to define the areas to measure the density of the peptide immunostaining. Preadsorption of the primary antibodies with the appropriate excess antigen resulted in no discernable staining in the PB subnuclei.

NEUROCHEMICAL CHANGES IN THE PB 393
Fig. 2. Photomicrographs of coronal sections through the parabra- chial (FBI nucleus (magnification ~40). A Right and left sides of a control animal demonstrate the absence of Fos-positive-immunoreac- tive cells in the lateral PB. B: The same region of the PB of an experi-
mental animal after 2 hours of vagal stimulation. Fos-positive cells can be seen, both ipsilaterally (left) and contralaterally (right), in the external lateral subnucleus of the lateral PB. Scale bar: 1 cm = 50 pm.
Fos Vagal stimulation (50 Hz, 2 mA, 2-ms duration, l-second-
oni2-second-off cycle) for 1 hour increased immunoreactiv- ity for Fos, bilaterally, in the PB. There were no significant differences in the number of Fos-positive cells in the PB ipsilateral to the vagal stimulation versus the number observed on the contralateral side. Fos-positive nuclei were located primarily in the ipsilateral and contralateral el (36 2 12,34 2 lo), em (19 2 8 ,21 * 61, andcl(10 2 4, 12 2 6) subnuclei of all three animals tested (Fig. 2). The sham-operated paired controls for Fos immunohistochemis- try showed very little or no Fos-labeled nuclei (el sub- nucleus contained an average of 6 ? 5 cells, and the em and cl subnuclei contained none; N = 3).
Neurotensin Figure 3 shows the NT staining in a coronal section
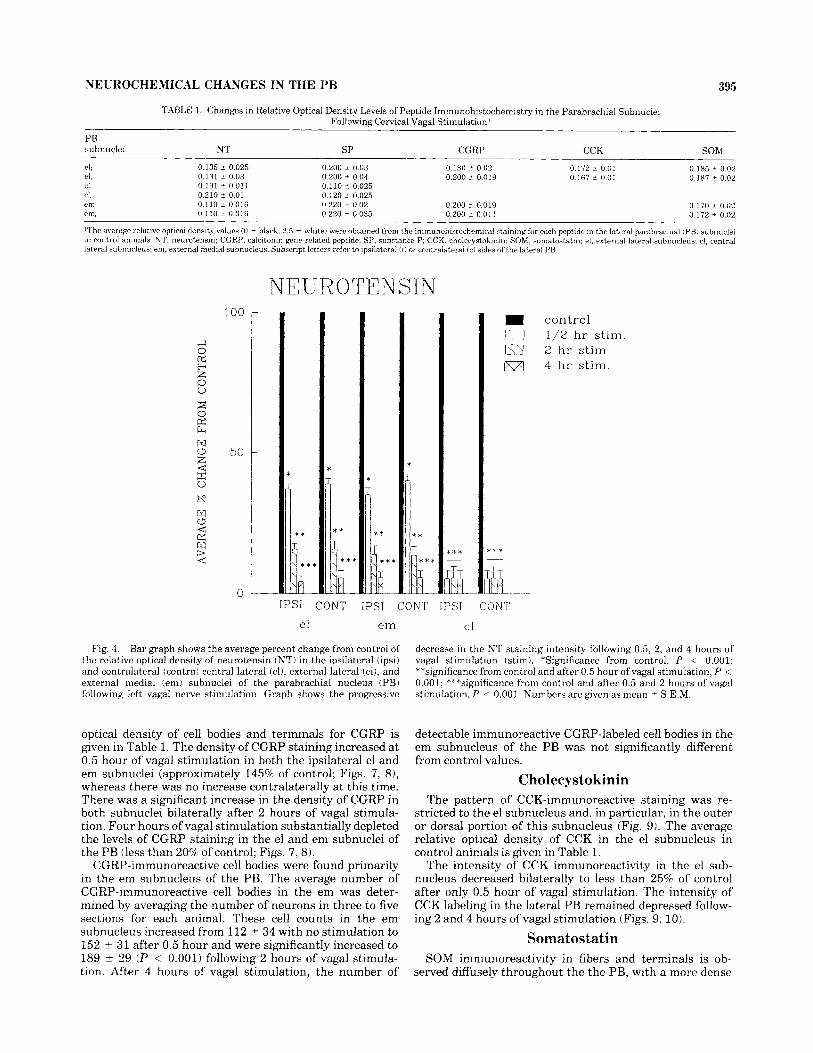
through the PB of a sham-operated animal incubated with the primary antibody for NT. Immunoreactive NT fibers and terminals are scattered throughout the lateral PB, with a particularly dense innervation of the outer or more dorsal region of the el subnucleus. More moderate NT staining is observed in the em and cl subnuclei. The average relative optical density of NT in the subnuclei of the lateral PB in control animals is given in Table 1.
The level of NT immunoreactivity following 0.5 hour of vagal stimulation decreased to approximately 40% of the control level in the el and em subnuclei but was reduced to
10% in the cl subnucleus (Figs. 3,4) . The intensity of NT in the PB subnuclei was substantially depleted (less than 10% of control) following 2 and 4 hours of vagal stimulation in all subnuclei containing this peptide (Figs. 3,4) .
Substance P The average measured optical density of SP cell bodies,
fibers, and terminals in the PB of the control animals is given in Table 1. SP staining appears particularly dense in the em subnucleus, with more moderate staining in the el and light staining in the cl subnuclei. An example of a coronal section from a control animal is shown in Figure 5. Following 0.5 hour of vagal stimulation, the density of immunoreactive SP labeling increases in the el and em subnuclei to approximately 145% of the control level but is not significantly elevated in the cl subnucleus (Figs. 5, 6). After 2 hours, the increase in SP intensity also occurs in the cl subnucleus (approximately 197% of control), whereas the increases in the el or em subnuclei (approximately 155%) continued to be observed. After 4 hours of vagal stimula- tion, the SP immunostaining is substantially depleted in the PB subnuclei (less than 20% of control).
Calcitonin gene-related peptide Punctate CGRP immunolabeling can be seen in cell
bodies, primarily in the em and some in the el subnuclei of the PB (Fig. 7) . Fibers and terminals are diffusely scattered throughout the el subnucleus of the PB. The average

394 T.M. SALEH AND D.F. CECHETTO
Fig. 3. Photomicrographs of coronal sections through the parabra- chial nucleus (PB, illustrate the intensity and distribution of neuroten- sin (NT) in the ipsilateral (left) and contralateral (right) PB. Included
are examples of' the NT staining intensity in a control (con; A1 and following 0.5 (B), 2 tC1, and 4 (D) hours of vagal stimulation. scp, superior cerebral pedunclc. Scale bar: 1 cm = 100 pm.
NEUROCHEMICAL CHANGES IN THE PB 395
TABLE 1. Changes in Relative Optical Density Levels of Peptide Irnrnunohistochernistry in the Parabrachial Subnuclei Following Cervical Vagal Stimulation'
PB subnuclei NT SP CGRP CCK SOM
el, 0.135 2 0.025 0.200 z 0.0:3 0.180 2 0.02 4 0.131 z 0.03 0,200 i 0.04 0.200 i 0.019 Cl, 0.191 i- 0.011 0.110 i 0.025 CL 0.210 i- 0.01 0.120 _t 0.025 em, 0.110 i 0.016 0.220 i 0.02 0,200 L 0.019 0 170 2 0.02 em, 0.110 i 0.016 0.220 2 0.035 0.200 ? 0.01 1 0.172 i 0.02
'The average relative optical density values ( 0 = hlack, 2.6 = white, were obtained from the imrnunohistochemical staining fbr each peptide in the lateral parabrachial i PBJ subnuclel in control animals. NT, neurotensin; CGRP, calcitonin gene-related peptide; SP, substance P; CCK, cholecystokinin: SOM, somatostatin; el, external lateral subnucleus, cl. central lateral subnucleus; ern, external medial subnucleus. Subscript letters refer to ipsilateral li) or contralateral (ci sides of the lateral PR.
0.186 i 0.02 0.187 2 0.02
0.172 i 0.01 0.167 2 0.01
100
50
0
NEUROTENSIN control
2 h r stim 4 h r stim.
0 1/2 h r stim
**
k * * * *
k **
& Ips1 CONT IPSI CONT IPSI CONT
el em
Fig. 4. Bar graph shows the average percent change from control of the relative optical density of neurotensin (NTj in the ipsilateral (ipsij and contralateral (contra) central lateral (clj, external lateral (el), and external medial (em) subnuclei of the parabrachial nucleus (PB) following left vagal nerve stimulation. Graph shows the progressive
optical density of cell bodies and terminals for CGRP is given in Table 1. The density of CGRP staining increased at 0.5 hour of vagal stimulation in both the ipsilateral el and em subnuclei (approximately 145% of control; Figs. 7, 81, whereas there was no increase contralaterally at this time. There was a significant increase in the density of CGRP in both subnuclei bilaterally after 2 hours of vagal stimula- tion. Four hours of vagal stimulation substantially depleted the levels of CGRP staining in the el and em subnuclei of the PB (less than 20% of control; Figs. 7,s).
CGRP-immunoreactive cell bodies were found primarily in the em subnucleus of the PB. The average number of CGRP-immunoreactive cell bodies in the em was deter- mined by averaging the number of neurons in three to five sections for each animal. These cell counts in the em subnucleus increased from 112 5 34 with no stimulation to 152 t 31 after 0.5 hour and were significantly increased to 189 t 29 ( P < 0.001) following 2 hours of vagal stimula- tion. After 4 hours of vagal stimulation, the number of
cl
decrease in the NT staining intensity following 0.5, 2, and 4 hours of vagal stimulation (stim). *Significance from control, P < 0.001; **significance from control and after 0.5 hour of vagal stimulation, P < 0.001; ***significance from control and after 0.5 and 2 hours of vagal stimulation, P < 0.001. Numbers are given as mean i S.E.M.
detectable immunoreactive CGRP-labeled cell bodies in the em subnucleus of the PB was not significantly different from control values.
Cholecystokinin The pattern of CCK-immunoreactive staining was re-
stricted to the el subnucleus and, in particular, in the outer or dorsal portion of this subnucleus (Fig. 9). The average relative optical density of CCK in the el subnucleus in control animals is given in Table 1.
The intensity of CCK immunoreactivity in the el sub- nucleus decreased bilaterally to less than 25%) of control after only 0.5 hour of vagal stimulation. The intensity of CCK labeling in the lateral PB remained depressed follow- ing 2 and 4 hours of vagal stimulation (Figs. 9, 10).
Somatostatin SOM immunoreactivity in fibers and terminals is ob-
served diffusely throughout the the PB, with a more dense

396 T.M. SALEH AND D.F. CECHETTO
Fig. 5. Photomicrographs of coronal sections through the parabra- chial nucleus (PB) illustrate the intensity and distribution ofsubstance P (SP) i r i the ipsilateral (left) and contralateral (right) PB. Included are
examples of the Sl’ staining intensity in a control (con; A ) and following 0.5 (B) , 2 ((21, and 4 (D) hours of‘ vagal stimulation. scp, superior cerebral pedunck~. Scale bar: 1 cm = 100 pm.

NEUROCHEMICAL CHANGES IN THE PB 397
SUBSTANCE P 200
150
100
50
0
* * T T
* * * *
T X
IPS1 CONT IPSI CONT IPSI CONT
el e m
Fig. 6. Bar graph shows the average percent change from control level of the relative optical density of substance P (SP) in the ipsilateral (ipsi) and contralateral (contra) central lateral (cl), external lateral (el), and external medial (em) subnuclei of the parabrachial nucleus (PB) following left vagal nerve stimulation. Graph shows the increase in the
representation in the el and em subnuclei (Fig. 11). The average intensity of SOM staining in the PB in a control animal is given in Table 1.
The SOM staining intensity in the el and em subnuclei decreased, bilaterally, to approximately 50 and 25% of control, respectively, following 0.5 hour of vagal stimula- tion (Fig. 12). Following 2 and 4 hours of vagal stimulation, the SOM staining intensity decreased to 25% of control or less in both subnuclei.
DISCUSSION We have provided evidence to support the hypothesis that
Fos activity and the peptides in the PB subnuclei change in response to afferent activation. These peptides have been shown to be involved in the modulation of visceral informa- tion to the ventral basal thalamus (Saleh and Cechetto, 1993). The density of staining for NT, CCK, and SOM was gradually depleted following prolonged afferent activation, whereas the peptides SP and CGRP increased their inten- sity of labeling for up to 2 hours before the staining was depleted after 4 hours of vagal stimulation.
Our results indicate that vagal stimulation produced activation of Fos, bilaterally, in cells in the el, em, and cl subnuclei of the PB and that these Fos-positive cells lie in the same regions of the PB which stained positive for the peptides NT, CCK, SOM, SP, and CGRP. Although, Fos- positive cells found in these PB subnuclei have been shown to project to the visceral relay nucleus of the thalamus, previous anatomical evidence suggests that the neurons in the em are primarily responsible for the relay of visceral information (Cechetto and Saper, 1987).
control 1/2 hr s t i m 2 h r stim 4 h r stim.
cl
SP staining intensity following 0.5 and 2 hours and the decrease a t 4 hours. *Significance from control, P < 0.001; **significance from control and after 0.5 hour of vagal stimulation, P < 0.001; ***signifi- cance from control and after 0.5 and 2 hours of vagal stimulation, P < 0.001. Numbers are given as mean 2 S.E.M.
Our control animals, anesthetized with inactin, demon- strated little or no immunoreactive Fos nuclei. In prelimi- nary animals, anesthetized with urethane and without vagal stimulation, we did find Fos-positive cells in the PB similar to that observed by Krukoff et al. (1992). Thus, inactin provides a long-lasting stable level of anesthesia without apparent activation of central neurons as indicated by the presence of immunoreactivity for Fos. Our results with the Fos immunostaining agree with those of Gieroba and Blessing (1994) who also demonstrated lateral PB activation following vagal stimulation.
No significant differences in the changes in peptide staining on the ipsilateral and contralateral sides following vagal stimulation were observed. This result is not surpris- ing given the bilateral projection from the nucleus of the solitary tract to the PB (Herbert et a]., 1990). In addition, unilateral abdominal vagal stimulation for 2 hours in the conscious rabbit resulted in bilateral Fos-positive cells in the lateral PB, with an ipsilateral predominance (Gieroba and Blessing, 1994). There is some indication (Fig. 2) that an ipsilateral increase is more predominant, but this trend was not statistically significant.
The strength of using the immunohistochemical tech- nique for quantification of peptide changes in the PB subnuclei was primarily for its ability to localize accurately the changes in the regional distribution of each peptide. This spatial localization enables us to make much better predictions of the potential functional consequences of these changes. We believe that our measures made with a computerized imaging system are a reliable index of these changes. First, we stress that these results are semiquanti- tative and do not indicate anything regarding the absolute

T.M. SALEH AND D.F. CECHETTO
Fig. 7. Photomicrographs of coronal sections through the parabra- chial nucleus IPB) illustrate the intensity and distribution of calcitonin gene-rclated peptide (CGRP) in the ipsilateral (left) and contralateral (right] PR. Included are examples of the changes in CGRP staining
intensity in a control (con; A ) and following 0.5 tB), 2 tC), and 4 tD) hours of vagal stimulation. scp, superior cerebral peduncle. Scale bar: 1 cm = 100 km.

NEUROCHEMICAL CHANGES IN THE PB 399
CALCITONIN G E N E 200
150
100
50
0
PEPTIDE * * *
IPS1 CONTRA
el
Fig. 8. Bar graph shows the average percent change from control level of the relative optical density of calcitonin gene-related peptide (CGRP) in the ipsilateral (ipsi) and contralateral (contra) external lateral (el) and external medial (em) subnuclei of the parabrachial nucleus t PB) following left vagal nerve stimulation. Graph shows the increase in the CGRP staining intensity following 0.5 and 2 hours and
amount of peptide present in the tissue. Second, to reduce the variability that can occur with the peroxidase-antiper- oxidase method, we have substracted the densitometry measurement from an adjacent control region of the brain that is not expected to have major changes in terminal content of the peptides. Third, we have attempted to control for the variability in the peroxidase-antiperoxidase method of staining by normalizing the results of the stimulated animals by expressing all the numbers as a percent of their corresponding control. Fourth, we have ensured that inves- tigator bias is not a factor in the measuring of these changes by having the the investigator blinded to the identity of the brains that were being analyzed. We trust that these approaches provide the most stringent means of reducing experimental error and permit the following conclusions. What cannot be measured accurately, as will be discussed later in more detail, is whether these measures indicate changes in release, synthesis, axonal transport, or degrada- tion.
Neurotensin The distribution pattern of NT immunoreactivity with
fibers and terminals throughout the lateral PB and a dense innervation in the lateral el subnucleus in our investigation is consistent with that found by other researchers (Milner et al., 1984; Moga and Gray 1985; Block and Hoffman, 1986; Milner and Pickel, 1986b). Vagal afferent activation resulted in an early loss of signal, particularly in the cl subnucleus, and a gradual loss in the el and em subnuclei to less than 10% of control levels.
- R E L A T E D
*
* * - c o n t r o l 0 1/2 hr stim [z9 2 h r s t i m
4 h r s t im.
* *
___ ~
IPS1 CONTRA em
the decrease at 4 hours of vagal stimulation (stim). *Significance from control, P < 0.001; **significance from control and after 0.5 hour of vagal stimulation, P < 0.001; ***significance from control and after 0.5 and 2 hours of vagal stimulation, P < 0.001. Numbers are given as mean 2 S.E.M.
NT has been demonstrated to be contained in neurons projecting from the nucleus of the solitary tract to the PB (Mantyh and Hunt, 1984; Milner et al., 1984) and has been shown to enhance the flow of visceral information through the PB (Saleh and Cechetto, 1993). The relay of visceral information has been demonstrated to be glutamatergic via N-methyl-D-aspartate receptors (Saleh and Cechetto, 1994a). NT may interact (or be coreleased) with glutamate (Baldino and Wolfson, 1985). Therefore, the NT in efferents from the nucleus of the solitary tract with terminals in the lateral PB (Milner et al., 1984) may be depleted as a result of sustained release following vagal stimulation. The re- sidual NT staining in the PB after 4 hours may be from other sources such as the central nucleus of the amygdala (Moga and Gray, 1985) or the perifonical lateral hypotha- lamic area (Moga et al., 1990). In our present investigation, we cannot determine whether or not the vagal stimulation can affect the release of NT from the amagdala or hypotha- lamic neurons.
Somatostatin Block and Hoffman (1986) reported a diffuse pattern of
SOM staining in the PB, particularly in the dorsal aspect of the el subnucleus, consistent with the pattern of staining for SOM in the PB observed in the present investigation.
The pattern of SOM signal loss following vagal stimula- tion initially (0.5 hour) was slightly more severe in the el than in the em subnucleus. Vagal stimulation for 2 and 4 hours resulted in continued loss of signal to approximately 20% of control levels. This remaining 20% may arise from

400 T.M. SALEH AND D.F. CECHETTO
Fig. 9. Photomicrographs of coronal sections through the parabra- chial nucleus (PB) illustrate the intensity and distribution of cholecys- tokinin (CCK) in the ipsilateral (left) and contralateral (right) PB.
Included are examples of the CCK staining intensity in a control (con; A) and following 0.5 (B), 2 (C), and 4 (D) hours of vagal stimulation. scp, superior cerebral peduncle. Scale bar: 1 cm = 100 pm.

NEUROCHEMICAL CHANGES IN THE PB 401
100
50
0
CHOLECYSTOKIWIN
IPS1 CONTRA el
Fig. 10. Bar graph shows the average percent change from control of the relative optical density of cholecystokinin (CCK) in the ipsilateral (ipsi) and contralateral (contra) external lateral (el) subnucleus of the parabrachial nucleus (PB) following left vagal nerve stimulation. Graph shows the progressive decrease in the CCK staining intensity following
external sources of SOM to the PB such as the central nucleus of the amygdala (Moga and Gray, 1985). The loss of SOM signal following vagal stimulation may be related to the selective inhibitory effect of SOM in the PB on the spontaneous activity of visceral thalamic neurons. SOM in the PB has been shown to evoke a potent inhibition of the spontaneous activity of neurons in the ventral basal thala- mus receiving viceral inputs (Saleh and Cechetto, 1993). I t does not have any affect on the evoked response to visceral activation. By this mechanism, SOM can significantly in- crease the response-to-background signal for visceral re- sponses in the ventral basal thalamus. Thus, it is possible that the immediate release of SOM from neurons in the pathway from the nucleus of the solitary tract to the PB would effectively enhance the impact of visceral signals arriving in the thalamus. SOM hyperpolarizes neurons in the nucleus of the solitary tract (Jacquin et al., 19881, although it is not known whether this is a similar mecha- nism to that operating in the PB. However, an early release of SOM to enhance the impact of visceral signals to the thalamus is a mechanism compatible with the present and previous results.
Cholecystokinin CCK immunoreactivity was present only in the el sub-
nucleus, as previously shown (Fulwiler and Saper, 1985). CCK-immunoreactive efferents from the nucleus of the solitary tract terminate primarily in the el subnucleus of the PB (Herbert and Saper, 1990). The external lateral PB subnucleus has been shown to evoke sympathoexcitatory responses with electrical and chemical stimulation (Cham- berlin and Saper, 1992). Previously, we demonstrated that
con t ro l 1/2 h r s t i m . 2 h r stim 4 h r stim.
0.5, 2, and 4 hours of vagal stimulation (stiml. *Significance from con- trol, P < 0.001; **significance from control and after 0.5 hour of vagal stimulation, P < 0.001; ***significance from control and after 0.5 and 2 hours of vagal stimulation, P < 0.001. Numbers given are mean 2 S.E.M.
low concentrations of CCK are a potent inhibitor of both spontaneous and vagal evoked activity of visceral thalamic neurons, whereas higher concentrations of CCK have an initial excitatory effect followed by inhibition of the sponta- neous activity of visceral thalamic neurons (Saleh and Cechetto, 1993). In the present investigation, it cannot be determined whether the depletion of CCK in terminals in the PB is related to the early excitatory or later inhibitory response. I t is likely that the increase in release is related to the excitatory effects of CCK. Thus, an early release of CCK following the initiation of vagal stimulation will result in an enhancement of the spontaneous activity of visceral neu- rons in the thalamus and cortex. As the CCK terminals become depleted, a more prolonged inhibition of visceral responsiveness would follow.
Substance P and CGRP Our observations of the distribution of immunoreactive
SP and CGRP fibers and cell bodies in the lateral PB, with particularly dense accumulations of immunoreactivity pre- sent in the em subnucleus, is consistent with previous investigations (Shimada et al., 1989; Block and Hoffman, 1986; Milner and Pickel, 1986a). Both SP and CGRP immunolabeling followed a similar pattern of change, in- creasing in intensity at 0.5 hour, with an additional in- crease after 2 hours of vagal stimulation and an almost complete loss of signal for both CGRP and SP following 4 hours of vagal stimulation. The increase in SP and CGRP signal may be a due to a decrease in terminal release, in- creased axonal transport, increased synthesis, or a decrease in the breakdown and removal from the terminal region.

T.M. SALEH AND D.F. CECHETTO
Fig. 11 Photomicrographs of coronal sections through the parabra- chid nucleus tPB) illustrate theintensityanddistributionofsomatosta- tin ISOM I in the ipsilateral (left) and contralateral (right) PB Included
are examples of the SOM staining intensity in a control (con; A) and following 0.5 (B), 2 tC), and 4 (DJ hours of vagal stimulation. scp, superior cerebral peduncle. Scale bar. 1 cm = 100 Fm.

NEUKOCHEMICAL CHANGES IN THE PB 403
SOMATOSTATIN 100
50
0 IPS1 CONTRA
el
Fig. 12. Bar graph shows the average percent change from control level of the relative optical density of somatostatin (SOM) in the ipsilateral (ipsi) and contralateral (contra) external lateral (el) and external medial (em) subnuclei of the parabrachial nucleus (PB) following left vagal nerve stimulation. Graph shows the progressive
In the measurements of CGRP staining intensity, no distinction was made between immunoreactivity gener- ated by cell bodies, fibers or terminals. Cell bodies stain more intensely per unit area than fibers or terminals, and there are more CGRP cell bodies in the PB than for the other peptides. These factors could result in an exaggera- tion of the differences observed in the CGRP measurements following vagal stimulation. However, it is technically difficult to analyze separately the density measurements of both fibers and cell bodies, and these are only relative measurement of changes in staining intensity. In addition, we have tried to account for this possible difference by including CGRP-positive cell counts. Thus, we were able to confirm that the staining intensity changes measured for CGRP result in a pattern similar to that observed for the numbers of cells bodies counted.
The possibility that there is some irreversible change in the integrity of the neurons receiving the visceral input from the vagus after 4 hours cannot be ruled out. However, there is no precedent on which to make the assumption that intermittent activation of peripheral afferents is capable of such a process. We have not done the experiments in which the animals are allowed to recover from anesthesia and surgery to determine whether or not recovery of peptide levels occur. Nevertheless, this possibility of a loss of of cellular integrity must be entertained.
A decrease in terminal release of these peptides into the PB is the most likely possibility. Both SP and CGRP have been shown to inhibit the flow of visceral information through the PB (Saleh and Cechetto, 1993). I t is possible that the early phase of vagal stimulation causes a decreased
control 1/2 h r stim 2 hr stim 4 h r s t im.
IPS1 CONTRA em
decrease in the SOM staining intensity following 0.5, 2, and 4 hours of vagal stimulation (stim). *Significance from control, P < 0.001; **significance from control and after 0.5 hour of vagal stimulation, P < 0.001; ***significance from control and after 0.5 and 2 hours of vagal stimulation, P < 0.001. Numbers given are mean _t S.E.M.
release of these peptides for the full visceral signal to reach the thalamus. However, prolonged visceral stimulation may cause a gradual increase in SP and CGRP release, thereby inhibiting the relay of visceral signals in the PB, which may contribute to the central adaptation to sus- tained visceral inputs. This type of peptidergic mechanism may even be responsible for some of the central component of baroreceptor adaptation following sustained activation (Kunze, 1985).
Previously, we showed that SP and CGRP function synergistically to inhibit the relay of visceral signals in the PB (Saleh and Cechetto, 1995). Other investigations have provided evidence that indicates that CGRP is a potent inhibitor of SP degradation by acting as a physiological peptidase inhibitor (Le Greves et al., 1985) and that SP and CGRP are colocalized in unmylinated afferent neurons (Gibson et al., 1984; Wiesenfeld-Hallin et al., 1984; Matsu- yama et al., 1986). Thus, SP and CGRP may function synergistically in central adaptive mechanisms to sustained visceral activation.
Alternatively, the initial increase may be due to increased transport or decreased release of SP and CGRP from different sources via multisynaptic pathways. The central nucleus of the amygdala (Shimada et al., 1989; Honkaniemi et al., 1990) and the lateral hypothalamic area (Moga et al., 1990) contain SP- and CGRP-immunoreactive fibers that project to the lateral PB. Thus, vagal stimulation may inhibit the tonic release of these peptides from these sources or enhance the transport to the terminals.
Finally, messenger RNA for both SP (Marksteiner et al., 1992) and CGRP (Rosenfeld et al., 1983) is located in cells

104 T.M. SALEH AND D.F. CECHETTO
cardiovascular responses to electrical and glutamate microstimulation of the parabrachial nucleus in the rat. J. Comp. Neurol. 326.245-262.
Dell, P., and K. Olson i 1951 1 Projections thalamique corticales et cerebelle- uses des afferrnces viscerales vagales. C. K. Soc. Biol. (Paris1 1451084- 1088.
Druganow, M., and H.A. Kobertson 11987) Kindling stimulation induces c-fos proteins in granule cells of the rat dentate gyrus. Nature 329:441- 442.
Druganow, M., and R. Faulll19891 The use of c-fijs as a metabolic marker in neuronal pathway tracing. J . Neurosci. Meth. 29,261-265.
Epelbaum, J., LT. Arancibia, C. Kordon, and A. Enjalbert (19871 Character- ization, regional distribution, and subcellular distribution of 125-I-Tyr- somatostatin binding sites in rat brain. J. Neurochem. 38:1515-1523.
Fulwiler, C.E., and C.U. Saper (1984) Suhnuclear organization of the efferent connections of the parabrachial nucleus in the rat. Brain Res. Rev. 7:229-259.
Gibson, S.J., J.M. Polak, S.K. Bloom, 1.M. Sabate, P.M. Mulderry, M.A. Ghatei, G.P. McGregor, J .F. Morrison, J.S. Kelly, K.M. Evans, and M.G Kosenfeld i 1984, Calcitonin gene-related peptide immunoreactivity in the spinal cord of man and eight other species. J . Neurosci. 4.3101-3111
Gieroba. Z.J.. and W.W. Blessing (1994, Fos-containing neurons in the medulla and pons after unilateral stimulation of the afferent abdominal vagus in conscious rabbits. Neuroscience 59:851-858.
Herbert, H., and C.B. Saper 11990) Cholecystokinin-. galanin- and corticotro- pin-releasing factor-like immunoreactive projections from the nucleus of the solitary tract to the parabrachial nucleus in the rat. J . Camp. Neurol. 293581-598.
Herbert, H., M.M. Moga, and C.B. Saper (1990) Connections of the parabra- chial nucleus with the nucleus of the solitary tract and the medullary reticular formation in the rat. J. Camp. Neurol. 293540-580.
Honkaniemi, J . , M. Pelto-Huikkn, J. lsola, and L. Kechardt (19901 Simulta- neous localization of calcitonin gene-related peptide and neurotensin in the rat central amygdaloid nucleus. Neurosci. Lett. 113:l-6.
Hunt, S.P., A. I’ini. M.L. Errington, and ‘T.V.P. Bliss (19871 Induction of c-fos protein in spinal cord neurons following sensory stimulation. Nature 328.632.
Jacquin, T., J . Champagnat, S. Madamba, M. Denavit-Saubie, and G.K. Siggins 11988) Somatostatin represses excitability in neurons of the solitary tract complex through hyperpolarization and augmentation of Im, a non-inactivating voltage-dependent outward current blocked by mascarinic agonists. Proc. Natl. Acad. Sci. 85.948-952
Kruger. L., P. Mantyh, C. Sternini, N. Brecha, and C. Mantyh (1988) Calcitonin gene-related peptide ICGRP! in the rat central nervous system: Patterns of immunoreactivity and receptor binding sites. Brain
Krukoff, T.L., T.1,. Morton, K.H. Harris, and J .H . Jhmandas 119921 Expression of c-/bs protein in rat brain elicited by electrical stimulation of the pontine parabrachial nucleus. J. Neurosci. 1219):358’2-3590.
Kunze, D.L. i 19851 Kole ofbaroreceptor reset t ing in cardiovascular regula- tion: Acute resetting. Fed. Proc. 44.2408-2411.
Leah, J.D., and D. Menet.rey (19891 Neuropeptides in propriospinal neurons in the rat. Brain Res. 495173-177.
Le Greves, P.. F. Nyberg, I,. Terenius, and T. Hokfelt 119851 Calcitonin gene-related peptide is a potent inhibitor of suhstanct. P degradation. Eur. J . Pharmacol. 175::309-311.
Leslie, R.A. 11985) Review: Neuroactive substances in the dorsal vagal complex of the medulla oblongata: Nucleus of the tractus solitarius, area postrema and dorsal motor nucleus of tho vagus. Neurochem. Int. 7.191-211.
Mantyh, P.W., and S.P. Hunt 11984) Neuropeptides are present in projection neurons a t iill levels in visceral and taste pathways: From the periphery to the sensory cortex. Brain Res. 299297-311,
Marksteiner, J . , S. Gunther. and K.E. James (19921 Distribution of neurons expressing neurokinin B in the rat brain: Immunohistochemistry and in situ hybridization. J. Comp. Neurol. .?I 7.341-356.
Matsuyama, T., A. Wanaka. S. Yoneda, T. Kimura, K. Kamada, S. Girgis, I. Mclntyre. P.C!. Emson, and M. Tohyama 11986) Two distinct calcitonin gene-related peptide-containing peripheral nervous systems: Distribu- tion and quantitative differences between the iris and cerebral artery with special reference to substance P. Brain Kes. 37.3205-212.
Milner, T.A., and V.M. Pickel i 1986al Ultrastructural localization and afferent sources of substance P in the rat parabrachial region. Neurosci- ence 17.687-707.
Milner. ‘LA.. and V.M. Pickel (1986bl Neurotensin in the rat parabrachial remon: Ultrastructural localization and extrinsic sources of immunoreac-
in the PB, and the CGRP signal is clearly primarily in cell bodies. Therefore, the initial increase in signal may be due to an increased synthesis of these peptides followed by subsequent decrease as the prolonged stimulation causing release exceeds the capacity for peptide synthesis. At the present time, our results do not distinguish between these possibilities. Further investigations using in situ hybridiza- tion, axonal transport, or protein synthesis inhibitors are required.
It is possible that the changes in peptide staining inten- sity are due to central reflex circulatory control mecha- nisms activated by the decrease in blood pressure that accompanies vagal stimulation. However, studies in progress in our laboratory have shown that infusion of sodium nitroprusside (0.2 mgiml; 2-hour intervals of 2 minutes o n i l minute off), which decreases blood pressure to the same magnitude as that observed with vagal stimulation (22-51 mmHg), does not elicit these changes in peptide staining intensity in the lateral PB as is seen following vagal stimulation but in fact results in the opposite effect in peptide staining levels observed in this study (Saleh and Cechetto. 1994b). Nevertherless, the Fos changes might be due to the change in arterial pressure as a previous investigation has demonstrated increases in Fos activity in the PB with decreases or increases in arterial pressure (Murphy et al., 1994).
In conclusion, we have investigated the effects of cervical vagus nerve stimulation on the changes in the peptide intensity in the lateral PB subnuclei. Our data suggest that these changes are time dependant for SP and CGRP, with short-term (0.5-2 hours) stimulation producing a de- creased release and longer-term (2-4 hours) stimulation completely depleting the levels of SP and CGRP in the PB. In contrast, CCK, SOM, and N T levels decreased markedly after 0.5 hour of stimulation and continued to decrease for up to 4 hours of stimulation. These results suggest that these peptides are released endogenously or prevented from being released in response to vagus nerve stimulation in a manner that may be dependent on their function in mediat- ing the flow of visceral information in the PB. In fact, variable release of inhibitory peptides may provide a mecha- nism for central adaptation to visceral inputs.
ACKNOWLEDGMENTS This work was supported by the Heart and Stroke
Foundation of Ontario. D.F.C. is a Career Investigator of the Heart and Stroke Foundation of Ontario, and T.M.S. is the recipient of a Heart and Stroke Foundation of Ontario Scholarship.
LITERATURE CITED Anton, I’., T. Herdegen, P. Peppel. and J.D. Leah 11991) c-fos-likeimmunore-
activity in rat brainstem neurons following noxious chemical stimulation of t he nasal mucosa. Neuroscience 41:629-641.
Baldino. F., and B. Wolfson (1985) Postsynaptic actions of Neurotensin on preoptic-anterior hypothalamic neurons in vitro. Brain Kes. 325.161- 170.
Block, C.H., and G.E. Hoffman 11986) Neuropeptide and monoamine components of the parabrachial pontine complex. Peptides 8.267-283.
Cechettn. D.F i 1987) Central representation of visceral function. Fed. Proc. 46: 17-230.
Cechotto. D.F.. and C.B. Saper (1987, Evidence for a viscerotopic sensory representation in the cortex and thalamus in the rat. J . Comp. Neurol. 262: 2 7-45.
Chamberlin. N.L., and C.B. Saper i 1992) Topographical organization of ti& J. Camp. Neurol. 247.326-343

NEUROCHEMICAL CHANGES IN THE PB
Milner. T.A., T.H. Joh, R.J. Miller, and V.M. Pickel (19841 Substance P, neurotensin, enkephalin and catecholamine-synthesizing enzymes: Light microscopic localizations compared with autoradiographic label in soli- tary efferents to the ra t parabrachial region. J. Comp. Neurol. 226:434- 447.
Moga, M.M., and T.S. Gray ( 1985) Evidence of corticotropin releasing factor, neurotensin, and somatostatin in the neural pathway from the central nucleus of the amygdala to the parabrachial nucleus. J. Comp. Neurol. 241:275-2845.
Moga, M.M., C.B. Saper, and T.S. Gray (19901 Neuropeptide organization of the hypothalamic projection to the parabrachial nucleus in the rat . J . Comp. Neurol. 295662-682.
Mraovitch, S., M. Kumada, and D.J. Reis 11982) Role of the nucleus parabrachialis in cardiovascular regulation in cat. Brain Res. 23257-75, 1982.
Murphy, A.Z. and M. Ennis I19941 Directionally specific changes in arterial pressure induce differential patterns of FOS expression in discrete areas of the rat brainstem: A double-labeling study for FOS and catechol- amines. J . Comp. Neurol. 349:36-50.
Norgren, R. (1985) Taste and the autonomic nervous system. Chem. Senses 10: 143-161.
Quirion. R., C.W. Shults, T.W. Moody, C.B. Pert, T.N. Chase, and T.L. O’Donohue ( 1983) Autoradiographic distribution of substance P recep- tors in rat central nervous system. Nature 303:714-716.
Rosenfeld, M.G., J . J . Mermod, S.G. Amara, L.W. Swanson, P.E. Sawchenko, J. Rivier, W.W. Vale, and R.M. Evans 119831 Production of a novel neuropeptide encoded by the calcitonin gene via tissue-specific RNA processing. Nature 304:129-135.
405
Saleh, T.M., and D.F. Cechetto (19931 Peptides in the parabrachial nucleus modulating visceral input to the thalamus. Am. J . Physiol. 264:R668- R675.
Saleh, T.M., and D.F. Cechetto (1994al Neurotransmitters in the parabra- chial nucleus mediatingvisceral inputs to the thalamus in the rat . Am. J . Physiol. 266:R1287-R1296.
Saleh, T.M., and D.F. Cechetto 11994b1 Neuropeptide changes in the parabrachial nucleus following visceral afferent activation. SOC. Neuro- sci. Abstr. 20:298.
Saleh, T.M., and D.F. Cechetto (1995) Neurochemical interactions in the parabrachial nucleus mediating visceral inputs to visceral thalamic neurons. Am. J . Physiol. 268:R786-R795.
Shimada, S., S. Inagaki, Y. Kubota, N. Ogawa, T. Shibasaki, and H. Takag 11989) Coexistence of peptides (corticotropin releasing factorineuroten- sin and substance Pisomatostatin) in the bed nucleus of the stria terminalis and central amygdaloid nucleus in the rat. Neuroscience 30:377-384.
Sternberger, L.A. (19791 Immunohistochemistry. New York: John Wiley and Sons.
Wiesenfeld-Hallin, Z., T . Hokfelt, J .M. Lundberg, W.G. Forsmann, M. Reinecke, F.A. Tschopp, and J.A. Fischer 119841 Immunoreactive calcito- nin gene-related peptide and substance P coexist in sensory neurons to the spinal cord and interact in spinal behavioral responses of the rat. Neurosci. Lett. 52:199-204.
Young, W.S., and M.J. Kuhar (1981) Neurotensin receptor localization by light microscopic autoradiography in ra t brain. Brain Res. 206:237-285.
Zarbin, M.A., R.B. Innis, J.K. Wamsley, S.H. Snyder, and M.J. Kuhar (19831 Autoradiographic localization of cholecystokinin receptors in ra t brain. J . Neurosci. 3:877-906.