pensions policy research online fieldwork: … household income london yorkshire (greater south east...
TRANSCRIPT

Pension planEmploymentAgeGenderWorking
Not workingpart timeWorkingand notNot working(fewer thanfull time
Occupatseekingbut seeking30 hrs a(30+ hrs aNET: NotNET:Both-ionalPersonalworkworkweek)week)workingWorking65+60-6455-59FemaleMaleTotal(N)(M)(L)(K)(J)(I)(H)(G)(F)(E)(D)(C)(B)(A)
201711490104362975631408601612156244895111000Unweighted base
19771048710836*3025531458551612156245304701000Weighted base
1193272612719108317464248698286-470470Male60%M46%54%M25%51%GiK36%K57%FGIK32%50%GIK54%c45%46%-100%B47%
7938222681181942379943175117338530-530Female40%54%LN46%75%FHIJ49%64%FHj43%68%FHJ50%H46%55%54%e100%A-53%
Page 1
Pensions Policy ResearchOnline Fieldwork: 27/02/2015 to 05/03/2015
Absolutes/col percents
QA. GenderBase: All respondents
Proportions/Means: Columns Tested (5%, 10% risk level) - A/B - C/D/E - F/G/H/I/J/K - L/M/N* small base

Household incomeRegionLondon
South East(greaterYorkshire£100,000£80,001-£60,001-£40,000-£20,001-NorthernSouth(excludingandEast ofWestEastand theNorthNorth
>£100,000£80,000£60,000£40,000<£20,000IrelandScotlandWalesWestLondon)central)EnglandMidlandsMidlandsHumberWestEastTotal(R)(Q)(P)(O)(N)(M)(L)(K)(J)(I)(H)(G)(F)(E)(D)(C)(B)(A)
21337016538425919704599155107102847798110341000Unweighted base
21**33*68*16138626220**60*40*100*16011010080*90*110*11020*1000Weighted base
141847931849611342145715547334444597470Male67%53%m69%MN58%MN48%M37%54%56%ACe51%45%44%50%47%41%49%40%54%ACe34%47%
715216720216692619558955534746665113530Female33%47%31%42%52%OP63%NOPq46%44%49%55%56%50%53%59%bk51%60%BK46%66%BK53%
Page 2
Pensions Policy ResearchOnline Fieldwork: 27/02/2015 to 05/03/2015
Absolutes/col percents
QA. GenderBase: All respondents
Proportions/Means: Columns Tested (5%, 10% risk level) - A/B/C/D/E/F/G/H/I/J/K/L - M/N/O/P/Q/R* small base; ** very small base (under 30) ineligible for sig testing

Compulsory advice atComfort with managing ownPlan to use pensionResponsibility for financialretirementpensionfunds pre-retirementTrust in parties re. pensionsRetire in next yeardecisions
NET:NET:NET:NET:NET:NotDisagreeNET: AgreeUncomfortableComfortableNoYesOtherLDLabourConservativeUnlikelyLikelyat allJointSoleTotal
(O)(N)(M)(L)(K)(J)(I)(H)(G)(F)(E)(D)(C)(B)(A)
28164734457759913713432164291686250164455391000Unweighted base
27864734557460013313131*16028868525117**4485351000Weighted base
145300153292294767319891563181282195273470Male52%46%44%51%m49%57%55%62%56%54%46%51%11%44%51%B47%
1323471932823055858127113336612315252263530Female48%54%56%l49%51%43%45%38%44%46%54%49%89%56%A49%53%
Page 3
Pensions Policy ResearchOnline Fieldwork: 27/02/2015 to 05/03/2015
Absolutes/col percents
QA. GenderBase: All respondents
Proportions/Means: Columns Tested (5%, 10% risk level) - A/B/C - D/E - F/G/H/I - J/K - L/M - N/O* small base; ** very small base (under 30) ineligible for sig testing

Pension planEmploymentAgeGenderWorking
Not workingpart timeWorkingand notNot working(fewer thanfull time
Occupatseekingbut seeking30 hrs a(30+ hrs aNET: NotNET:Both-ionalPersonalworkworkweek)week)workingWorking65+60-6455-59FemaleMaleTotal(N)(M)(L)(K)(J)(I)(H)(G)(F)(E)(D)(C)(B)(A)
201711490104362975631408601612156244895111000Unweighted base
19771048710836*3025531458551612156245304701000Weighted base
---------------Under 55---------------
1174462958731130377118506--62433828662455 - 59 years59%63%61%80%FHI86%FHI43%68%FI82%FHI59%I--100%DE64%61%62%
471601021737312220195-215-1179821560 - 64 years24%23%21%16%8%24%GJk22%GJ14%23%GJ-100%CE-22%21%21%
331039142100547154161--758616165 years or over17%15%19%m4%6%33%FGHJK10%gk5%18%GHjK100%CD--14%18%b16%
Page 4
Pensions Policy ResearchOnline Fieldwork: 27/02/2015 to 05/03/2015
Absolutes/col percents
QB. AgeBase: All respondents
Proportions/Means: Columns Tested (5%, 10% risk level) - A/B - C/D/E - F/G/H/I/J/K - L/M/N* small base

Household incomeRegionLondon
South East(greaterYorkshire£100,000£80,001-£60,001-£40,000-£20,001-NorthernSouth(excludingandEast ofWestEastand theNorthNorth
>£100,000£80,000£60,000£40,000<£20,000IrelandScotlandWalesWestLondon)central)EnglandMidlandsMidlandsHumberWestEastTotal(R)(Q)(P)(O)(N)(M)(L)(K)(J)(I)(H)(G)(F)(E)(D)(C)(B)(A)
21337016538425919704599155107102847798110341000Unweighted base
21**33*68*16138626220**60*40*100*16011010080*90*110*11020*1000Weighted base
-------------------Under 55-------------------
13224010423317215392461996460545972631462455 - 59 years63%68%58%65%60%66%75%65%59%61%62%59%60%67%66%66%57%71%62%
5718298851313112031212820192026421560 - 64 years23%20%26%18%23%20%16%21%27%20%19%19%28%25%21%18%24%18%21%
3411276538285183025126121821216165 years or over14%12%16%17%17%15%10%14%13%18%E19%E22%Ef12%8%14%16%19%E11%16%
Page 5
Pensions Policy ResearchOnline Fieldwork: 27/02/2015 to 05/03/2015
Absolutes/col percents
QB. AgeBase: All respondents
Proportions/Means: Columns Tested (5%, 10% risk level) - A/B/C/D/E/F/G/H/I/J/K/L - M/N/O/P/Q/R* small base; ** very small base (under 30) ineligible for sig testing

Compulsory advice atComfort with managing ownPlan to use pensionResponsibility for financialretirementpensionfunds pre-retirementTrust in parties re. pensionsRetire in next yeardecisions
NET:NET:NET:NET:NET:NotDisagreeNET: AgreeUncomfortableComfortableNoYesOtherLDLabourConservativeUnlikelyLikelyat allJointSoleTotal
(O)(N)(M)(L)(K)(J)(I)(H)(G)(F)(E)(D)(C)(B)(A)
28164734457759913713432164291686250164455391000Unweighted base
27864734557460013313131*16028868525117**4485351000Weighted base
----------------Under 55----------------
153416225349356888218104151496991025935562455 - 59 years55%64%O65%61%59%66%63%F56%65%F52%72%D39%59%58%66%B62%
701326113012933274307812375311110121560 - 64 years25%n20%18%23%m21%25%21%12%19%27%gh18%30%E21%25%A19%21%
551005995115122110265966763778016165 years or over20%15%17%17%19%J9%16%32%Gi16%21%10%31%E20%17%15%16%
Page 6
Pensions Policy ResearchOnline Fieldwork: 27/02/2015 to 05/03/2015
Absolutes/col percents
QB. AgeBase: All respondents
Proportions/Means: Columns Tested (5%, 10% risk level) - A/B/C - D/E - F/G/H/I - J/K - L/M - N/O* small base; ** very small base (under 30) ineligible for sig testing

Pension planEmploymentAgeGenderWorking
Not workingpart timeWorkingand notNot working(fewer thanfull time
Occupatseekingbut seeking30 hrs a(30+ hrs aNET: NotNET:Both-ionalPersonalworkworkweek)week)workingWorking65+60-6455-59FemaleMaleTotal(N)(M)(L)(K)(J)(I)(H)(G)(F)(E)(D)(C)(B)(A)
201711490104362975631408601612156244895111000Unweighted base
19771048710836*3025531458551612156245304701000Weighted base
124404274---553-55354122377237317553Working full time (30+63%57%56%---100%FGIJK-65%GIJK34%57%E60%E45%67%B55%hrs a week)
57225134--302--30210073130194108302Working part time29%32%27%--100%FGHJK--35%GHJK62%CD34%C21%37%A23%30%(fewer than 30 hrs a
week)
72024-36--36-2331181936Not working but seeking4%3%5%m-100%FGHIK--25%FHIK-1%1%5%DE3%4%4%work
96157108---108-417878127108Not working and not5%9%n12%mN100%FGHIJ---75%FHIJ-3%8%E14%DE15%A6%11%seeking work
---------------Retired on a pension---------------
---------------Student---------------
---------------Prefer not to say---------------
181629407--302553-855154195506431424855NET: Working92%L89%L84%--100%GJK100%GJK-100%GJK96%Cd91%C81%81%90%B86%
17818010836--145-7201189946145NET: Not working8%11%16%MN100%FHI100%FHI--100%FHI-4%9%e19%DE19%A10%14%
Page 7
Pensions Policy ResearchOnline Fieldwork: 27/02/2015 to 05/03/2015
Absolutes/col percents
QC. EmploymentBase: All respondents
Proportions/Means: Columns Tested (5%, 10% risk level) - A/B - C/D/E - F/G/H/I/J/K - L/M/N* small base

Household incomeRegionLondon
South East(greaterYorkshire£100,000£80,001-£60,001-£40,000-£20,001-NorthernSouth(excludingandEast ofWestEastand theNorthNorth
>£100,000£80,000£60,000£40,000<£20,000IrelandScotlandWalesWestLondon)central)EnglandMidlandsMidlandsHumberWestEastTotal(R)(Q)(P)(O)(N)(M)(L)(K)(J)(I)(H)(G)(F)(E)(D)(C)(B)(A)
21337016538425919704599155107102847798110341000Unweighted base
21**33*68*16138626220**60*40*100*16011010080*90*110*11020*1000Weighted base
1826539923893183924419162544452615611553Working full time (30+86%78%Mno78%MNO62%M62%M35%88%66%bI59%I41%57%I57%I54%i55%i58%I56%I51%56%55%hrs a week)
3712491021021121143483330212534358302Working part time14%22%18%30%P27%39%NoPq6%21%28%43%cDEfg30%30%30%27%27%31%32%k38%k30%(fewer than 30 hrs a
HjKweek)
---5821-21365-3547136Not working but seeking---3%2%8%NOPq-3%f2%3%f4%F5%F-3%f5%F4%f6%F3%F4%work
--383745165131491612911121108Not working and not--5%5%10%oq17%NOPQ6%11%11%13%9%8%16%Agh15%a10%10%11%3%11%seeking work
-------------------Retired on a pension-------------------
-------------------Student-------------------
-------------------Prefer not to say-------------------
2133651483411951952358414096846577959119855NET: Working100%100%MNo95%Mn92%M88%M74%94%86%87%84%87%87%84%82%85%86%83%95%be86%
--313456718516201416151315191145NET: Not working--5%8%q12%pQ26%NOPQ6%14%13%16%13%13%16%18%a15%14%17%a5%14%
Page 8
Pensions Policy ResearchOnline Fieldwork: 27/02/2015 to 05/03/2015
Absolutes/col percents
QC. EmploymentBase: All respondents
Proportions/Means: Columns Tested (5%, 10% risk level) - A/B/C/D/E/F/G/H/I/J/K/L - M/N/O/P/Q/R* small base; ** very small base (under 30) ineligible for sig testing

Compulsory advice atComfort with managing ownPlan to use pensionResponsibility for financialretirementpensionfunds pre-retirementTrust in parties re. pensionsRetire in next yeardecisions
NET:NET:NET:NET:NET:NotDisagreeNET: AgreeUncomfortableComfortableNoYesOtherLDLabourConservativeUnlikelyLikelyat allJointSoleTotal
(O)(N)(M)(L)(K)(J)(I)(H)(G)(F)(E)(D)(C)(B)(A)
28164734457759913713432164291686250164455391000Unweighted base
27864734557460013313131*16028868525117**4485351000Weighted base
14137019232232984758921674371037210336553Working full time (30+51%57%o56%56%55%63%k57%H25%58%H58%H64%D41%44%47%63%B55%hrs a week)
9518910317519831361646921731097159136302Working part time34%29%30%31%33%J23%28%51%FGI29%32%25%43%E42%35%A25%30%(fewer than 30 hrs a
week)
122112191773396268-162136Not working but seeking4%3%3%3%3%5%2%8%Fi6%F2%4%3%-4%4%4%work
2967385757121751324493126343108Not working and not11%10%11%10%9%9%13%15%8%8%7%12%E14%14%A8%11%seeking work
----------------Retired on a pension----------------
----------------Student----------------
----------------Prefer not to say----------------
2365602954985271141112413825961021215369472855NET: Working85%86%86%87%88%86%85%76%86%90%H89%d85%86%82%88%B86%
4288507673192082230753927963145NET: Not working15%14%14%13%12%14%15%24%F14%10%11%15%e14%18%A12%14%
Page 9
Pensions Policy ResearchOnline Fieldwork: 27/02/2015 to 05/03/2015
Absolutes/col percents
QC. EmploymentBase: All respondents
Proportions/Means: Columns Tested (5%, 10% risk level) - A/B/C - D/E - F/G/H/I - J/K - L/M - N/O* small base; ** very small base (under 30) ineligible for sig testing
Pension planEmploymentAgeGenderWorking
Not workingpart timeWorkingand notNot working(fewer thanfull time
Occupatseekingbut seeking30 hrs a(30+ hrs aNET: NotNET:Both-ionalPersonalworkworkweek)week)workingWorking65+60-6455-59FemaleMaleTotal(N)(M)(L)(K)(J)(I)(H)(G)(F)(E)(D)(C)(B)(A)
201711490104362975631408601612156244895111000Unweighted base
19771048710836*3025531458551612156245304701000Weighted base
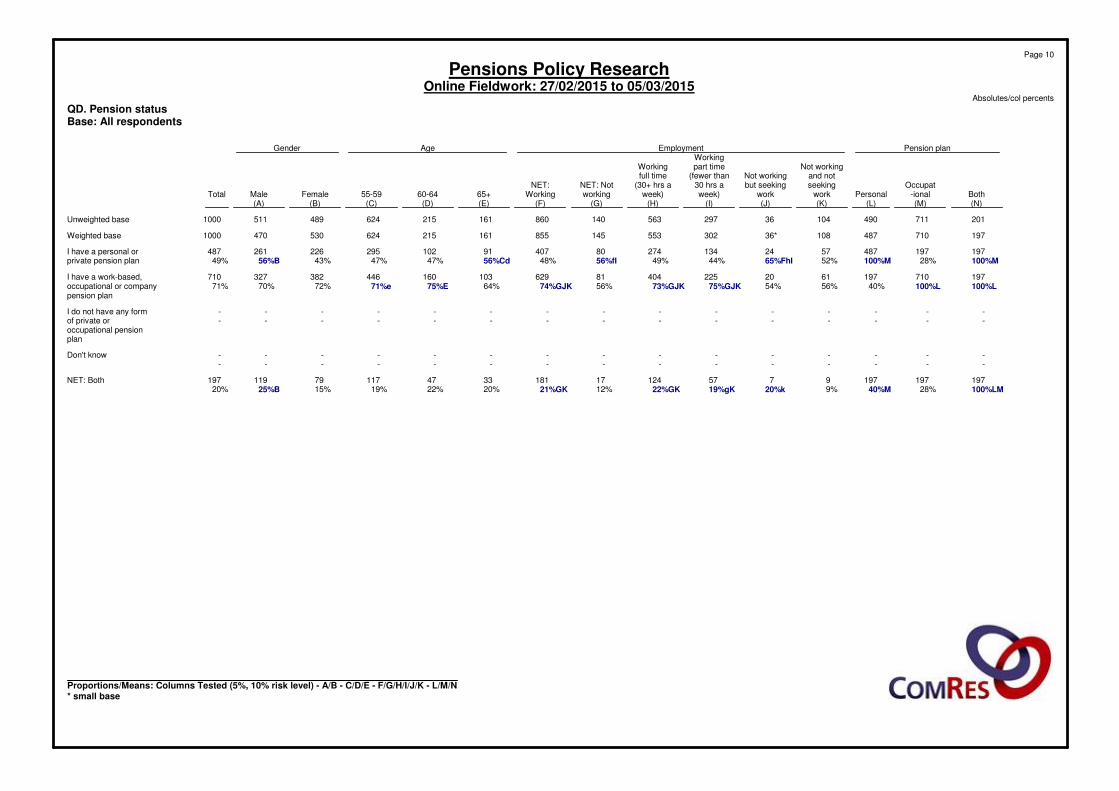
19719748757241342748040791102295226261487I have a personal or100%M28%100%M52%65%FhI44%49%56%fI48%56%Cd47%47%43%56%B49%private pension plan
197710197612022540481629103160446382327710I have a work-based,100%L100%L40%56%54%75%GJK73%GJK56%74%GJK64%75%E71%e72%70%71%occupational or company
pension plan
---------------I do not have any form---------------of private or
occupational pensionplan
---------------Don't know---------------
197197197975712417181334711779119197NET: Both100%LM28%40%M9%20%k19%gK22%GK12%21%GK20%22%19%15%25%B20%
Page 10
Pensions Policy ResearchOnline Fieldwork: 27/02/2015 to 05/03/2015
Absolutes/col percents
QD. Pension statusBase: All respondents
Proportions/Means: Columns Tested (5%, 10% risk level) - A/B - C/D/E - F/G/H/I/J/K - L/M/N* small base

Household incomeRegionLondon
South East(greaterYorkshire£100,000£80,001-£60,001-£40,000-£20,001-NorthernSouth(excludingandEast ofWestEastand theNorthNorth
>£100,000£80,000£60,000£40,000<£20,000IrelandScotlandWalesWestLondon)central)EnglandMidlandsMidlandsHumberWestEastTotal(R)(Q)(P)(O)(N)(M)(L)(K)(J)(I)(H)(G)(F)(E)(D)(C)(B)(A)
21337016538425919704599155107102847798110341000Unweighted base
21**33*68*16138626220**60*40*100*16011010080*90*110*11020*1000Weighted base
131635731961257231660875748394454458487I have a personal or65%50%51%46%51%48%36%38%40%60%aBJK55%BjK52%bk48%48%49%49%40%41%49%private pension plan
1028531312711691745306211077716261788215710I have a work-based,49%85%Mn78%M81%MN70%65%84%75%i76%i62%69%70%71%78%I68%71%75%I76%71%occupational or company
pension plan
-------------------I do not have any form-------------------of private or
occupational pensionplan
-------------------Don't know-------------------
3112043813248621372419211522173197NET: Both14%35%Mn29%M27%M21%M12%20%14%16%21%23%22%19%26%bk17%20%15%17%20%
Page 11
Pensions Policy ResearchOnline Fieldwork: 27/02/2015 to 05/03/2015
Absolutes/col percents
QD. Pension statusBase: All respondents
Proportions/Means: Columns Tested (5%, 10% risk level) - A/B/C/D/E/F/G/H/I/J/K/L - M/N/O/P/Q/R* small base; ** very small base (under 30) ineligible for sig testing

Compulsory advice atComfort with managing ownPlan to use pensionResponsibility for financialretirementpensionfunds pre-retirementTrust in parties re. pensionsRetire in next yeardecisions
NET:NET:NET:NET:NET:NotDisagreeNET: AgreeUncomfortableComfortableNoYesOtherLDLabourConservativeUnlikelyLikelyat allJointSoleTotal
(O)(N)(M)(L)(K)(J)(I)(H)(G)(F)(E)(D)(C)(B)(A)
28164734457759913713432164291686250164455391000Unweighted base
27864734557460013313131*16028868525117**4485351000Weighted base
136317152300266905923681593271259198281487I have a personal or49%49%44%52%M44%68%K45%72%fGI43%55%Gi48%50%52%44%52%B49%private pension plan
19746226438644082972511419549517811324374710I have a work-based,71%71%76%L67%73%J62%74%79%72%68%72%71%66%72%70%71%occupational or company
pension plan
----------------I do not have any form----------------of private or
occupational pensionplan
----------------Don't know----------------
5613271112106392616236613752374120197NET: Both20%20%21%19%18%29%K20%51%FGI14%23%G20%21%18%17%22%B20%
Page 12
Pensions Policy ResearchOnline Fieldwork: 27/02/2015 to 05/03/2015
Absolutes/col percents
QD. Pension statusBase: All respondents
Proportions/Means: Columns Tested (5%, 10% risk level) - A/B/C - D/E - F/G/H/I - J/K - L/M - N/O* small base; ** very small base (under 30) ineligible for sig testing

Pension planEmploymentAgeGenderWorking
Not workingpart timeWorkingand notNot working(fewer thanfull time
Occupatseekingbut seeking30 hrs a(30+ hrs aNET: NotNET:Both-ionalPersonalworkworkweek)week)workingWorking65+60-6455-59FemaleMaleTotal(N)(M)(L)(K)(J)(I)(H)(G)(F)(E)(D)(C)(B)(A)
201711490104362975631408601612156244895111000Unweighted base
19771048710836*3025531458551612156245304701000Weighted base
8452362123985281339263460Scotland4%6%5%6%5%4%7%i6%6%5%6%6%5%7%6%
315811811119241413720North East2%2%2%*1%3%2%1%2%1%2%2%2%1%2%
178245127355619912126635159110North West9%12%9%11%19%h12%10%13%11%13%12%10%10%13%11%
227854114346115951820726644110Yorkshire and the11%11%11%10%12%11%11%10%11%11%9%12%12%9%11%Humber
1561449525521377121959464490East Midlands8%9%9%8%13%8%9%9%9%8%9%9%9%9%9%
2162391232144156562054473380West Midlands10%9%8%11%8%7%8%10%8%4%9%E9%e9%7%8%
6301651112453551124192140Wales3%4%3%4%2%4%4%4%4%3%5%4%4%4%4%
19714816-305416841228605347100East of England10%10%10%15%fJ-10%j10%j11%J10%j8%13%10%10%10%10%
24775795336214962521645555110London12%11%12%8%14%11%11%10%11%15%c10%10%10%12%11%
37110871464891201403031998971160South East19%15%18%13%17%16%16%14%16%19%14%16%17%15%16%
216260133434116841820615545100South West11%9%12%M12%8%14%FH7%11%10%11%9%10%10%10%10%
41771-118119231591120Northern Ireland2%2%1%1%-*3%I1%2%I1%1%2%2%2%2%
Page 13
Pensions Policy ResearchOnline Fieldwork: 27/02/2015 to 05/03/2015
Absolutes/col percents
QE. RegionBase: All respondents
Proportions/Means: Columns Tested (5%, 10% risk level) - A/B - C/D/E - F/G/H/I/J/K - L/M/N* small base

Household incomeRegionLondon
South East(greaterYorkshire£100,000£80,001-£60,001-£40,000-£20,001-NorthernSouth(excludingandEast ofWestEastand theNorthNorth
>£100,000£80,000£60,000£40,000<£20,000IrelandScotlandWalesWestLondon)central)EnglandMidlandsMidlandsHumberWestEastTotal(R)(Q)(P)(O)(N)(M)(L)(K)(J)(I)(H)(G)(F)(E)(D)(C)(B)(A)
21337016538425919704599155107102847798110341000Unweighted base
21**33*68*16138626220**60*40*100*16011010080*90*110*11020*1000Weighted base
11392715-60----------60Scotland4%2%4%6%7%6%-100%ABCDEF----------6%
GHIJ
--1367-----------2020North East--1%2%2%3%-----------100%BCDEFG2%
HIJK
-44154633----------110-110North West-12%6%9%12%13%----------100%ACDEFGH-11%
IJK
-34165126---------110--110Yorkshire and the-10%6%10%13%10%---------100%ABDEFG--11%Humber
HIJK
1-8103727--------90---90East Midlands5%-11%q6%10%q10%q--------100%ABCEFG---9%
HIJK
135232023-------80----80West Midlands4%11%7%14%mN5%9%n-------100%ABCDFG----8%
HIJK
-2471214--40---------40Wales-6%6%4%3%5%--100%ABCDEF---------4%
GHIK
2412153723------100-----100East of England9%12%18%MNo9%9%9%------100%ABCDEG-----10%
HIJK
759233621-----110------110London34%16%13%14%Mn9%8%-----100%ABCDEFHI------11%
JK
6715216538----160-------160South East29%22%22%o13%17%14%----100%ABCDEF-------16%
GIJK
114124433---100--------100South West4%3%5%7%11%13%p---100%ABCDEF--------10%
GHJK
22166220-----------20Northern Ireland10%6%Mn1%4%M2%1%100%-----------2%
Page 14
Pensions Policy ResearchOnline Fieldwork: 27/02/2015 to 05/03/2015
Absolutes/col percents
QE. RegionBase: All respondents
Proportions/Means: Columns Tested (5%, 10% risk level) - A/B/C/D/E/F/G/H/I/J/K/L - M/N/O/P/Q/R* small base; ** very small base (under 30) ineligible for sig testing

Compulsory advice atComfort with managing ownPlan to use pensionResponsibility for financialretirementpensionfunds pre-retirementTrust in parties re. pensionsRetire in next yeardecisions
NET:NET:NET:NET:NET:NotDisagreeNET: AgreeUncomfortableComfortableNoYesOtherLDLabourConservativeUnlikelyLikelyat allJointSoleTotal
(O)(N)(M)(L)(K)(J)(I)(H)(G)(F)(E)(D)(C)(B)(A)
28164734457759913713432164291686250164455391000Unweighted base
27864734557460013313131*16028868525117**4485351000Weighted base
1443282830718111144017-233760Scotland5%7%8%l5%5%6%14%FGh3%7%5%6%7%-5%7%6%
7136111031-64172111820North East2%2%2%2%2%2%*-4%i1%2%d1%4%3%2%2%
2875416558251262322673315653110North West10%12%12%11%10%18%K9%19%F15%F8%10%13%6%13%10%11%
2774336868101132221743415554110Yorkshire and the10%11%10%12%11%7%9%10%14%F7%11%14%7%12%10%11%Humber
255634455875-172665212474190East Midlands9%9%10%8%10%5%4%-11%hI9%hI10%8%14%10%8%9%
26482648421610313315519-384280West Midlands9%7%7%8%7%12%k8%8%8%11%8%8%-8%8%8%
122715212946-81125112142440Wales4%4%4%4%5%3%4%-5%4%4%5%11%3%5%4%
3160326467131371327711824949100East of England11%9%9%11%11%10%10%22%FGi8%9%10%7%13%11%9%10%
3170356767713418417425-4169110London11%11%10%12%11%J5%10%13%11%14%11%10%-9%13%b11%
461015591862625418541114036591160South East16%16%16%16%14%19%19%g13%11%19%G16%16%20%15%17%16%
2765325469141141034682643957100South West10%10%9%9%12%11%8%13%6%12%g10%11%26%9%11%10%
4169111625-12164-101020Northern Ireland1%2%2%2%3%2%4%FG-1%1%2%2%-2%2%2%
Page 15
Pensions Policy ResearchOnline Fieldwork: 27/02/2015 to 05/03/2015
Absolutes/col percents
QE. RegionBase: All respondents
Proportions/Means: Columns Tested (5%, 10% risk level) - A/B/C - D/E - F/G/H/I - J/K - L/M - N/O* small base; ** very small base (under 30) ineligible for sig testing

Pension planEmploymentAgeGenderWorking
Not workingpart timeWorkingand notNot working(fewer thanfull time
Occupatseekingbut seeking30 hrs a(30+ hrs aNET: NotNET:Both-ionalPersonalworkworkweek)week)workingWorking65+60-6455-59FemaleMaleTotal(N)(M)(L)(K)(J)(I)(H)(G)(F)(E)(D)(C)(B)(A)
201711490104362975631408601612156244895111000Unweighted base
19771048710836*3025531458551612156245304701000Weighted base
5373421122012333231151362965Up to £10,0003%5%7%N19%FHI34%FHIk7%FH2%23%FHI4%2%5%8%E7%6%7%
2713291259828034162354012113067196£10,001-£20,00014%19%19%23%H25%h27%FH15%23%H19%H22%19%19%24%A14%20%
461481121956212824189384113411697213£20,001-£30,00024%21%23%17%14%20%23%g16%22%24%19%21%22%21%21%
341238419341111211512747998687173£30,001-£40,00017%17%17%17%8%13%20%Ij15%18%i17%22%c16%16%19%17%
27904963366791031824714865113£40,001-£50,00014%13%10%6%8%12%gk12%gk6%12%gk11%11%11%9%14%B11%
1640242212324449534202848£50,001-£60,0008%l6%5%2%5%4%6%3%5%6%d2%5%d4%6%b5%
1330253-83233961423133043£60,001-£70,0007%4%5%3%-3%6%gI2%5%4%6%c4%2%6%B4%
7239--422-26541791726£70,001-£80,0003%3%2%--1%4%GIK-3%Gk3%2%3%2%4%b3%
6168--612-19231412719£80,001-£90,0003%2%2%--2%g2%g-2%g1%1%2%2%1%2%
6128--113-1424931114£90,001-£100,0003%2%2%--*2%gI-2%i1%2%1%1%2%B1%
136--17-8-17258£100,001-£110,000**1%--*1%-1%-*1%*1%1%
-22--13-42-2134£110,001-£120,000-**--*1%-*1%-**1%*
256--18-9144369More than £120,0001%1%1%--*1%-1%1%2%1%1%1%1%
7492914227271654131739521870Prefer not to answer4%7%6%13%FH6%9%H5%11%FH6%8%8%6%10%A4%7%
Page 16
Pensions Policy ResearchOnline Fieldwork: 27/02/2015 to 05/03/2015
Absolutes/col percents
QF. Household incomeBase: All respondents
Proportions/Means: Columns Tested (5%, 10% risk level) - A/B - C/D/E - F/G/H/I/J/K - L/M/N* small base

Household incomeRegionLondon
South East(greaterYorkshire£100,000£80,001-£60,001-£40,000-£20,001-NorthernSouth(excludingandEast ofWestEastand theNorthNorth
>£100,000£80,000£60,000£40,000<£20,000IrelandScotlandWalesWestLondon)central)EnglandMidlandsMidlandsHumberWestEastTotal(R)(Q)(P)(O)(N)(M)(L)(K)(J)(I)(H)(G)(F)(E)(D)(C)(B)(A)
21337016538425919704599155107102847798110341000Unweighted base
21**33*68*16138626220**60*40*100*16011010080*90*110*11020*1000Weighted base
-----65-43811758638265Up to £10,000-----25%NOPQ-7%7%8%7%7%5%9%c7%3%8%9%7%
-----1962111125271418162123255196£10,001-£20,000-----75%NOPQ12%18%27%G25%G17%12%18%20%23%g21%23%g27%G20%
----213-31952728251982228263213£20,001-£30,000----55%MOPQ-16%32%aEfHJ13%27%Ehj18%23%E19%e10%24%E25%E23%E15%21%
----173-38617361117111523203173£30,001-£40,000----45%MOPQ-16%14%16%17%23%G10%17%14%17%21%G18%g17%17%
---113--56461516917912102113£40,001-£50,000---70%MNPQ--25%10%11%6%9%15%I9%22%BcDFHI10%11%9%12%11%
K
---48--13366766135148£50,001-£60,000---30%MNPQ--5%5%7%6%4%7%d6%7%d1%3%4%5%5%
--43----323879353-143£60,001-£70,000--63%MNOQ----4%B4%B3%b5%B6%B9%Bci3%B6%B3%b-3%B4%
--26---1-217232214-26£70,001-£80,000--37%MNOQ---5%-6%ciK1%4%k2%3%2%2%1%4%-3%
-19----2-215221-21-19£80,001-£90,000-57%MNOP----11%-5%Dk1%3%2%2%1%-2%1%-2%
-14-----1--2323-13-14£90,001-£100,000-43%MNOP-----1%--1%3%i2%3%di-1%3%-1%
8------1-12121----8£100,001-£110,00036%------1%-1%1%1%2%1%----1%
4---------22------4£110,001-£120,00019%---------1%2%------*
9-----2---24--1---9More than £120,00044%-----11%---1%4%Bcefi--1%---1%
-------52698757108270Prefer not to answer-------8%4%6%5%8%7%6%8%9%8%12%7%
Page 17
Pensions Policy ResearchOnline Fieldwork: 27/02/2015 to 05/03/2015
Absolutes/col percents
QF. Household incomeBase: All respondents
Proportions/Means: Columns Tested (5%, 10% risk level) - A/B/C/D/E/F/G/H/I/J/K/L - M/N/O/P/Q/R* small base; ** very small base (under 30) ineligible for sig testing

Compulsory advice atComfort with managing ownPlan to use pensionResponsibility for financialretirementpensionfunds pre-retirementTrust in parties re. pensionsRetire in next yeardecisions
NET:NET:NET:NET:NET:NotDisagreeNET: AgreeUncomfortableComfortableNoYesOtherLDLabourConservativeUnlikelyLikelyat allJointSoleTotal
(O)(N)(M)(L)(K)(J)(I)(H)(G)(F)(E)(D)(C)(B)(A)
28164734457759913713432164291686250164455391000Unweighted base
27864734557460013313131*16028868525117**4485351000Weighted base
2139233734913291148122125165Up to £10,0007%6%7%7%6%7%10%F6%6%4%7%5%12%3%10%B7%
45130849911427314354612752458134196£10,001-£20,00016%20%24%L17%19%20%24%F13%22%16%19%21%23%13%25%B20%
5414477114119283410354214950377133213£20,001-£30,00019%22%22%20%20%21%26%F32%F22%f15%22%20%20%17%25%B21%
52113611011052121530571214119577173£30,001-£40,00019%17%18%18%17%16%16%15%19%20%18%16%6%21%A14%17%
347132717016641644773116349113£40,001-£50,00012%11%9%12%12%12%5%12%10%i15%I11%12%5%14%A9%11%
192713333448112163115-311748£50,001-£60,0007%n4%4%6%6%3%6%3%8%6%4%6%-7%A3%5%
13281227298217232615-231943£60,001-£70,0005%4%3%5%5%6%1%3%4%8%I4%6%-5%4%4%
717121414631410215-161026£70,001-£80,0003%3%3%2%2%4%2%3%2%3%3%2%-4%a2%3%
510791433128144-13619£80,001-£90,0002%2%2%2%2%2%2%3%1%3%2%2%-3%A1%2%
3112111112138105-6814£90,001-£100,0001%2%*2%m2%1%2%3%2%3%1%2%-1%2%1%
34-8411122711348£100,001-£110,0001%1%-1%M1%1%1%3%1%1%1%*7%1%1%1%
13134-1--23--224£110,001-£120,000****1%-1%--1%*--***
1718522-1553-369More than £120,000*1%*1%m1%2%2%-1%2%1%1%-1%1%1%
204321374272141548184471970Prefer not to answer7%7%6%7%7%5%2%3%2%5%7%7%26%11%A3%7%
Page 18
Pensions Policy ResearchOnline Fieldwork: 27/02/2015 to 05/03/2015
Absolutes/col percents
QF. Household incomeBase: All respondents
Proportions/Means: Columns Tested (5%, 10% risk level) - A/B/C - D/E - F/G/H/I - J/K - L/M - N/O* small base; ** very small base (under 30) ineligible for sig testing

Pension planEmploymentAgeGenderWorking
Not workingpart timeWorkingand notNot working(fewer thanfull time
Occupatseekingbut seeking30 hrs a(30+ hrs aNET: NotNET:Both-ionalPersonalworkworkweek)week)workingWorking65+60-6455-59FemaleMaleTotal(N)(M)(L)(K)(J)(I)(H)(G)(F)(E)(D)(C)(B)(A)
201711490104362975631408601612156244895111000Unweighted base
19771048710836*3025531458551612156245304701000Weighted base
12037428143211363366347280101355263273535I am solely responsible61%M53%58%m40%57%k45%61%FGIK44%55%GIK50%47%57%D50%58%B54%for making household
financial decisions
7432419863161592107936977111259252195448I am jointly38%46%lN41%58%FH43%53%FH38%55%FH43%h48%52%C42%48%a42%45%responsible for making
household financialdecisions
31192-77215331015217I am not at all2%2%2%2%-2%1%2%2%2%2%2%3%A*2%responsible for making
household financialdecisions
Page 19
Pensions Policy ResearchOnline Fieldwork: 27/02/2015 to 05/03/2015
Absolutes/col percents
QG. Responsibility for financial decisionsBase: All respondents
Proportions/Means: Columns Tested (5%, 10% risk level) - A/B - C/D/E - F/G/H/I/J/K - L/M/N* small base

Household incomeRegionLondon
South East(greaterYorkshire£100,000£80,001-£60,001-£40,000-£20,001-NorthernSouth(excludingandEast ofWestEastand theNorthNorth
>£100,000£80,000£60,000£40,000<£20,000IrelandScotlandWalesWestLondon)central)EnglandMidlandsMidlandsHumberWestEastTotal(R)(Q)(P)(O)(N)(M)(L)(K)(J)(I)(H)(G)(F)(E)(D)(C)(B)(A)
21337016538425919704599155107102847798110341000Unweighted base
21**33*68*16138626220**60*40*100*16011010080*90*110*11020*1000Weighted base
1214296621018510372457916949424154538535I am solely responsible58%43%42%41%54%Op71%NOPQ52%61%abd60%a57%57%a63%ABCDF49%53%46%49%48%41%54%for making household
financial decisions
819399317170102314396541493847555611448I am jointly36%57%M58%MN58%MN44%M27%48%39%35%39%41%37%49%g47%52%Gj50%g51%Ghij56%gij45%responsible for making
household financialdecisions
1--156--243-2-211117I am not at all5%--1%1%2%--4%EGk4%eGk2%-2%-3%1%1%3%eGk2%responsible for making
household financialdecisions
Page 20
Pensions Policy ResearchOnline Fieldwork: 27/02/2015 to 05/03/2015
Absolutes/col percents
QG. Responsibility for financial decisionsBase: All respondents
Proportions/Means: Columns Tested (5%, 10% risk level) - A/B/C/D/E/F/G/H/I/J/K/L - M/N/O/P/Q/R* small base; ** very small base (under 30) ineligible for sig testing

Compulsory advice atComfort with managing ownPlan to use pensionResponsibility for financialretirementpensionfunds pre-retirementTrust in parties re. pensionsRetire in next yeardecisions
NET:NET:NET:NET:NET:NotDisagreeNET: AgreeUncomfortableComfortableNoYesOtherLDLabourConservativeUnlikelyLikelyat allJointSoleTotal
(O)(N)(M)(L)(K)(J)(I)(H)(G)(F)(E)(D)(C)(B)(A)
28164734457759913713432164291686250164455391000Unweighted base
27864734557460013313131*16028868525117**4485351000Weighted base
14834617831433068811885155384117--535535I am solely responsible53%53%52%55%55%51%62%56%53%54%56%D46%--100%B54%for making household
financial decisions
12629016025526162471472132287132-448-448I am jointly45%45%46%44%43%47%36%44%45%46%i42%53%E-100%A-45%responsible for making
household financialdecisions
41275933-3214217--17I am not at all1%2%2%1%2%2%2%-2%1%2%1%100%--2%responsible for making
household financialdecisions
Page 21
Pensions Policy ResearchOnline Fieldwork: 27/02/2015 to 05/03/2015
Absolutes/col percents
QG. Responsibility for financial decisionsBase: All respondents
Proportions/Means: Columns Tested (5%, 10% risk level) - A/B/C - D/E - F/G/H/I - J/K - L/M - N/O* small base; ** very small base (under 30) ineligible for sig testing

Pension planEmploymentAgeGenderWorking
Not workingpart timeWorkingand notNot working(fewer thanfull time
Occupatseekingbut seeking30 hrs a(30+ hrs aNET: NotNET:Both-ionalPersonalworkworkweek)week)workingWorking65+60-6455-59FemaleMaleTotal(N)(M)(L)(K)(J)(I)(H)(G)(F)(E)(D)(C)(B)(A)
201711490104362975631408601612156244895111000Unweighted base
19771048710836*3025531458551612156245304701000Weighted base
6619515924692167302595978151133156288Conservatives33%27%33%m22%15%30%Gj30%Gj21%30%Gjk37%C36%C24%25%33%B29%
231146813946922213826301047189160Labour12%16%14%12%25%k15%17%15%16%16%14%17%13%19%B16%
8403111115371252131238224163UKIP4%6%6%10%i3%5%7%8%6%8%6%6%4%9%B6%
1625235316882410418121931Liberal Democrats8%lM3%5%4%H7%H5%FH1%5%H3%h6%CD2%3%2%4%b3%
616103-412317131613720Green Party3%2%2%3%-1%2%2%2%1%1%3%3%1%2%
313911512217351161219Scottish National Party2%2%2%1%3%2%2%1%2%2%2%2%1%3%2%
51761187216351010818A coalition3%2%1%1%3%3%1%1%2%2%2%2%2%2%2%
31131-461102277511Other1%2%1%1%-1%1%1%1%1%1%1%1%1%1%
672781784916112212653244475270256133389I don't trust any34%39%37%46%45%37%38%45%f38%27%35%43%DE48%A28%39%political party to
deliver a fair pensionsystem
Page 22
Pensions Policy ResearchOnline Fieldwork: 27/02/2015 to 05/03/2015
Absolutes/col percents
Q1. Trust in political parties to deliver fair pension systemBase: All respondents
Proportions/Means: Columns Tested (5%, 10% risk level) - A/B - C/D/E - F/G/H/I/J/K - L/M/N* small base

Household incomeRegionLondon
South East(greaterYorkshire£100,000£80,001-£60,001-£40,000-£20,001-NorthernSouth(excludingandEast ofWestEastand theNorthNorth
>£100,000£80,000£60,000£40,000<£20,000IrelandScotlandWalesWestLondon)central)EnglandMidlandsMidlandsHumberWestEastTotal(R)(Q)(P)(O)(N)(M)(L)(K)(J)(I)(H)(G)(F)(E)(D)(C)(B)(A)
21337016538425919704599155107102847798110341000Unweighted base
21**33*68*16138626220**60*40*100*16011010080*90*110*11020*1000Weighted base
916336099572141134544127312621224288Conservatives43%48%MN48%MN37%MN26%22%10%23%27%34%BC34%BC38%aBCK27%39%aBCfK29%19%20%20%29%
3511296444111810181813131722236160Labour14%14%16%18%17%17%5%18%21%hi10%11%16%13%16%19%i20%HI21%HI29%eFgHI16%
223430221-17194842710-63UKIP9%6%4%2%8%O8%O5%-2%7%K12%ADGjK4%8%dK6%k3%6%K9%adK-6%
1225156-1-44473-36-31Liberal Democrats4%6%3%3%4%2%-1%-4%d3%4%d7%Dj3%d-3%5%D-3%
211195112-3511212-20Green Party9%3%1%1%2%2%6%1%5%I-2%5%I1%1%3%1%2%-2%
---495-16-2-------119Scottish National Party---3%2%2%-27%ABCDEF-2%h-------3%BCDeFG2%
GHIJH
-1-56612111334-11-18A coalition-3%-3%2%2%5%3%2%1%1%3%3%5%bcDH-1%1%-2%
-111262-211111-2--11Other-4%N1%1%*2%N11%-5%BDHk1%1%1%1%1%-2%--1%
45185215210912161541593440234252469389I don't trust any20%17%27%33%q39%PQ42%oPQ59%27%38%41%ek37%31%40%k29%46%EGK47%EGK42%egK47%egK39%political party to
deliver a fair pensionsystem
Page 23
Pensions Policy ResearchOnline Fieldwork: 27/02/2015 to 05/03/2015
Absolutes/col percents
Q1. Trust in political parties to deliver fair pension systemBase: All respondents
Proportions/Means: Columns Tested (5%, 10% risk level) - A/B/C/D/E/F/G/H/I/J/K/L - M/N/O/P/Q/R* small base; ** very small base (under 30) ineligible for sig testing

Compulsory advice atComfort with managing ownPlan to use pensionResponsibility for financialretirementpensionfunds pre-retirementTrust in parties re. pensionsRetire in next yeardecisions
NET:NET:NET:NET:NET:NotDisagreeNET: AgreeUncomfortableComfortableNoYesOtherLDLabourConservativeUnlikelyLikelyat allJointSoleTotal
(O)(N)(M)(L)(K)(J)(I)(H)(G)(F)(E)(D)(C)(B)(A)
28164734457759913713432164291686250164455391000Unweighted base
27864734557460013313131*16028868525117**4485351000Weighted base
861918419218246---288183892132155288Conservatives31%29%24%34%M30%35%---100%GHI27%35%E10%29%29%29%
46105678410319--160-1143937285160Labour17%16%20%l15%17%14%--100%FHI-17%16%19%16%16%16%
1743223839963---38212243763UKIP6%7%6%7%7%7%49%FGH---6%9%12%5%7%6%
11181220206-31--1714-141831Liberal Democrats4%3%3%3%3%4%-100%FGI--2%5%E-3%3%3%
61281112320---145161320Green Party2%2%2%2%2%2%15%FGH---2%2%6%1%2%2%
512899319---127-81019Scottish National Party2%2%2%2%2%2%14%FGH---2%3%-2%2%2%
41231211318---142-81018A coalition1%2%1%2%2%2%14%FGH---2%1%-2%2%2%
28657-11---11--11011Other1%1%2%1%1%-9%FGh---2%D--*2%B1%
10024613620321644----283749183197389I don't trust any36%38%40%35%36%33%----41%D29%52%41%37%39%political party to
deliver a fair pensionsystem
Page 24
Pensions Policy ResearchOnline Fieldwork: 27/02/2015 to 05/03/2015
Absolutes/col percents
Q1. Trust in political parties to deliver fair pension systemBase: All respondents
Proportions/Means: Columns Tested (5%, 10% risk level) - A/B/C - D/E - F/G/H/I - J/K - L/M - N/O* small base; ** very small base (under 30) ineligible for sig testing

Pension planEmploymentAgeGenderWorking
Not workingpart timeWorkingand notNot working(fewer thanfull time
Occupatseekingbut seeking30 hrs a(30+ hrs aNET: NotNET:Both-ionalPersonalworkworkweek)week)workingWorking65+60-6455-59FemaleMaleTotal(N)(M)(L)(K)(J)(I)(H)(G)(F)(E)(D)(C)(B)(A)
201711490104362975631408601612156244895111000Unweighted base
19771048710836*3025531458551612156245304701000Weighted base
299261252465227983138566164125(4) Very likely15%13%13%23%FHiJ5%15%fHj9%18%FHJ11%19%C18%C9%11%14%12%
238664666351121144637436264126(3) Fairly likely12%12%13%6%16%k21%FGHK9%8%13%HK28%CD17%C7%12%14%13%
5317211818578137232155064125128110238(2) Fairly unlikely27%24%24%16%13%26%Gjk25%Gk16%25%Gk31%C30%C20%24%23%24%
84323208312295299533941659371238209447(1) Very unlikely43%45%43%29%59%GIK31%54%FGIK36%46%GIK10%28%E59%DE45%44%45%
8363628220143134181630412464Don't know4%5%7%26%FHIJ7%7%fH2%21%FHIJ4%11%C8%5%8%a5%6%
5217812531810910339212767599123128251NET: Likely26%25%26%29%H21%36%FgHj19%27%H25%H48%CD35%C16%23%27%25%
13749532749261734377561066123496366318685NET: Unlikely69%70%67%45%73%GiK57%K79%FGIK52%71%GIK41%57%E79%DE69%68%68%
1.981.921.952.31FHJ1.642.21FHJ1.732.11fHJ1.90H2.64CD2.27C1.641.891.961.92Mean
1.091.071.071.280.951.080.981.231.040.951.090.971.051.091.07Standard deviation
0.080.040.050.150.160.070.040.120.040.080.080.040.050.050.03Standard error
Page 25
Pensions Policy ResearchOnline Fieldwork: 27/02/2015 to 05/03/2015
Absolutes/col percents
Q2. Likelihood of retirement in the next yearBase: All respondents
Proportions/Means: Columns Tested (5%, 10% risk level) - A/B - C/D/E - F/G/H/I/J/K - L/M/N* small base

Household incomeRegionLondon
South East(greaterYorkshire£100,000£80,001-£60,001-£40,000-£20,001-NorthernSouth(excludingandEast ofWestEastand theNorthNorth
>£100,000£80,000£60,000£40,000<£20,000IrelandScotlandWalesWestLondon)central)EnglandMidlandsMidlandsHumberWestEastTotal(R)(Q)(P)(O)(N)(M)(L)(K)(J)(I)(H)(G)(F)(E)(D)(C)(B)(A)
21337016538425919704599155107102847798110341000Unweighted base
21**33*68*16138626220**60*40*100*16011010080*90*110*11020*1000Weighted base
2392447303571717118111113192125(4) Very likely11%9%13%15%12%11%16%8%18%17%f11%10%8%14%12%12%17%fk9%12%
26112144341124102314108102114-126(3) Fairly likely9%18%17%13%11%13%5%20%Aefi11%a10%a14%A12%A10%a9%a11%a19%Aefi13%A-13%
68234489504111020472631241417268238(2) Fairly unlikely29%24%34%Mn27%M23%19%20%19%25%20%29%CDik23%31%CDik30%CD15%16%24%41%BCDGI24%
K
915246418012512291549644840315256429447(1) Very unlikely42%46%35%40%47%p48%p58%49%38%49%40%44%40%39%57%BEFgH51%beh38%44%45%
J
21182623-335911106429164Don't know9%3%1%5%7%p9%P-5%9%c5%6%10%C10%C7%c4%2%8%C6%6%
49204591644171126402518192134332251NET: Likely20%27%30%28%24%24%21%28%A28%a26%A25%a23%18%24%a23%31%AF30%AF9%25%
1523471082701751640256811174715565746717685NET: Unlikely71%70%69%67%70%67%79%67%63%68%69%67%71%69%73%67%61%85%Bcegh68%
iJk
1.871.902.072.041.881.871.801.872.081.941.951.881.851.991.771.912.11aDf1.731.92Mean
1.041.031.031.091.071.071.151.031.161.151.011.040.961.071.091.101.150.921.07Standard deviation
0.240.180.120.090.060.070.260.130.180.120.080.110.100.120.130.110.110.160.03Standard error
Page 26
Pensions Policy ResearchOnline Fieldwork: 27/02/2015 to 05/03/2015
Absolutes/col percents
Q2. Likelihood of retirement in the next yearBase: All respondents
Proportions/Means: Columns Tested (5%, 10% risk level) - A/B/C/D/E/F/G/H/I/J/K/L - M/N/O/P/Q/R* small base; ** very small base (under 30) ineligible for sig testing

Compulsory advice atComfort with managing ownPlan to use pensionResponsibility for financialretirementpensionfunds pre-retirementTrust in parties re. pensionsRetire in next yeardecisions
NET:NET:NET:NET:NET:NotDisagreeNET: AgreeUncomfortableComfortableNoYesOtherLDLabourConservativeUnlikelyLikelyat allJointSoleTotal
(O)(N)(M)(L)(K)(J)(I)(H)(G)(F)(E)(D)(C)(B)(A)
28164734457759913713432164291686250164455391000Unweighted base
27864734557460013313131*16028868525117**4485351000Weighted base
3783358382211581845-125-6659125(4) Very likely13%13%10%15%m14%16%12%25%Gi11%16%-50%E-15%a11%12%
4279438165192062144-12626658126(3) Fairly likely15%12%12%14%11%14%15%19%13%15%-50%E14%15%a11%13%
7015773151139372793886238-4115119238(2) Fairly unlikely25%24%21%26%m23%28%21%29%24%30%i35%D-26%26%22%24%
109296178225280516187696447-10172265447(1) Very unlikely39%46%o52%L39%47%j38%47%FH24%47%FH33%65%D-57%38%50%B45%
2032163334571717--1293564Don't know7%5%5%6%6%4%5%3%4%6%--4%7%6%6%
79162781641474035143989-2512132117251NET: Likely28%25%23%29%M24%30%27%44%Gi24%31%-100%E14%29%A22%25%
179453251376419888917114183685-14287384685NET: Unlikely64%70%o73%L66%70%66%68%53%71%h63%100%D-83%64%72%B68%
2.031.921.802.04M1.912.09k1.912.46GI1.882.14Gi1.353.50E1.552.06A1.821.92Mean
1.081.071.031.091.091.101.071.141.051.080.480.500.751.091.041.07Standard deviation
0.070.040.060.050.050.100.100.210.080.070.020.030.190.050.050.03Standard error
Page 27
Pensions Policy ResearchOnline Fieldwork: 27/02/2015 to 05/03/2015
Absolutes/col percents
Q2. Likelihood of retirement in the next yearBase: All respondents
Proportions/Means: Columns Tested (5%, 10% risk level) - A/B/C - D/E - F/G/H/I - J/K - L/M - N/O* small base; ** very small base (under 30) ineligible for sig testing

Pension planEmploymentAgeGenderWorking
Not workingpart timeWorkingand notNot working(fewer thanfull time
Occupatseekingbut seeking30 hrs a(30+ hrs aNET: NotNET:Both-ionalPersonalworkworkweek)week)workingWorking65+60-6455-59FemaleMaleTotal(N)(M)(L)(K)(J)(I)(H)(G)(F)(E)(D)(C)(B)(A)
201711490104362975631408601612156244895111000Unweighted base
19771048710836*3025531458551612156245304701000Weighted base
3982901273184191141233885876133Yes20%M12%18%M11%19%10%15%I13%13%8%15%E14%E11%16%B13%
106440266571719832973527115129356305294600No54%62%LN55%52%46%66%GhJK59%g51%62%Gjk72%CD60%57%58%63%60%
52187132401374141522153353181167100267Don't know26%26%27%37%FHI35%24%25%36%FHI25%21%25%29%E32%A21%27%
Page 28
Pensions Policy ResearchOnline Fieldwork: 27/02/2015 to 05/03/2015
Absolutes/col percents
Q3. Plan to use the new freedoms to withdraw cash from pension above the 25% tax-free allowanceBase: All respondents
Proportions/Means: Columns Tested (5%, 10% risk level) - A/B - C/D/E - F/G/H/I/J/K - L/M/N* small base

Household incomeRegionLondon
South East(greaterYorkshire£100,000£80,001-£60,001-£40,000-£20,001-NorthernSouth(excludingandEast ofWestEastand theNorthNorth
>£100,000£80,000£60,000£40,000<£20,000IrelandScotlandWalesWestLondon)central)EnglandMidlandsMidlandsHumberWestEastTotal(R)(Q)(P)(O)(N)(M)(L)(K)(J)(I)(H)(G)(F)(E)(D)(C)(B)(A)
21337016538425919704599155107102847798110341000Unweighted base
21**33*68*16138626220**60*40*100*16011010080*90*110*11020*1000Weighted base
3414204936274142671316710253133Yes14%12%21%n13%13%14%11%12%10%14%g16%dG7%13%20%CDG8%9%22%CDfGjk14%13%
132543104224148163029698667674258685810600No62%76%MN64%65%58%57%80%50%71%aBEHK69%ABEHK54%61%67%aBeHK53%64%k62%52%50%60%
54113611377223717483621222532287267Don't know24%12%15%23%29%PQ30%PQ10%38%bFIJ18%17%30%I32%fIj21%27%i28%i29%I25%36%fIj27%
Page 29
Pensions Policy ResearchOnline Fieldwork: 27/02/2015 to 05/03/2015
Absolutes/col percents
Q3. Plan to use the new freedoms to withdraw cash from pension above the 25% tax-free allowanceBase: All respondents
Proportions/Means: Columns Tested (5%, 10% risk level) - A/B/C/D/E/F/G/H/I/J/K/L - M/N/O/P/Q/R* small base; ** very small base (under 30) ineligible for sig testing

Compulsory advice atComfort with managing ownPlan to use pensionResponsibility for financialretirementpensionfunds pre-retirementTrust in parties re. pensionsRetire in next yeardecisions
NET:NET:NET:NET:NET:NotDisagreeNET: AgreeUncomfortableComfortableNoYesOtherLDLabourConservativeUnlikelyLikelyat allJointSoleTotal
(O)(N)(M)(L)(K)(J)(I)(H)(G)(F)(E)(D)(C)(B)(A)
28164734457759913713432164291686250164455391000Unweighted base
27864734557460013313131*16028868525117**4485351000Weighted base
458225103-1331861946884036268133Yes16%13%7%18%M-100%K14%19%12%16%13%16%19%14%13%13%
179385233327600-78201031824191479261330600No65%59%67%L57%100%J-60%63%64%63%61%59%54%58%62%60%
5418088143--3463860178635125137267Don't know19%28%O25%25%--26%19%24%21%26%25%27%28%26%27%
Page 30
Pensions Policy ResearchOnline Fieldwork: 27/02/2015 to 05/03/2015
Absolutes/col percents
Q3. Plan to use the new freedoms to withdraw cash from pension above the 25% tax-free allowanceBase: All respondents
Proportions/Means: Columns Tested (5%, 10% risk level) - A/B/C - D/E - F/G/H/I - J/K - L/M - N/O* small base; ** very small base (under 30) ineligible for sig testing
Pension planEmploymentAgeGenderWorking
Not workingpart timeWorkingand notNot working(fewer thanfull time
Occupatseekingbut seeking30 hrs a(30+ hrs aNET: NotNET:Both-ionalPersonalworkworkweek)week)workingWorking65+60-6455-59FemaleMaleTotal(N)(M)(L)(K)(J)(I)(H)(G)(F)(E)(D)(C)(B)(A)
4286931273088191181334905384137Unweighted base
39*82*90*12**7**31**84*19**11412**33*88*58*76*133Weighted base
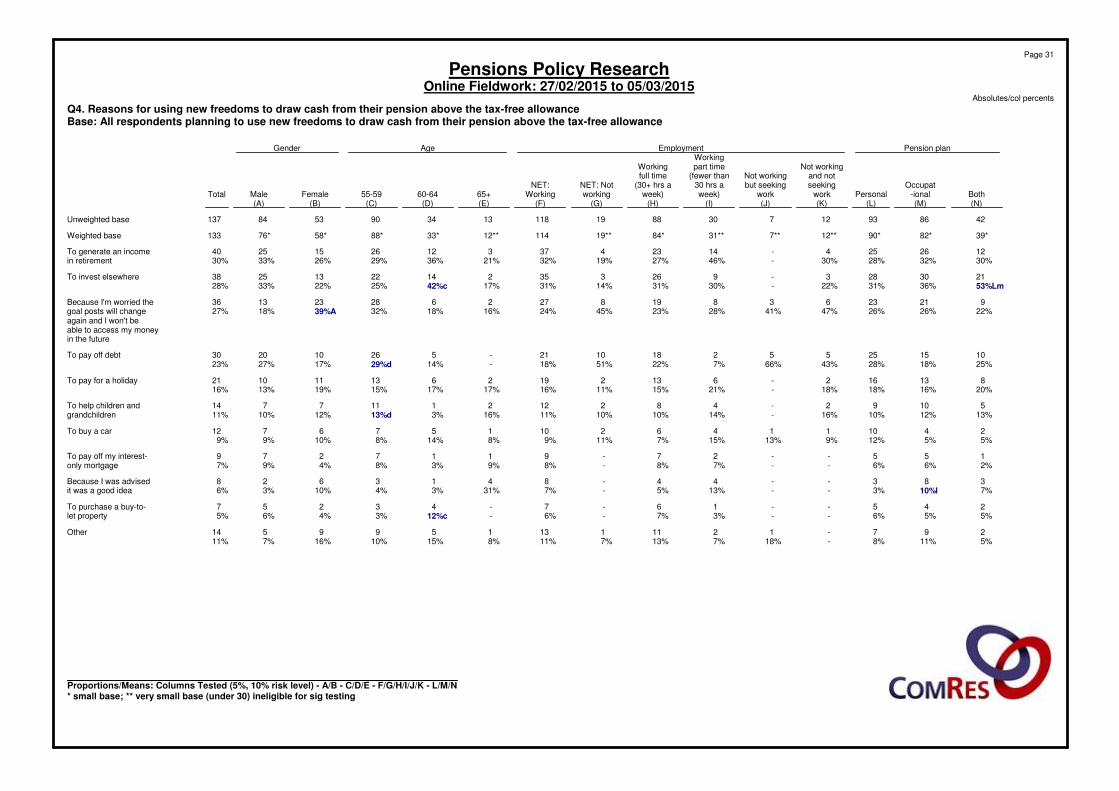
1226254-142343731226152540To generate an income30%32%28%30%-46%27%19%32%21%36%29%26%33%30%in retirement
2130283-92633521422132538To invest elsewhere53%Lm36%31%22%-30%31%14%31%17%42%c25%22%33%28%
92123638198272628231336Because I'm worried the22%26%26%47%41%28%23%45%24%16%18%32%39%A18%27%goal posts will change
again and I won't beable to access my moneyin the future
101525552181021-526102030To pay off debt25%18%28%43%66%7%22%51%18%-14%29%d17%27%23%
813162-6132192613111021To pay for a holiday20%16%18%18%-21%15%11%16%17%17%15%19%13%16%
51092-4821221117714To help children and13%12%10%16%-14%10%10%11%16%3%13%d12%10%11%grandchildren
241011462101576712To buy a car5%5%12%9%13%15%7%11%9%8%14%8%10%9%9%
155--27-9117279To pay off my interest-2%6%6%--7%8%-8%9%3%8%4%9%7%only mortgage
383--44-8413628Because I was advised7%10%l3%--13%5%-7%31%3%4%10%3%6%it was a good idea
245--16-7-43257To purchase a buy-to-5%5%6%--3%7%-6%-12%c3%4%6%5%let property
297-12111131599514Other5%11%8%-18%7%13%7%11%8%15%10%16%7%11%
Page 31
Pensions Policy ResearchOnline Fieldwork: 27/02/2015 to 05/03/2015
Absolutes/col percents
Q4. Reasons for using new freedoms to draw cash from their pension above the tax-free allowanceBase: All respondents planning to use new freedoms to draw cash from their pension above the tax-free allowance
Proportions/Means: Columns Tested (5%, 10% risk level) - A/B - C/D/E - F/G/H/I/J/K - L/M/N* small base; ** very small base (under 30) ineligible for sig testing

Household incomeRegionLondon
South East(greaterYorkshire£100,000£80,001-£60,001-£40,000-£20,001-NorthernSouth(excludingandEast ofWestEastand theNorthNorth
>£100,000£80,000£60,000£40,000<£20,000IrelandScotlandWalesWestLondon)central)EnglandMidlandsMidlandsHumberWestEastTotal(R)(Q)(P)(O)(N)(M)(L)(K)(J)(I)(H)(G)(F)(E)(D)(C)(B)(A)
341522513529514257131769255137Unweighted base
3**4**14**20**49*36*2**7**4**14**26**7**13**16**7**10**25**3**133Weighted base
12461312-3247264129140To generate an income30%50%25%28%26%34%-35%60%29%28%29%45%24%15%23%35%19%30%in retirement
13581010-3278144116138To invest elsewhere31%74%38%38%20%28%-44%40%48%30%16%32%23%15%10%25%41%28%
-1191012-3266237--7-36Because I'm worried the-27%6%43%21%34%-35%40%44%25%31%25%42%--29%-27%goal posts will change
again and I won't beable to access my moneyin the future
1132131112-54216226-30To pay off debt39%26%21%8%26%30%54%22%-36%15%27%7%35%33%21%23%-23%
--4475-1-15143-24-21To pay for a holiday--29%19%14%14%-11%-7%21%16%31%18%-21%16%-16%
--253411113--4-12114To help children and--13%24%5%11%46%13%20%7%13%--24%-10%8%22%11%grandchildren
-1--55---132--114-12To buy a car-23%--10%15%---8%12%29%--18%10%15%-9%
1--1612----11--14-9To pay off my interest-39%--5%12%3%100%----13%8%--10%15%-7%only mortgage
---241-----1-1-1418Because I was advised---11%8%3%-----16%-5%-12%17%19%6%it was a good idea
2-11211---1--2-21-7To purchase a buy-to-70%-6%5%4%3%54%---4%--12%-21%4%-5%let property
--1184-2-311-3311-14Other--7%5%15%10%-22%-23%4%13%-17%36%12%4%-11%
Page 32
Pensions Policy ResearchOnline Fieldwork: 27/02/2015 to 05/03/2015
Absolutes/col percents
Q4. Reasons for using new freedoms to draw cash from their pension above the tax-free allowanceBase: All respondents planning to use new freedoms to draw cash from their pension above the tax-free allowance
Proportions/Means: Columns Tested (5%, 10% risk level) - A/B/C/D/E/F/G/H/I/J/K/L - M/N/O/P/Q/R* small base; ** very small base (under 30) ineligible for sig testing

Compulsory advice atComfort with managing ownPlan to use pensionResponsibility for financialretirementpensionfunds pre-retirementTrust in parties re. pensionsRetire in next yeardecisions
NET:NET:NET:NET:NET:NotDisagreeNET: AgreeUncomfortableComfortableNoYesOtherLDLabourConservativeUnlikelyLikelyat allJointSoleTotal
(O)(N)(M)(L)(K)(J)(I)(H)(G)(F)(E)(D)(C)(B)(A)
458625107-1371962147914136470137Unweighted base
45*82*25**103-**13318**6**19**46*88*40*3**62*68*133Weighted base
1127436-40725172118-172340To generate an income24%32%16%35%-30%36%34%28%36%24%43%E-27%34%30%in retirement
1422632-38425142413-172138To invest elsewhere30%27%24%31%-28%24%37%24%30%27%32%-27%31%28%
1518531-36242102583102336Because I'm worried the32%22%20%30%-27%10%65%11%22%28%21%100%16%34%B27%goal posts will change
again and I won't beable to access my moneyin the future
1217622-304359245292030To pay off debt26%21%26%21%-23%23%47%26%20%28%D12%67%14%29%B23%
1011317-211-49154-111021To pay for a holiday23%13%13%16%-16%5%-20%19%17%10%-18%15%16%
41049-14122495-6814To help children and9%12%16%9%-11%5%32%13%8%10%11%-10%12%11%grandchildren
66-11-121-16102-5712To buy a car14%8%-11%-9%5%-5%14%12%5%-8%11%9%
2718-94-3263-549To pay off my interest-4%8%4%8%-7%22%-15%4%6%8%-8%6%7%only mortgage
3535-81--443-448Because I was advised7%6%14%4%-6%7%--9%4%8%-6%6%6%it was a good idea
25-7-72--252-527To purchase a buy-to-5%6%-7%-5%12%--4%6%5%-8%3%5%let property
31058-142-1610429314Other7%12%20%7%-11%9%-5%13%11%11%67%15%A4%11%
Page 33
Pensions Policy ResearchOnline Fieldwork: 27/02/2015 to 05/03/2015
Absolutes/col percents
Q4. Reasons for using new freedoms to draw cash from their pension above the tax-free allowanceBase: All respondents planning to use new freedoms to draw cash from their pension above the tax-free allowance
Proportions/Means: Columns Tested (5%, 10% risk level) - A/B/C - D/E - F/G/H/I - J/K - L/M - N/O* small base; ** very small base (under 30) ineligible for sig testing

Pension planEmploymentAgeGenderWorking
Not workingpart timeWorkingand notNot working(fewer thanfull time
Occupatseekingbut seeking30 hrs a(30+ hrs aNET: NotNET:Both-ionalPersonalworkworkweek)week)workingWorking65+60-6455-59FemaleMaleTotal(N)(M)(L)(K)(J)(I)(H)(G)(F)(E)(D)(C)(B)(A)
4286931273088191181334905384137Unweighted base
39*82*90*12**7**31**84*19**11412**33*88*58*76*133Weighted base
916214-519424252082028(4) Very well23%19%23%34%-17%22%22%21%20%16%23%13%27%b21%
22435044154986352343284371(3) Fairly well56%52%55%34%52%48%58%41%55%45%69%c49%49%57%53%
7161531812420451515924(2) Not very well19%20%17%23%14%28%14%19%18%35%15%17%26%A12%18%
174122537--107410(1) Not at all well2%9%5%9%34%7%6%18%6%--12%D12%5%8%
---------------Don't know---------------
315971842067128782863366399NET: Well79%71%79%68%52%65%80%62%76%65%85%71%62%83%B74%
824194311177274525221334NET: Not well21%29%21%32%48%35%20%38%24%35%15%29%38%A17%26%
3.002.822.982.932.192.752.972.652.912.853.012.822.643.05B2.87Mean
0.730.850.771.010.980.840.771.040.790.760.570.920.860.760.83Standard deviation
0.110.090.080.290.370.150.080.240.070.210.100.100.120.080.07Standard error
Page 34
Pensions Policy ResearchOnline Fieldwork: 27/02/2015 to 05/03/2015
Absolutes/col percents
Q5. Understanding of tax implicationsBase: All respondents planning to use new freedoms to draw cash from their pension above the tax-free allowance
Proportions/Means: Columns Tested (5%, 10% risk level) - A/B - C/D/E - F/G/H/I/J/K - L/M/N* small base; ** very small base (under 30) ineligible for sig testing

Household incomeRegionLondon
South East(greaterYorkshire£100,000£80,001-£60,001-£40,000-£20,001-NorthernSouth(excludingandEast ofWestEastand theNorthNorth
>£100,000£80,000£60,000£40,000<£20,000IrelandScotlandWalesWestLondon)central)EnglandMidlandsMidlandsHumberWestEastTotal(R)(Q)(P)(O)(N)(M)(L)(K)(J)(I)(H)(G)(F)(E)(D)(C)(B)(A)
341522513529514257131769255137Unweighted base
3**4**14**20**49*36*2**7**4**14**26**7**13**16**7**10**25**3**133Weighted base
233410622235-42-34128(4) Very well69%73%19%19%21%17%100%33%40%22%20%-30%12%-31%15%37%21%
117122717-226154795713271(3) Fairly well31%27%52%59%54%48%-33%40%42%59%55%55%58%67%69%51%63%53%
--4496-21333251-4-24(2) Not very well--29%22%17%17%-24%20%22%12%45%15%30%15%-17%-18%
----47-1-22---1-4-10(1) Not at all well----8%18%-11%-14%9%---18%-16%-8%
-------------------Don't know-------------------
34101637232539204111151016399NET: Well100%100%71%78%75%65%100%65%80%64%79%55%85%70%67%100%66%100%74%
--441213-31553252-8-34NET: Not well--29%22%25%35%-35%20%36%21%45%15%30%33%-34%-26%
3.693.732.912.982.882.634.002.873.202.712.902.553.142.822.493.312.653.372.87Mean
0.570.510.710.650.830.980.001.070.861.000.830.540.680.640.840.490.950.600.83Standard deviation
0.330.260.180.140.120.170.000.360.380.270.170.200.190.160.340.160.190.270.07Standard error
Page 35
Pensions Policy ResearchOnline Fieldwork: 27/02/2015 to 05/03/2015
Absolutes/col percents
Q5. Understanding of tax implicationsBase: All respondents planning to use new freedoms to draw cash from their pension above the tax-free allowance
Proportions/Means: Columns Tested (5%, 10% risk level) - A/B/C/D/E/F/G/H/I/J/K/L - M/N/O/P/Q/R* small base; ** very small base (under 30) ineligible for sig testing

Compulsory advice atComfort with managing ownPlan to use pensionResponsibility for financialretirementpensionfunds pre-retirementTrust in parties re. pensionsRetire in next yeardecisions
NET:NET:NET:NET:NET:NotDisagreeNET: AgreeUncomfortableComfortableNoYesOtherLDLabourConservativeUnlikelyLikelyat allJointSoleTotal
(O)(N)(M)(L)(K)(J)(I)(H)(G)(F)(E)(D)(C)(B)(A)
458625107-1371962147914136470137Unweighted base
45*82*25**103-**13318**6**19**46*88*40*3**62*68*133Weighted base
1213127-286-5916102121428(4) Very well26%16%4%26%-21%31%-28%20%18%25%67%19%21%21%
25431059-7111310264624-373471(3) Fairly well56%53%39%57%-53%59%49%51%55%52%60%-60%49%53%
8161013-2412411194-91524(2) Not very well18%20%41%13%-18%5%35%21%24%22%10%-14%23%18%
-945-1011--7214510(1) Not at all well-11%O16%4%-8%4%16%--8%5%33%7%7%8%
----------------Don't know----------------
37571186-99173153562342494899NET: Well82%69%43%83%-74%91%49%79%76%70%85%e67%79%70%74%
8251418-34234112661132034NET: Not well18%31%57%17%-26%9%51%21%24%30%d15%33%21%30%26%
3.08N2.742.313.05-2.873.182.333.082.962.803.053.002.902.842.87Mean
0.670.870.800.75-0.830.730.810.710.670.830.751.700.780.840.83Standard deviation
0.100.090.160.07-0.070.170.330.160.100.090.120.980.100.100.07Standard error
Page 36
Pensions Policy ResearchOnline Fieldwork: 27/02/2015 to 05/03/2015
Absolutes/col percents
Q5. Understanding of tax implicationsBase: All respondents planning to use new freedoms to draw cash from their pension above the tax-free allowance
Proportions/Means: Columns Tested (5%, 10% risk level) - A/B/C - D/E - F/G/H/I - J/K - L/M - N/O* small base; ** very small base (under 30) ineligible for sig testing

Pension planEmploymentAgeGenderWorking
Not workingpart timeWorkingand notNot working(fewer thanfull time
Occupatseekingbut seeking30 hrs a(30+ hrs aNET: NotNET:Both-ionalPersonalworkworkweek)week)workingWorking65+60-6455-59FemaleMaleTotal(N)(M)(L)(K)(J)(I)(H)(G)(F)(E)(D)(C)(B)(A)
106440265551719433372527115129355281318599Unweighted base
10644026657*17**19832973*527115129356305294600Weighted base
391859415569151202203648156112127239I don't need the money37%42%l35%26%30%35%46%GIK27%42%GiK31%37%44%E37%43%40%right now
2811189135511031815422301198685171I will keep my pension27%25%33%M23%29%26%31%24%29%19%23%33%DE28%29%29%invested and draw money
when I need it
30895763386991073029575858116I will look to secure a28%m20%21%11%17%19%21%gk12%20%k26%C23%c16%19%20%19%lifetime income with
the rest of my pensionpot
2470508525581383142063375996I don't want to pay22%16%19%14%32%13%18%18%16%12%15%18%12%20%B16%extra tax on the money
1363281522140176182050483078I don't fully12%14%11%27%FHI12%11%12%24%FHI12%7%16%E14%e16%a10%13%understand the
implications
17433354133795010840194059It's a tax-efficient16%m10%12%9%22%7%11%i12%9%9%7%11%6%14%B10%place to leave my
savings
41392-610216331213618I was advised it was a4%3%3%4%-3%3%3%3%3%3%3%4%2%3%bad idea
947269135201055261721333164Other8%11%10%15%H6%18%FH6%13%H10%H23%Cd13%C6%11%11%11%
Page 37
Pensions Policy ResearchOnline Fieldwork: 27/02/2015 to 05/03/2015
Absolutes/col percents
Q6. Reasons for NOT using new freedoms to draw cash from their pension above the tax-free allowanceBase: All respondents NOT planning to use new freedoms to draw cash from their pension above the tax-free allowance
Proportions/Means: Columns Tested (5%, 10% risk level) - A/B - C/D/E - F/G/H/I/J/K - L/M/N* small base; ** very small base (under 30) ineligible for sig testing
Household incomeRegionLondon
South East(greaterYorkshire£100,000£80,001-£60,001-£40,000-£20,001-NorthernSouth(excludingandEast ofWestEastand theNorthNorth
>£100,000£80,000£60,000£40,000<£20,000IrelandScotlandWalesWestLondon)central)EnglandMidlandsMidlandsHumberWestEastTotal(R)(Q)(P)(O)(N)(M)(L)(K)(J)(I)(H)(G)(F)(E)(D)(C)(B)(A)
132545106221149153532698466684450615817599Unweighted base
13**25**43*10422414816**30*29*69*86*67*67*42*58*68*58*10**600Weighted base
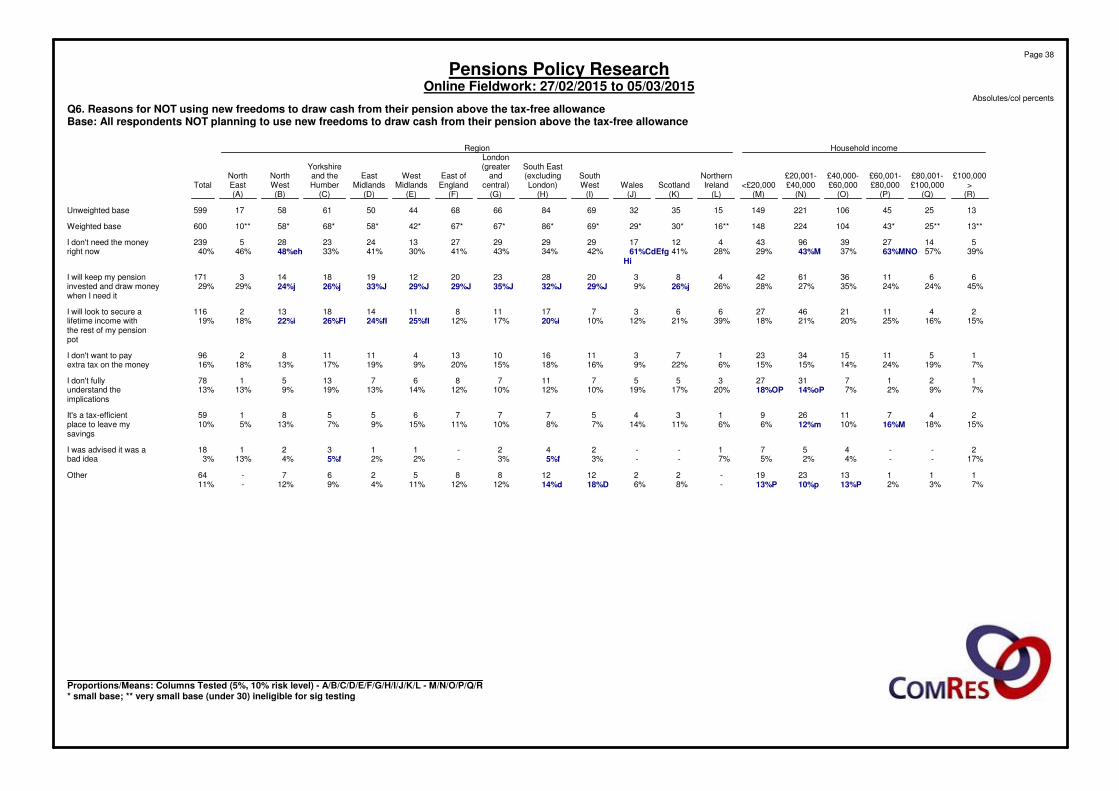
514273996434121729292927132423285239I don't need the money39%57%63%MNO37%43%M29%28%41%61%CdEfg42%34%43%41%30%41%33%48%eh46%40%right now
Hi
661136614248320282320121918143171I will keep my pension45%24%24%35%27%28%26%26%j9%29%J32%J35%J29%J29%J33%J26%j24%j29%29%invested and draw money
when I need it
2411214627663717118111418132116I will look to secure a15%16%25%20%21%18%39%21%12%10%20%i17%12%25%fI24%fI26%FI22%i18%19%lifetime income with
the rest of my pensionpot
151115342317311161013411118296I don't want to pay7%19%24%14%15%15%6%22%9%16%18%15%20%9%19%17%13%18%16%extra tax on the money
121731273557117867135178I don't fully7%9%2%7%14%oP18%OP20%17%19%10%12%10%12%14%13%19%9%13%13%understand the
implications
2471126913457776558159It's a tax-efficient15%18%16%M10%12%m6%6%11%14%7%8%10%11%15%9%7%13%5%10%place to leave my
savings
2--4571--242-1132118I was advised it was a17%--4%2%5%7%--3%5%f3%-2%2%5%f4%13%3%bad idea
111132319-221212885267-64Other7%3%2%13%P10%p13%P-8%6%18%D14%d12%12%11%4%9%12%-11%
Page 38
Pensions Policy ResearchOnline Fieldwork: 27/02/2015 to 05/03/2015
Absolutes/col percents
Q6. Reasons for NOT using new freedoms to draw cash from their pension above the tax-free allowanceBase: All respondents NOT planning to use new freedoms to draw cash from their pension above the tax-free allowance
Proportions/Means: Columns Tested (5%, 10% risk level) - A/B/C/D/E/F/G/H/I/J/K/L - M/N/O/P/Q/R* small base; ** very small base (under 30) ineligible for sig testing

Compulsory advice atComfort with managing ownPlan to use pensionResponsibility for financialretirementpensionfunds pre-retirementTrust in parties re. pensionsRetire in next yeardecisions
NET:NET:NET:NET:NET:NotDisagreeNET: AgreeUncomfortableComfortableNoYesOtherLDLabourConservativeUnlikelyLikelyat allJointSoleTotal
(O)(N)(M)(L)(K)(J)(I)(H)(G)(F)(E)(D)(C)(B)(A)
182382232328599-80201051844181469257333599Unweighted base
179385233327600-**78*20**1031824191479**261330600Weighted base
7814886137239-3243979175554101135239I don't need the money43%38%37%42%40%-41%20%38%43%42%38%43%39%41%40%right now
4711658106171-17623631253618783171I will keep my pension26%30%25%32%m29%-21%29%23%34%GI30%25%7%34%A25%29%invested and draw money
when I need it
40725754116-1192634753824766116I will look to secure a22%19%25%L16%19%-14%45%25%i19%18%26%E25%18%20%19%lifetime income with
the rest of my pensionpot
3658345896-14511346825-336396I don't want to pay20%15%15%18%16%-18%24%11%19%g16%17%-13%19%B16%extra tax on the money
1856472378-16-141353174334178I don't fully10%14%20%L7%13%-21%F-14%f7%13%11%46%13%13%13%understand the
implications
1642213459-928214612-263359It's a tax-efficient9%11%9%10%10%-12%10%8%11%11%8%-10%10%10%place to leave my
savings
11610818-2153134-71118I was advised it was a1%4%O4%2%3%-3%5%5%f2%3%3%-3%3%3%bad idea
2335174264-8214244215-283764Other13%9%7%13%M11%-10%10%13%13%10%10%-11%11%11%
Page 39
Pensions Policy ResearchOnline Fieldwork: 27/02/2015 to 05/03/2015
Absolutes/col percents
Q6. Reasons for NOT using new freedoms to draw cash from their pension above the tax-free allowanceBase: All respondents NOT planning to use new freedoms to draw cash from their pension above the tax-free allowance
Proportions/Means: Columns Tested (5%, 10% risk level) - A/B/C - D/E - F/G/H/I - J/K - L/M - N/O* small base; ** very small base (under 30) ineligible for sig testing

Pension planEmploymentAgeGenderWorking
Not workingpart timeWorkingand notNot working(fewer thanfull time
Occupatseekingbut seeking30 hrs a(30+ hrs aNET: NotNET:Both-ionalPersonalworkworkweek)week)workingWorking65+60-6455-59FemaleMaleTotal(N)(M)(L)(K)(J)(I)(H)(G)(F)(E)(D)(C)(B)(A)
201711490104362975631408601612156244895111000Unweighted base
19771048710836*3025531458551612156245304701000Weighted base
173535519376473743242953(4) Very likely9%M5%7%5%3%3%7%I4%5%2%3%7%dE4%6%5%
378585962197151171737786172133(3) Fairly likely19%M12%17%M8%17%I7%17%fGIK11%14%I11%17%ce12%12%15%b13%
61173134181275140312163954153113134246(2) Fairly unlikely31%m24%28%17%33%K25%k25%k21%25%k24%25%24%21%28%B25%
45253143508137156582937381198199153352(1) Very unlikely23%36%LN29%n46%FHJ23%46%FHJ28%40%Hj34%H45%C38%32%37%33%35%
38164902695912334182283615313483217Don't know19%23%l19%24%24%20%22%24%21%17%17%25%De25%A18%22%
541201191473013421164214412085101185NET: Likely27%M17%24%M13%20%i10%24%FGIK15%19%I13%21%e19%e16%21%B19%
105426278692021329689509112135351311287598NET: Unlikely53%60%n57%63%h56%70%FgHj54%61%h60%H70%C63%c56%59%61%60%
2.16M1.822.03M1.632.001.602.04FGIK1.721.88IK1.631.83E1.93E1.771.94B1.85Mean
0.960.920.960.910.830.800.970.900.930.800.890.970.920.940.93Standard deviation
0.070.040.050.100.160.050.050.090.040.070.070.040.050.050.03Standard error
Page 40
Pensions Policy ResearchOnline Fieldwork: 27/02/2015 to 05/03/2015
Absolutes/col percents
Q7. Likelihood of saving more money into pensionBase: All respondents
Proportions/Means: Columns Tested (5%, 10% risk level) - A/B - C/D/E - F/G/H/I/J/K - L/M/N* small base

Household incomeRegionLondon
South East(greaterYorkshire£100,000£80,001-£60,001-£40,000-£20,001-NorthernSouth(excludingandEast ofWestEastand theNorthNorth
>£100,000£80,000£60,000£40,000<£20,000IrelandScotlandWalesWestLondon)central)EnglandMidlandsMidlandsHumberWestEastTotal(R)(Q)(P)(O)(N)(M)(L)(K)(J)(I)(H)(G)(F)(E)(D)(C)(B)(A)
21337016538425919704599155107102847798110341000Unweighted base
21**33*68*16138626220**60*40*100*16011010080*90*110*11020*1000Weighted base
3361022923158466466253(4) Very likely14%8%8%m6%6%4%11%6%2%5%5%4%6%7%4%6%5%8%5%
510152356193105829171491110142133(3) Fairly likely24%30%MNO22%M14%M15%M7%15%17%i13%8%18%cI16%i14%12%13%9%12%9%13%
53204796584161318352425212627298246(2) Fairly unlikely23%9%30%Q29%Q25%Q22%q20%26%32%i18%22%22%25%26%29%i24%26%41%cfGHI25%
41119531161205151646552739312544434352(1) Very unlikely18%32%28%33%30%46%NOP27%25%40%agk46%ADGhK34%g25%39%aGk39%aGk28%40%adGk39%aGk21%35%
478289656516523323716122423194217Don't know21%20%12%17%25%OP21%p27%26%j11%23%j20%34%BCEFHJ16%15%26%ej21%17%20%22%
81321337828514613372119151517194185NET: Likely39%38%MNO31%Mn21%M20%M11%25%23%i16%13%23%I19%19%19%17%15%18%18%19%
81439100211178103129649051645351717212598NET: Unlikely40%42%57%62%Q55%68%NQ48%51%73%dGhK64%G57%47%64%Gk66%Gk57%64%Gk65%Gk62%60%
2.452.182.13M1.92M1.95M1.602.122.04I1.751.631.93I1.97I1.831.851.90i1.761.812.071.85Mean
1.061.100.980.930.950.841.110.950.820.910.960.920.940.970.880.930.920.920.93Standard deviation
0.260.210.120.080.060.060.300.130.130.100.090.110.100.110.120.110.100.180.03Standard error
Page 41
Pensions Policy ResearchOnline Fieldwork: 27/02/2015 to 05/03/2015
Absolutes/col percents
Q7. Likelihood of saving more money into pensionBase: All respondents
Proportions/Means: Columns Tested (5%, 10% risk level) - A/B/C/D/E/F/G/H/I/J/K/L - M/N/O/P/Q/R* small base; ** very small base (under 30) ineligible for sig testing

Compulsory advice atComfort with managing ownPlan to use pensionResponsibility for financialretirementpensionfunds pre-retirementTrust in parties re. pensionsRetire in next yeardecisions
NET:NET:NET:NET:NET:NotDisagreeNET: AgreeUncomfortableComfortableNoYesOtherLDLabourConservativeUnlikelyLikelyat allJointSoleTotal
(O)(N)(M)(L)(K)(J)(I)(H)(G)(F)(E)(D)(C)(B)(A)
28164734457759913713432164291686250164455391000Unweighted base
27864734557460013313131*16028868525117**4485351000Weighted base
1141143724209-14193714-173653(4) Very likely4%6%4%6%4%15%K7%-9%h7%5%5%-4%7%B5%
2510544876823196205910127-5775133(3) Fairly likely9%16%O13%15%11%17%k15%19%13%20%G15%11%-13%14%13%
7316299136161253294876168682118126246(2) Fairly unlikely26%25%29%24%27%J19%25%27%30%26%25%27%11%26%24%25%
11820111321722550451345922151127154191352(1) Very unlikely43%N31%33%38%38%38%35%42%28%32%31%45%E39%35%36%35%
501387697121152543344164308101107217Don't know18%21%22%l17%20%J12%19%12%21%15%24%D12%49%23%20%22%
36147571249343286347813841-74111185NET: Likely13%23%O17%22%m15%32%K22%19%21%27%20%16%-17%21%b19%
192363212353386757822931673831809273317598NET: Unlikely69%N56%61%62%64%j56%59%69%58%58%56%72%E51%61%59%60%
1.691.98O1.841.881.772.10K1.921.742.032.021.92D1.741.231.821.901.85Mean
0.860.960.880.970.871.140.970.800.980.960.940.900.450.880.970.93Standard deviation
0.060.040.050.040.040.100.090.150.090.060.040.060.160.050.050.03Standard error
Page 42
Pensions Policy ResearchOnline Fieldwork: 27/02/2015 to 05/03/2015
Absolutes/col percents
Q7. Likelihood of saving more money into pensionBase: All respondents
Proportions/Means: Columns Tested (5%, 10% risk level) - A/B/C - D/E - F/G/H/I - J/K - L/M - N/O* small base; ** very small base (under 30) ineligible for sig testing

Pension planEmploymentAgeGenderWorking
Not workingpart timeWorkingand notNot working(fewer thanfull time
Occupatseekingbut seeking30 hrs a(30+ hrs aNET: NotNET:Both-ionalPersonalworkworkweek)week)workingWorking65+60-6455-59FemaleMaleTotal(N)(M)(L)(K)(J)(I)(H)(G)(F)(E)(D)(C)(B)(A)
201711490104362975631408601612156244895111000Unweighted base
19771048710836*3025531458551612156245304701000Weighted base
276678763470131042728615364117Yes - I am fully aware14%m9%16%M7%16%k11%13%9%12%17%C13%10%10%14%b12%of Pension Wise
1003012135011119233623526798249208205413Yes - I am aware of the51%lM42%44%46%31%39%42%43%41%42%46%40%39%44%41%guidance service but
not in detail
703431975019149251704006789314269201470No - I am not aware of36%48%LN40%47%53%49%45%48%47%41%41%50%DE51%A43%47%it
Page 43
Pensions Policy ResearchOnline Fieldwork: 27/02/2015 to 05/03/2015
Absolutes/col percents
Q8. Awareness of Pension WiseBase: All respondents
Proportions/Means: Columns Tested (5%, 10% risk level) - A/B - C/D/E - F/G/H/I/J/K - L/M/N* small base

Household incomeRegionLondon
South East(greaterYorkshire£100,000£80,001-£60,001-£40,000-£20,001-NorthernSouth(excludingandEast ofWestEastand theNorthNorth
>£100,000£80,000£60,000£40,000<£20,000IrelandScotlandWalesWestLondon)central)EnglandMidlandsMidlandsHumberWestEastTotal(R)(Q)(P)(O)(N)(M)(L)(K)(J)(I)(H)(G)(F)(E)(D)(C)(B)(A)
21337016538425919704599155107102847798110341000Unweighted base
21**33*68*16138626220**60*40*100*16011010080*90*110*11020*1000Weighted base
5512165420473122315109812122117Yes - I am fully aware25%15%18%M10%14%M8%21%12%7%12%14%14%10%11%9%11%11%9%12%of Pension Wise
9202669159966241743654539313944547413Yes - I am aware of the42%60%MNoP38%43%41%37%29%39%42%43%41%41%39%39%43%40%49%35%41%guidance service but
not in detail
783076172145102920457250514043544411470No - I am not aware of33%24%44%q47%Q45%Q56%NoQ49%48%51%45%45%45%51%51%48%49%40%56%47%it
Page 44
Pensions Policy ResearchOnline Fieldwork: 27/02/2015 to 05/03/2015
Absolutes/col percents
Q8. Awareness of Pension WiseBase: All respondents
Proportions/Means: Columns Tested (5%, 10% risk level) - A/B/C/D/E/F/G/H/I/J/K/L - M/N/O/P/Q/R* small base; ** very small base (under 30) ineligible for sig testing

Compulsory advice atComfort with managing ownPlan to use pensionResponsibility for financialretirementpensionfunds pre-retirementTrust in parties re. pensionsRetire in next yeardecisions
NET:NET:NET:NET:NET:NotDisagreeNET: AgreeUncomfortableComfortableNoYesOtherLDLabourConservativeUnlikelyLikelyat allJointSoleTotal
(O)(N)(M)(L)(K)(J)(I)(H)(G)(F)(E)(D)(C)(B)(A)
28164734457759913713432164291686250164455391000Unweighted base
27864734557460013313131*16028868525117**4485351000Weighted base
3379219473271622144733734271117Yes - I am fully aware12%12%6%16%M12%20%K12%6%13%15%11%15%e19%9%13%b12%of Pension Wise
116277143248228535123571302751162204207413Yes - I am aware of the42%43%41%43%38%40%39%73%FGI36%45%g40%46%e14%46%A39%41%guidance service but
not in detail
12929218123229853646821153369711202257470No - I am not aware of47%45%53%L40%50%J40%49%fH20%51%FH40%H49%D39%67%45%48%47%it
Page 45
Pensions Policy ResearchOnline Fieldwork: 27/02/2015 to 05/03/2015
Absolutes/col percents
Q8. Awareness of Pension WiseBase: All respondents
Proportions/Means: Columns Tested (5%, 10% risk level) - A/B/C - D/E - F/G/H/I - J/K - L/M - N/O* small base; ** very small base (under 30) ineligible for sig testing

Pension planEmploymentAgeGenderWorking
Not workingpart timeWorkingand notNot working(fewer thanfull time
Occupatseekingbut seeking30 hrs a(30+ hrs aNET: NotNET:Both-ionalPersonalworkworkweek)week)workingWorking65+60-6455-59FemaleMaleTotal(N)(M)(L)(K)(J)(I)(H)(G)(F)(E)(D)(C)(B)(A)
201711490104362975631408601612156244895111000Unweighted base
19771048710836*3025531458551612156245304701000Weighted base
22885012419811699920865857116(4) Very likely11%12%10%11%i11%6%15%I11%i12%I6%9%14%dE11%12%12%
64221148281584178442613561209157149305(3) Fairly likely32%31%30%26%42%ik28%32%30%31%22%28%33%E30%32%31%
40109781225181151323740697176147(2) Fairly unlikely20%15%16%11%6%17%g15%10%15%23%C19%C11%13%16%15%
34117931547583191585440837799177(1) Very unlikely17%17%19%14%11%25%FGHjK15%13%18%h34%CD18%c13%15%21%B18%
3817511940117413051204255417716788255Don't know19%25%24%37%FHI29%24%24%35%FHI24%15%25%E28%E31%A19%26%
853091984119102259603614581296215206421NET: Likely43%43%41%38%53%I34%47%fIk42%42%I28%38%E47%DE41%44%42%
74226171276126164332909180152148175324NET: Unlikely37%32%35%25%17%42%FGHJK30%23%34%GJk57%CD37%C24%28%37%B32%
2.462.522.422.57I2.752.202.61FI2.62I2.46I2.002.38E2.67DE2.542.432.48Mean
0.981.011.011.030.920.991.011.001.020.970.990.991.001.031.02Standard deviation
0.080.040.050.130.180.070.050.100.040.080.080.050.050.050.04Standard error
Page 46
Pensions Policy ResearchOnline Fieldwork: 27/02/2015 to 05/03/2015
Absolutes/col percents
Q9. Likelihood of using Pension Wise serviceBase: All respondents
Proportions/Means: Columns Tested (5%, 10% risk level) - A/B - C/D/E - F/G/H/I/J/K - L/M/N* small base

Household incomeRegionLondon
South East(greaterYorkshire£100,000£80,001-£60,001-£40,000-£20,001-NorthernSouth(excludingandEast ofWestEastand theNorthNorth
>£100,000£80,000£60,000£40,000<£20,000IrelandScotlandWalesWestLondon)central)EnglandMidlandsMidlandsHumberWestEastTotal(R)(Q)(P)(O)(N)(M)(L)(K)(J)(I)(H)(G)(F)(E)(D)(C)(B)(A)
21337016538425919704599155107102847798110341000Unweighted base
21**33*68*16138626220**60*40*100*16011010080*90*110*11020*1000Weighted base
567164433657622119111313122116(4) Very likely25%18%10%10%11%12%31%8%18%I6%13%i10%9%14%i14%i11%11%12%12%
7132556120626201131474325282327387305(3) Fairly likely34%40%M36%M35%M31%M24%31%33%29%31%29%39%CdF25%35%26%25%34%35%31%
211130534031261330141871516103147(2) Fairly unlikely9%3%17%q18%Q14%q15%q16%20%BE14%13%18%BE13%18%be9%17%15%9%14%15%
4817326043-7529281622191317191177(1) Very unlikely17%23%25%n20%16%16%-11%13%29%ABCDG18%a15%22%Ak24%AK14%16%17%6%18%
HjK
35827108854171021332626152637327255Don't know15%16%12%17%28%OP32%OPq21%28%26%21%21%24%26%19%29%33%EHi29%33%e26%
121932721649412251937695334393640499421NET: Likely59%58%Mn46%45%m43%36%62%42%47%37%43%49%cFi34%49%cF40%36%45%47%42%
592862114823181142583040262834294324NET: Unlikely26%26%42%N39%N29%32%16%31%27%42%ABG36%ab28%40%ABg32%31%31%26%20%32%
2.792.632.362.422.532.483.192.54I2.69fI2.182.49I2.57fI2.282.48i2.56I2.47i2.54I2.792.48Mean
1.101.121.020.991.001.050.780.901.051.021.020.951.031.091.031.041.020.871.02Standard deviation
0.260.210.130.080.060.080.200.130.180.120.090.110.120.130.140.130.110.180.04Standard error
Page 47
Pensions Policy ResearchOnline Fieldwork: 27/02/2015 to 05/03/2015
Absolutes/col percents
Q9. Likelihood of using Pension Wise serviceBase: All respondents
Proportions/Means: Columns Tested (5%, 10% risk level) - A/B/C/D/E/F/G/H/I/J/K/L - M/N/O/P/Q/R* small base; ** very small base (under 30) ineligible for sig testing

Compulsory advice atComfort with managing ownPlan to use pensionResponsibility for financialretirementpensionfunds pre-retirementTrust in parties re. pensionsRetire in next yeardecisions
NET:NET:NET:NET:NET:NotDisagreeNET: AgreeUncomfortableComfortableNoYesOtherLDLabourConservativeUnlikelyLikelyat allJointSoleTotal
(O)(N)(M)(L)(K)(J)(I)(H)(G)(F)(E)(D)(C)(B)(A)
28164734457759913713432164291686250164455391000Unweighted base
27864734557460013313131*16028868525117**4485351000Weighted base
1896446762261732832892424569116(4) Very likely7%15%O13%12%10%20%K13%9%18%f11%13%10%13%10%13%12%
58236105191162464794210022071-140166305(3) Fairly likely21%36%O30%33%27%35%k36%g28%26%35%g32%28%-31%31%31%
52905190104162662149895236777147(2) Fairly unlikely19%n14%15%16%17%12%20%19%13%17%13%21%E20%15%14%15%
8575581081332315629571045628887177(1) Very unlikely31%N12%17%19%22%18%12%20%18%20%I15%22%E13%20%16%18%
6414988119139222674050183479109138255Don't know23%23%25%21%23%j16%20%23%25%f17%27%D19%54%24%26%26%
7633214925722373641271133309952185234421NET: Likely27%51%O43%45%37%54%K49%38%44%46%45%d38%13%41%44%42%
137166109198237394113501061931086154164324NET: Unlikely49%N26%32%34%40%J29%32%40%31%37%28%43%E33%34%31%32%
2.052.71O2.522.472.332.68K2.622.342.582.452.59D2.312.282.422.542.48Mean
1.010.951.021.011.031.060.931.021.101.001.011.011.231.011.021.02Standard deviation
0.070.040.060.050.050.100.090.200.100.060.040.070.470.060.050.04Standard error
Page 48
Pensions Policy ResearchOnline Fieldwork: 27/02/2015 to 05/03/2015
Absolutes/col percents
Q9. Likelihood of using Pension Wise serviceBase: All respondents
Proportions/Means: Columns Tested (5%, 10% risk level) - A/B/C - D/E - F/G/H/I - J/K - L/M - N/O* small base; ** very small base (under 30) ineligible for sig testing

Pension planEmploymentAgeGenderWorking
Not workingpart timeWorkingand notNot working(fewer thanfull time
Occupatseekingbut seeking30 hrs a(30+ hrs aNET: NotNET:Both-ionalPersonalworkworkweek)week)workingWorking65+60-6455-59FemaleMaleTotal(N)(M)(L)(K)(J)(I)(H)(G)(F)(E)(D)(C)(B)(A)
201711490104362975631408601612156244895111000Unweighted base
19771048710836*3025531458551612156245304701000Weighted base
4916511314763145212083938152119110229(4) Strongly agree25%23%23%13%19%21%k26%GiK15%24%GK24%18%24%d22%23%23%
832972055214126225673526193264228191418(3) Tend to agree42%42%42%48%39%42%41%46%41%38%43%42%43%41%42%
421349820765972716234511059397190(2) Tend to disagree21%19%20%19%20%22%18%19%19%21%24%C17%18%21%19%
1364389529441474212048394988(1) Strongly disagree7%9%8%8%14%10%8%10%9%13%C9%8%7%10%9%
950341231842156061356512475Don't know5%7%7%11%i8%6%8%11%i7%4%6%9%E10%A5%8%
132462317672118937088560100132416347300647NET: Agree67%65%65%62%58%63%67%61%65%62%61%67%65%64%65%
56197136291295141422365570153132145278NET: Disagree28%28%28%27%34%31%h26%29%28%34%C33%C24%25%31%B28%
2.892.852.872.752.682.792.92GIk2.732.872.762.742.92De2.892.812.85Mean
0.880.910.880.830.980.910.900.870.910.980.880.880.870.930.90Standard deviation
0.060.040.040.090.170.050.040.080.030.080.060.040.040.040.03Standard error
Page 49
Pensions Policy ResearchOnline Fieldwork: 27/02/2015 to 05/03/2015
Absolutes/col percents
Q10. Agreement that receiving financial advice at retirement should be compulsoryBase: All respondents
Proportions/Means: Columns Tested (5%, 10% risk level) - A/B - C/D/E - F/G/H/I/J/K - L/M/N* small base

Household incomeRegionLondon
South East(greaterYorkshire£100,000£80,001-£60,001-£40,000-£20,001-NorthernSouth(excludingandEast ofWestEastand theNorthNorth
>£100,000£80,000£60,000£40,000<£20,000IrelandScotlandWalesWestLondon)central)EnglandMidlandsMidlandsHumberWestEastTotal(R)(Q)(P)(O)(N)(M)(L)(K)(J)(I)(H)(G)(F)(E)(D)(C)(B)(A)
21337016538425919704599155107102847798110341000Unweighted base
21**33*68*16138626220**60*40*100*16011010080*90*110*11020*1000Weighted base
711133697497131117352021211735265229(4) Strongly agree33%33%m19%22%25%m19%36%21%29%17%22%18%21%27%19%31%dGhI24%26%23%
71133621601209301547665039264039498418(3) Tend to agree33%34%48%38%41%46%44%50%cE38%47%cE41%46%e39%33%44%36%45%38%42%
3412427636411720351918172114186190(2) Tend to disagree14%12%18%26%Mq20%m14%20%19%18%20%22%c18%18%21%23%c13%16%28%C19%
248123029-357111113951310188(1) Strongly disagree10%12%12%8%8%11%-6%11%7%7%10%13%d12%5%12%9%5%9%
232102427-328131096897175Don't know10%10%3%6%6%10%np-4%4%8%8%9%9%7%9%8%7%3%8%
142246972561691643276510170604856747513647NET: Agree66%67%67%61%66%65%80%72%67%65%63%64%60%60%63%67%68%64%65%
582054106654141227463131262527287278NET: Disagree24%23%30%33%m27%25%20%24%29%27%29%28%31%33%28%25%25%33%28%
2.992.972.772.802.892.813.162.912.872.822.852.782.752.812.842.942.892.872.85Mean
1.011.020.910.890.890.910.750.810.990.830.870.890.971.000.821.010.900.890.90Standard deviation
0.230.190.110.070.050.060.170.100.150.090.070.090.100.110.100.110.090.160.03Standard error
Page 50
Pensions Policy ResearchOnline Fieldwork: 27/02/2015 to 05/03/2015
Absolutes/col percents
Q10. Agreement that receiving financial advice at retirement should be compulsoryBase: All respondents
Proportions/Means: Columns Tested (5%, 10% risk level) - A/B/C/D/E/F/G/H/I/J/K/L - M/N/O/P/Q/R* small base; ** very small base (under 30) ineligible for sig testing

Compulsory advice atComfort with managing ownPlan to use pensionResponsibility for financialretirementpensionfunds pre-retirementTrust in parties re. pensionsRetire in next yeardecisions
NET:NET:NET:NET:NET:NotDisagreeNET: AgreeUncomfortableComfortableNoYesOtherLDLabourConservativeUnlikelyLikelyat allJointSoleTotal
(O)(N)(M)(L)(K)(J)(I)(H)(G)(F)(E)(D)(C)(B)(A)
28164734457759913713432164291686250164455391000Unweighted base
27864734557460013313131*16028868525117**4485351000Weighted base
-22910211313433336347216261194134229(4) Strongly agree-35%O30%L20%22%25%25%18%21%25%24%24%7%21%25%23%
-4181532362504955127211829110211196211418(3) Tend to agree-65%O44%41%42%37%42%38%45%41%42%41%63%44%39%42%
190-531251222826730631205948898190(2) Tend to disagree68%N-15%22%M20%21%20%21%18%22%17%24%E24%20%18%19%
88-186557177517235920-385088(1) Strongly disagree32%N-5%11%M10%12%6%15%i11%8%9%8%-8%9%9%
--19353661028125491324275Don't know--5%6%6%5%7%7%5%4%8%D4%7%7%8%8%
-64725635038582881810519145316212290346647NET: Agree-100%O74%L61%64%62%67%57%66%66%66%65%69%65%65%65%
278-711901794533114686179794126148278NET: Disagree100%N-21%33%M30%34%26%36%29%30%26%31%24%28%28%28%
1.683.35O3.04L2.742.822.772.932.642.802.872.882.842.812.832.872.85Mean
0.470.480.830.930.910.980.860.990.910.900.900.900.560.880.930.90Standard deviation
0.030.020.050.040.040.090.080.180.070.050.040.060.140.040.040.03Standard error
Page 51
Pensions Policy ResearchOnline Fieldwork: 27/02/2015 to 05/03/2015
Absolutes/col percents
Q10. Agreement that receiving financial advice at retirement should be compulsoryBase: All respondents
Proportions/Means: Columns Tested (5%, 10% risk level) - A/B/C - D/E - F/G/H/I - J/K - L/M - N/O* small base; ** very small base (under 30) ineligible for sig testing

Having aguaranteed,
Managing my ownregular incomemoney withoutthat won’t fallany guaranteedin value over
income andHaving somethe course oftaking personallevel ofmy lifetime and
Spending myresponsibilityguaranteed,I will have nopension savingsfor making sureregular incomeresponsibility
as soon as Iit lastsand managingfor managingcan accessthroughout mythe rest of thethe money
them.lifetime.money myself.myself.
1000100010001000Unweighted base
1000100010001000Weighted base
161554742961 - Appeals most2%15%47%30%
3223237729923%23%38%30%
865047128039%50%7%28%
8075019654 - Appeals least81%5%2%7%
59595959Not ranked6%6%6%6%
3.792.481.612.12Mean
0.580.830.710.94Standard deviation
0.020.030.020.03Standard error
Page 52
Pensions Policy ResearchOnline Fieldwork: 27/02/2015 to 05/03/2015
Absolutes/col percents
Q11. Attitudes to managing finances in retirementSUMMARY - GRIDBase: All respondents

Pension planEmploymentAgeGenderWorking
Not workingpart timeWorkingand notNot working(fewer thanfull time
Occupatseekingbut seeking30 hrs a(30+ hrs aNET: NotNET:Both-ionalPersonalworkworkweek)week)workingWorking65+60-6455-59FemaleMaleTotal(N)(M)(L)(K)(J)(I)(H)(G)(F)(E)(D)(C)(B)(A)
201711490104362975631408601612156244895111000Unweighted base
19771048710836*3025531458551612156245304701000Weighted base
55221129206841852627056581831331632961 - Appeals most28%31%l27%19%16%28%Gk34%GiJK18%32%GjK35%27%29%25%35%B30%
6620915635989165442554762190159140299233%30%32%33%25%30%30%31%30%29%29%30%30%30%30%
59197142411692130572234459177159121280330%28%29%38%FH45%FHi31%H24%40%FHi26%27%28%28%30%26%28%
845296-2039659819384422654 - Appeals least4%6%6%6%-7%7%4%7%5%9%6%8%A5%7%
93731551633104961637352459Not ranked5%5%6%5%14%FhIk5%6%7%6%4%7%6%7%5%6%
2.112.102.162.32FH2.34h2.17h2.042.33FH2.092.032.20e2.122.23A2.002.12Mean
0.880.940.910.860.790.940.950.840.950.920.970.930.940.910.94Standard deviation
0.060.040.040.090.140.060.040.070.030.070.070.040.040.040.03Standard error
Page 53
Pensions Policy ResearchOnline Fieldwork: 27/02/2015 to 05/03/2015
Absolutes/col percents
Q11_1. Attitudes to managing finances in retirementHaving a guaranteed, regular income that won’t fall in value over the course of my lifetime and I will have no responsibility for managing the money myself.Base: All respondents
Proportions/Means: Columns Tested (5%, 10% risk level) - A/B - C/D/E - F/G/H/I/J/K - L/M/N* small base

Household incomeRegionLondon
South East(greaterYorkshire£100,000£80,001-£60,001-£40,000-£20,001-NorthernSouth(excludingandEast ofWestEastand theNorthNorth
>£100,000£80,000£60,000£40,000<£20,000IrelandScotlandWalesWestLondon)central)EnglandMidlandsMidlandsHumberWestEastTotal(R)(Q)(P)(O)(N)(M)(L)(K)(J)(I)(H)(G)(F)(E)(D)(C)(B)(A)
21337016538425919704599155107102847798110341000Unweighted base
21**33*68*16138626220**60*40*100*16011010080*90*110*11020*1000Weighted base
71116581227582115314530292718343632961 - Appeals most35%33%24%36%p32%29%42%35%AD37%AD31%ad28%27%29%34%ad20%31%a32%ad15%30%
61218441227471812215233291936293310299229%36%27%27%32%28%37%30%29%21%32%I30%29%24%40%cEI26%30%52%BCEFG30%
HIJK
7725469872413730503033272235273280331%22%37%n29%25%28%21%21%18%30%31%aj27%33%aj34%Ajk24%32%aj25%15%28%
126112320-458574298112654 - Appeals least5%6%9%7%6%8%-7%12%EfH8%eh3%7%4%2%10%eH7%10%EH9%e7%
-1222121-421081055643259Not ranked-3%3%1%5%O8%O-7%5%10%Bc5%9%b5%6%6%4%3%8%6%
2.082.012.32No2.072.062.151.802.002.052.172.102.152.132.052.262.162.132.192.12Mean
0.960.910.960.970.920.960.790.961.051.020.870.930.910.910.910.971.000.850.94Standard deviation
0.210.160.120.080.050.060.180.120.160.110.070.090.090.100.110.100.100.150.03Standard error
Page 54
Pensions Policy ResearchOnline Fieldwork: 27/02/2015 to 05/03/2015
Absolutes/col percents
Q11_1. Attitudes to managing finances in retirementHaving a guaranteed, regular income that won’t fall in value over the course of my lifetime and I will have no responsibility for managing the money myself.Base: All respondents
Proportions/Means: Columns Tested (5%, 10% risk level) - A/B/C/D/E/F/G/H/I/J/K/L - M/N/O/P/Q/R* small base; ** very small base (under 30) ineligible for sig testing

Compulsory advice atComfort with managing ownPlan to use pensionResponsibility for financialretirementpensionfunds pre-retirementTrust in parties re. pensionsRetire in next yeardecisions
NET:NET:NET:NET:NET:NotDisagreeNET: AgreeUncomfortableComfortableNoYesOtherLDLabourConservativeUnlikelyLikelyat allJointSoleTotal
(O)(N)(M)(L)(K)(J)(I)(H)(G)(F)(E)(D)(C)(B)(A)
28164734457759913713432164291686250164455391000Unweighted base
27864734557460013313131*16028868525117**4485351000Weighted base
6622016911420827461161761968631261672961 - Appeals most24%34%O49%L20%35%J21%35%f34%38%F26%29%34%e18%28%31%30%
75204108174180333485293218675128166299227%32%31%30%30%25%26%24%32%32%32%27%31%29%31%30%
100159452151584738113095179782139139280336%N25%13%37%M26%35%K29%G34%g19%33%G26%31%13%31%a26%28%
2930555281942916461533230654 - Appeals least10%N5%1%9%M5%14%K3%7%6%6%7%6%19%7%6%7%
83318162669-894653233359Not ranked3%5%5%l3%4%5%7%f-5%3%7%D2%19%5%6%6%
2.34N2.001.652.38M2.012.46K2.002.141.922.18Gi2.122.092.422.18a2.062.12Mean
0.970.900.770.920.911.000.900.990.920.900.930.951.110.940.920.94Standard deviation
0.060.040.040.040.040.090.080.170.070.050.040.060.310.050.040.03Standard error
Page 55
Pensions Policy ResearchOnline Fieldwork: 27/02/2015 to 05/03/2015
Absolutes/col percents
Q11_1. Attitudes to managing finances in retirementHaving a guaranteed, regular income that won’t fall in value over the course of my lifetime and I will have no responsibility for managing the money myself.Base: All respondents
Proportions/Means: Columns Tested (5%, 10% risk level) - A/B/C - D/E - F/G/H/I - J/K - L/M - N/O* small base; ** very small base (under 30) ineligible for sig testing

Pension planEmploymentAgeGenderWorking
Not workingpart timeWorkingand notNot working(fewer thanfull time
Occupatseekingbut seeking30 hrs a(30+ hrs aNET: NotNET:Both-ionalPersonalworkworkweek)week)workingWorking65+60-6455-59FemaleMaleTotal(N)(M)(L)(K)(J)(I)(H)(G)(F)(E)(D)(C)(B)(A)
201711490104362975631408601612156244895111000Unweighted base
19771048710836*3025531458551612156245304701000Weighted base
9434722158211472487939569973082702044741 - Appeals most48%49%45%53%58%49%45%55%fH46%43%45%49%51%A43%47%
802721853710111220463317280225184194377241%38%38%34%27%37%40%g32%39%45%C37%36%35%41%B38%
10453651244166512164234367135%6%7%5%1%8%7%4%8%8%7%7%6%8%7%
48143-4113151612612194 - Appeals least2%1%3%M3%-1%2%2%2%1%3%2%1%3%b2%
93731551633104961637352459Not ranked5%5%6%5%14%FhIk5%6%7%6%4%7%6%7%5%6%
1.601.581.66m1.551.341.60j1.65GJ1.501.63gJ1.641.661.591.551.68B1.61Mean
0.690.670.760.740.520.710.720.700.710.650.760.710.680.740.71Standard deviation
0.050.030.040.070.090.040.030.060.030.050.050.030.030.030.02Standard error
Page 56
Pensions Policy ResearchOnline Fieldwork: 27/02/2015 to 05/03/2015
Absolutes/col percents
Q11_2. Attitudes to managing finances in retirementHaving some level of guaranteed, regular income and managing the rest of the money myself.Base: All respondents
Proportions/Means: Columns Tested (5%, 10% risk level) - A/B - C/D/E - F/G/H/I/J/K - L/M/N* small base

Household incomeRegionLondon
South East(greaterYorkshire£100,000£80,001-£60,001-£40,000-£20,001-NorthernSouth(excludingandEast ofWestEastand theNorthNorth
>£100,000£80,000£60,000£40,000<£20,000IrelandScotlandWalesWestLondon)central)EnglandMidlandsMidlandsHumberWestEastTotal(R)(Q)(P)(O)(N)(M)(L)(K)(J)(I)(H)(G)(F)(E)(D)(C)(B)(A)
21337016538425919704599155107102847798110341000Unweighted base
21**33*68*16138626220**60*40*100*16011010080*90*110*11020*1000Weighted base
91735751761251129173676554838524655114741 - Appeals most42%52%51%47%45%48%53%48%43%36%48%i50%i48%i47%58%CI42%50%i56%i47%
9142070155926262038593641322451423377243%42%29%43%mP40%p35%31%43%AD50%ADG38%A37%A33%a41%Ad40%Ad27%46%ADg38%A15%38%
21811271921-11121055571047139%3%12%7%7%7%10%1%-11%JK8%jk9%JK5%6%5%6%9%JK18%CDEFhJ7%
K
1-33741-144-113211194 - Appeals least6%-4%2%2%2%6%-2%4%G2%-1%1%4%g2%1%3%Gk2%
-1222121-421081055643259Not ranked-3%3%1%5%O8%O-7%5%10%Bc5%9%b5%6%6%4%3%8%6%
1.781.491.691.631.631.601.681.491.591.81bDeF1.631.551.571.581.521.67k1.601.661.61MeanGhK
0.850.560.870.690.710.720.890.530.620.830.750.670.640.670.780.690.690.940.71Standard deviation
0.190.100.110.050.040.050.210.070.090.090.060.070.070.070.090.070.070.170.02Standard error
Page 57
Pensions Policy ResearchOnline Fieldwork: 27/02/2015 to 05/03/2015
Absolutes/col percents
Q11_2. Attitudes to managing finances in retirementHaving some level of guaranteed, regular income and managing the rest of the money myself.Base: All respondents
Proportions/Means: Columns Tested (5%, 10% risk level) - A/B/C/D/E/F/G/H/I/J/K/L - M/N/O/P/Q/R* small base; ** very small base (under 30) ineligible for sig testing

Compulsory advice atComfort with managing ownPlan to use pensionResponsibility for financialretirementpensionfunds pre-retirementTrust in parties re. pensionsRetire in next yeardecisions
NET:NET:NET:NET:NET:NotDisagreeNET: AgreeUncomfortableComfortableNoYesOtherLDLabourConservativeUnlikelyLikelyat allJointSoleTotal
(O)(N)(M)(L)(K)(J)(I)(H)(G)(F)(E)(D)(C)(B)(A)
28164734457759913713432164291686250164455391000Unweighted base
27864734557460013313131*16028868525117**4485351000Weighted base
1383021333082706155166814933710842242464741 - Appeals most50%47%38%54%M45%46%42%50%43%52%gi49%43%27%50%46%47%
10625117018925642551472972411124165208377238%39%49%L33%43%J32%42%43%45%F34%35%45%E24%37%39%38%
234422484217819265119329397138%7%6%8%7%13%K6%3%6%9%7%7%19%6%7%7%
217213674137972710194 - Appeals least1%3%o1%2%M1%5%K3%3%2%3%1%3%11%2%2%2%
83318162669-894653233359Not ranked3%5%5%l3%4%5%7%f-5%3%7%D2%19%5%6%6%
1.581.641.67l1.581.621.76K1.681.591.651.611.581.69E2.191.571.631.61Mean
0.670.740.620.750.660.880.750.710.690.760.700.731.080.690.710.71Standard deviation
0.040.030.030.030.030.080.070.130.060.050.030.050.300.030.030.02Standard error
Page 58
Pensions Policy ResearchOnline Fieldwork: 27/02/2015 to 05/03/2015
Absolutes/col percents
Q11_2. Attitudes to managing finances in retirementHaving some level of guaranteed, regular income and managing the rest of the money myself.Base: All respondents
Proportions/Means: Columns Tested (5%, 10% risk level) - A/B/C - D/E - F/G/H/I - J/K - L/M - N/O* small base; ** very small base (under 30) ineligible for sig testing

Pension planEmploymentAgeGenderWorking
Not workingpart timeWorkingand notNot working(fewer thanfull time
Occupatseekingbut seeking30 hrs a(30+ hrs aNET: NotNET:Both-ionalPersonalworkworkweek)week)workingWorking65+60-6455-59FemaleMaleTotal(N)(M)(L)(K)(J)(I)(H)(G)(F)(E)(D)(C)(B)(A)
201711490104362975631408601612156244895111000Unweighted base
19771048710836*3025531458551612156245304701000Weighted base
39969722450792612930418484711551 - Appeals most20%M14%20%M20%12%16%14%18%15%19%19%c13%16%15%15%
341689827137411940193325214813498232217%24%n20%25%35%fh25%21%27%23%20%24%24%25%21%23%
10637423643111503005445088102315241263504354%53%48%40%31%50%GJk54%GJK37%53%GJK55%47%50%45%56%B50%
934251131323143554413514504 - Appeals least5%5%5%11%FHI8%4%4%10%FHI4%3%2%6%De7%A3%5%
93731551633104961637352459Not ranked5%5%6%5%14%FhIk5%6%7%6%4%7%6%7%5%6%
2.462.51l2.412.432.412.442.512.422.492.442.352.53D2.462.502.48Mean
0.870.800.880.950.860.830.800.920.810.840.830.820.860.790.83Standard deviation
0.060.030.040.100.150.050.030.080.030.070.060.030.040.040.03Standard error
Page 59
Pensions Policy ResearchOnline Fieldwork: 27/02/2015 to 05/03/2015
Absolutes/col percents
Q11_3. Attitudes to managing finances in retirementManaging my own money without any guaranteed income and taking personal responsibility for making sure it lasts throughout my lifetime.Base: All respondents
Proportions/Means: Columns Tested (5%, 10% risk level) - A/B - C/D/E - F/G/H/I/J/K - L/M/N* small base

Household incomeRegionLondon
South East(greaterYorkshire£100,000£80,001-£60,001-£40,000-£20,001-NorthernSouth(excludingandEast ofWestEastand theNorthNorth
>£100,000£80,000£60,000£40,000<£20,000IrelandScotlandWalesWestLondon)central)EnglandMidlandsMidlandsHumberWestEastTotal(R)(Q)(P)(O)(N)(M)(L)(K)(J)(I)(H)(G)(F)(E)(D)(C)(B)(A)
21337016538425919704599155107102847798110341000Unweighted base
21**33*68*16138626220**60*40*100*16011010080*90*110*11020*1000Weighted base
541223653316620291516912231441551 - Appeals most23%12%17%14%17%13%5%10%16%20%k18%k13%16%12%13%21%k13%18%15%
5625427567512624363025192221284232223%18%36%mNq26%n19%26%n26%20%14%24%22%28%j25%24%24%19%26%18%23%
11213090205119133425427754493949545910504354%63%mp43%56%Mp53%m46%63%56%i61%I42%48%49%49%48%54%49%54%i49%50%
-1-420201423101581851504 - Appeals least-3%-2%5%p8%OP6%7%dG4%3%6%G1%5%g9%DGi1%7%dG5%g6%G5%
-1222121-421081055643259Not ranked-3%3%1%5%O8%O-7%5%10%Bc5%9%b5%6%6%4%3%8%6%
2.312.59p2.272.47p2.49P2.53P2.702.66GhI2.582.322.442.412.462.59I2.472.452.52i2.482.48Mean
0.840.750.750.770.850.840.670.770.830.870.880.750.830.840.760.920.790.910.83Standard deviation
0.180.130.090.060.040.050.150.100.130.090.070.080.080.090.090.090.080.160.03Standard error
Page 60
Pensions Policy ResearchOnline Fieldwork: 27/02/2015 to 05/03/2015
Absolutes/col percents
Q11_3. Attitudes to managing finances in retirementManaging my own money without any guaranteed income and taking personal responsibility for making sure it lasts throughout my lifetime.Base: All respondents
Proportions/Means: Columns Tested (5%, 10% risk level) - A/B/C/D/E/F/G/H/I/J/K/L - M/N/O/P/Q/R* small base; ** very small base (under 30) ineligible for sig testing

Compulsory advice atComfort with managing ownPlan to use pensionResponsibility for financialretirementpensionfunds pre-retirementTrust in parties re. pensionsRetire in next yeardecisions
NET:NET:NET:NET:NET:NotDisagreeNET: AgreeUncomfortableComfortableNoYesOtherLDLabourConservativeUnlikelyLikelyat allJointSoleTotal
(O)(N)(M)(L)(K)(J)(I)(H)(G)(F)(E)(D)(C)(B)(A)
28164734457759913713432164291686250164455391000Unweighted base
27864734557460013313131*16028868525117**4485351000Weighted base
598323123932919421509844569811551 - Appeals most21%N13%7%22%M15%21%k15%13%13%17%14%18%31%15%15%15%
8113639173127402682784159572119111232229%N21%11%30%M21%30%K20%25%17%29%GI23%23%13%27%A21%23%
119359237243334486718991363481346214284504343%55%O69%L42%56%J36%51%59%62%Fi47%51%54%38%48%53%50%
1136291819101016103311-2228504 - Appeals least4%6%8%L3%3%7%K8%F3%4%3%5%4%-5%5%5%
83318162669-894653233359Not ranked3%5%5%l3%4%5%7%f-5%3%7%D2%19%5%6%6%
2.302.57O2.83L2.282.49J2.312.56F2.532.59F2.382.492.452.092.452.512.48Mean
0.860.800.680.840.800.910.860.770.780.820.810.830.950.820.830.83Standard deviation
0.050.030.040.040.030.080.080.140.060.050.030.050.260.040.040.03Standard error
Page 61
Pensions Policy ResearchOnline Fieldwork: 27/02/2015 to 05/03/2015
Absolutes/col percents
Q11_3. Attitudes to managing finances in retirementManaging my own money without any guaranteed income and taking personal responsibility for making sure it lasts throughout my lifetime.Base: All respondents
Proportions/Means: Columns Tested (5%, 10% risk level) - A/B/C - D/E - F/G/H/I - J/K - L/M - N/O* small base; ** very small base (under 30) ineligible for sig testing

Pension planEmploymentAgeGenderWorking
Not workingpart timeWorkingand notNot working(fewer thanfull time
Occupatseekingbut seeking30 hrs a(30+ hrs aNET: NotNET:Both-ionalPersonalworkworkweek)week)workingWorking65+60-6455-59FemaleMaleTotal(N)(M)(L)(K)(J)(I)(H)(G)(F)(E)(D)(C)(B)(A)
201711490104362975631408601612156244895111000Unweighted base
19771048710836*3025531458551612156245304701000Weighted base
1893-58313-41279161 - Appeals most*1%2%3%-2%1%2%2%-2%e2%e1%2%2%
823174-1216428342518143224%3%4%4%-4%3%3%3%2%2%4%3%3%3%
1256421432049176911225360268636%8%9%13%i8%7%9%12%i8%7%10%9%11%A5%9%
16758638882282494481106971411694974093988074 - Appeals least85%83%80%76%78%82%81%76%81%88%CD79%80%77%85%B81%
93731551633104961637352459Not ranked5%5%6%5%14%FhIk5%6%7%6%4%7%6%7%5%6%
3.843.813.773.703.903.793.803.753.803.89Cd3.793.763.763.823.79Mean
0.500.540.610.690.300.600.560.620.570.370.570.630.590.570.58Standard deviation
0.040.020.030.070.050.040.020.050.020.030.040.030.030.030.02Standard error
Page 62
Pensions Policy ResearchOnline Fieldwork: 27/02/2015 to 05/03/2015
Absolutes/col percents
Q11_4. Attitudes to managing finances in retirementSpending my pension savings as soon as I can access them.Base: All respondents
Proportions/Means: Columns Tested (5%, 10% risk level) - A/B - C/D/E - F/G/H/I/J/K - L/M/N* small base

Household incomeRegionLondon
South East(greaterYorkshire£100,000£80,001-£60,001-£40,000-£20,001-NorthernSouth(excludingandEast ofWestEastand theNorthNorth
>£100,000£80,000£60,000£40,000<£20,000IrelandScotlandWalesWestLondon)central)EnglandMidlandsMidlandsHumberWestEastTotal(R)(Q)(P)(O)(N)(M)(L)(K)(J)(I)(H)(G)(F)(E)(D)(C)(B)(A)
21337016538425919704599155107102847798110341000Unweighted base
21**33*68*16138626220**60*40*100*16011010080*90*110*11020*1000Weighted base
--3327---211212331161 - Appeals most--5%N2%1%3%N---2%1%1%2%1%3%3%3%3%k2%
1-331481-1751-525413226%-5%2%4%3%6%-2%7%FGK3%f1%-6%FGK2%4%F4%f6%FGK3%
1331235301976136859101028635%9%5%7%9%11%p6%14%eGi16%eGhi6%8%5%8%6%10%10%10%9%9%
18295714131419618473174133928565718790158074 - Appeals least89%88%83%88%Mn81%M75%88%79%77%74%83%i84%i85%i81%79%79%82%73%81%
-1222121-421081055643259Not ranked-3%3%1%5%O8%O-7%5%10%Bc5%9%b5%6%6%4%3%8%6%
3.833.913.713.84m3.81m3.723.833.85a3.793.703.833.89AbCI3.85ai3.773.763.723.753.663.79Mean
0.510.290.770.530.510.660.520.360.470.710.510.430.500.610.640.690.650.770.58Standard deviation
0.110.050.090.040.030.040.120.050.070.080.040.040.050.070.080.070.060.140.02Standard error
Page 63
Pensions Policy ResearchOnline Fieldwork: 27/02/2015 to 05/03/2015
Absolutes/col percents
Q11_4. Attitudes to managing finances in retirementSpending my pension savings as soon as I can access them.Base: All respondents
Proportions/Means: Columns Tested (5%, 10% risk level) - A/B/C/D/E/F/G/H/I/J/K/L - M/N/O/P/Q/R* small base; ** very small base (under 30) ineligible for sig testing

Compulsory advice atComfort with managing ownPlan to use pensionResponsibility for financialretirementpensionfunds pre-retirementTrust in parties re. pensionsRetire in next yeardecisions
NET:NET:NET:NET:NET:NotDisagreeNET: AgreeUncomfortableComfortableNoYesOtherLDLabourConservativeUnlikelyLikelyat allJointSoleTotal
(O)(N)(M)(L)(K)(J)(I)(H)(G)(F)(E)(D)(C)(B)(A)
28164734457759913713432164291686250164455391000Unweighted base
27864734557460013313131*16028868525117**4485351000Weighted base
69312210212587169161 - Appeals most2%1%1%2%*8%K2%3%1%2%1%3%e6%1%2%2%
823922111172262110212183223%4%3%4%2%8%K6%fg7%fg2%2%3%4%13%3%3%3%
28512352401591142260152434186310%8%7%9%7%11%k7%3%9%8%9%6%11%10%8%9%
228530291472521911032713424655021393644358074 - Appeals least82%82%84%82%87%J68%79%87%84%85%80%85%e51%81%81%81%
83318162669-894653233359Not ranked3%5%5%l3%4%5%7%f-5%3%7%D2%19%5%6%6%
3.773.803.84L3.763.88J3.473.753.743.843.823.803.773.313.803.793.79Mean
0.600.570.490.630.410.960.650.730.500.540.540.671.040.550.580.58Standard deviation
0.040.020.030.030.020.080.060.130.040.030.020.040.290.030.030.02Standard error
Page 64
Pensions Policy ResearchOnline Fieldwork: 27/02/2015 to 05/03/2015
Absolutes/col percents
Q11_4. Attitudes to managing finances in retirementSpending my pension savings as soon as I can access them.Base: All respondents
Proportions/Means: Columns Tested (5%, 10% risk level) - A/B/C - D/E - F/G/H/I - J/K - L/M - N/O* small base; ** very small base (under 30) ineligible for sig testing

Pension planEmploymentAgeGenderWorking
Not workingpart timeWorkingand notNot working(fewer thanfull time
Occupatseekingbut seeking30 hrs a(30+ hrs aNET: NotNET:Both-ionalPersonalworkworkweek)week)workingWorking65+60-6455-59FemaleMaleTotal(N)(M)(L)(K)(J)(I)(H)(G)(F)(E)(D)(C)(B)(A)
201711490104362975631408601612156244895111000Unweighted base
19771048710836*3025531458551612156245304701000Weighted base
256268131326013922325574065105(4) Very comfortable12%9%14%M12%3%10%11%9%11%15%C12%9%8%14%B11%
8732423245181442626340672105292241228469(3) Fairly comfortable44%46%48%41%51%48%47%44%47%45%49%47%46%48%47%
54188111271077131372084544157138107246(2) Not very27%27%23%25%27%26%24%26%24%28%21%25%26%23%25%comfortable
177641112266113871516695445100(1) Not at all9%11%8%10%5%9%11%9%10%9%8%11%10%10%10%comfortable
1560351352439186362450562581Don't know7%8%7%12%fh14%8%7%13%FH7%4%11%E8%e11%A5%8%
11238630057191753227649895130349282292574NET: Comfortable57%54%61%M53%53%58%58%53%58%59%60%56%53%62%B57%
712641523812103192502955961225193153345NET: Uncomfortable36%37%L31%35%32%34%35%35%35%37%d28%36%D36%32%35%
2.652.572.72M2.622.592.652.632.612.632.672.73C2.592.562.70B2.63Mean
0.830.820.830.860.660.800.840.810.830.850.800.830.800.840.82Standard deviation
0.060.030.040.090.120.050.040.070.030.070.060.030.040.040.03Standard error
Page 65
Pensions Policy ResearchOnline Fieldwork: 27/02/2015 to 05/03/2015
Absolutes/col percents
Q12. Comfort of managing pension in retirementBase: All respondents
Proportions/Means: Columns Tested (5%, 10% risk level) - A/B - C/D/E - F/G/H/I/J/K - L/M/N* small base
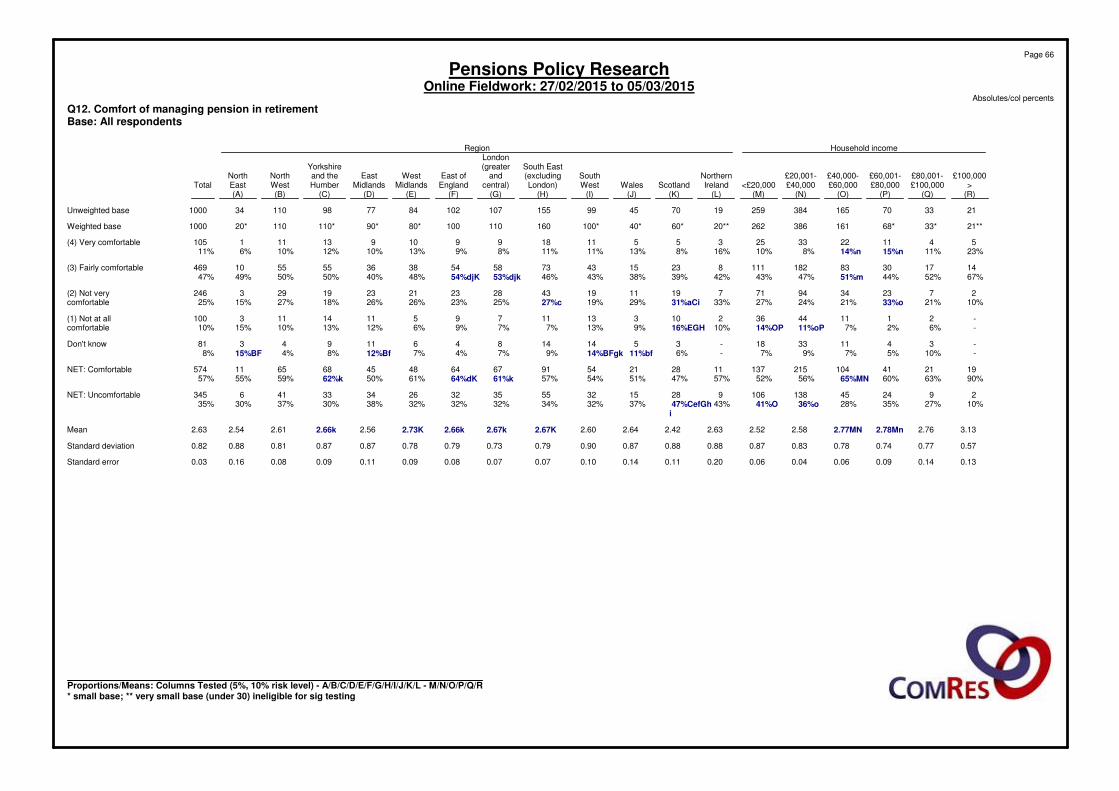
Household incomeRegionLondon
South East(greaterYorkshire£100,000£80,001-£60,001-£40,000-£20,001-NorthernSouth(excludingandEast ofWestEastand theNorthNorth
>£100,000£80,000£60,000£40,000<£20,000IrelandScotlandWalesWestLondon)central)EnglandMidlandsMidlandsHumberWestEastTotal(R)(Q)(P)(O)(N)(M)(L)(K)(J)(I)(H)(G)(F)(E)(D)(C)(B)(A)
21337016538425919704599155107102847798110341000Unweighted base
21**33*68*16138626220**60*40*100*16011010080*90*110*11020*1000Weighted base
541122332535511189910913111105(4) Very comfortable23%11%15%n14%n8%10%16%8%13%11%11%8%9%13%10%12%10%6%11%
1417308318211182315437358543836555510469(3) Fairly comfortable67%52%44%51%m47%43%42%39%38%43%46%53%djk54%djK48%40%50%50%49%47%
27233494717191119432823212319293246(2) Not very10%21%33%o21%24%27%33%31%aCi29%19%27%c25%23%26%26%18%27%15%25%comfortable
-21114436210313117951114113100(1) Not at all-6%2%7%11%oP14%OP10%16%EGH9%13%7%7%9%6%12%13%10%15%10%comfortable
-34113318-3514148461194381Don't know-10%5%7%9%7%-6%11%bf14%BFgk9%7%4%7%12%Bf8%4%15%BF8%
192141104215137112821549167644845686511574NET: Comfortable90%63%60%65%MN56%52%57%47%51%54%57%61%k64%dK61%50%62%k59%55%57%
2924451381069281532553532263433416345NET: Uncomfortable10%27%35%28%36%o41%O43%47%CefGh37%32%34%32%32%32%38%30%37%30%35%
i
3.132.762.78Mn2.77MN2.582.522.632.422.642.602.67K2.67k2.66k2.73K2.562.66k2.612.542.63Mean
0.570.770.740.780.830.870.880.880.870.900.790.730.790.780.870.870.810.880.82Standard deviation
0.130.140.090.060.040.060.200.110.140.100.070.070.080.090.110.090.080.160.03Standard error
Page 66
Pensions Policy ResearchOnline Fieldwork: 27/02/2015 to 05/03/2015
Absolutes/col percents
Q12. Comfort of managing pension in retirementBase: All respondents
Proportions/Means: Columns Tested (5%, 10% risk level) - A/B/C/D/E/F/G/H/I/J/K/L - M/N/O/P/Q/R* small base; ** very small base (under 30) ineligible for sig testing
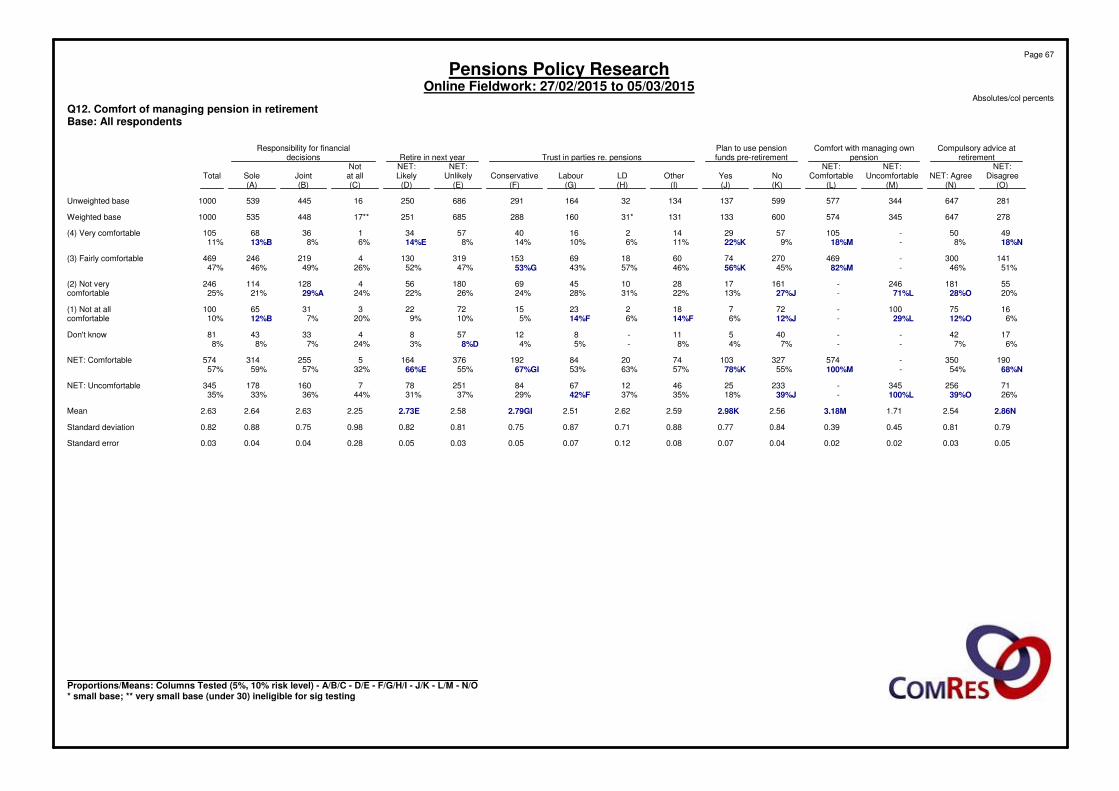
Compulsory advice atComfort with managing ownPlan to use pensionResponsibility for financialretirementpensionfunds pre-retirementTrust in parties re. pensionsRetire in next yeardecisions
NET:NET:NET:NET:NET:NotDisagreeNET: AgreeUncomfortableComfortableNoYesOtherLDLabourConservativeUnlikelyLikelyat allJointSoleTotal
(O)(N)(M)(L)(K)(J)(I)(H)(G)(F)(E)(D)(C)(B)(A)
28164734457759913713432164291686250164455391000Unweighted base
27864734557460013313131*16028868525117**4485351000Weighted base
4950-10557291421640573413668105(4) Very comfortable18%N8%-18%M9%22%K11%6%10%14%8%14%E6%8%13%B11%
141300-469270746018691533191304219246469(3) Fairly comfortable51%46%-82%M45%56%K46%57%43%53%G47%52%26%49%46%47%
55181246-1611728104569180564128114246(2) Not very20%28%O71%L-27%J13%22%31%28%24%26%22%24%29%A21%25%comfortable
1675100-7271822315722233165100(1) Not at all6%12%O29%L-12%J6%14%F6%14%F5%10%9%20%7%12%B10%comfortable
1742--40511-8125784334381Don't know6%7%--7%4%8%-5%4%8%D3%24%7%8%8%
190350-5743271037420841923761645255314574NET: Comfortable68%N54%-100%M55%78%K57%63%53%67%GI55%66%E32%57%59%57%
71256345-2332546126784251787160178345NET: Uncomfortable26%39%O100%L-39%J18%35%37%42%F29%37%31%44%36%33%35%
2.86N2.541.713.18M2.562.98K2.592.622.512.79GI2.582.73E2.252.632.642.63Mean
0.790.810.450.390.840.770.880.710.870.750.810.820.980.750.880.82Standard deviation
0.050.030.020.020.040.070.080.120.070.050.030.050.280.040.040.03Standard error
Page 67
Pensions Policy ResearchOnline Fieldwork: 27/02/2015 to 05/03/2015
Absolutes/col percents
Q12. Comfort of managing pension in retirementBase: All respondents
Proportions/Means: Columns Tested (5%, 10% risk level) - A/B/C - D/E - F/G/H/I - J/K - L/M - N/O* small base; ** very small base (under 30) ineligible for sig testing

Page 1
Page Table Title Base Description Base
� 1 QA. Gender Base: All respondents 1000
� 2 QA. Gender Base: All respondents 1000
� 3 QA. Gender Base: All respondents 1000
� 4 QB. Age Base: All respondents 1000
� 5 QB. Age Base: All respondents 1000
� 6 QB. Age Base: All respondents 1000
� 7 QC. Employment Base: All respondents 1000
� 8 QC. Employment Base: All respondents 1000
� 9 QC. Employment Base: All respondents 1000
� 10 QD. Pension status Base: All respondents 1000
� 11 QD. Pension status Base: All respondents 1000
� 12 QD. Pension status Base: All respondents 1000
� 13 QE. Region Base: All respondents 1000
� 14 QE. Region Base: All respondents 1000
� 15 QE. Region Base: All respondents 1000
� 16 QF. Household income Base: All respondents 1000
� 17 QF. Household income Base: All respondents 1000
� 18 QF. Household income Base: All respondents 1000
� 19 QG. Responsibility for financial decisions Base: All respondents 1000
� 20 QG. Responsibility for financial decisions Base: All respondents 1000
� 21 QG. Responsibility for financial decisions Base: All respondents 1000
� 22 Q1. Trust in political parties to deliver fair pension system Base: All respondents 1000
� 23 Q1. Trust in political parties to deliver fair pension system Base: All respondents 1000

Page 2
Page Table Title Base Description Base
� 24 Q1. Trust in political parties to deliver fair pension system Base: All respondents 1000
� 25 Q2. Likelihood of retirement in the next year Base: All respondents 1000
� 26 Q2. Likelihood of retirement in the next year Base: All respondents 1000
� 27 Q2. Likelihood of retirement in the next year Base: All respondents 1000
� 28 Q3. Plan to use the new freedoms to withdraw cash from pension above the 25% tax-free allowance Base: All respondents 1000
� 29 Q3. Plan to use the new freedoms to withdraw cash from pension above the 25% tax-free allowance Base: All respondents 1000
� 30 Q3. Plan to use the new freedoms to withdraw cash from pension above the 25% tax-free allowance Base: All respondents 1000
� 31 Q4. Reasons for using new freedoms to draw cash from their pension above the tax-free allowance Base: All respondents planning to use new freedoms todraw cash from their pension above the tax-free allowance
137
32 Q4. Reasons for using new freedoms to draw cash from their pension above the tax-free allowance Base: All respondents planning to use new freedoms todraw cash from their pension above the tax-free allowance
137
� 33 Q4. Reasons for using new freedoms to draw cash from their pension above the tax-free allowance Base: All respondents planning to use new freedoms todraw cash from their pension above the tax-free allowance
137
� 34 Q5. Understanding of tax implications Base: All respondents planning to use new freedoms todraw cash from their pension above the tax-free allowance
137
35 Q5. Understanding of tax implications Base: All respondents planning to use new freedoms todraw cash from their pension above the tax-free allowance
137
� 36 Q5. Understanding of tax implications Base: All respondents planning to use new freedoms todraw cash from their pension above the tax-free allowance
137
� 37 Q6. Reasons for NOT using new freedoms to draw cash from their pension above the tax-free allowance Base: All respondents NOT planning to use new freedoms to draw cash from their pension above the tax-free allowance
599
� 38 Q6. Reasons for NOT using new freedoms to draw cash from their pension above the tax-free allowance Base: All respondents NOT planning to use new freedoms to draw cash from their pension above the tax-free allowance
599

Page 3
Page Table Title Base Description Base
� 39 Q6. Reasons for NOT using new freedoms to draw cash from their pension above the tax-free allowance Base: All respondents NOT planning to use new freedoms to draw cash from their pension above the tax-free allowance
599
� 40 Q7. Likelihood of saving more money into pension Base: All respondents 1000
� 41 Q7. Likelihood of saving more money into pension Base: All respondents 1000
� 42 Q7. Likelihood of saving more money into pension Base: All respondents 1000
� 43 Q8. Awareness of Pension Wise Base: All respondents 1000
� 44 Q8. Awareness of Pension Wise Base: All respondents 1000
� 45 Q8. Awareness of Pension Wise Base: All respondents 1000
� 46 Q9. Likelihood of using Pension Wise service Base: All respondents 1000
� 47 Q9. Likelihood of using Pension Wise service Base: All respondents 1000
� 48 Q9. Likelihood of using Pension Wise service Base: All respondents 1000
� 49 Q10. Agreement that receiving financial advice at retirement should be compulsory Base: All respondents 1000
� 50 Q10. Agreement that receiving financial advice at retirement should be compulsory Base: All respondents 1000
� 51 Q10. Agreement that receiving financial advice at retirement should be compulsory Base: All respondents 1000
52 Q11. Attitudes to managing finances in retirement SUMMARY - GRID
Base: All respondents 1000
� 53 Q11_1. Attitudes to managing finances in retirement Having a guaranteed, regular income that won’t fall in value over the course of my lifetime and I will haveno responsibility for managing the money myself.
Base: All respondents 1000
� 54 Q11_1. Attitudes to managing finances in retirement Having a guaranteed, regular income that won’t fall in value over the course of my lifetime and I will haveno responsibility for managing the money myself.
Base: All respondents 1000
� 55 Q11_1. Attitudes to managing finances in retirement Having a guaranteed, regular income that won’t fall in value over the course of my lifetime and I will haveno responsibility for managing the money myself.
Base: All respondents 1000
� 56 Q11_2. Attitudes to managing finances in retirement Having some level of guaranteed, regular income and managing the rest of the money myself.
Base: All respondents 1000
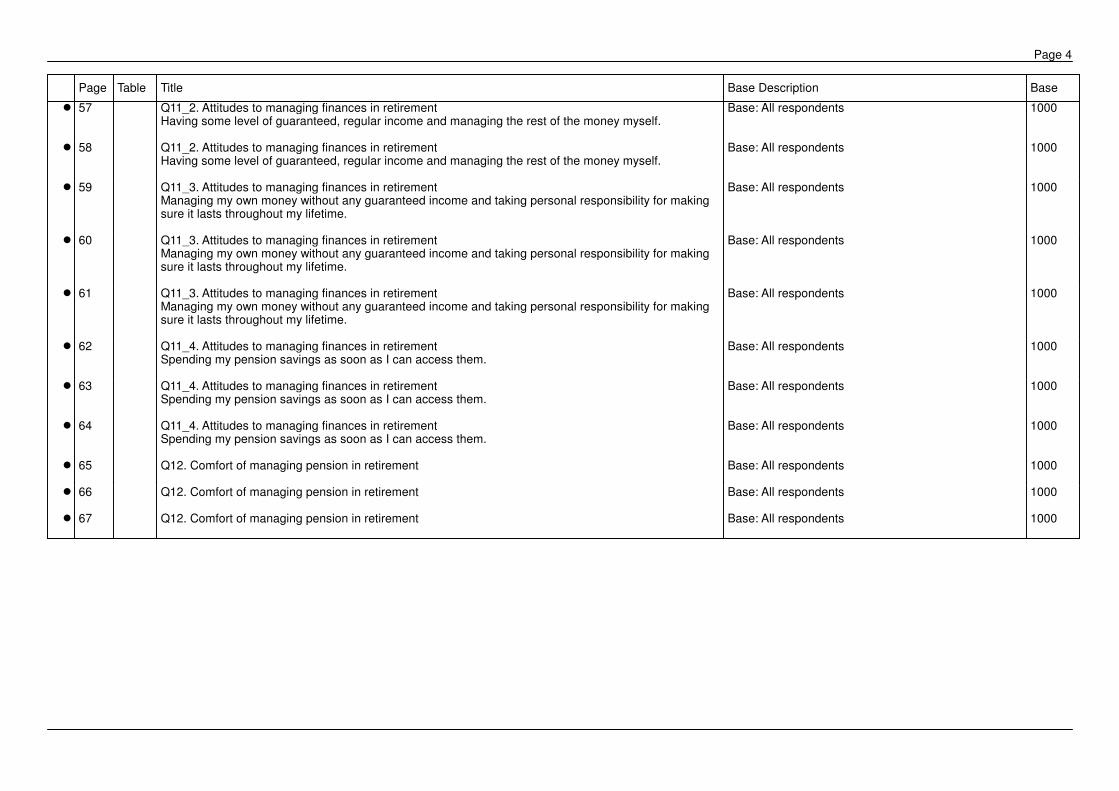
Page 4
Page Table Title Base Description Base
� 57 Q11_2. Attitudes to managing finances in retirement Having some level of guaranteed, regular income and managing the rest of the money myself.
Base: All respondents 1000
� 58 Q11_2. Attitudes to managing finances in retirement Having some level of guaranteed, regular income and managing the rest of the money myself.
Base: All respondents 1000
� 59 Q11_3. Attitudes to managing finances in retirement Managing my own money without any guaranteed income and taking personal responsibility for making sure it lasts throughout my lifetime.
Base: All respondents 1000
� 60 Q11_3. Attitudes to managing finances in retirement Managing my own money without any guaranteed income and taking personal responsibility for making sure it lasts throughout my lifetime.
Base: All respondents 1000
� 61 Q11_3. Attitudes to managing finances in retirement Managing my own money without any guaranteed income and taking personal responsibility for making sure it lasts throughout my lifetime.
Base: All respondents 1000
� 62 Q11_4. Attitudes to managing finances in retirement Spending my pension savings as soon as I can access them.
Base: All respondents 1000
� 63 Q11_4. Attitudes to managing finances in retirement Spending my pension savings as soon as I can access them.
Base: All respondents 1000
� 64 Q11_4. Attitudes to managing finances in retirement Spending my pension savings as soon as I can access them.
Base: All respondents 1000
� 65 Q12. Comfort of managing pension in retirement Base: All respondents 1000
� 66 Q12. Comfort of managing pension in retirement Base: All respondents 1000
� 67 Q12. Comfort of managing pension in retirement Base: All respondents 1000